

Assessing the Levels of Robusta and Arabica in Roasted Ground Coffee Using NIR Hyperspectral Imaging and FTIR Spectroscopy

Abstract
1. Introduction
2. Materials and Methods
2.1. Sample Preparation
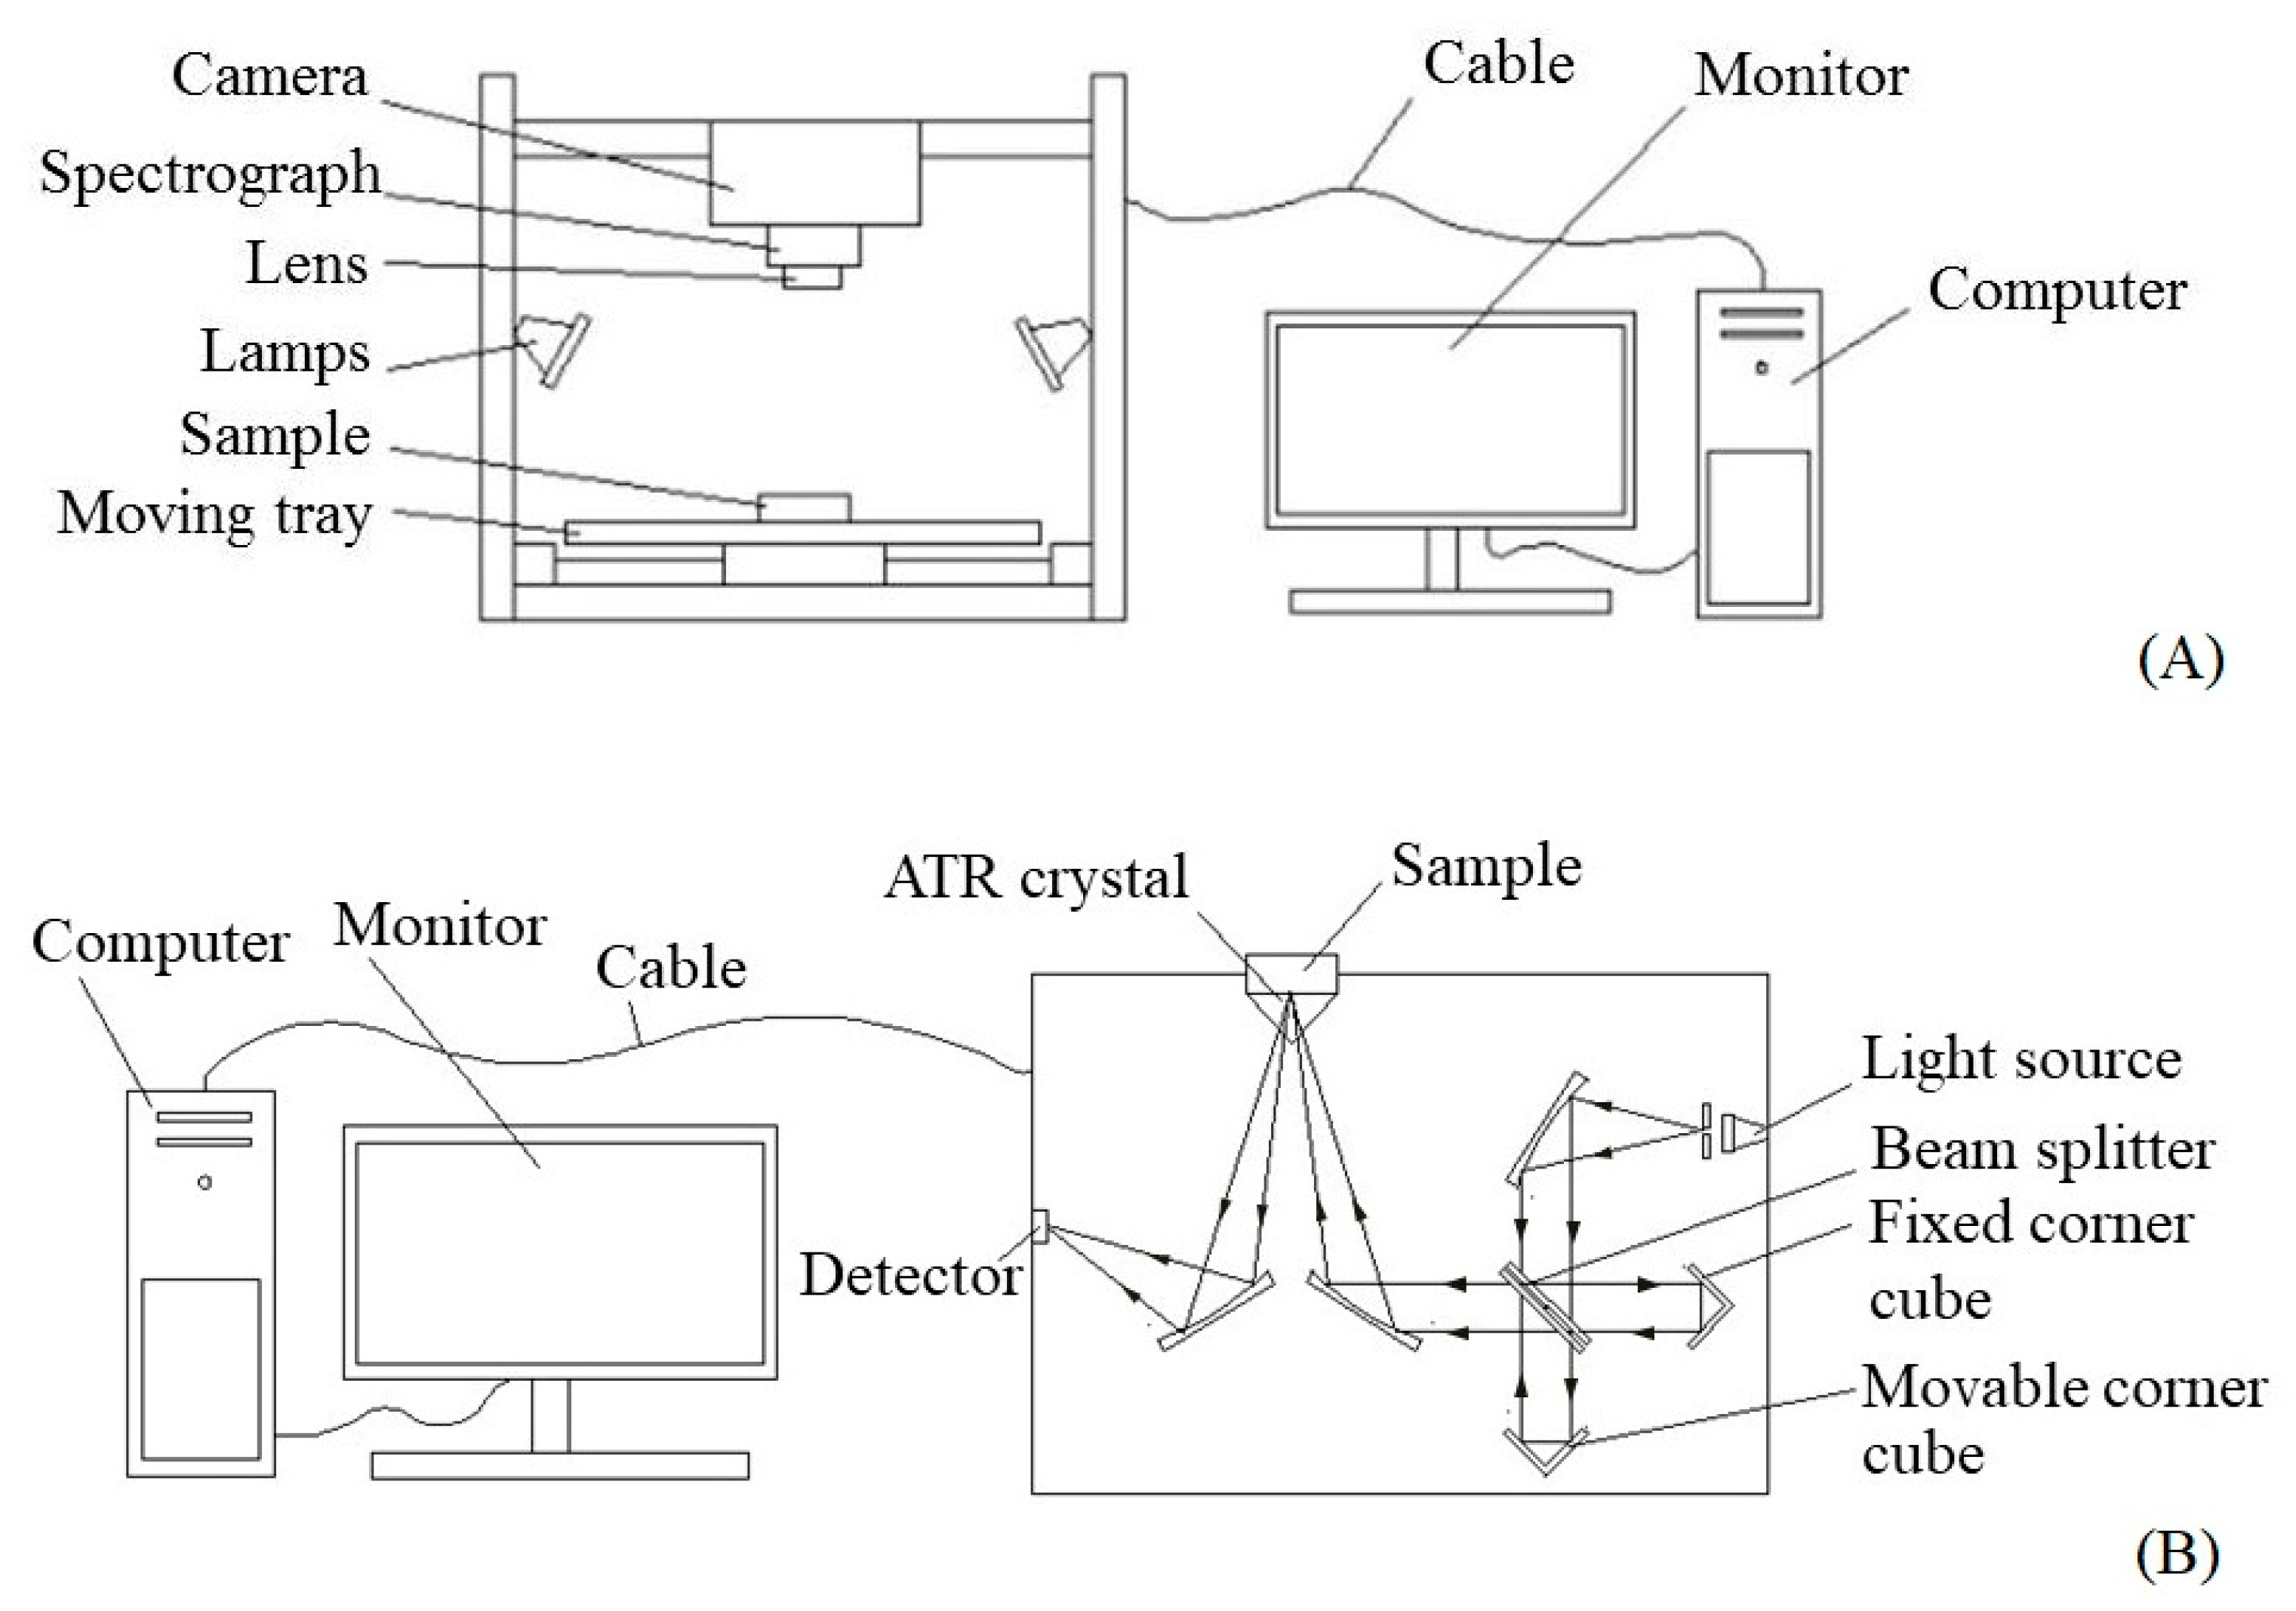
2.2. NIR-HSI and FTIRs Data Acquisition
2.3. Principal Component Analysis (PCA)
2.4. Support Vector Machine (SVM)
3. Results and Discussion
3.1. Average Spectra Obtained from the NIR-HSI and FTIRs
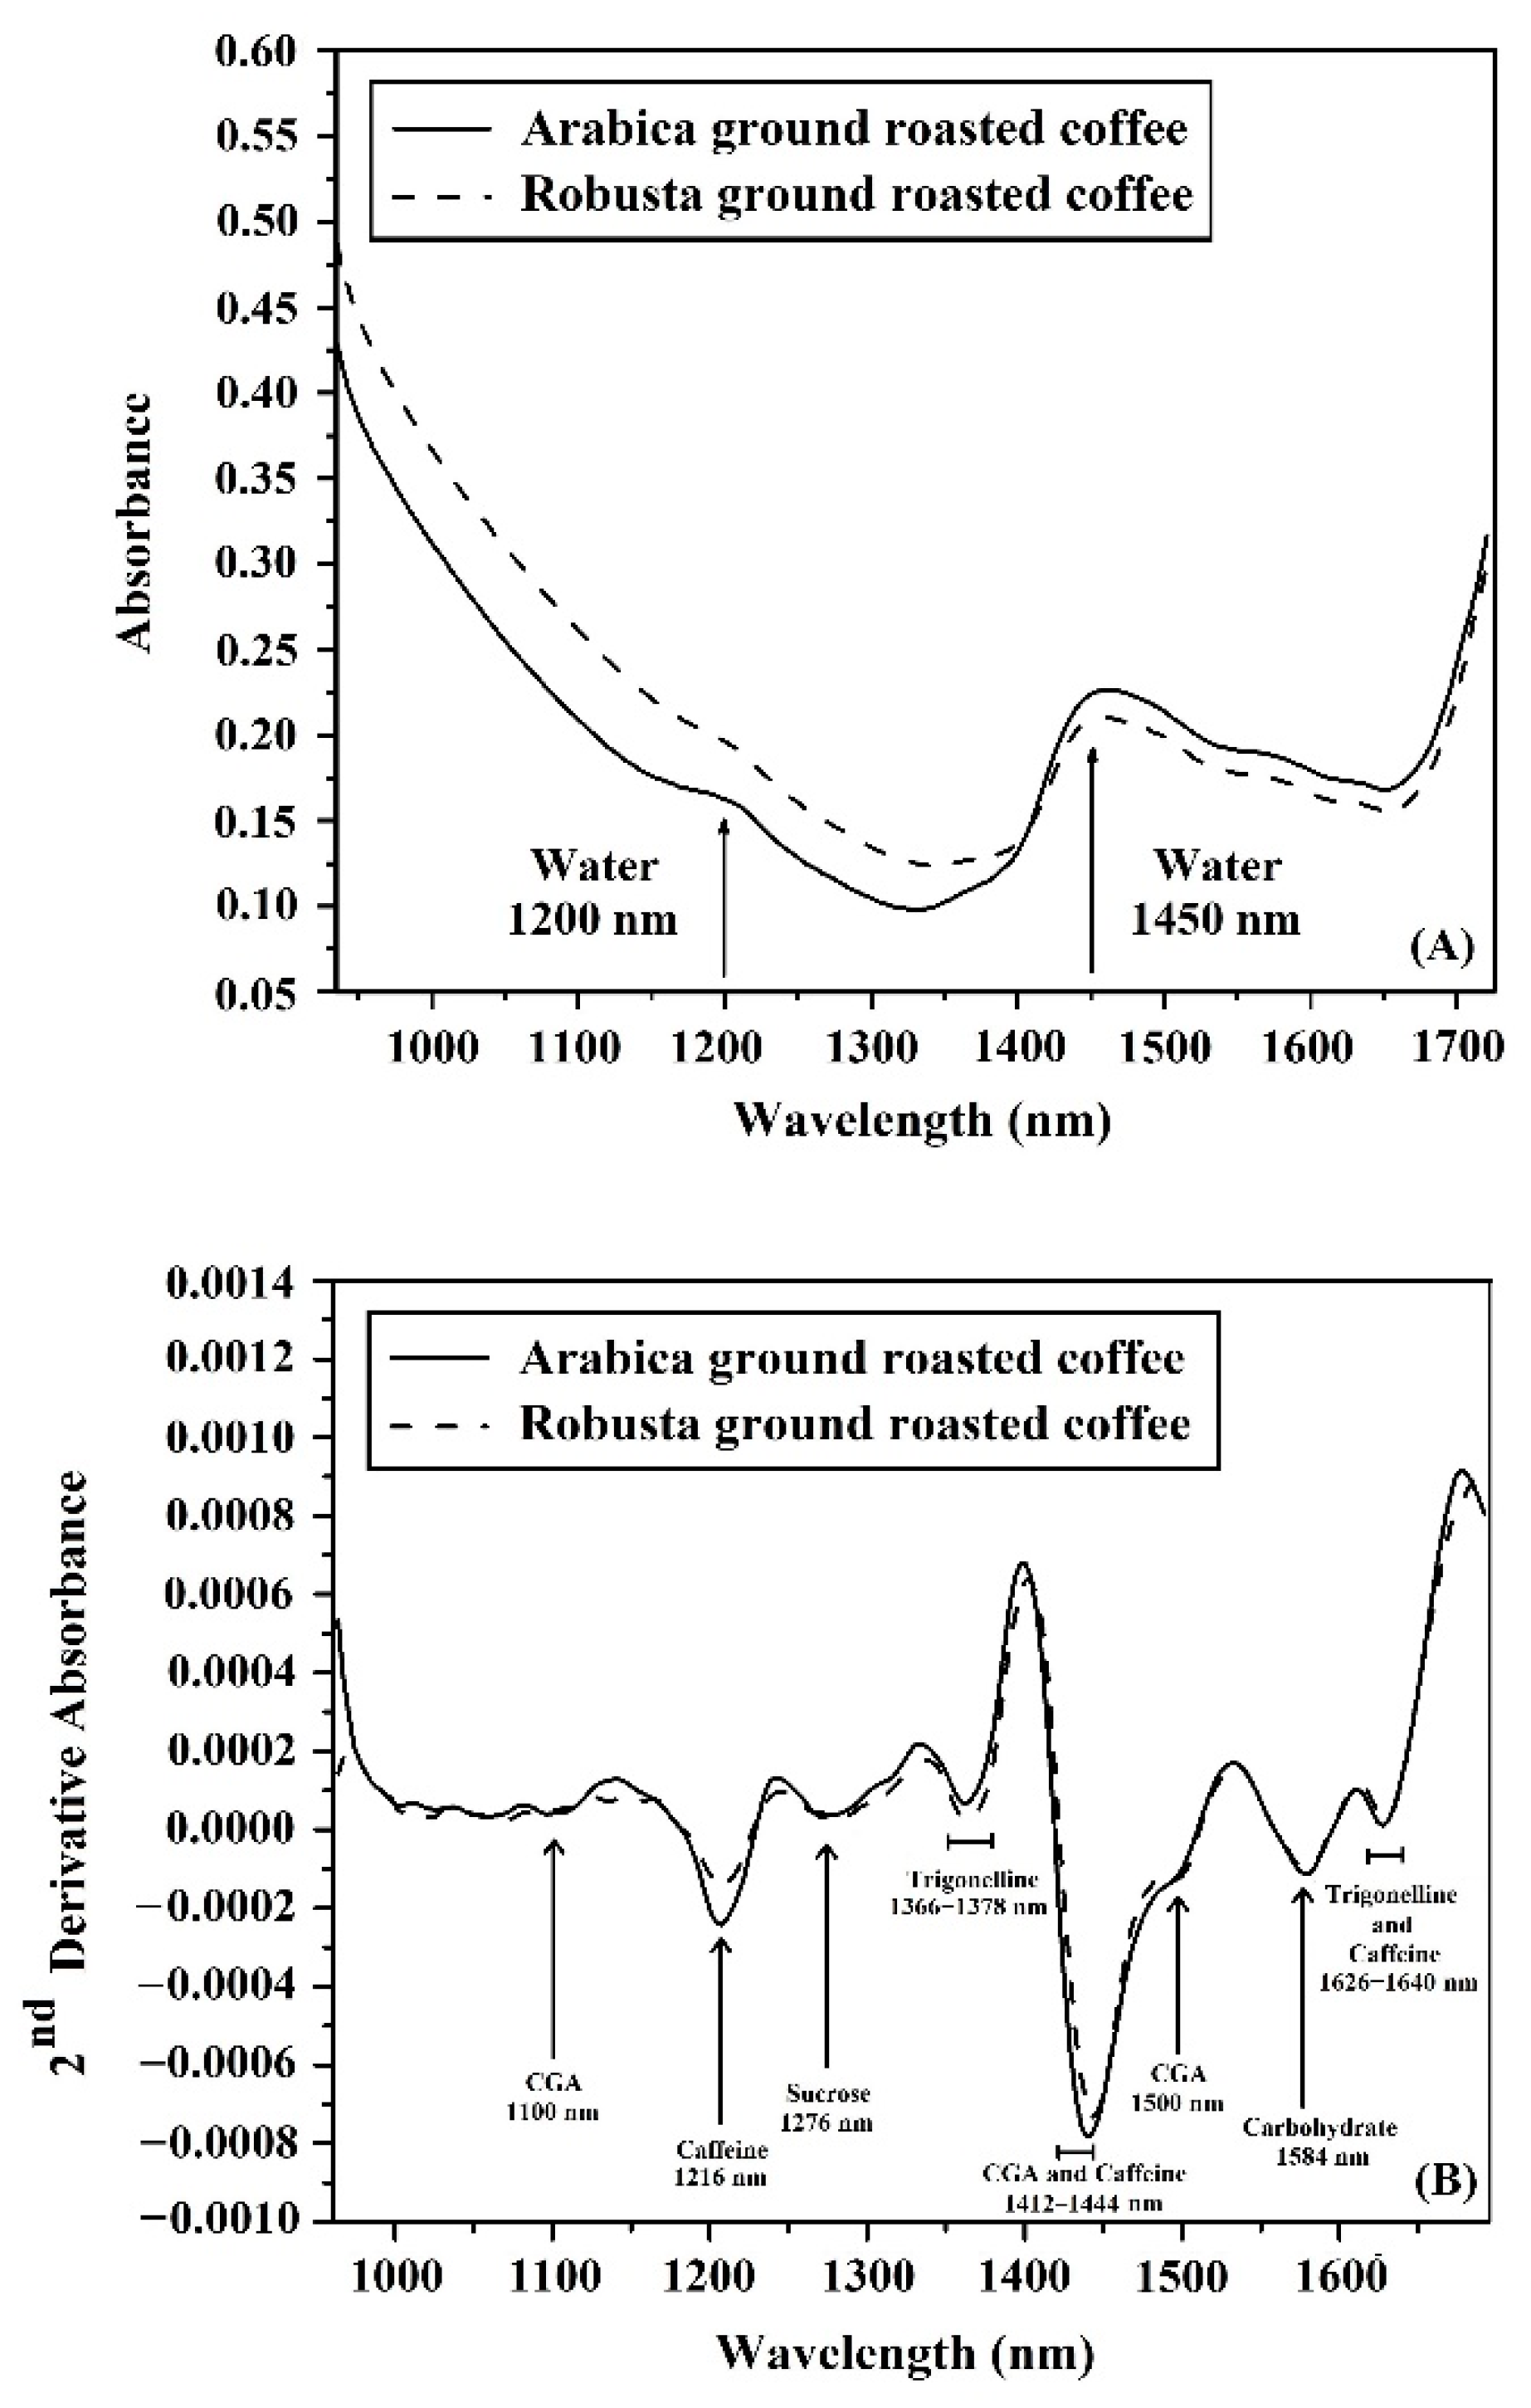
3.2. Characterization of Spectra for Ground Roasted Coffee Using NIR-HSI
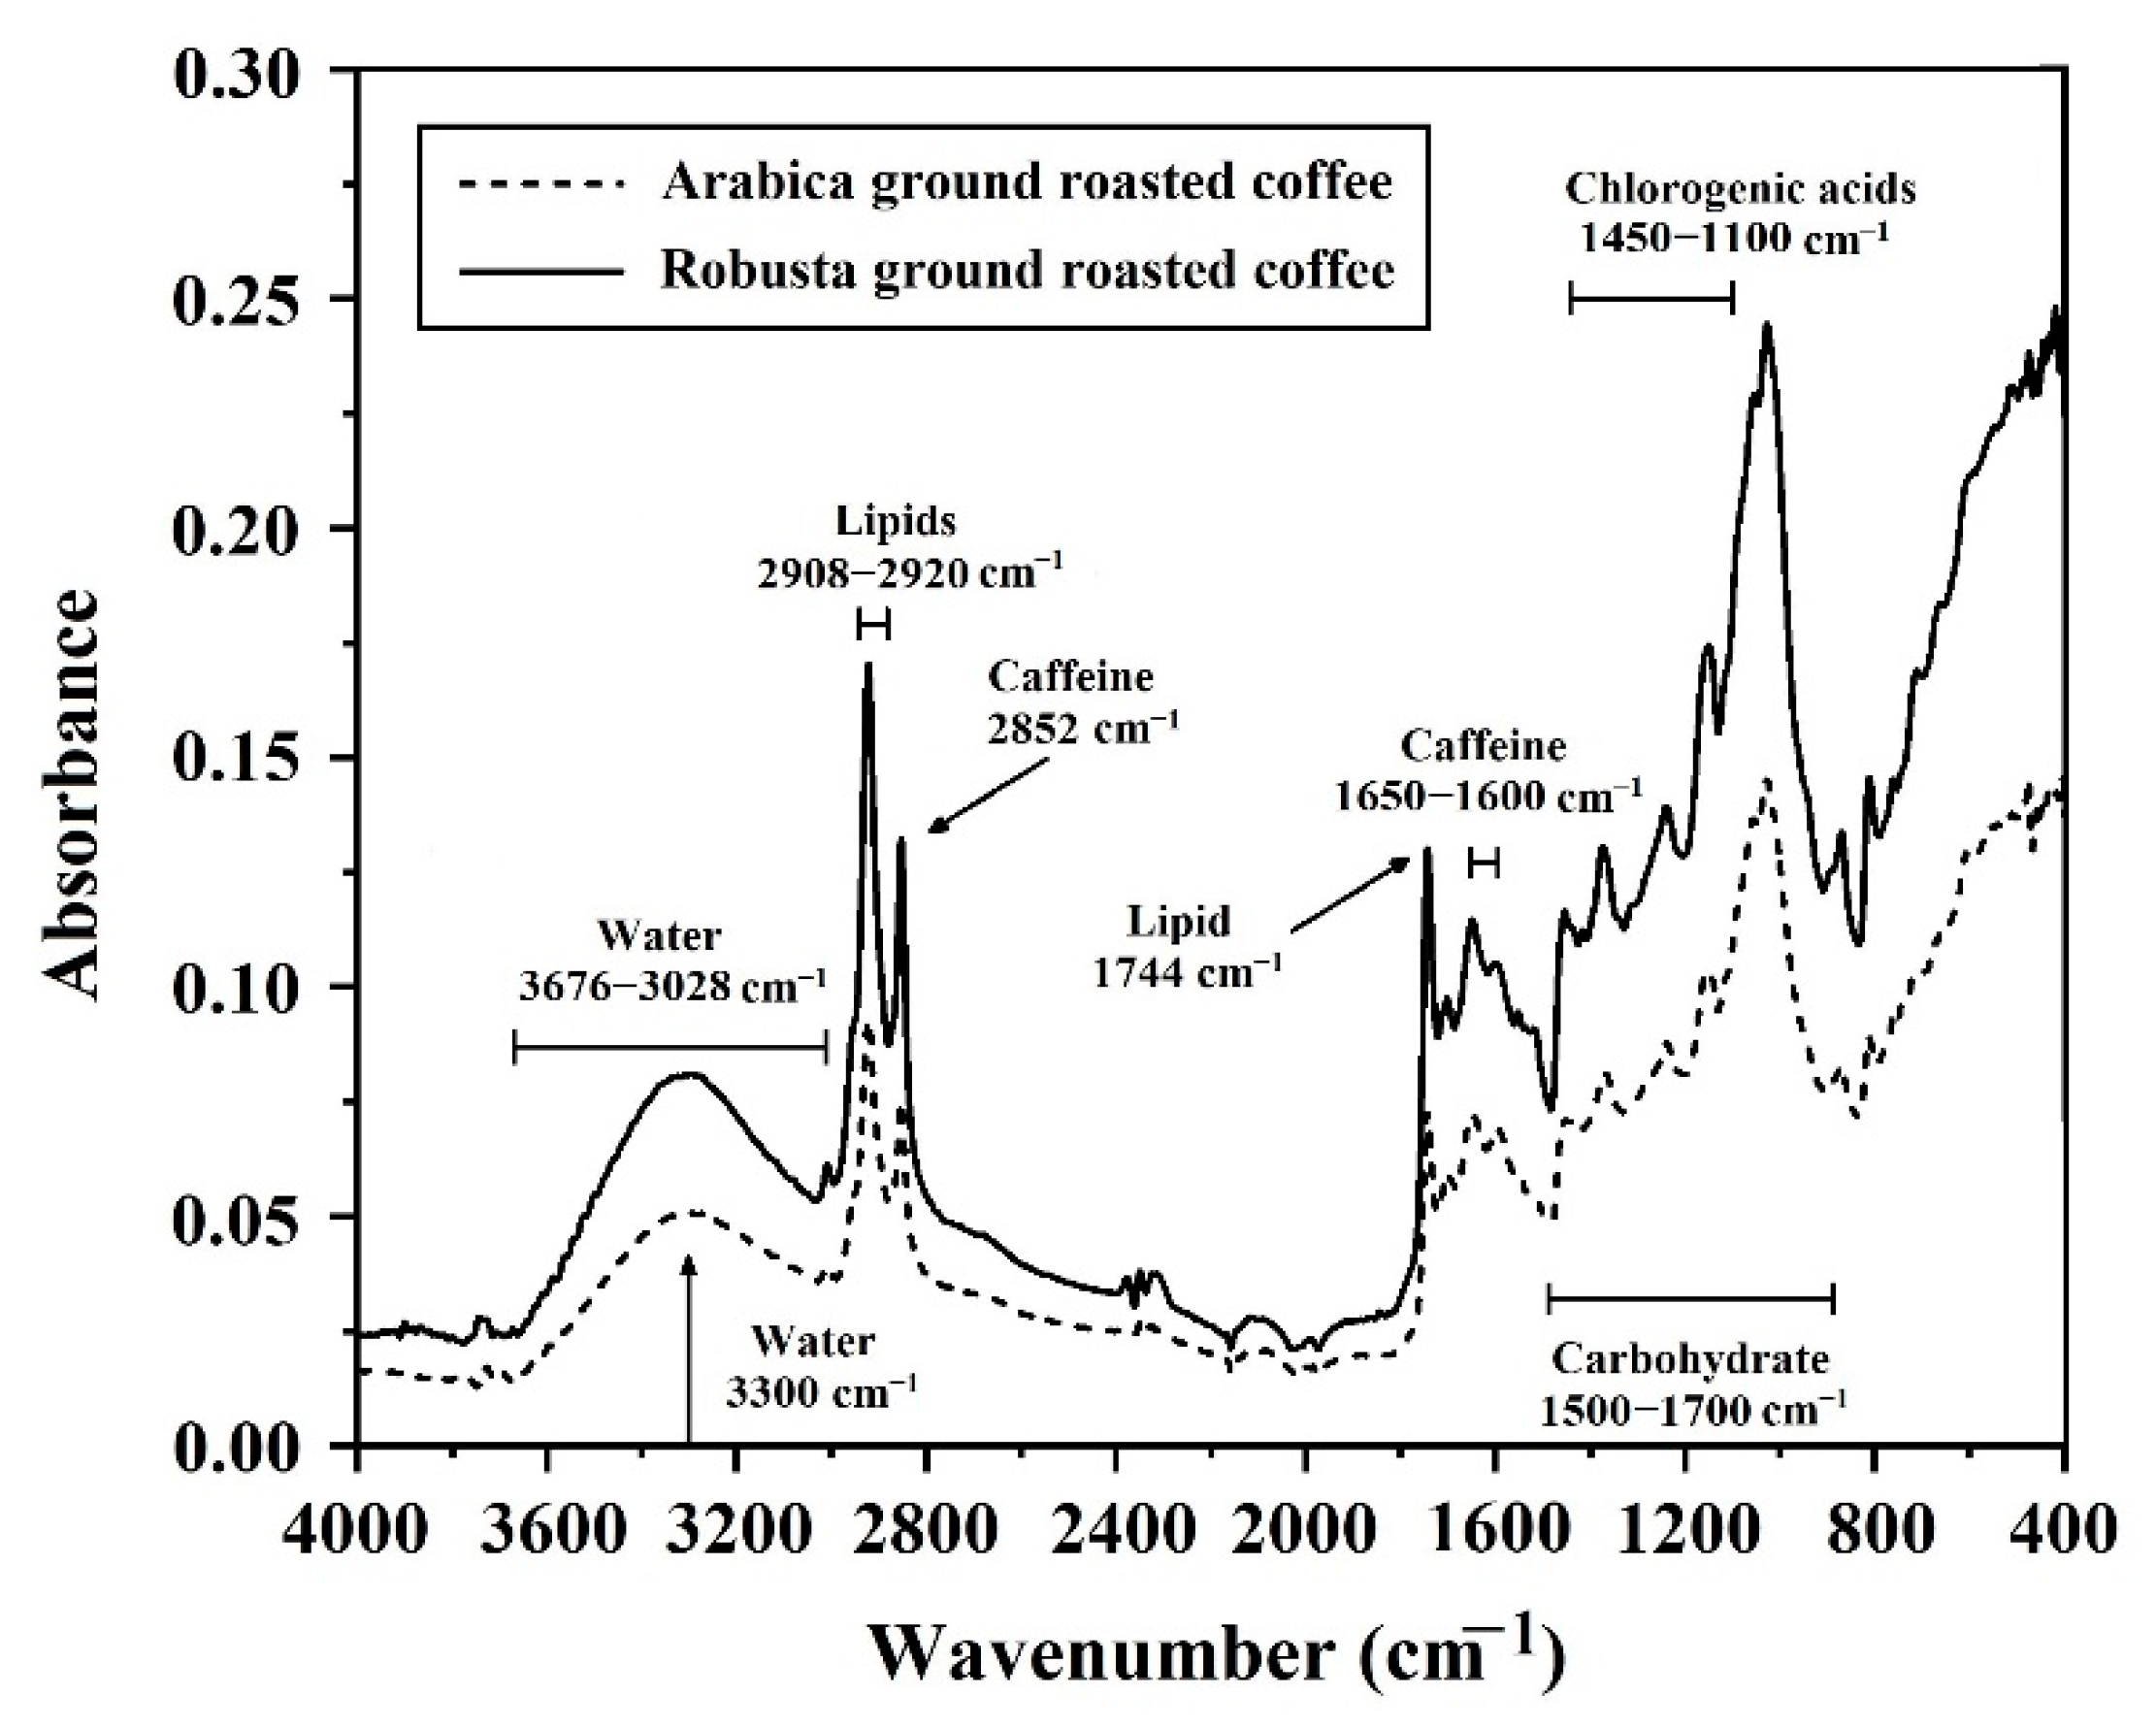
3.3. Characterization of Spectra for Ground Roasted Coffee by FTIRs
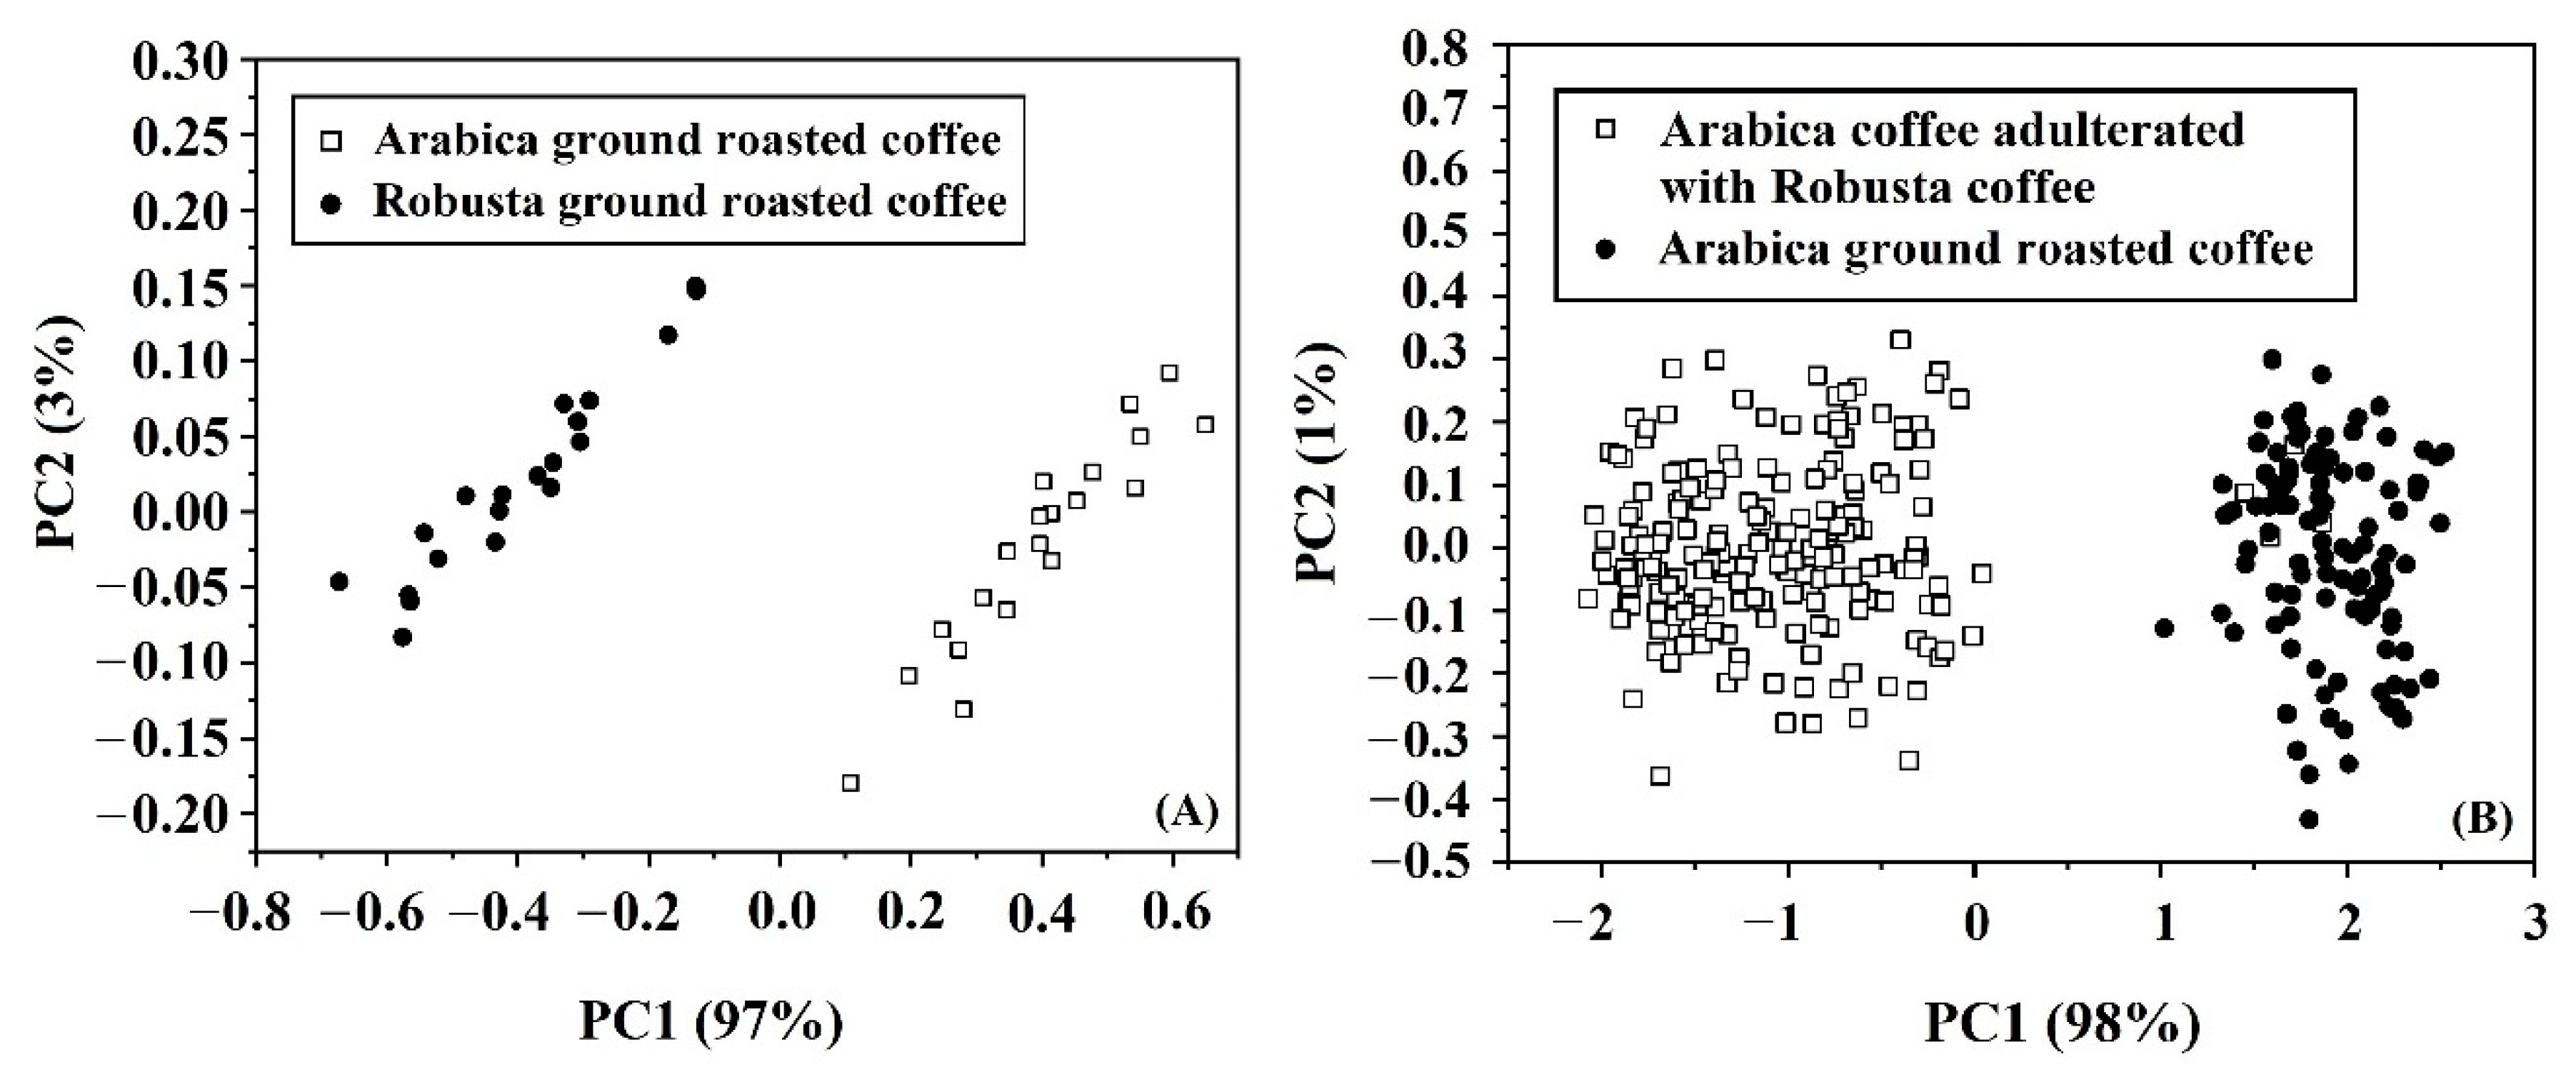
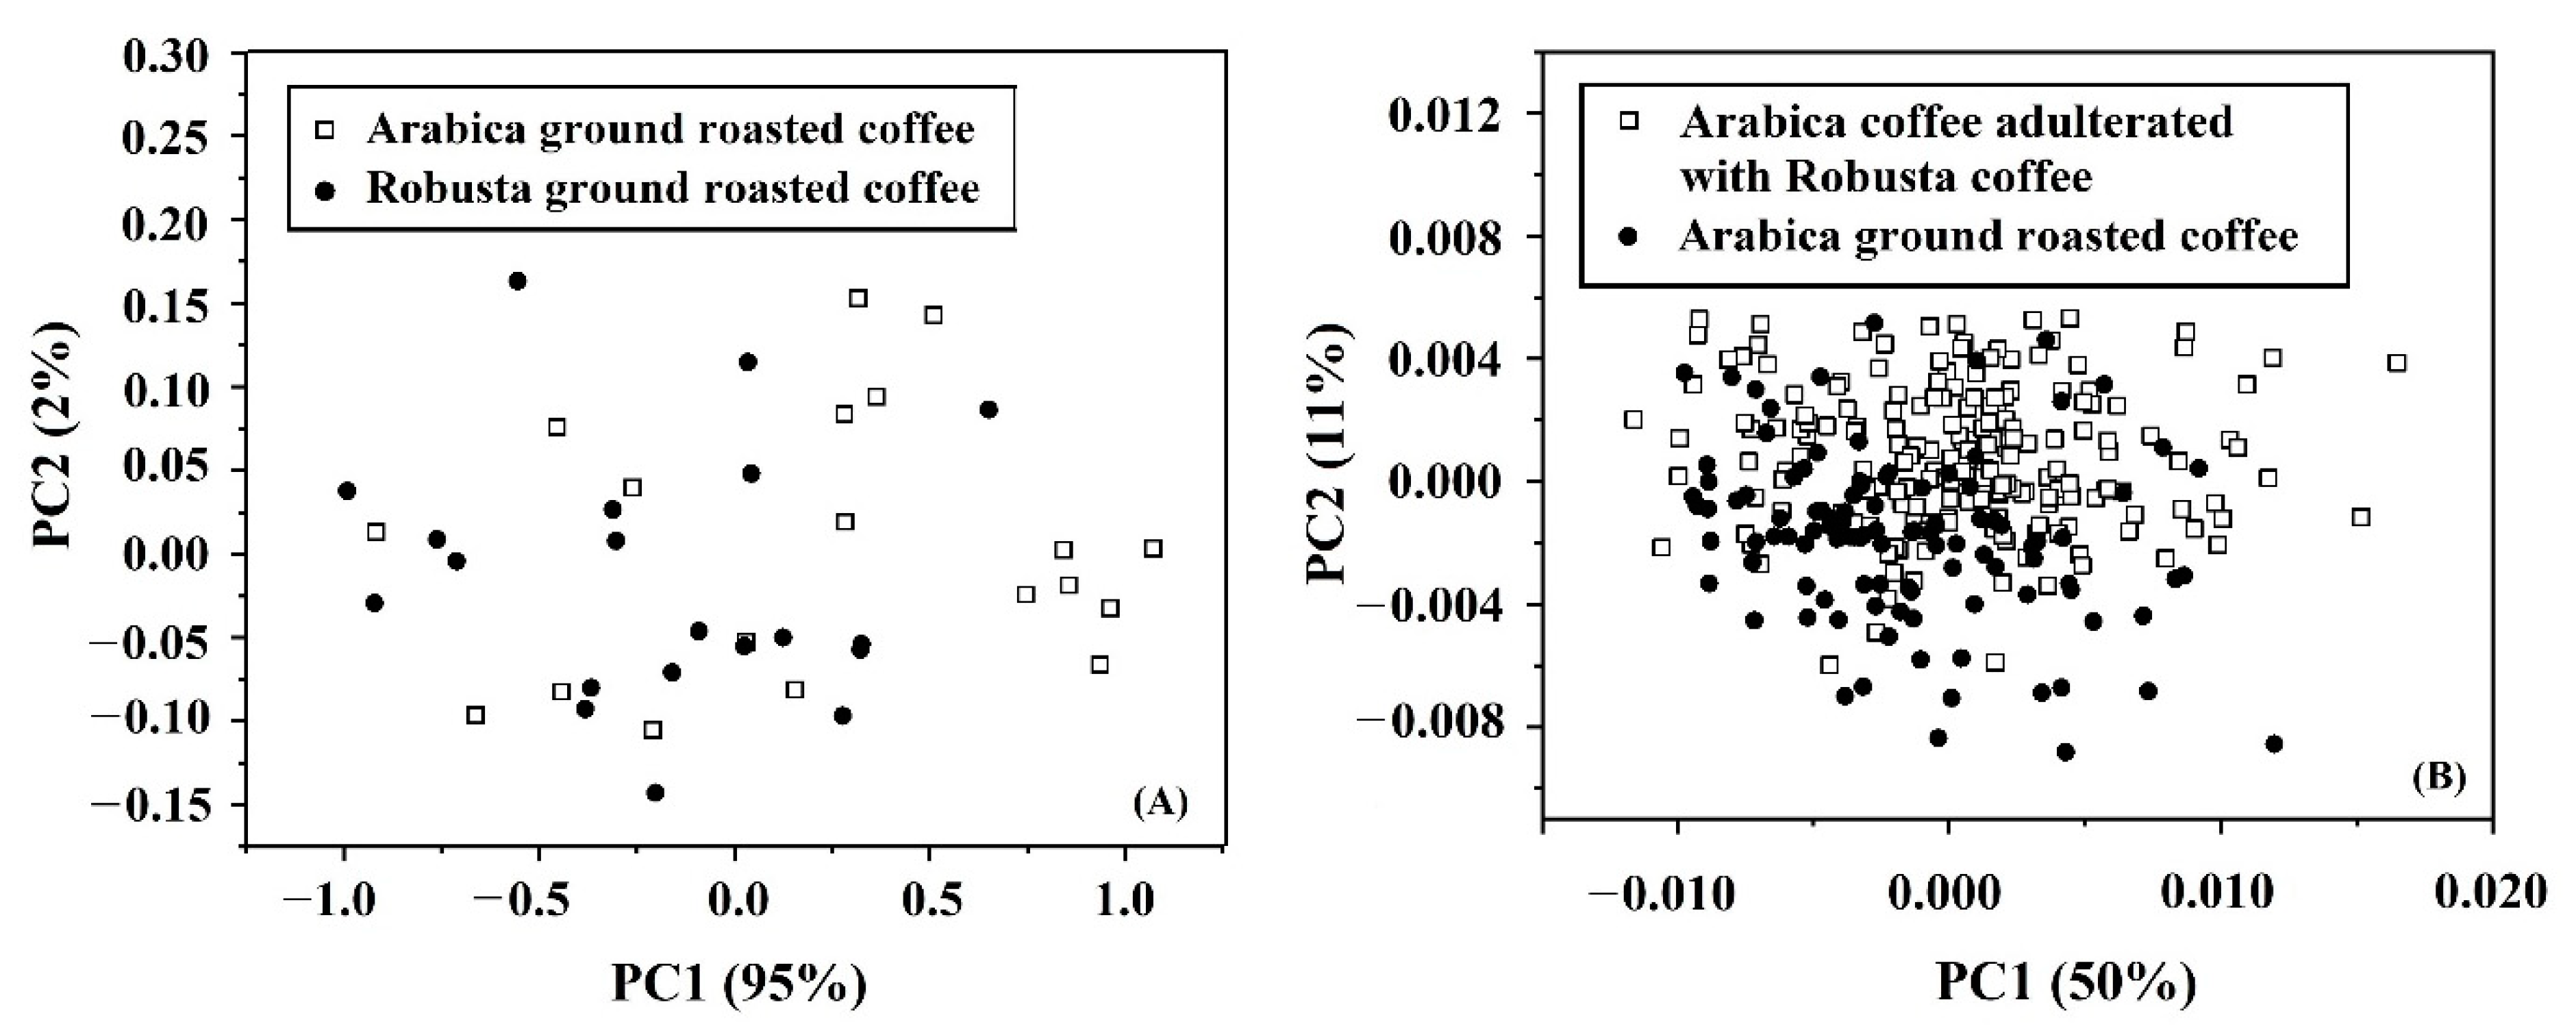
3.4. PCA
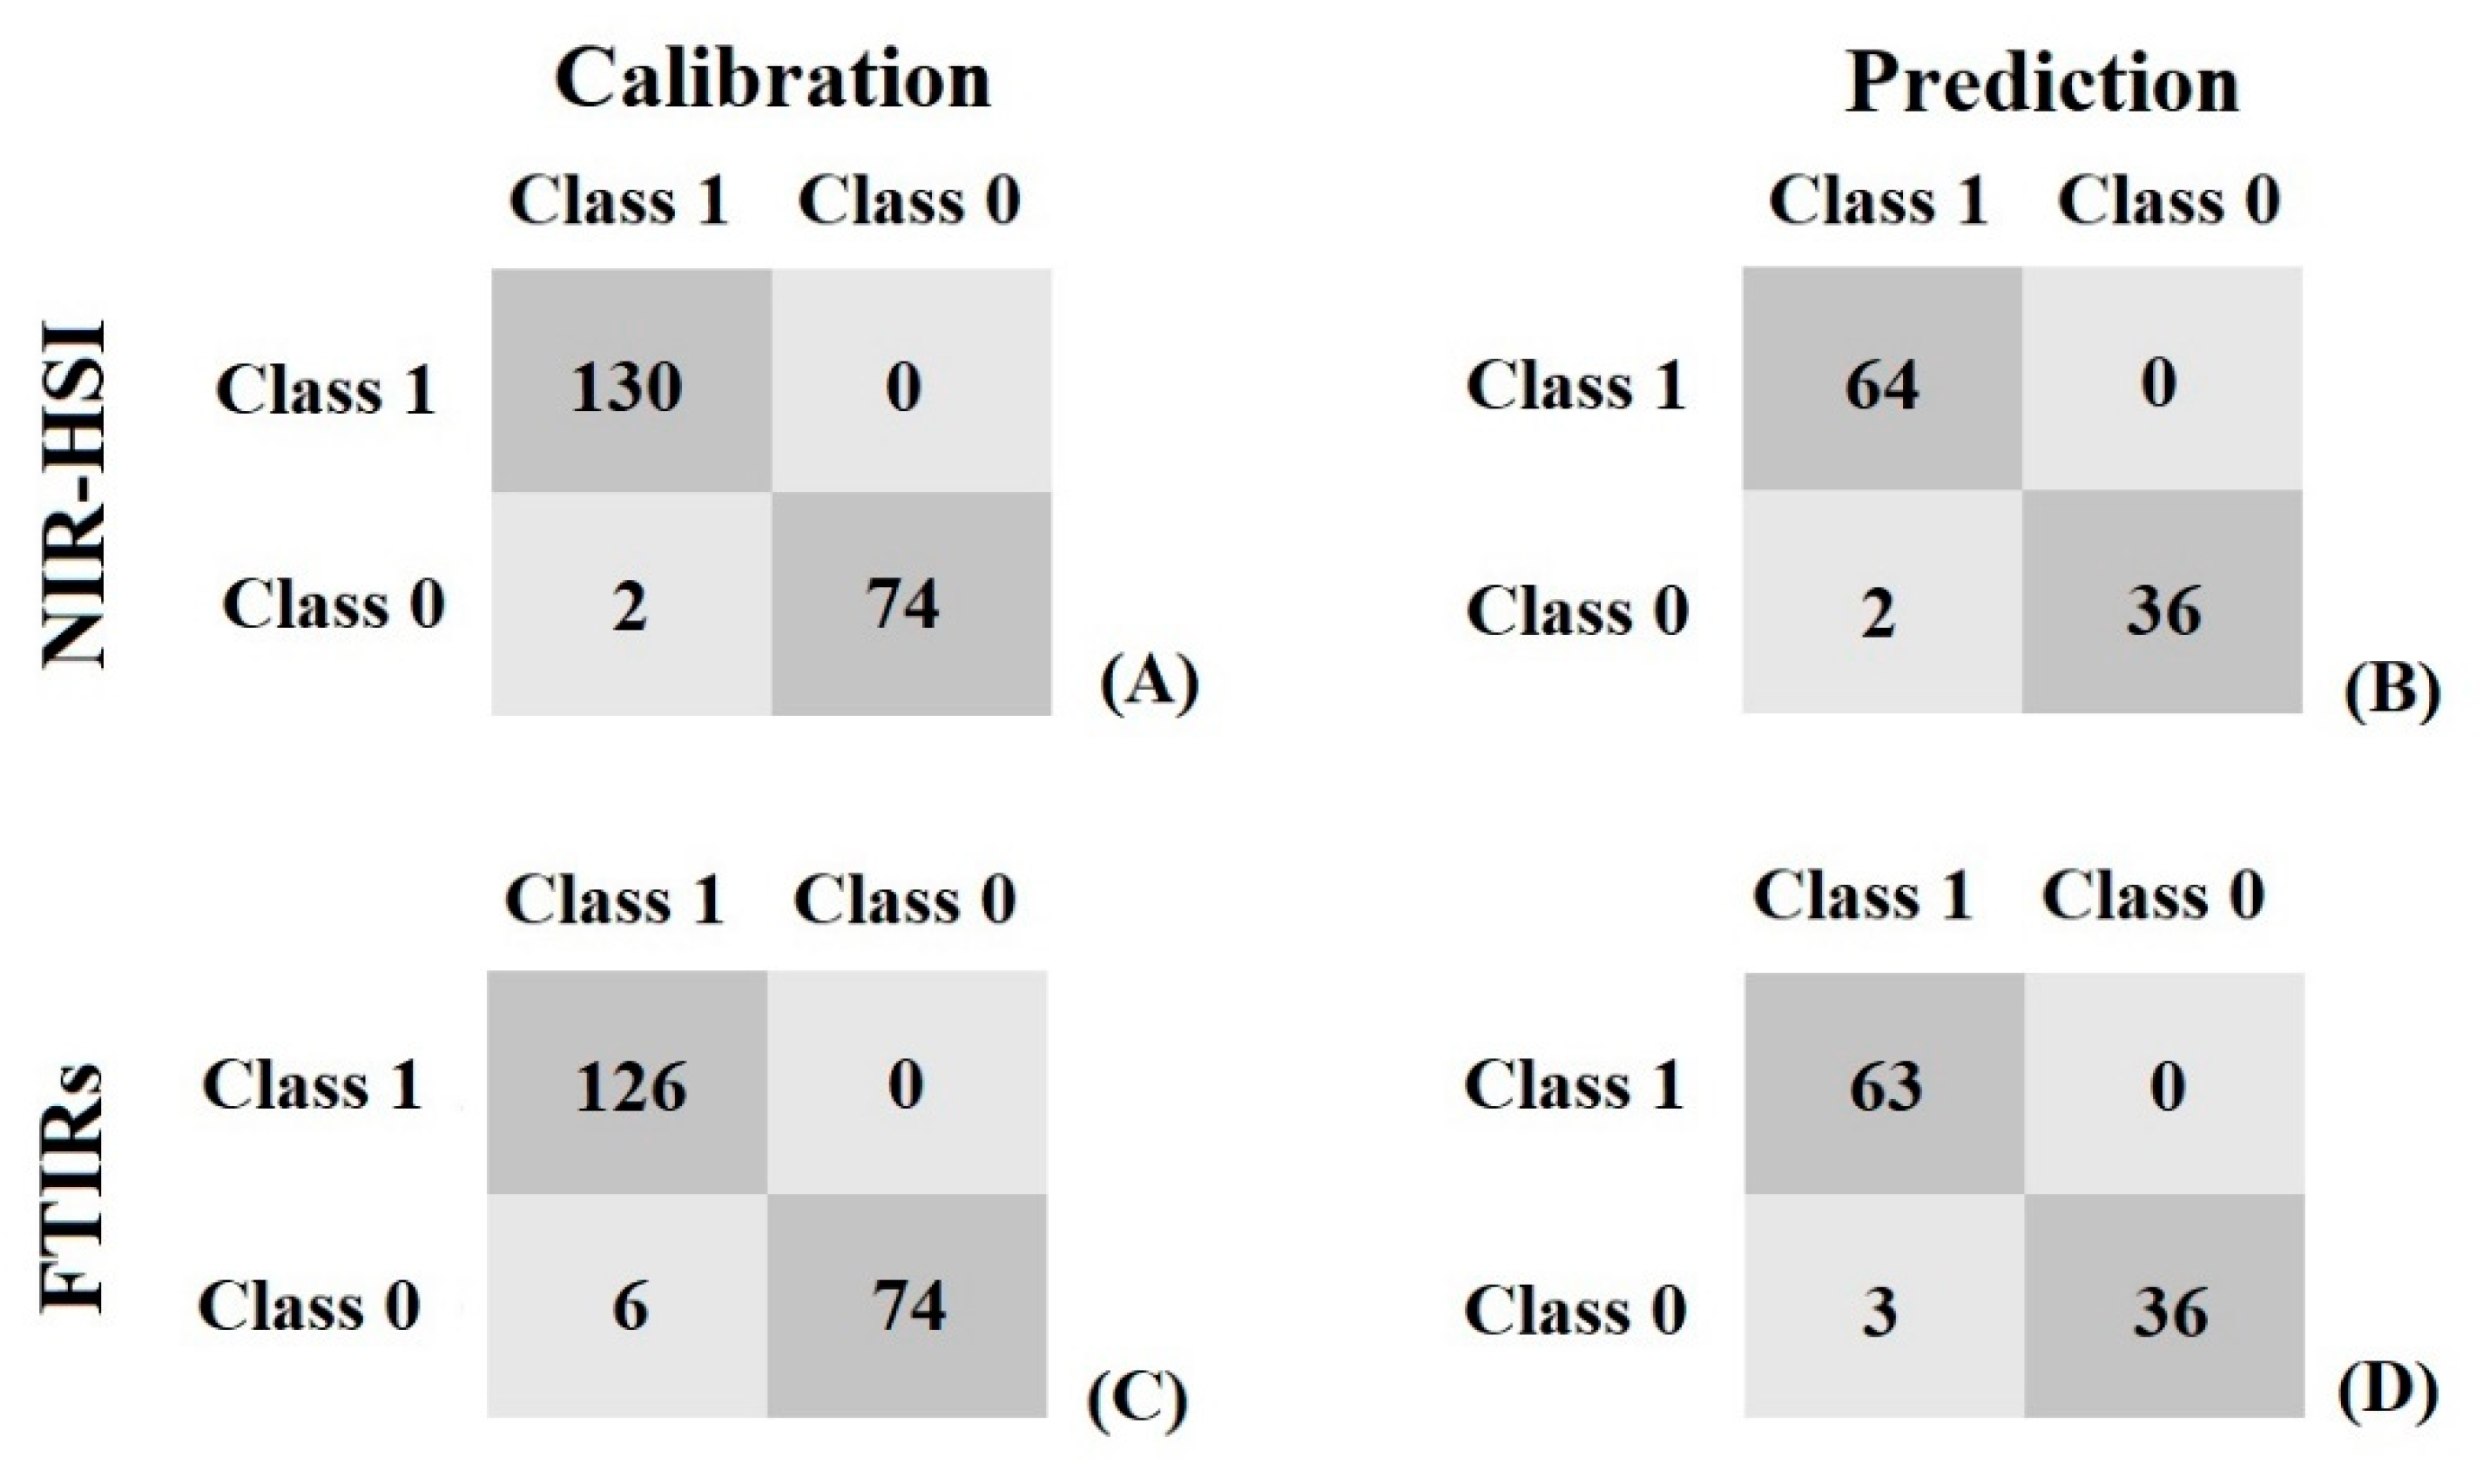
3.5. Qualitative Analysis
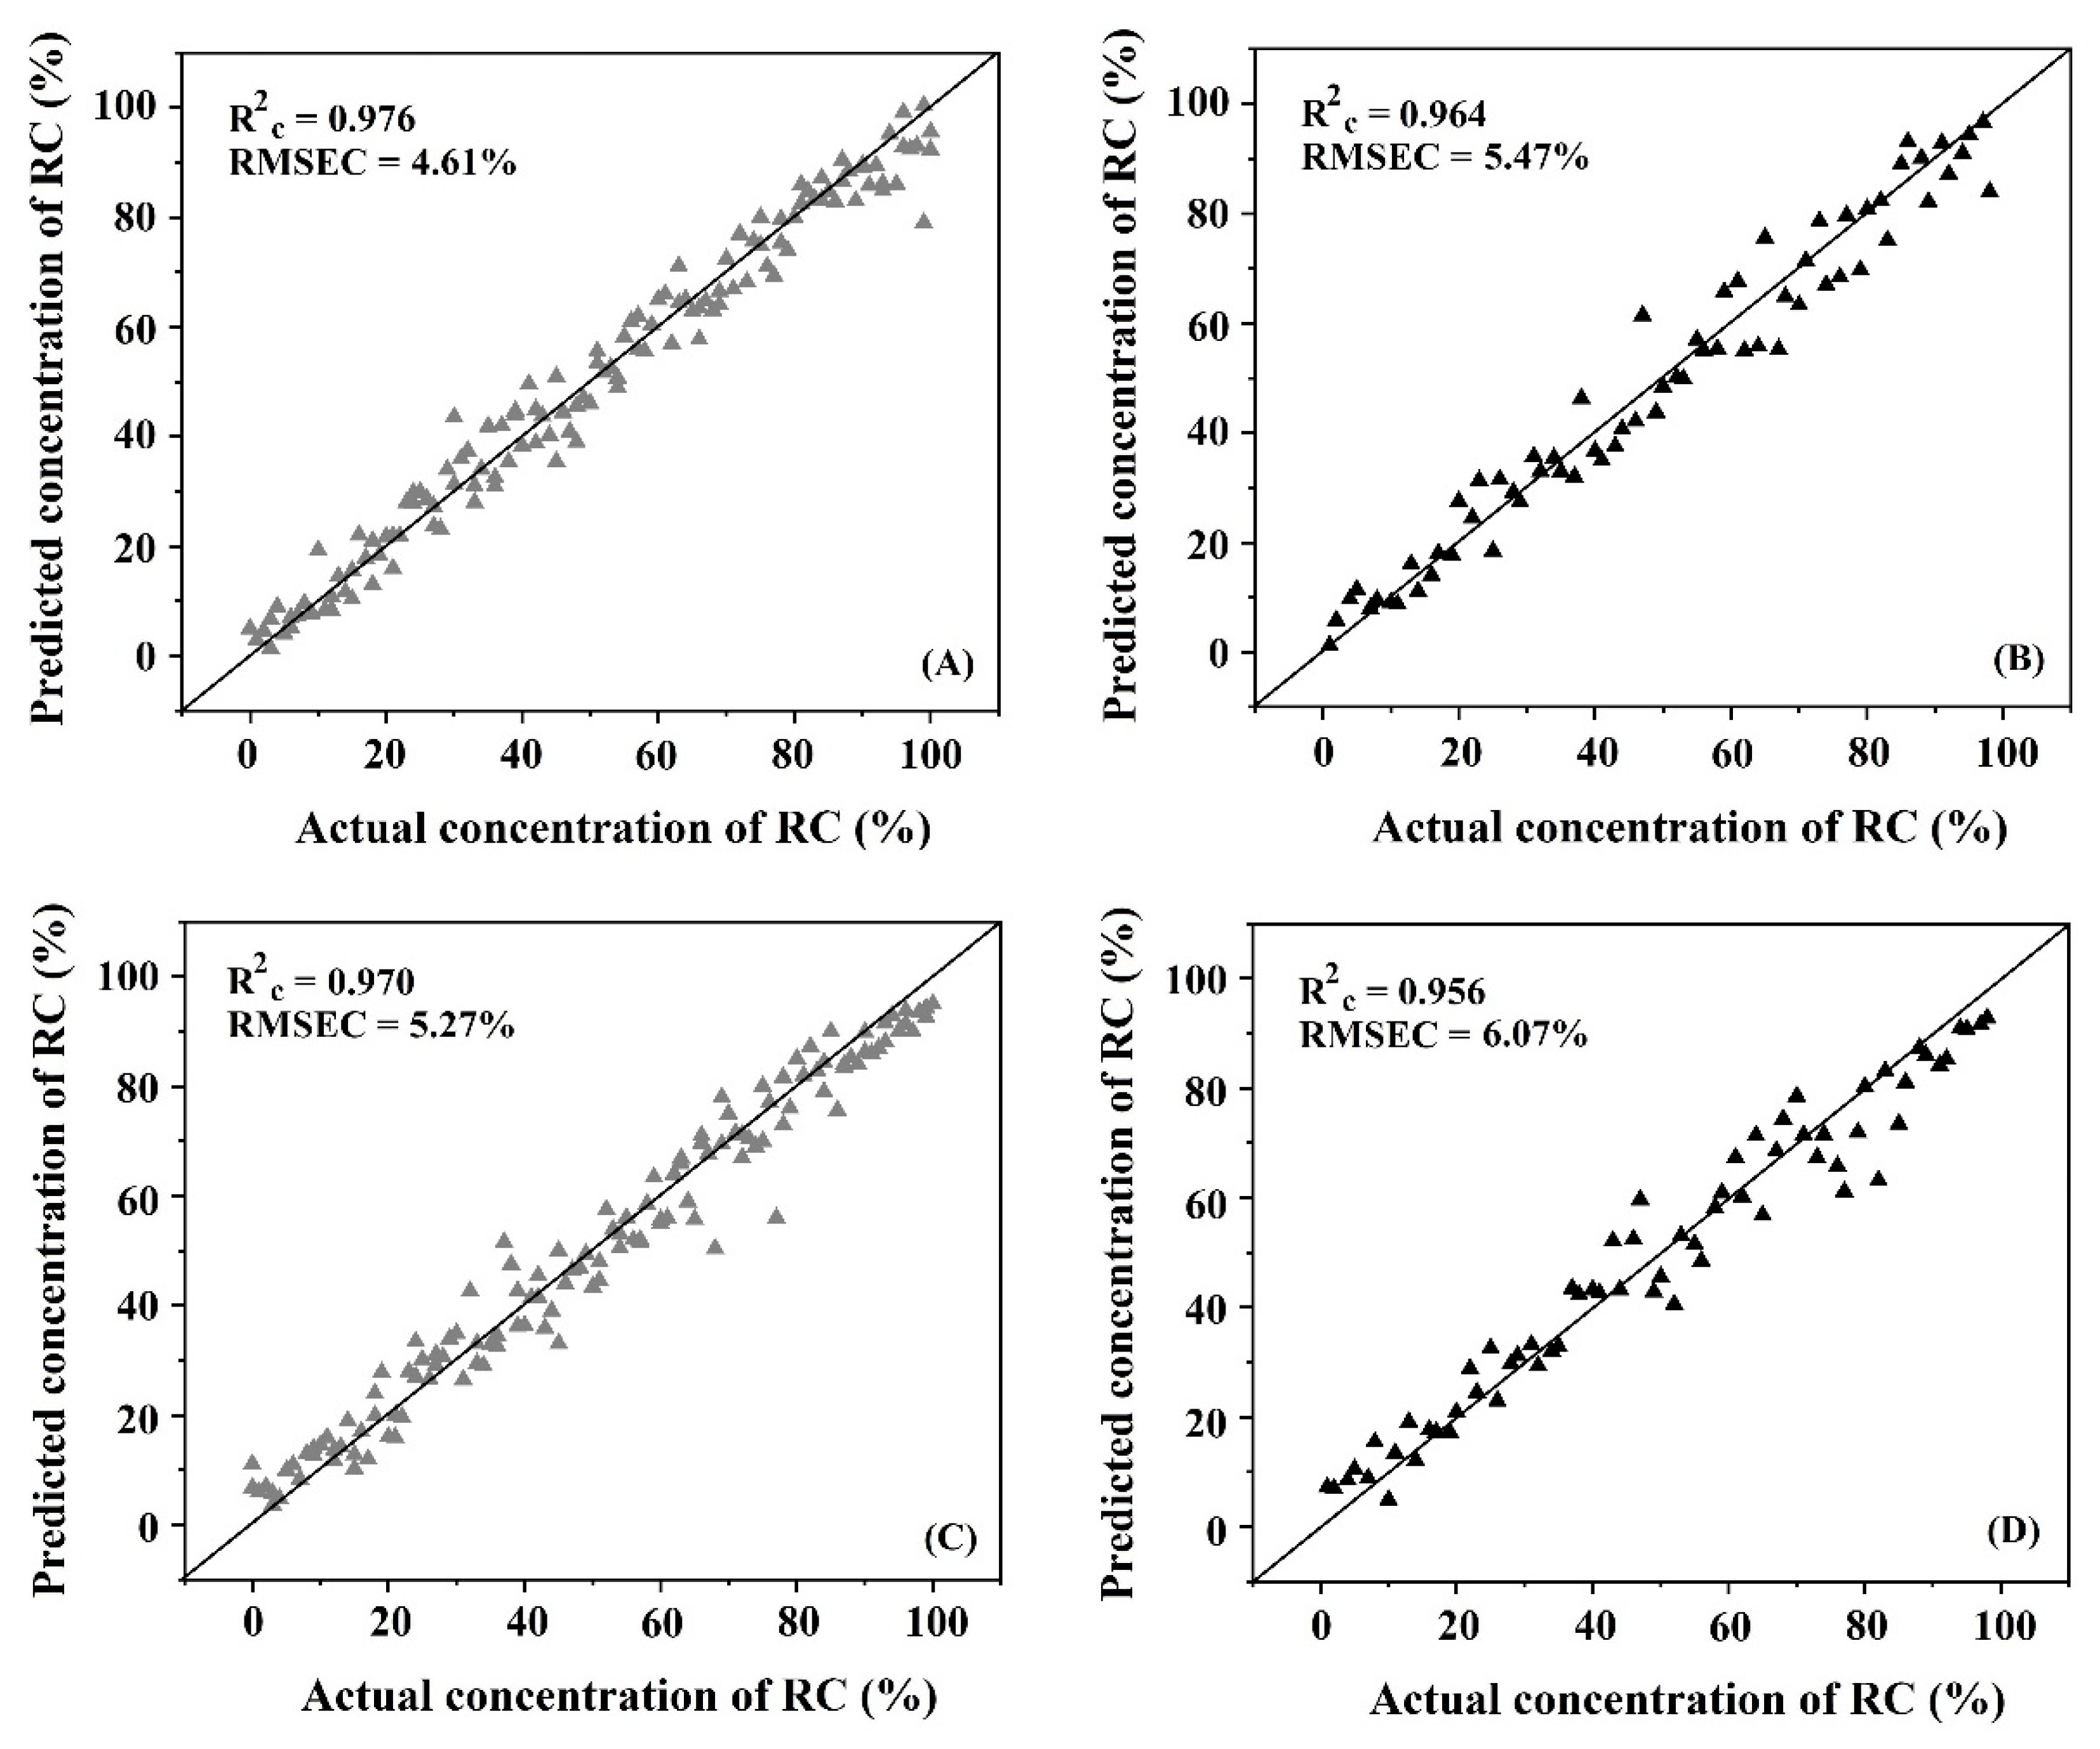
3.6. Quantitative Analysis
4. Conclusions
Author Contributions
Funding
Data Availability Statement
Acknowledgments
Conflicts of Interest
References
- Farah, A. Coffee: Production, Quality and Chemistry, 1st ed.; The Royal Society of Chemistry: London, UK, 2019. [Google Scholar]
- Clarke, R.J.; Macrae, R. Coffee: Volume 1. Chemistry; Elsevier Applied Science Publishers: London, UK, 1985. [Google Scholar]
- Kennedy, S.P.; Gonzales, P.; Roungchun, J. Chapter 8: Coffee and tea fraud. In Food Fraud: A Global Threat with Public Health and Economic Consequences, 1st ed.; Charlotte Cockle: Chennai, India, 2021; pp. 139–150. [Google Scholar]
- Tentamus Lab for Life. Taiwanese Market Survey on the Adulteration of Coffee Beans. Available online: https://www.tentamus.com/taiwanese-market-survey-adulteration-coffee-beans/ (accessed on 6 July 2021).
- Reis, N.; Franca, A.S.; Oliveira, L.S. Discrimination between roasted coffee, roasted corn and coffee husks by Diffuse Reflectance Infrared Fourier Transform Spectroscopy. LWT-Food Sci. Technol. 2013, 50, 715–722. [Google Scholar] [CrossRef]
- Oliveira, R.C.S.; Oliveira, L.S.; Franca, A.S.; Augusti, R. Evaluation of the potential of SPME-GC-MS and chemometrics to detect adulteration of ground roasted coffee with roasted barley. J. Food Compos. Anal. 2009, 22, 257–261. [Google Scholar] [CrossRef]
- Velásqueza, L.; Cruz-Tiradoa, J.P.; Sichea, R.; Quevedob, R. An application based on the decision tree to classify the marbling of beef by hyperspectral imaging. Meat Sci. 2017, 133, 43–50. [Google Scholar] [CrossRef] [PubMed]
- Laborde, A.; Puig-Castellvi, F.; Bouveresse, D.; Eveleigh, L.; Cordella, C.; Jaillais, B. Detection of chocolate powder adulteration with peanut using near-infrared hyperspectral imaging and Multivariate Curve Resolution. Food Control 2021, 119, 107454. [Google Scholar] [CrossRef]
- McGoverin, C.; September, D.; Geladi, P.; Manley, M. Near infrared and mid-infrared spectroscopy for the quantification of adulterants in ground black pepper. J. Near Infrared Spectrosc. 2012, 20, 521–528. [Google Scholar] [CrossRef]
- Orrilloa, I.; Cruz-Tiradob, J.P.; Cardenasa, A.; Orunaa, M.; Carneroa, A.; Barbinb, D.F.; Sichea, R. Hyperspectral imaging as a powerful tool for identification of papaya seeds T in black pepper. Food Control 2019, 101, 45–52. [Google Scholar] [CrossRef]
- Verdu, S.; Vasquez, F.; Grau, R.; Ivorra, E.; Sanchez, A.J.; Barat, J.M. Detection of adulterations with different grains in wheat products based on the hyperspectral image technique: The specific cases of flour and bread. Food Control 2016, 62, 373–380. [Google Scholar] [CrossRef]
- Fu, X.; Kim, M.S.; Qin, K.C.; Lim, J.; Lee, H.; Garrido-Varo, A.; Perez-Marin, D.; Ying, Y. Detection of melamine in milk powders based on NIR hyperspectral imaging and spectral similarity analyses. J. Food Eng. 2014, 124, 97–104. [Google Scholar] [CrossRef]
- Huang, M.; Kim, M.S.; Delwich, S.R.; Chao, K.; Qin, J.; Mo, C.; Esquerre, C.; Zhu, Q. Quantitative analysis of melamine in milk powders using near-infrared hyperspectral imaging and band ratio. J. Food Eng. 2016, 181, 10–19. [Google Scholar] [CrossRef]
- Forchetti, D.A.P.; Poppi, R.J. Use of NIR hyperspectral imaging and multivariate curve resolution (MCR) for detection and quantification of adulterants in milk powder. LWT-Food Sci. Technol. 2017, 76, 337–343. [Google Scholar] [CrossRef]
- Khamsopha, D.; Sahachairungrueng, W.; Teerachaichayut, S. Utilizing near infrared hyperspectral imaging for quantitatively predicting adulteration in tapioca starch. Food Control 2021, 123, 107781. [Google Scholar] [CrossRef]
- Subramanian, A.; Rodriguez-Saona, L. Chapter 7—Fourier Transform Infrared (FTIR) Spectroscopy. In Infrared Spectroscopy for Food Quality Analysis and Control; Sun, D.W., Ed.; Elsevier’s Science & Technology: Oxford, UK, 2021; pp. 146–178. [Google Scholar] [CrossRef]
- Rodriguez-Saona, L.E.; Allendorf, M.E. Use of FTIR for Rapid Authentication and Detection of Adulteration of Food. Annu. Rev. Food Sci. Technol. 2011, 2, 467–483. [Google Scholar] [CrossRef]
- Lohumi, S.; Lee, S.; Lee, W.; Kim, M.S.; Mo, C.; Bae, H. Detection of starch adulteration in onion powder by FT-NIR and FT-IR spectroscopy. J. Agric. Food Chem. 2014, 62, 9246–9251. [Google Scholar] [CrossRef] [PubMed]
- Titus, D.; Samuel, J.J.; Roopan, S.M. Chapter 12—Nanoparticle characterization techniques. In Green Synthesis, Characterization and Applications of Nanoparticles; Shukla, A.K., Iravani, S., Eds.; Matthew Deans: Chennai, India, 2019; pp. 303–319. [Google Scholar] [CrossRef]
- Li, X.; Zhang, Y.; He, Y. Rapid detection of talcum powder in tea using FT-IR spectroscopy coupled with chemometrics. Sci. Rep. 2016, 6, 30313. [Google Scholar] [CrossRef] [PubMed]
- Amsaraj, R.; Mutturi, S. Real-coded GA coupled to PLS for rapid detection and quantification of tartrazine in tea using FT-IR spectroscopy. LWT-Food Sci. Technol. 2021, 139, 110583. [Google Scholar] [CrossRef]
- Lohumi, S.; Joshi, R.; Kandpal, L.M.; Lee, H.; Kim, M.S.; Cho, H.; Mo, C.; Seo, Y.W.; Rahman, A.; Cho, B.K. Quantitative analysis of Sudan dye adulteration in paprika powder using FTIR spectroscopy. Food Addit. Contam. 2017, 34, 678–686. [Google Scholar] [CrossRef] [PubMed]
- Lohumi, S.; Lee, S.; Cho, B. Optimal variable selection for Fourier Transform infrared spectroscopic analysis of starch-adulterated garlic power. Sens. Actuators B Chem. 2015, 216, 622–628. [Google Scholar] [CrossRef]
- Galvin-King, P.; Haughey, S.A.; Elliott, C.T. Garlic adulteration detection using NIR and FTIR spectroscopy and chemometrics. J. Food Compos. Anal. 2021, 96, 103757. [Google Scholar] [CrossRef]
- Zhao, X.; Wang, W.; Ni, X.; Chu, X.; Li, Y.F.; Sun, C. Evaluation of Near-Infrared Hyperspectral Imaging for Detection of Peanut and Walnut Powders in Whole Wheat Flour. Appl. Sci. 2018, 8, 1076. [Google Scholar] [CrossRef]
- Huang, H.; Liu, L.; Ngadi, M.O. Assessment of intramuscular fat content of pork using NIR hyperspectral images of rib end. J. Food Eng. 2017, 193, 29–41. [Google Scholar] [CrossRef]
- Isaksson, T.; Naes, T. The effect of Multiplicative Scatter Corrective (MSC) and Linearity Improvement in NIR Spectroscopy. Appl. Spectrosc. 1988, 42, 1273–1284. [Google Scholar] [CrossRef]
- Huand, F.; Song, H.; Guo, L.; Guang, P.; Yang, X.; Li, L.; Zhao, H.; Yang, M. Detection of adulteration in Chinese honey using NIR and ATR-FTIR spectral data fusion. Spectrochim. Acta-A Mol. Biomol. Spectrosc. 2020, 235, 118297. [Google Scholar] [CrossRef]
- Liu, C.; Yang, S.X.; Deng, L. A comparative study for least angle regression on NIR spectra analysis to determine internal qualities of navel oranges. Expert Syst. Appl. 2015, 42, 8497–8503. [Google Scholar] [CrossRef]
- Li, G.; Ren, Y.; Ren, X.; Zhang, X. Non-destructive measurement of fracturability and chewiness of apple by FT-NIRS. J. Food Sci. Technol. 2015, 52, 258–266. [Google Scholar] [CrossRef] [PubMed][Green Version]
- Li, L.; Chin, W.S. Rapid and sensitive SERS detection of melamine in milk using Ag nanocube array substrate coupled with multivariate analysis. Food Chem. 2021, 357, 129717. [Google Scholar] [CrossRef]
- Rios-Reina, R.; Elcoroaristizabal, S.; Ocana-Gonzalea, J.A.; Garcia-Gonzalez, D.L.; Amigo, J.M.; Callejon, R.M. Characterization and authentication of Spanish PDO wine vinegars using multidimensional fluorescence and chemometrics. Food Chem. 2017, 230, 108–116. [Google Scholar] [CrossRef]
- Yu, S.; Huang, X.; Wang, L.; Ren, Y.; Zhang, X.; Wang, Y. Characterization of selected Chinese soybean paste based on flavor profiles using HS-SPME-GC/MS, E-nose and E-tongue combined with chemometrics. Food Chem. 2022, 375, 131840. [Google Scholar] [CrossRef]
- Yao, K.; Sun, J.; Zhou, X.; Nirere, A.; Tian, Y.; Wu, X. Nondestructive detection for egg freshness grade based on hyperspectral imaging technology. J. Food Process Eng. 2020, 43, 13422. [Google Scholar] [CrossRef]
- Vapnik, V. Nonlinear Modeling. In The Support Vector Method of Function Estimation; Springer: Berlin/Heidelberg, Germany, 2018; pp. 55–85. [Google Scholar] [CrossRef]
- Pantazi, X.E.; Moshou, D.; Bochtis, D. Chapter 2—Artificial intelligence in agriculture. In Intelligent Data Mining and Fusion Systems in Agriculture; Charlotte Cockle: Chennai, India, 2020; pp. 17–101. [Google Scholar] [CrossRef]
- Ballabio, D.; Todeschini, R. Part 4: Multivariate Classification for Qualitative Analysis. In Infrared Spectroscopy for Food Quality Analysis and Control, 1st ed.; Sun, D., Ed.; Elsevier’s Science & Technology: Oxford, UK, 2009; pp. 83–103. [Google Scholar]
- Amirruddin, A.D.; Muharam, F.M.; Ismail, M.H.; Ismail, M.F.; Tan, N.P.; Karam, D.S. Hyperspectral remote sensing for assessment of chlorophyll sufficiency levels in mature oil palm (Elaeis guineensis) based on frond numbers: Analysis of decision tree and random forest. Comput. Electron. Agric. 2020, 169, 105221. [Google Scholar] [CrossRef]
- Brasil, Y.L.; Cruz-Tirado, J.D.; Barbin, D.F. Fast online estimation of quail eggs freshness using portable NIR spectrometer and machine learning. Food Control 2022, 131, 108418. [Google Scholar] [CrossRef]
- Roggo, Y.; Chalus, P.; Maurer, L.; Lema-Martinez, C.; Edmond, A.; Jent, N. A review of near infrared spectroscopy and chemometrics in pharmaceutical technologies. J. Pharm. Biomed. Anal. 2007, 44, 683–700. [Google Scholar] [CrossRef] [PubMed]
- Workman, J.; Weyer, L. Practical Guide and Spectral atlas for Interpretive Near-Infrared Spectroscopy, 2nd ed.; Taylor & Francis Group LLC.: Boca Raton, FL, USA, 2012. [Google Scholar]
- Barbin, D.F.; de Souza Madureira Felicio, A.L.; Sun, D.W.; Nixdorf, S.L.; Hirooka, E.Y. Application of infrared spectral techniques on quality and compositional attributes of coffee: An overview. Food Res. Int. 2014, 61, 23–32. [Google Scholar] [CrossRef]
- Rieppo, L.; Saarakkala, S.; Narhi, T.; Helminen, H.J.; Jurvelin, J.S.; Rieppo, J. Application of second derivative spectroscopy for increasing molecular specificity of fourier transform infrared spectroscopic imaging of articular cartilage. Osteoarthr. Cartil. 2012, 20, 451–459. [Google Scholar] [CrossRef] [PubMed]
- Ribeiro, J.S.; Ferreira, M.M.C.; Salva, T.J.G. Chemometric models for the quantitative descriptive sensory analysis of Arabica coffee beverages using near infrared spectroscopy. Talanta 2011, 83, 1352–1358. [Google Scholar] [CrossRef]
- Esteban-Diez, I.; Gonzalez-Saiz, J.M.; Pizarro, C. Prediction of sensory properties of espresso from roasted coffee samples by near-infrared spectroscopy. Anal. Chim. Acta 2004, 525, 171–182. [Google Scholar] [CrossRef]
- Scholz, M.B.; Kitzberger, C.S.G.; Pereira, L.; Davrieux, F.; Pot, D.; Charmetant, P.; Leroy, T. Application of near infrared spectroscopy for green coffee biochemical phenotyping. J. Near Infrared Spectrosc. 2014, 22, 411–421. [Google Scholar] [CrossRef]
- Chanda, S.; Hazarika, A.K.; Choudhury, N.; Islam, S.A.; Manna, R.; Sabhapondit, S.; Tudu, B.; Bandyopadhyay, R. Support vector machine regression on selected wavelength regions for quantitative analysis of caffeine in tea leaves by near infrared spectroscopy. J. Chemom. 2019, 33, 1–15. [Google Scholar] [CrossRef]
- Ribeiro, J.S.; Salva, T.; Silvarolla, M.B. Prediction of a wide range of compounds concentration in raw coffee beans using NIRS, PLS and variable selection. Food Control 2021, 125, 107967. [Google Scholar] [CrossRef]
- Amir, R.M.; Anjum, F.M.; Khan, M.I.; Khan, M.R.; Pasha, I.; Nadeem, M. Application of Fourier Transform infrared (FTIR) Spectroscopy for the identification of wheat varieties. J. Food Sci. Technol. 2013, 50, 1018–1023. [Google Scholar] [CrossRef]
- Wang, N.; Fu, Y.; Lim, L.T. Feasibility Study on Chemometric Discrimination of Roasted Arabica Coffees by Solvent Extraction and Fourier Transform infrared Spectroscopy. J. Agric. Food Chem. 2019, 59, 3220–3226. [Google Scholar] [CrossRef]
- Wang, J.; Jun, S.; Bittenbender, H.C.; Gautz, L.; Li, Q.X. Fourier Transform infrared Spectroscopy for Kona Coffee Authentication. J. Food Sci. 2009, 74, C385–C391. [Google Scholar] [CrossRef]
- Reis, N.; Franca, A.S.; Oliveira, L.S. Performance of diffuse reflectance infrared Fourier transform spectroscopy and chemometrics for detection of multiple adulterants in roasted and ground coffee. LWT-Food Sci. Technol. 2013, 53, 395–401. [Google Scholar] [CrossRef]
- Craig, A.P.; Franca, A.S.; Oliveira, L.S.; Irudayaraj, J.; Ileleji, K. Application of elastic net and infrared spectroscopy in the discrimination between defective and non-defective roasted coffees. Talanta 2014, 128, 393–400. [Google Scholar] [CrossRef]
- Kemsley, E.K.; Ruault, S.; Wilson, R.H. Discrimination between Coffea arabica and Coffea canephora variant robusta beans using infrared spectroscopy. Food Chem. 1995, 54, 321–326. [Google Scholar] [CrossRef]


| Techniques | Items | Model | |||
|---|---|---|---|---|---|
| SVMC 5 | SVMR 6 | ||||
| Cal 7 | Pred 8 | Cal | Pred | ||
| NIR-HSI 1 | Number of samples | 206 | 102 | 136 | 66 |
| % Concentration of Robusta 3 | 0–1 | 0–1 | 0–100 | 1–98 | |
| Mean (%) | 0.64 | 0.65 | 50.24 | 49.50 | |
| SD 4 (%) | 0.48 | 0.48 | 29.54 | 28.79 | |
| FTIRs 2 | Number of samples | 206 | 102 | 136 | 66 |
| % Concentration of Robusta | 0–1 | 0–1 | 0–100 | 1–98 | |
| Mean (%) | 0.64 | 0.65 | 50.24 | 49.50 | |
| SD (%) | 0.48 | 0.48 | 29.54 | 28.79 | |
| Model | Technique | Number of Samples | Pre-Treatment | % Accuracy | % Specificity | % Sensitivity | % Error Rate | |||||
|---|---|---|---|---|---|---|---|---|---|---|---|---|
| Cal | Pred | Cal 6 | Pred 7 | Cal | Pred | Cal | Pred | Cal | Pred | |||
| SVMC 1 | NIR-HSI 2 | 206 | 102 | SNV 4 | 99.03 | 98.04 | 100 | 100 | 97.37 | 94.74 | 0.97 | 1.96 |
| FTIRs 3 | 206 | 102 | 1st derivative 5 + SNV | 97.09 | 97.06 | 100 | 100 | 92.50 | 92.31 | 2.91 | 3 | |
| Model | Technique | Number of Samples | Pre-Treatment | R2c | R2cv | R2p | RMSEC 9 (%) | RMSECV 10 (%) | RMSEP 11 (%) | |
|---|---|---|---|---|---|---|---|---|---|---|
| Cal 4 | Pred 5 | |||||||||
| SVMR 1 | NIR-HSI 2 | 178 | 88 | 1st derivative 6 | 0.970 | 0.953 | 0.958 | 4.66 | 5.86 | 5.35 |
| FTIRs 3 | 131 | 63 | 2nd derivative 7 + SNV 8 | 0.965 | 0.913 | 0.951 | 5.85 | 9.04 | 6.96 | |
Publisher’s Note: MDPI stays neutral with regard to jurisdictional claims in published maps and institutional affiliations. |
© 2022 by the authors. Licensee MDPI, Basel, Switzerland. This article is an open access article distributed under the terms and conditions of the Creative Commons Attribution (CC BY) license (https://creativecommons.org/licenses/by/4.0/).
Share and Cite
Sahachairungrueng, W.; Meechan, C.; Veerachat, N.; Thompson, A.K.; Teerachaichayut, S. Assessing the Levels of Robusta and Arabica in Roasted Ground Coffee Using NIR Hyperspectral Imaging and FTIR Spectroscopy. Foods 2022, 11, 3122. https://doi.org/10.3390/foods11193122
Sahachairungrueng W, Meechan C, Veerachat N, Thompson AK, Teerachaichayut S. Assessing the Levels of Robusta and Arabica in Roasted Ground Coffee Using NIR Hyperspectral Imaging and FTIR Spectroscopy. Foods. 2022; 11(19):3122. https://doi.org/10.3390/foods11193122
Chicago/Turabian StyleSahachairungrueng, Woranitta, Chanyanuch Meechan, Nutchaya Veerachat, Anthony Keith Thompson, and Sontisuk Teerachaichayut. 2022. "Assessing the Levels of Robusta and Arabica in Roasted Ground Coffee Using NIR Hyperspectral Imaging and FTIR Spectroscopy" Foods 11, no. 19: 3122. https://doi.org/10.3390/foods11193122
APA StyleSahachairungrueng, W., Meechan, C., Veerachat, N., Thompson, A. K., & Teerachaichayut, S. (2022). Assessing the Levels of Robusta and Arabica in Roasted Ground Coffee Using NIR Hyperspectral Imaging and FTIR Spectroscopy. Foods, 11(19), 3122. https://doi.org/10.3390/foods11193122