Article

Correlation and Difference between Core Micro-Organisms and Volatile Compounds of Suan Rou from Six Regions of China

1
Key Laboratory of Plant Resource Conservation and Germplasm Innovation in Mountainous Region (Ministry of Education), College of Life Sciences, Guizhou University, Guiyang 550025, China
2
Guizhou Province Key Laboratory of Agricultural and Animal Products Storage and Processing, School of Liquor and Food Engineering, Guizhou University, Guiyang 550025, China
3
Chili Pepper Research Institute, Guizhou Provincial Academy of Agricultural Sciences, Guiyang 550006, China
4
Department of Agricultural, Food and Nutritional Science, 4–10 Ag/For Building, University of Alberta, Edmonton, AB T6G 2P5, Canada
*
Author to whom correspondence should be addressed.
Foods 2022, 11(17), 2708; https://doi.org/10.3390/foods11172708
Submission received: 16 August 2022 / Revised: 2 September 2022 / Accepted: 2 September 2022 / Published: 5 September 2022
(This article belongs to the Special Issue Factors Affecting Flavour, Taste and Colour of Meat)

Abstract

:
Suan Rou (SR), a traditional fermented meat, is widely favored by consumers due to its unique flavor and characteristics. To study the relationship between the core differential micro-organisms and differential volatile organic compounds (VOCs) of SR from six regions of China, high-throughput sequencing (HTS) and gas-chromatography–ion mobility spectrometry (GC-IMS) technologies were used to analyze the correlation between micro-organisms and VOCs in SR from Xiangxi of Hunan, Rongshui of Guangxi, Zunyi of Guizhou, Jinping of Guizhou, Congjiang of Guizhou, and Libo of Guizhou. A total of 13 core micro-organisms were identified at the genus level. Moreover, 95 VOCs were identified in the SR samples by GC-IMS analysis, with alcohols, aldehydes, ketones, and esters comprising the major VOCs among all the samples. The results showed a strong correlation (|r| > 0.8, p < 0.05) between the core differential micro-organisms and differential VOCs, including four bacteria, five fungi, and 12 VOCs. Pediococcus, Debaryomyces, Zygosaccharomyces, and Candida significantly contributed to the unique VOCs of SR.

1. Introduction

Meat is a staple food in the human diet due to its high nutritional and biological values. As a traditional and important meat processing technology, fermentation provides meat with a longer shelf life [1,2,3], higher safety [4], better nutritional value, and a richer aroma and taste [5]. An accumulation of studies has reported that the unique flavor of fermented meat products is not only related to the enzymes in the raw meat but also closely related to the various micro-organisms that are involved in the natural fermentation process [6]. Micro-organisms affect the flavor of fermented meat products by participating in (1) the hydrolysis and self-oxidation of lipids in the raw meat [7,8], (2) the hydrolysis of proteins and carbohydrates [9,10,11], (3) the formation of amino acid and peptide derivatives with flavor activity [12], and (4) the formation of volatile organic compounds (VOCs) [13].
Suan Rou (SR) is a type of traditional fermented meat product with rich dietary and cultural connotations and unique regional and national characteristics. It is an important meat product for the Dong, Miao, and Buyi ethnic minorities in China, with a history of more than 2000 years. The product is prepared by mixing pork, salt, and other ingredients such as rice, pepper, chili, and garlic, and naturally fermenting them in an anaerobic environment for 1–2 months. The final product is widely favored by consumers due to its unique flavor, nutritional value, and non-greasy characteristics. However, the differences in environmental climate, production technology, raw materials, ingredients, and many other factors in different regions induce significant differentiation in the types and metabolic characteristics of microflora, thus forming their regional flavor characteristics. Therefore, researchers usually pay close attention to the microflora, protein, fat [8,14], flavor formation [15], and VOCs in fermented meat products [16], to ensure the stability of product quality and for the realization of industrial, modern, and large-scale production.
According to the region, SR can be classified into SR of Hunan, SR of Guangxi, and SR of Chongqing and Guizhou. Although there are relevant studies on the processing technology [17], flavor substances [18], and microbial colony structure [19,20], of Chinese traditional SR, these researches are mostly limited to the comparative analysis between the samples in the same or seldom regions [17,21]. Even if there is a comparison of products among provinces, only the impact of bacteria on VOCs has been analyzed, but the correlation analysis between core differential micro-organisms (bacteria and fungi) and differential VOCs is not deep enough to simultaneously compare samples from different provinces and regions of the same province. Therefore, 18 SR samples were collected from six representative regions: Xiangxi of Hunan, Rongshui of Guangxi, Zunyi of Guizhou, Jinping of Guizhou, Congjiang of Guizhou, and Libo of Guizhou, and their core differential micro-organisms and differential VOCs were analyzed by high-throughput sequencing (HTS) and gas-chromatography-ion mobility spectrometry (GC-IMS) techniques. The core differential micro-organisms and differential VOCs were determined by bidirectional orthogonal projections to latent structure-discriminant analysis (O2PLS-DA), and their interaction was evaluated by Spearman’s correlation coefficient analysis.

2. Materials and Methods

2.1. Sample Collection

A total of 18 SR samples were collected from local producers in six different representative producing regions of China. The raw and auxiliary materials of each sample group are listed in Table 1. The preparation methods of each group were similar: wash and slice the fresh pork, knead and decorate with 4–5% salt and 10% rice flour or millet according to local convention. These ratios were computed with the proportions of the raw meat. Next, the corresponding excipients were added, mixed through evenly, put into the fermentation container and sealed tightly to prevent the exchange of oxygen with the outside environment during the fermentation process, and naturally fermented for about 2 months according to the local natural environmental conditions. Finally, the completely fermented samples were collected and stored at −80 °C until use. Three samples that weighed 500 g each were collected.

2.2. DNA Extraction and Sequencing

2.2.1. Total Genomic DNA Extraction and PCR Amplification

The total microbial genomic DNA was extracted from the SR samples using the FastDNA® Spin Kit for Soil (MP Biomedicals, Irvine, CA, USA) according to the manufacturer’s instructions. The quality and concentration of DNA were determined by 1.0% agarose gel electrophoresis and NanoDrop® ND-2000 spectrophotometry (Thermo Fisher Scientific, Inc., Waltham, MA, USA).
The primer pairs of the bacterial and fungal genes were 338F (5′-ACTCCTACGGGAGGCAGCAG-3′) and 806R (5′-GGACTACHVGGGTWTCTAAT-3′) [22], ITS1F (5′-CTTGGTCATTTAGAGGAAGTAA-3′), and ITS2R (5′-GCTGCGTTCTTCATCGATGC-3′) [23], respectively. The PCR reaction mixture is presented in Table 2. The PCR amplification cycling conditions were as follows: initial denaturation at 95 °C for 3 min, followed by 28 cycles of denaturing for bacteria and 40 cycles for fungi of denaturing at 95 °C for 30 s, annealing at 55 °C for 30 s, and extension at 72 °C for 45 s, and single extension at 72 °C for 10 min, and terminated at 4 °C. All samples were amplified in triplicate. The PCR product was extracted from a 2% agarose gel, purified using an AxyPrep DNA Gel Extraction Kit (Axygen Biosciences, Union City, CA, USA) according to the manufacturer’s instructions, and quantified using a Quantus™ Fluorometer (Promega, Madison, WI, USA).

2.2.2. Illumina Sequencing and Bioinformatics Processing

The purified amplicons were pooled in equimolar amounts and paired-end sequenced on an Illumina MiSeq PE300 platform (Illumina, San Diego, CA, USA) according to the standard protocols reported by Majorbio Bio-Pharm Technology Co. Ltd. (Shanghai, China).

2.2.3. Data Processing

The raw data were submitted to the NCBI Sequence Read Archive (SRA), with the accession number PRJNA860537. A bioinformatics analysis was performed using the Majorbio Cloud platform (https://cloud.majorbio.com (accessed on 1 May 2022)). The gene sequences from each sample were rarefied to 20,000, which yielded an average Good’s coverage of 99.99%. Based on the OTUs information, the rarefaction curves and alpha diversity indices, including the observed OTUs, Chao1 richness, Shannon index, and Good’s coverage were calculated using Mothur v1.30.1 (https://www.mothur.org/wiki/Download_mothur, accessed on 1 May 2022). The similarity among the microbial communities in different samples was determined by a principal coordinate analysis (PCoA) based on Bray-Curtis dissimilarity using the R’s Vegan v2.5-3 package. The percentage of variation explained by the treatment was assessed by a PERMANOVA test, and its statistical significance was determined using the Vegan v2.5-3 package. The significantly abundant taxa (phylum to genera) of bacteria among the different groups (LDA score > 4, p < 0.05) were identified by the linear discriminant analysis (LDA) effect size (LEfSe) (http://huttenhower.sph.harvard.edu/LEfSe (accessed on 1 May 2022)).

2.3. Analysis of Volatile Compounds

The VOCs in each sample group were detected using the GC-IMS flavor analyzer (FlavourSpec ®, G.A.S. Dortmund, Germany). The procedure was as follows: The sample (2 g) was ground at a low temperature and placed in a 20 mL headspace vial, incubated at 60 °C for 20 min, and then the 500 μL headspace sample was automatically injected into the injector at 85 °C through a heated syringe (non-shunt mode). The sample was transferred into an MXT-5 capillary column (15 m × 0.53 mm, film thickness 1 μm) (Restek, Bellefonte, PA, USA) through high-purity nitrogen (99.99%) and introduced into an ionization chamber after elution at 60 °C (isothermal mode). The sample was later scanned in the drift tube, and each spectrum was scanned 12 times. The VOCs were identified by comparing their retention index and drift time with the standards in the GC-IMS library. The relative quantification of VOCs was based on the peak signal intensity. The fingerprint of VOCs was constructed using GalleryPlot (FlavourSpec ®, G.A.S. Dortmund, Germany) supported by a GC-IMS instrument.

2.4. Statistical Analysis

The statistical and Spearman’s correlation analyses were performed using the Statistical Package for the Social Sciences (SPSS 19.0, IBM, Inc., Armonk, NY, USA), and the significances among the groups were evaluated using the multiple comparative analysis of variance (ANOVA). The microbial data were analyzed on the online platform of Majorbio Cloud Platform (www.majorbio.com (accessed on 1 May 2022)). The major flavor compounds were screened and analyzed by the principal component analysis (PCA), O2PLS-DA, and permutations plot using SIMCA® (version 14.1, Sartorius Stedim Data Analytics AB, Umeå, Sweden). The results of a Spearman’s correlation analysis indicated that the relationship between the micro-organisms and flavor substances was established by Gephi (0.9.25) (https://gephi.org/ (accessed on 1 May 2022)), and the network map was optimized using the Cytoscape (3.9.1) software (http://www.cytoscape.org/ (accessed on 1 May 2022)). All the experiments were performed in triplicate, and the data are expressed as the means ± standard deviations.

3. Results and Discussion

3.1. Microbial Community Characteristics of SR from Different Regions

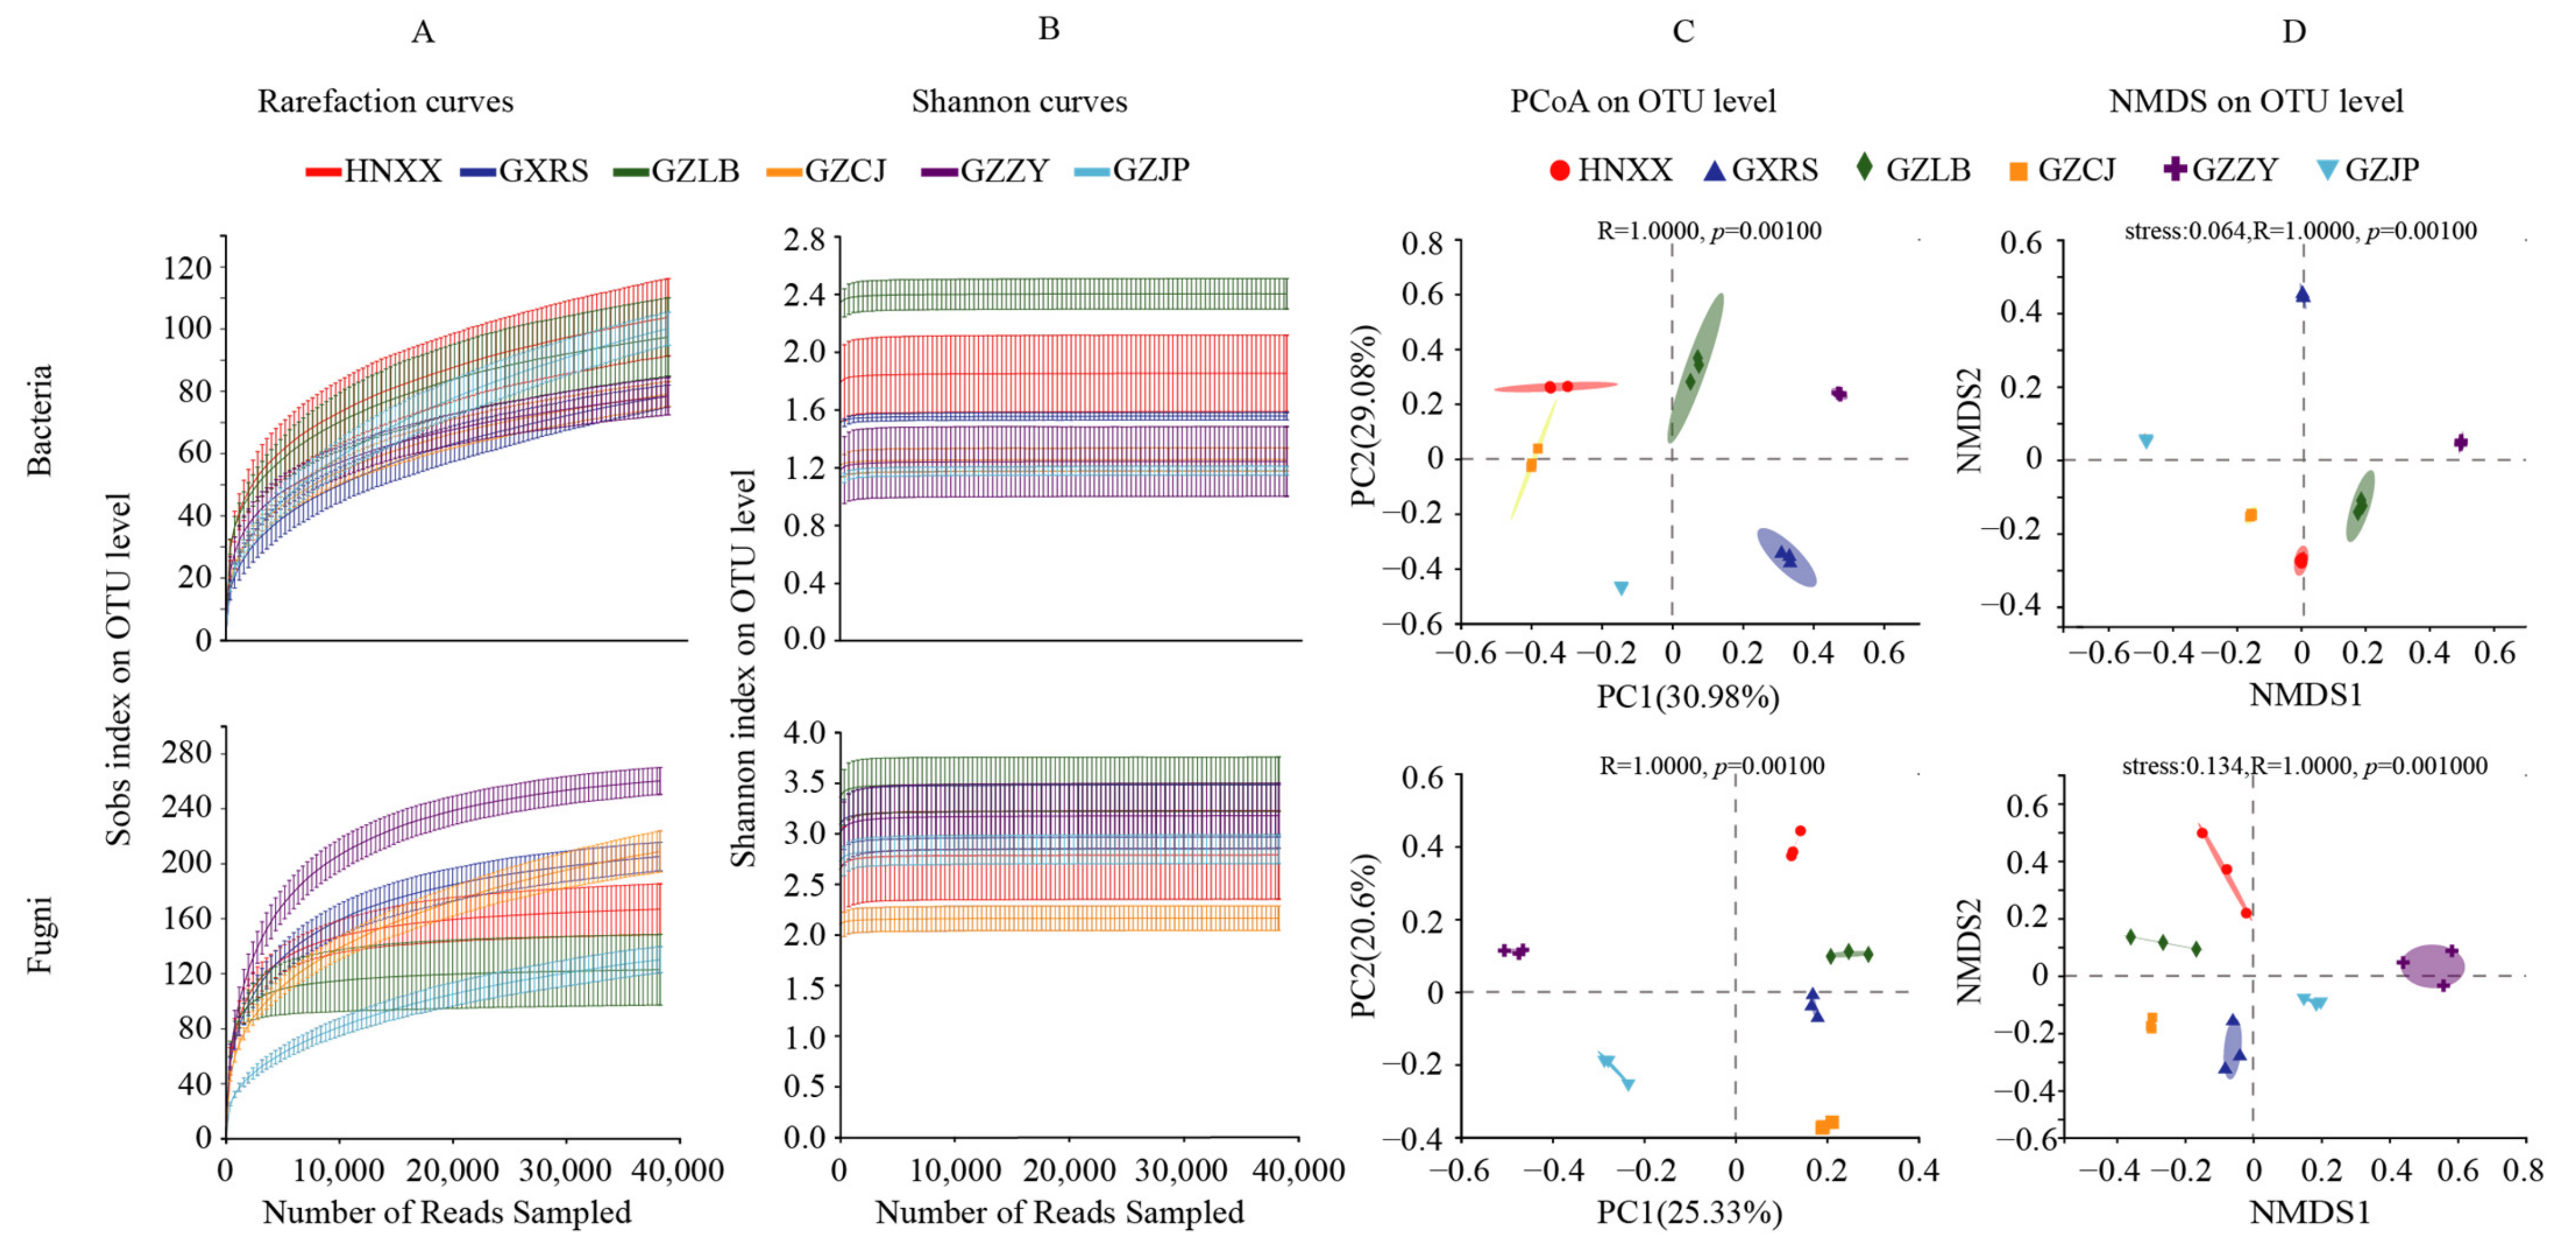
3.1.1. Abundance and Diversity of Bacterial and Fungi

Two high-quality sequences, i.e., 1,236,441 16s rRNA and 1,232,142 ITS1 were obtained from 18 SR samples by HTS. The sequences of all the samples were clustered according to the 97% similarity level, and 279 OTUs of bacteria and 846 OTUs of fungi were obtained. The dilution curve and Shannon index curve were close to the saturation platform, indicating that the sequencing data could cover almost all the micro-organisms in the sample, which is sufficient for subsequent analysis (Figure 1A,B). The alpha diversity of the microbial communities in the SR samples was represented by the Shannon, Simpson, Chao1, and ACE indices. A higher Shannon index indicates a higher alpha diversity of the microbial community in the SR samples, while the Simpson index had the opposite response The Chao1 and ACE indices represent the richness of microflora, and a higher value indicates that the microflora is richer. The α-diversity index is summarized in Table 3. There was no significant difference in the Shannon, Simpson, ACE, and Chao1 indices among the different groups of bacteria, indicating that all the samples showed similar trends in bacterial richness and diversity. There were some significant differences in the α-diversity index among the different groups of fungi, with HNXX showing the highest fungal diversity and GZZY showing the highest fungal richness. The β-diversity of the bacteria and fungi in each sample group was analyzed by NMDS and PCoA analyses. The variability and similarity of the microbial population structure in different SR samples are illustrated in Figure 1C,D.

Microbial Composition Analysis

The sequencing data of bacteria and fungi were analyzed at the phylum and genus levels to further study the community structure of each sample (Figure 2). A total of 12 bacterial phyla and 7 fungal phyla were identified at the phylum level in the 18 SR samples. Only those with microbial abundance greater than 1% are depicted in Figure 2, and the rest were merged with the others. The bacterial communities of the samples mainly included Firmicutes bacteria, and the proportion in each group was more than 95%, followed by Proteobacteria and other bacteria with a microbial abundance of less than 1% (Figure 2A). The results were consistent with those reported by Lv [12], and Wang [24]. Firmicutes accounted for the highest proportion in GXRS (99%), followed by GXJP (98%), GZCJ (98%), GZZY (97%), GZLB (96%), and HNXX (95%). Except for GZCJ, the fungal communities of all the samples were mainly Ascomycota, followed by Basidiomycota, unclassified fungi, and other fungi with microbial abundances less than 1%, and the proportion of Ascomycota and Basidiomycota was more than 93% (Figure 2B). However, the dominant fungi in GZCJ were Basidiomycota (59%) and Ascomycota (41%) (Figure 2B).
A total of 130 bacterial genera were identified in 18 SR samples, with Lactobacillus, Weissella, Lactococcus, Leuconostoc, Pediococcus, Staphylococcus, Enterobacter, Teragenococcus, and Macrococcus comprising the core genera (opposite abundance top 10) (Figure 2A). Lactobacillus had the highest abundance in GXRS (98.18%), followed by GZZY (81.13%), GZCJ (73.39%), GZLB (72.86%), HNXX (47.56%), and GZJP (28.80%). Lactobacillus can release various enzymes during growth and metabolism and convert the substrates in raw meat into the aroma and flavor substances of fermented meat products [25]. The relative abundance of Weissella detected in GZJP was 61.21%, which was much higher than that in other samples. The relative abundance of Lactococcus in HNXX (40.37%) was the highest, while the relative abundance of Leuconostoc in GZZY (7.56%) was higher than that in other groups. The relative abundance of Staphylococcus in GZLB and GZCJ was relatively high, accounting for 2.02% and 2.21%, respectively, while the relative abundance of Pediococcus in HNXX, GZLB, and GZZY was 1.71%, 2.04%, and 2.29%, respectively. Notably, the relative abundance of Staphylococcus and Pediococcus in the GZLB samples was higher than that in the other groups, and these two bacteria could mainly improve the flavor mainly through the metabolism of proteins and lipids [6,26]. Other core bacteria also existed at different proportions in all the SR samples.
A total of 291 fungal genera were identified in all the samples, and the top ten most abundant genera were Wallemia, Aspergillus, Kodamaea, Candida, Gibberella, Debaryomyces, Zygosaccharomyces, Ogataea, Kazachstania, and Cystofilobasidium (Figure 2B). Debaryomyces and Candida were the common fungi in fermented meat products, which could stabilize the color of meat products through their deoxygenation ability and promote the flavor formation of fermented meat products by decomposing the lipids and proteins through the enzymes [27]. Debaryomyces had the highest relative abundance in GZLB (14.47%), followed by GXRS (7.66%), which has been widely used as an auxiliary starter. It is not only a beneficial fungus in Panxian ham [28], but also an important fungus in the fermentation and ripening of sausage [29]. Candida had the highest relative abundance in GZZY (19.53%), and it plays a vital role in the formation of meat flavor and can promote the decomposition of protein in fermented meat products [30]. Mi [31], reported that Kazachstania was one of the core fungi in sour meat. In some fermented foods, Kazachstania could produce VOCs, which play a vital role in the formation of fermented food flavor. It was reported that Aspergillus has excellent antibacterial activity and antioxidant properties in meat products [32], with the highest content in HNXX (34.89%).

Microbial Difference Analysis

The micro-organisms with significant abundance differences among the SR samples were detected using the non-parametric factorial Kruskal-Wallis (KW) sum-rank test. The LEfSe analysis (Figure 3) results showed that the differences in the genus level of each group were mainly composed of 29 microbial species (7 species of bacteria and 22 species of fungi), 5 core bacterial species (Enterobacter, Lactococcus, Weissella, Lactobacillus, and Pediococcus), and 8 core fungal species (Wallemia, Aspergillus, Kodamaea, Candida, Gibberella, Debaryomyces, Zygosaccharomyces, Cystofilobasidium). Weissella, Pediococcus, Lactococcus, Lactobacillus, Debaryomyces, Candida, Kodamaea, and Gibberella were found that could enhance the aroma characteristics of fermented food. Therefore, their abundance differences in different samples might directly or indirectly affect the composition of VOCs.
The analysis also revealed that there were some differences in the microbial composition of SR samples from different provinces and different regions of the same province, which might have been influenced by the raw materials, ingredients, production environment, fermentation temperature, and relative humidity.

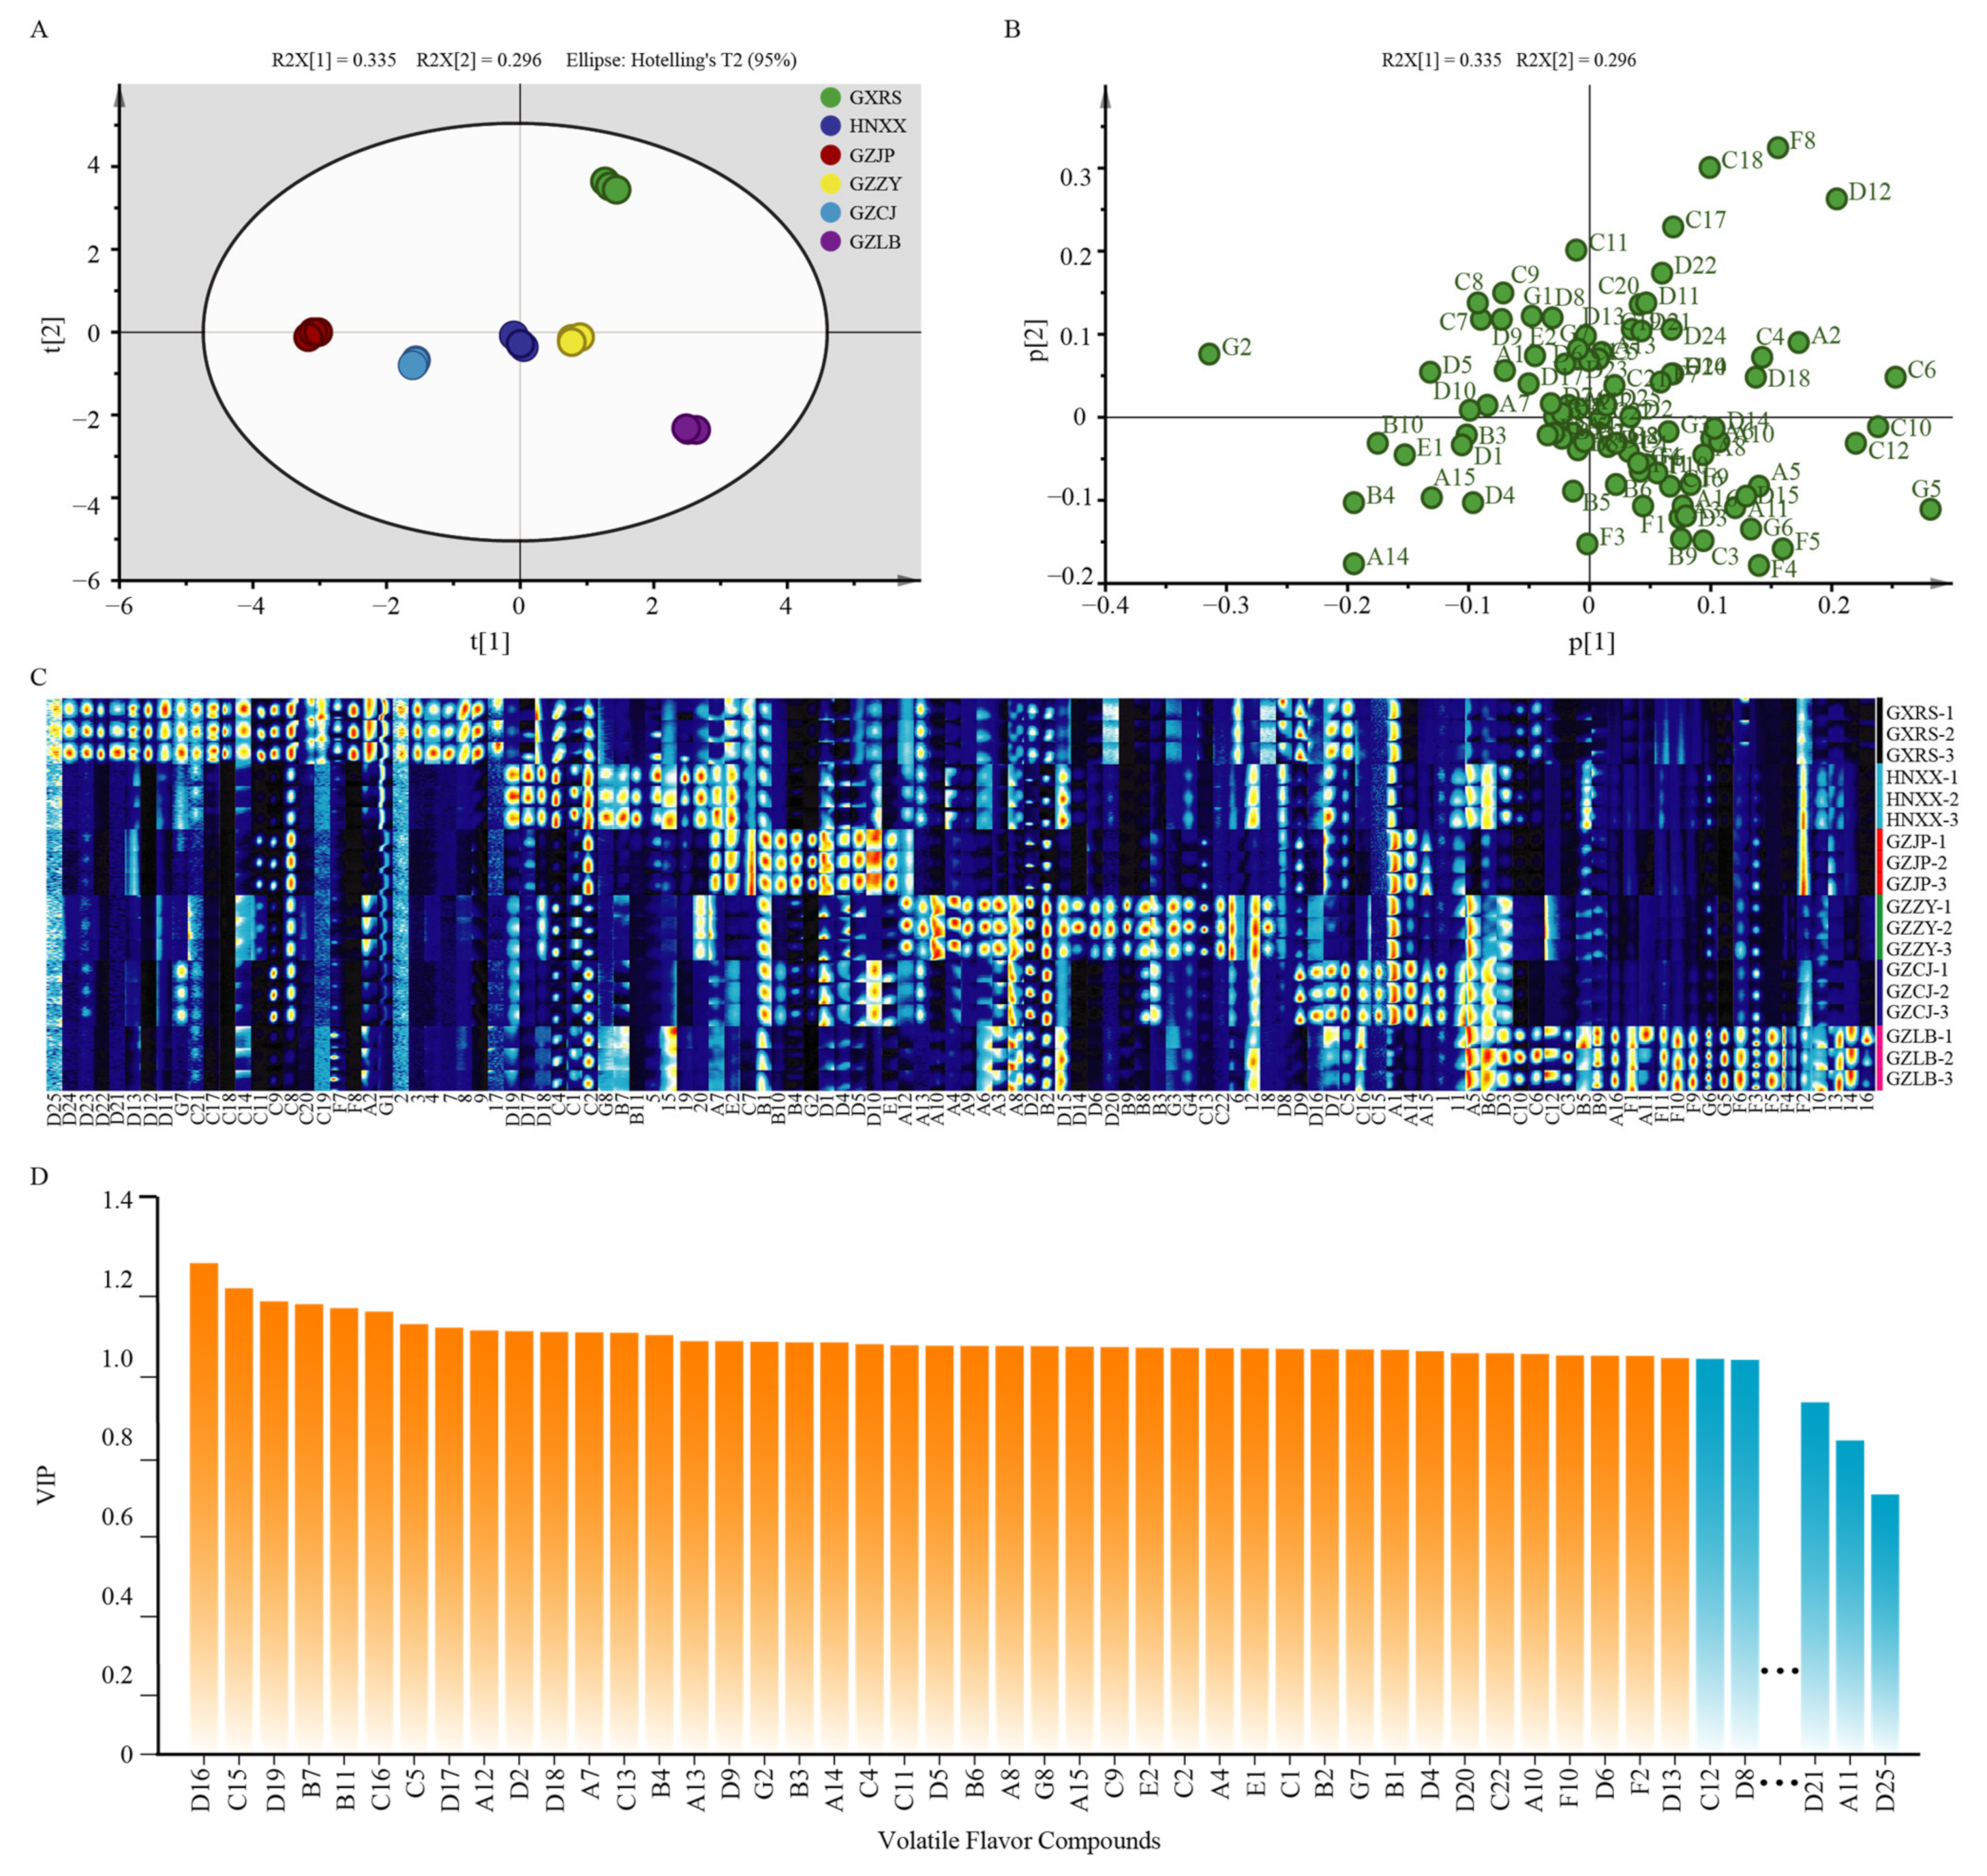
3.2. Flavor Compounds Analysis

GC-IMS is an effective method for the separation and sensitive detection of VOCs [33]. The VOCs in 18 SR samples were detected by the GC-IMS technique. A total of 104 VOCs were detected and 95 were identified, including 84 monomer compounds and 11 monomer polymer compounds. These compounds were composed of 21 aldehydes, 19 esters, 16 alcohols, 11 ketones, 8 alkenes, 2 acids, and 7 other compounds (Table 4). As shown in Table 4, the composition of VOCs was generally similar among the samples, but the content was different. Overall, the alcohols, ketones, and aldehydes in Guizhou SR were higher than those in Hunan and Guangxi, while esters were on the contrary. Acids in GZJP were the highest, followed by HNXX, GZCJ, GXRS, GZZY, and GZLB. Alkenes in GXRS were the highest among the samples. These differences may be caused by the differences in environmental climate, raw materials, and many other factors in different regions. According to the PCA (Figure 4A,B) and GalleryPlot (Figure 4C) results, there were differences in the VOCs among the samples of each group, indicating that the composition and proportion of VOCs in the SR samples from different provinces and different regions of the same province were different.
The differences in the abundance of VOCs in these samples were then detected by O2PLS-DA. The Permutations Plot helps to assess the risk that the model is spurious. The results of the permutations plot were shown that all R2-values and Q2-values to the left are lower than the original points to the right, and the regression line of the Q2-points intersects below zero, which means the original model was valid (Figure S1). The influence of each difference in metabolite accumulation on each sample classification and its explanatory power was investigated according to the projection variable importance (VIP) score. VIP ≥ 1 was the screening criteria for common differential metabolites [34]. A total of 42 VOCs were found to have significant differences among the samples (VIP > 1, p < 0.05) (Figure 4D), including 8 alcohols, 7 ketones, 10 esters, 10 aldehydes, 2 acids, 2 olefins, and 3 other compounds.
Alcohols are the essential flavor components and are closely related to lipid oxidation, amino acid metabolism, methyl ketone reduction, and microbial reproduction [35]. In this study, eight types of alcohols were detected with significant differences among the samples, including 1-penten-3-ol, (Z)-2-pentenol, 1-pentanol, 1-hexanol, 1-octen-3-ol, 1-octanol, linalool, and cis-p-menth-2-en-1-ol. The content of 1-pentanol was relatively high in the GZZY, GZCJ, and GZLB samples, while the relative content of 1-hexanol in the GZZY samples was significantly higher than that in the other groups. Linalool was abundant in the GZJP and GZCJ samples and significantly differed from the other groups. 1-octen-3-ol is a common unsaturated alcohol in fermented meat products with a low odor threshold that is oxidized by arachidonic acid and has a mushroom and flower scent [36]. In this study, 1-octen-3-ol was found in all samples, but its content was high in GZZY, which was consistent with the results of Wang [24]. Previous studies have reported that 1-hexanol and 1-octen-3-ol are one of the primary flavor components of Dong sour meat [19,24].
Ketones, the primary source of animal and plant fat flavor, can be produced by automatic lipid oxidation and microbial metabolism. In this study, the 7 ketones, namely 2-propanone, 2-butanone, 2-pentanone, 3-hydroxy-2-butanone, 2-hexanone, dihydro-2-methyl-3(2H) furanone, and coumarin showed significant differences among all the samples. Among them, the contents of 2-propanone and 2-butanone were relatively high. However, the contents of dihydro-2-methyl-3(2H) furanone and coumarin in the HNXX samples were significantly higher than those in the other groups, showing a more abundant ketone flavor.
Esters were the primary VOCs in all SR samples with a special fruit flavor. After meat fermentation, the short-chain acids were esterified with alcohol to form the esters. In this study, 10 different esters were detected, including 1 polymer, such as methyl acetate, ethyl acetate, propyl acetate, ethyl 2-methyl propanoate, ethyl 3-methyl butanoate, propyl butanoate, ethyl hexanoate, ethyl 2-hydroxy-4-methyl pentanoate, and geranyl acetate. Among them, ethyl acetate, propyl acetate, ethyl 2-methyl propanoate, and ethyl 3-methyl butanoate were abundant. Ethyl hexanoate was detected in all the samples and showed significant differences among the samples. It has been reported that ethyl hexanoate is the main flavor substance of Dong sour meat [31]. These ethyl esters contribute to the fruit and creamy flavor of sour meat, thereby promoting the formation of a sour meat flavor quality.
Aldehydes, another essential flavor substance, are mainly derived from the oxidation of unsaturated fatty acids. The odor threshold of these substances is low and most of them have a fruity aroma, contributing to the overall flavor of processed meat products [31]. In this study, the 10 aldehydes, namely butanal, 2-methylbutanal, pentanal, (E)-2-pentenal, hexanal (dimer), benzaldehyde, 2,4-heptadienal, octanal, benzeneacetaldehyde, and nonanal showed significant differences among the SR samples. Hexanal is obtained from the oxidation of n-6 fatty acids (oleic acid and arachidonic acid) with a strong raw fat flavor, which is a unique flavor substance in fresh meat. It could be an indicator of the oxidation level in the fermented meat and imparts a green grass odor [37]. However, excessive hexanal can lead to rotten odors, while nonanal and other linear aldehydes contribute to a sour meat flavor.
The volatile acids in fermented meat are mainly produced by the hydrolysis of phospholipids and triglycerides and lipid oxidation. The low odor threshold of short-chain acid (C < 6) contributes to the formation of aroma and flavor characteristics in fermented meat, thus affecting the flavor formation of fermented meat products [38]. In contrast to other previous reports [18,24], only two volatile acids, i.e., propanoicacid and 3-methylbutanoicacid, were detected in this study. Propanoic acid was only found in the GZJP, GZZY, and GZCJ samples. This result might be due to the esterification of acids with alcohols to form esters, resulting in low contents of acids that were below the detection line and undetectable. The decrease in the acidity of the sample depends on the realization of non-volatile acids, which can be inferred from the type and content of esters.
Among the alkenes, alpha-pinene and gamma-terpinene with citrus and lemon aroma were significantly different in the 18 samples, providing abundant flavor to SR. Other flavor compounds formed by the maillard reaction during the fermentation were pyrazine, furan, ether, and sulfur compounds. Among these volatile compounds, 3 kinds of volatile compounds showed significant differences, including dimethyl disulfide, 2,3-diethyl-5-methyl pyrazine, and methyl chavicol. However, dimethyl disulfide was not detected in GZZY and GZLB.

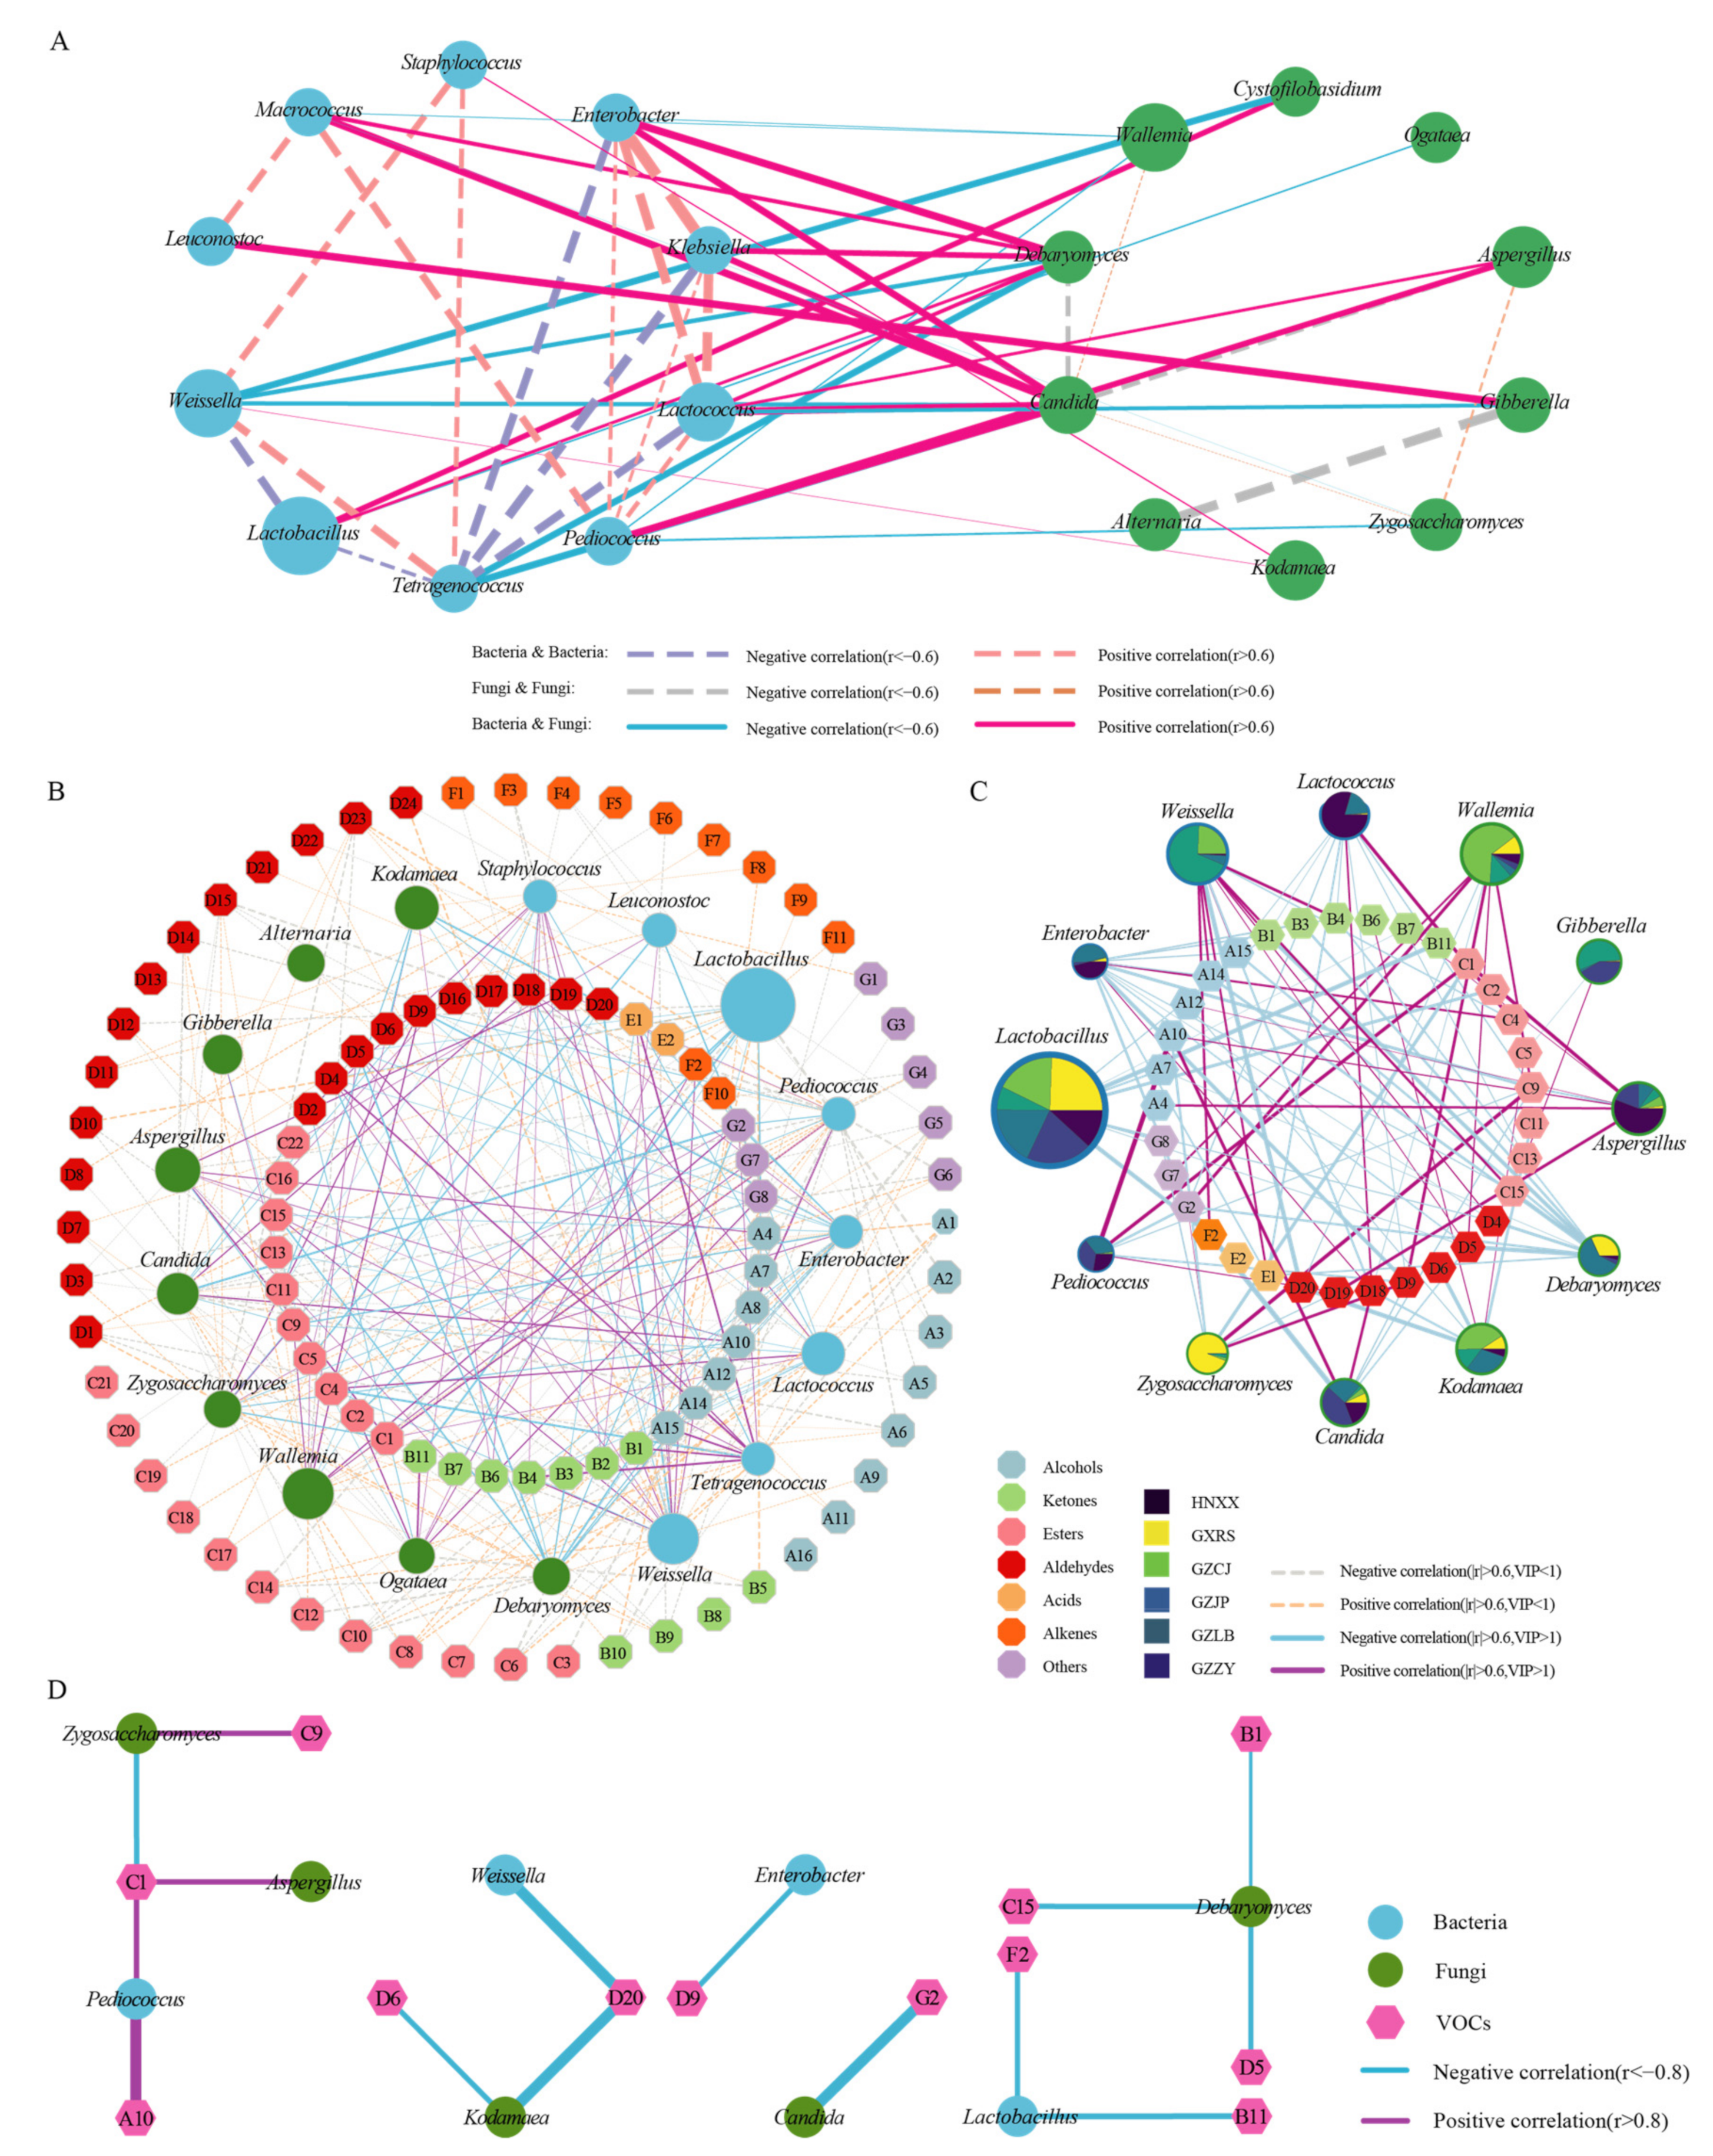
3.3. Co-Occurrence and Exclusion Analyses Revealed the Relationships between Different Microbes

Microbial interactions are essential factors that affect the microbial structure. The interaction between the micro-organisms was investigated by Spearman’s correlation coefficients and p-values to construct a network diagram of the core bacteria and fungi (Figure 5A). According to the correlation analysis results, the interaction between the bacteria was more abundant than that in the fungi, and there was a positive correlation between Pediococcus and Lactococcus; Klebsiella, Enterobacter, and Macrococcus (|r| > 0.6, p < 0.05). Teragenococcus, Weissella, and Staphylococcus were in a mutually reinforcing relationship with each other, and Teragenococcus was negatively correlated with Enterobacter, Klebsiella, Lactobacillus, and Lactococcus (|r| > 0.6, p < 0.05). There was a positive correlation between Enterobacter, Klebsiella, and Lactococcus; and Macrococcus and Leuconostoc, while there was a negative correlation between Lactobacillus and Weissella (|r| > 0.6, p < 0.05). As for the fungi, Candida showed a positive relationship with Wallemia and Zygosaccharomyces, but a negative relationship with Debaryomyces and Aspergillus (|r| > 0.6, p < 0.05). There was a positive correlation between Aspergillus and Zygosaccharomyces, but a negative correlation between Gibberella and Alternaria (|r| > 0.6, p < 0.05).
The network diagram indicates that the bacteria and fungi share a close relationship with each other. Candida and Debaryomyces had the most abundant relationship with bacteria, which positively correlated with Enterobacter, Klebsiella, Macrococcus, and Lactococcus, but negatively correlated with Tetragenococcus and Weissella (|r| > 0.6, p < 0.05). Candida and Aspergillus, Debaryomyces and Cystofilobasidium, Kodamaea, and Gibberella positively correlated with Pediococcus, Lactobacillus, Staphylococcus, and Leuconostoc (|r| > 0.6, p < 0.05), respectively. Wallemia negatively correlated with Enterobacter and Wallemia and Zygosaccharomyces negatively correlated with Macrococcus and Pediococcus (|r| > 0.6, p < 0.05). Cystofilobasidium, Gibberella, and Ogataea negatively correlated with Weissella, Lactococcus, and Lactobacillus (|r| > 0.6, p < 0.05), respectively.

3.4. Correlations between Micro-Organisms and Volatile Organic Compounds

The interaction between VOCs and major micro-organisms (relative abundance top 10) in the SR samples from different regions was studied using Spearman’s correlation coefficient. The results showed that 8 bacterial species and 9 fungal species shared a significant correlation with 82 species and 67 species of VOCs, respectively (|r| > 0.6, p < 0.05). As shown in Figure 5B that the bacteria associated with less than 10 species of VOCs were Leuconostoc (9 species), and the fungi were Alternaria (1 species), Gibberella (3 species), and Kodamaea (8 species). The bacteria associated with more than 10 species of VOCs were Staphylococcus (19 species), Tetragenococcus (18 species), and Lactococcus (18 species), and fungi were Aspergillus (14 species), Ogataea (14 species), Wallemia (18 species), and Zygosaccharomyces (19 species). The bacteria associated with more than 20 species of VOCs were Pediococcus (27 species), Weissella (25 species), Lactobacillus (25 species), and Enterobacter (23 species), and fungi were Candida (21 species), and Debaryomyces (22 species). Although there were more fungal species related to VOCs than bacteria, fine bacteria could affect more VOCs than fungi.
Additionally, the correlation between the core differential micro-organisms (five bacteria and eight fungi) and 42 differential VOCs (VIP ≥ 1) was analyzed. Finally, five bacterial genera (Lactococcus, Pediococcus, Weissella, Lactobacillus, and Enterobacter) and seven fungal genera (Candida, Debaryomyces, Gibberella, Wallemia, Aspergillus, Zygosaccharomyces and Gibberella) were correlated with 35 species and 35 species of VOCs (|r| > 0.6, p < 0.05), respectively (Figure 5C). As for bacteria, Enterobacter, Weissella, Lactococcus, Lactobacillus, and Pediococcus were related to 14, 12, 11, 10, and 6 types of VOCs, respectively. Lactobacillus, Lactococcus, and Weissella are beneficial to human health and are often used as starters in fermented products. Weissella was positively correlated with 9 types of VOCs, followed by Lactococcus (three kinds), while Lactobacillus was negatively correlated with 10 types of VOCs (|r| > 0.6, p < 0.05). They play a key role in flavor formation and can increase the content of some metabolites, such as acids and alcohols [39]. These metabolites were positively correlated with methyl acetate, linalool, and cis-p-menth-2en-1-ol (|r| > 0.6, p < 0.05). These bacteria have been widely used in the production of fermented food due to their ability to increase the content of organic acids, short-chain fatty acids, and esters. Pediococcus plays an important role in the formation of the final flavor quality of fermented meat products [40]. In this study, Pediococcus had a significantly positive correlation with three volatile compounds, including hexanol, methyl acetate, and benzeneacetaldehyde, but a significantly negative correlation with ethyl 3-methyl butanoate, hexanal, and dimethyl disulfide (|r| > 0.6, p < 0.05). This correlation might be related to their ability to produce high contents of protease, which promote the hydrolysis of proteins to produce free amino acids, thereby contributing to the formation of VOCs [41]. Although Enterobacter was correlated with 14 types of VOCs, most were negatively correlated with 12 species but positively correlated with 1-penten-3-ol and octanal (r > 0.6, p < 0.05). Notably, although Staphylococcus and Tetragenococcus affected 42 types of differential VOCs, there was no difference in the bacterial composition of each sample. Therefore, it was inferred that these bacteria might have contributed to the flavor composition of the sample, but they were not the primary micro-organisms affecting the flavor differences.
The fungi Debaryomyces and Wallemia correlated with 11 and 8 types of VOCs, respectively. Aspergillus, Kodamaea, and Zygosaccharomyces were associated with seven types of VOCs. Candida and Gibberella were associated with six and two types of VOCs (r > 0.6, p < 0.05), respectively. Aspergillus, Candida, and Debaryomyces are the essential factors in fermented meat products [42]. The primary VOCs of SR come from the decomposition of proteins and the transformation of amino acids by yeast. Most yeasts were positively correlated with alcohols and esters, while Aspergillus and Candida promoted the production of higher alcohols, acetates, and fatty acid esters. Debaryomyces was positively correlated with esters and aldehydes but negatively correlated with higher alcohols and ketones (r > 0.6, p < 0.05). This might be because Debaryomyces promotes esterification and oxidation, thus consuming alcohols to form esters. Wallemia and Zygosaccharomyces were positively correlated with six and three types of VOCs and negatively correlated with two and four types of VOCs, respectively. They also contributed to the composition of meat flavor substances, and Zygosaccharomyces could release important flavor compounds [43], such as fusel alcohols and the derivatives of 4-hydroxyfuranone. These compounds have soy sauce and smoked flavors, and contribute to the composition of flavor substances in the sample. Although Ogataea had some effect on different flavor substances, there was no significant difference in each sample group. Therefore, it might have contributed somewhat to the flavor of samples, but cannot affect the differences in VOCs among the samples.
After further stringent requirements on the correlation coefficient, a strong correlation was found between the core differential micro-organisms and differential VOCs (Figure 5D), including four bacteria, five fungi, and 12 VOCs (|r| > 0.8, p < 0.05). Methyl acetate and nonanal, which contributed to the flavor of SR [44], were significantly influenced by the bacteria and fungi. The bacteria had a strong correlation with one alcohol, one ketone, one ester, two aldehydes, and one alkene. Pediococcus and Lactobacillus could affect more VOCs than other bacteria, and Pediococcus had a positive correlation with 1-hexanol, which is the primary substance of SR flavor [19,24]. However, other bacteria had a negative correlation with the VOCs. The results showed that Pediococcus had a positive contribution to the formation of the characteristic flavors of SR in different regions. The fungi were strongly correlated with one ketone, three esters, three aldehydes, and one disulfide. It was also observed that the fungi mainly affected the esters and aldehydes. Debaryomyces could affect more VOCs than the other fungi, followed by Zygosaccharomyces. It is noteworthy that Candida has a negative correlation with Dimethyl disulfide with an unpleasant odor and contributes to the formation of the special flavor of SR.

4. Conclusions

This study reports the differences in microbial community composition and VOCs of SR from six regions of China. The analysis of micro-organisms showed that the core differential micro-organisms were primarily composed of five bacterial species and eight fungal species. The bacteria had a significant effect on ketones and esters (7 species and 10 species, respectively), while the fungi had a significant effect on alcohols and aldehydes (5 species and 7 species, respectively). There was a strong correlation between nine core differential micro-organisms and 12 differential VOCs. Pediococcus, Debaryomyces, Zygosaccharomyces, and Candida had positive effects on the formation of the special VOCs of SR. The relationship between the core differential micro-organisms and differential VOCs provides a strong basis for the further study of VOCs from the microbial ecology of traditional fermented meat products. Proteomics and other multi-group methods combined with the threshold of VOCs are the potential methods for exploring the relationship between the VOCs. In addition, determining the key aroma compounds of SR and relative microbial metabolic pathways could help broaden the industrial production of traditional SR.

Supplementary Materials

The following supporting information can be downloaded at: https://www.mdpi.com/article/10.3390/foods11172708/s1, Figure S1: The Permutations Plot for O2PLS-DA. The triangle represents R2, the four-pointed star represents Q2, and the dotted line represents their respective regression lines.

Author Contributions

Conceptualization, K.L. and Q.Z.; methodology, K.L., X.W. and Q.Z.; software, K.L., X.W. and Y.Z.; validation, K.L., J.W. and H.L.; formal analysis, K.L.; investigation, Q.Z.; resources, X.W.; data curation, Q.Z.; writing—original draft preparation, K.L., X.W., Q.Z. and Y.Z.; writing—review and editing, J.W. and H.L.; project administration, Q.Z., J.W. and Y.Z. All authors have read and agreed to the published version of the manuscript.

Funding

This work was supported by the Guizhou High-level Innovative Talent Training Project (Qianke Cooperation Platform Talent number [2016] 5662), Guizhou Science and Technology Innovation Talent Team of Ecological Characteristic Meat Products (QKHPTRC [2020] 5004).

Institutional Review Board Statement

Not applicable.

Informed Consent Statement

Not applicable.

Data Availability Statement

The raw data have been submitted to the NCBI Sequence Read Archive (SRA), with the accession number PRJNA860537.

Conflicts of Interest

The authors declare that there are no known competing financial interest or personal relationships that could influence the work reported.

References

  1. Şanlier, N.; Gökcen, B.B.; Sezgin, A.C. Health benefits of fermented foods. Crit. Rev. Food Sci. Nutr. 2019, 59, 506–527. [Google Scholar] [CrossRef] [PubMed]
  2. Voidarou, C.; Antoniadou, Μ.; Rozos, G.; Tzora, A.; Skoufos, I.; Varzakas, T.; Lagiou, A.; Bezirtzoglou, E. Fermentative Foods: Microbiology, Biochemistry, Potential Human Health Benefits and Public Health Issues. Foods 2020, 10, 69. [Google Scholar] [CrossRef] [PubMed]
  3. Liu, Y.L.; Yu, Q.L.; Wan, Z.; Li, H.Y.; Liu, J.; Wang, J. Effect of Antioxidant Activity of Starter Cultures on the Quality of Fermented Meat Products: A Review. Food Sci. 2021, 42, 302–312. [Google Scholar] [CrossRef]
  4. Rul, F.; Béra-Maillet, C.; Champomier-Vergès, M.C.; El-Mecherfi, K.E.; Foligné, B.; Michalski, M.C.; Milenkovic, D.; Savary-Auzeloux, I. Underlying evidence for the health benefits of fermented foods in humans. Food Funct. 2022, 13, 4804–4824. [Google Scholar] [CrossRef]
  5. Chen, X.; Mi, R.; Qi, B.; Xiong, S.; Li, J.; Qu, C.; Qiao, X.; Chen, W.; Wang, S. Effect of proteolytic starter culture isolated from Chinese Dong fermented pork (Nanx Wudl) on microbiological, biochemical and organoleptic attributes in dry fermented sausages. Food Sci. Hum. Well. 2021, 10, 13–22. [Google Scholar] [CrossRef]
  6. Zhang, Y.; Hu, P.; Xie, Y.; Wang, X. Co-fermentation with Lactobacillus curvatus LAB26 and Pediococcus pentosaceus SWU73571 for improving quality and safety of sour meat. Meat Sci. 2020, 170, 108240. [Google Scholar] [CrossRef]
  7. Mariutti, R.B.L.; Bragagnolo, N. Influence of salt on lipid oxidation in meat and seafood products: A review. Food Res. Int. 2017, 94, 90–100. [Google Scholar] [CrossRef]
  8. Flores, M. Understanding the implications of current health trends on the aroma of wet and dry cured meat products. Meat Sci. 2018, 144, 53–61. [Google Scholar] [CrossRef]
  9. Gan, X.; Li, H.; Wang, Z.; Emara, A.M.; Zhang, D.; He, Z. Does protein oxidation affect proteolysis in low sodium Chinese traditional bacon processing? Meat Sci. 2019, 150, 14–22. [Google Scholar] [CrossRef]
  10. Zhu, Y.; Wang, P.; Guo, L.; Wang, J.; Han, R.; Sun, J.; Yang, Q. Effects of partial replacement of sodium nitrite with Lactobacillus pentosus inoculation on quality of fermented sausages. J. Food Process Pres. 2019, 43, e13932. [Google Scholar] [CrossRef]
  11. Wang, Y.; Han, J.; Wang, D.X.; Gao, F.; Zhang, K.P.; Tian, J.J.; Jin, Y. Research Update on the Impact of Lactic Acid Bacteria on the Substance Metabolism, Flavor, and Quality Characteristics of Fermented Meat Products. Foods 2022, 11, 2090. [Google Scholar] [CrossRef]
  12. Lv, J.; Xu, W.; Ji, C.; Liang, H.; Li, S.; Yang, Z.; Zhang, S.; Lin, X. Relationships between the bacterial diversity and metabolites of a Chinese fermented pork product, sour meat. Int. J. Food Sci. Tech. 2020, 56, 2742–2750. [Google Scholar] [CrossRef]
  13. Yao, Y.; Zhou, X.; Hadiatullah, H.; Zhang, J.; Zhao, G. Determination of microbial diversities and aroma characteristics of Beitang shrimp paste. Food Chem. 2020, 344, 128695. [Google Scholar] [CrossRef]
  14. Almeida, M.A.D.; Saldaña, E.; Pinto, J.S.D.S.; Palacios, J.; Contreras-Castillo, C.J.; Sentandreu, M.A.; Fadda, S.G. A peptidomic approach of meat protein degradation in a low-sodium fermented sausage model using autochthonous starter cultures. Food Res. Int. 2018, 109, 368–379. [Google Scholar] [CrossRef]
  15. Wen, R.; Sun, F.; Li, X.; Chen, Q.; Kong, B. The potential correlations between the fungal communities and volatile compounds of traditional dry sausages from Northeast China. Food Microbiol. 2021, 98, 103787. [Google Scholar] [CrossRef]
  16. Bis-Souza, C.V.; Pateiro, M.; Dominguez, R.; Lorenzo, J.M.; Penna, A.L.B.; Barretto, A.C.D. Volatile profile of fermented sausages with commercial probiotic strains and fructooligosaccharides. J. Food Sci. Tech. Mys. 2019, 56, 5465–5473. [Google Scholar] [CrossRef]
  17. Zeng, X.; Meng, J.; Zhang, W.; He, L.; Deng, L.; Ye, C. Changes in the microbiological, physicochemical properties of Chinese traditional fermented Suan rou at ripening fermentation. Food Sci. Nutr. 2021, 9, 5899–5913. [Google Scholar] [CrossRef]
  18. Zhong, A.; Chen, W.; Duan, Y.; Li, K.; Tang, X.; Tian, X.; Wu, Z.; Li, Z.; Wang, Y.; Wang, C. The potential correlation between microbial communities and flavors in traditional fermented sour meat. LWT-Food Sci. Technol. 2021, 149, 111873. [Google Scholar] [CrossRef]
  19. Lv, J.; Yang, Z.; Xu, W.; Li, S.; Liang, H.; Ji, C.; Yu, C.; Zhu, B.; Lin, X. Relationships between bacterial community and metabolites of Suan Rou at different temperature during the fermentation. Int. J. Food Microbiol. 2019, 307, 108286. [Google Scholar] [CrossRef]
  20. Emiel, V.R.; Christina, C.; David, V.V.; Wim, B.; Luc, D.V.; Stefan, W.; Frédéric, L. Application of a High-Throughput Amplicon Sequencing Method to Chart the Bacterial Communities that Are Associated with European Fermented Meats from Different Origins. Foods 2020, 9, 1247. [Google Scholar] [CrossRef]
  21. Wang, Z.; Wang, Z.; Ji, L.; Zhang, J.; Zhao, Z.; Zhang, R.; Bai, T.; Hou, B.; Zhang, Y.; Liu, D.; et al. A Review: Microbial Diversity and Function of Fermented Meat Products in China. Front. Microbiol. 2021, 12, 645435. [Google Scholar] [CrossRef] [PubMed]
  22. Jiang, L.; Su, W.; Mu, Y.; Mu, Y.C. Major metabolites and microbial community of fermented black glutinous rice wine with different starters. Front. Microbiol. 2020, 11, 593. [Google Scholar] [CrossRef] [PubMed]
  23. Buée, M.; Reich, M.; Murat, C.; Morin, E.; Nilsson, R.H.; Uroz, S.; Martin, F. 454 pyrosequencing analyses of forest soils reveal an unexpectedly high fungal diversity. New Phytol. 2009, 184, 449–456. [Google Scholar] [CrossRef] [PubMed]
  24. Wang, H.; Su, W.; Mu, Y.; Zhao, C. Correlation Between Microbial Diversity and Volatile Flavor Compounds of Suan Zuo rou, a Fermented Meat Product From Guizhou, China. Front. Microbiol. 2021, 12, 736525. [Google Scholar] [CrossRef]
  25. Wang, M.; Wang, C.; Yang, C.; Peng, L.; Xie, Q.; Zheng, R.; Dai, Y.; Liu, S.; Peng, X. Effects of Lactobacillus plantarum C7 and Staphylococcus warneri S6 on flavor quality and bacterial diversity of fermented meat rice, a traditional Chinese food. Food Res. Int. 2021, 150, 110745. [Google Scholar] [CrossRef]
  26. Laranjo, M.; Potes, M.E.; Elias, M. Role of Starter Cultures on the Safety of Fermented Meat Products. Front. Microbiol. 2019, 10, 853. [Google Scholar] [CrossRef]
  27. Murgia, M.A.; Marongiu, A.; Aponte, M.; Blaiotta, G.; Deiana, P.; Mangia, N.P. Impact of a selected Debaryomyces hansenii strain’s inoculation on the quality of Sardinian fermented sausages. Food Res. Int. 2019, 121, 144–150. [Google Scholar] [CrossRef]
  28. Mu, Y.; Su, W.; Mu, Y.; Jiang, L. Combined Application of High-Throughput Sequencing and Metabolomics Reveals Metabolically Active Microorganisms During Panxian Ham Processing. Front. Microbiol. 2019, 10, 3012. [Google Scholar] [CrossRef]
  29. Corral, S.; Belloch, C.; López-Díez, J.J.; Flores, M. Lipolysis and aroma generation as mechanisms involved in masking boar taint in sodium reduced fermented sausages inoculated with Debaryomyces hansenii yeast. J. Sci. Food Agr. 2018, 98, 2121–2130. [Google Scholar] [CrossRef]
  30. Li, X.; Eu, A.; Liu, S. Effect of co-fermentation and sequential fermentation of Candida versatilis and Lactococcus lactis subsp. cremoris on unsalted pork hydrolysates components. Int. J. Food Sci. Tech. 2021, 56, 6451–6462. [Google Scholar] [CrossRef]
  31. Mi, R.; Chen, X.; Xiong, S.; Qi, B.; Li, J.; Qiao, X.; Chen, W.; Qu, C.; Wang, S. Predominant yeasts in Chinese Dong fermented pork (Nanx Wudl) and their aroma-producing properties in fermented sausage condition. Food Sci. Hum. Well. 2021, 10, 231–240. [Google Scholar] [CrossRef]
  32. Peromingo, B.; Andrade, M.J.; Delgado, J.; Sánchez-Montero, L.; Núñez, F. Biocontrol of aflatoxigenic Aspergillus parasiticus by native Debaryomyces hansenii in dry-cured meat products. Food Microbiol. 2019, 82, 269–276. [Google Scholar] [CrossRef]
  33. He, W.; Ren, F.; Wang, Y.; Gao, X.; Wang, X.; Dai, X.; Song, J. Application of GC-IMS in Detection of Food Flavor Substances. Proceedings of 2020 International Conference on Green Chemical and 2020 International Conference on Green Chemical and Environmental Science (ICGCES 2020), Qing Dao, China, 12 June 2020. [Google Scholar]
  34. Giannetti, V.; Mariani, M.B.; Mannino, P.; Marini, F. Volatile fraction analysis by HS-SPME/GC-MS and chemometric modeling for traceability of apples cultivated in the Northeast Italy. Food Control 2017, 78, 215–221. [Google Scholar] [CrossRef]
  35. Lin, H.; Yu, X.; Fang, J.; Lu, Y.; Liu, P.; Xing, Y.; Wang, Q.; Che, Z.; He, Q. Flavor compounds in Pixian broad-bean paste: Non-volatile organic acids and amino acids. Molecules 2018, 23, 1299. [Google Scholar] [CrossRef]
  36. Olivares, A.; Navarro, J.L.; Flores, M. Effect of fat content on aroma generation during processing of dry fermented sausages. Meat Sci. 2011, 87, 264–273. [Google Scholar] [CrossRef]
  37. Shi, Y.; Li, X.; Huang, A. A metabolomics-based approach investigates volatile flavor formation and characteristic compounds of the Dahe black pig dry-cured ham. Meat Sci. 2019, 158, 107904. [Google Scholar] [CrossRef]
  38. Sidira, M.; Kandylis, P.; Kanellaki, M.; Kourkoutas, Y. Effect of immobilized Lactobacillus casei on the evolution of flavor compounds in probiotic dry-fermented sausages during ripening. Meat Sci. 2016, 100, 41–51. [Google Scholar] [CrossRef] [PubMed]
  39. Juárez-Castelán, C.; García-Cano, I.; Escobar-Zepeda, A.; Azaola-Espinosa, A.; Álvarez-Cisneros, Y.; Ponce-Alquicira, E. Evaluation of the bacterial diversity of Spanish-type chorizo during the ripening process using high-throughput sequencing and physicochemical characterization. Meat Sci. 2018, 150, 7–13. [Google Scholar] [CrossRef]
  40. Iacumin, L.; Osualdini, M.; Bovolenta, S.; Boscolo, D.; Chiesa, L.; Panseri, S.; Comi, G. Microbial, chemico-physical and volatile aromatic compounds characterization of Pitina PGI, a peculiar sausage-like product of North East Italy. Meat Sci. 2020, 163, 108081. [Google Scholar] [CrossRef]
  41. Cruxen, C.E.S.; Funck, G.D.; Dannenberg, G.S.; Haubert, L.; Marques, J.L.; Kroning, I.S.; Chaves, F.C.; Silva, W.P.; Fiorentini, Â.M. Characterization of Staphylococcus xylosus LQ3 and its application in dried cured sausage. LWT-Food Sci. Technol. 2017, 86, 538–543. [Google Scholar] [CrossRef]
  42. Ai, M.; Qiu, X.; Huang, J.; Wu, C.; Jin, Y.; Zhou, R. Characterizing the microbial diversity and major metabolites of Sichuan bran vinegar augmented by Monascus purpureus. Int. J. Food Microbiol. 2019, 292, 83–90. [Google Scholar] [CrossRef] [PubMed]
  43. Belleggia, L.; Ferrocino, I.; Reale, A.; Corvaglia, M.R.; Milanović, V.; Cesaro, C.; Boscaino, F.; Di, R.T.; Garofalo, C.; Cardinali, F.; et al. Unfolding microbiota and volatile organic compounds of Portuguese Painho de Porco Preto fermented sausages. Food Res. Int. 2022, 155, 111063. [Google Scholar] [CrossRef] [PubMed]
  44. Lorenzo, J.M.; Franco, D.; Carballo, J. Effect of the inclusion of chestnut in the finishing diet on volatile compounds during the manufacture of dry-cured “Lacon” from Celta pig breed. Meat Sci. 2014, 96, 211–233. [Google Scholar] [CrossRef] [PubMed]
Figure 1. Variations in the microbial diversity and community structure of SR from different regions. (A) Rarefaction curves of bacteria and fungi for each sample. (B) Shannon index curves of bacteria and fungi for each sample. (C,D) PcoA score plots and NMDS of bacteria and fungi.
Foods 11 02708 g001
Figure 2. Relative abundance of bacteria at the phylum and genus level (A) and fungi at the phylum and genus level (B) of SR from different regions.
Foods 11 02708 g002
Figure 3. LEfSe analysis diagram of each dominant taxa of bacteria (A) and fungi (B) during the fermentation of SR. Nodes with different colors indicate microbial groups that are significantly enriched in the corresponding groups and have a significant impact on the differences between groups; light yellow nodes indicate that there are no significant differences in different groups (p > 0.05). The legend on the right shows micro-organisms that have changed significantly at the genus level (p < 0.05).
Foods 11 02708 g003
Figure 4. Volatile organic compounds analysis of SR from different regions. (A) Principal component analysis (PCA) and (B) load diagram results for flavor metabolite contents in SZR samples. (C) Gallery Plot of SR from different regions. Each line in the figure represents all signal peaks selected from a sample. The brighter the color is, the stronger the signal is, and the darker the color is, the weaker the signal is. (D) The variation of VIP (pred) values of VOCs in SR samples from different regions. Orange indicates VOCs with VIP > 1 and blue indicates VOCs with VIP < 1. All the VOCs with VIP > 1 and part of the VOCs with VIP < 1 are shown in the figure.
Foods 11 02708 g004
Figure 5. Correlation analysis. Statistical significance (p < 0.05), Spearman correlation coefficient (|r| > 0.6, |r| > 0.8) represents correlation. (A) Association network diagram of bacteria and fungi. The orange and green circles refer to bacteria and fungi, respectively, and the purple and blue lines refer to positive correlations (r > 0.6 and p < 0.05) and negative correlations (r < −0.6 and p < 0.05), respectively. (B) Correlation of major differential micro-organisms with all VOCs. The blue and green dots represent bacteria and fungi respectively, and the dot size is proportional to their relative abundance. Different VOC classifications are shown in different colors, with solid and dotted lines indicating positive correlations (r > 0.6 and p < 0.05) and negative correlations (r < −0.6 and p < 0.05), respectively. The thickness of each connection (edge) between the two dots is directly proportional to the value of the Spearman correlation coefficient. (C) Correlation between major differential micro-organisms and differential VOCs (VIP > 1). The blue and green circles represent bacteria and fungi respectively. The node size is in a positive proportion to its relative abundance. The pie chart represents the relative abundance of the micro-organism in different samples. Different VOC classifications are shown in different colors, with solid and dotted lines indicating positive correlations (r > 0.6 and p < 0.05) and negative correlations (r < −0.6 and p < 0.05), respectively. The thickness of each connection (edge) between the two nodes is directly proportional to the value of the Spearman correlation coefficient. (D) Correlation between core differential micro-organisms and differential VOCs. The blue and green circles represent bacteria and fungi respectively. The pink hexagon represents different VOCs. The solid lines indicate positive and negative correlations (|r| > 0.8, p < 0.05).
Foods 11 02708 g005
Table 1. Information about the Suan Rou samples tested in this study.
SampleProducersProduction LocationRaw MaterialFermented Conditions
HNXXLocal farmer 1Xiangxi Tujia and Miao Autonomous Prefecture, Hunan ProvincePork belly, Salt, Rice, PepperA sealed
fermented LNEC
GXRSLocal farmer 2Rongshui Miao Autonomous County, Liuzhou City, Guangxi Zhuang Autonomous RegionPork belly, Salt, ChiliA sealed
fermented LNEC
GZZYLocal farmer 3Zunyi City, Guizhou ProvincePork belly, Salt, RiceA sealed
fermented LNEC
GZLBLocal farmer 4Libo County, Qiannan Buyi and Miao Autonomous Prefecture, Guizhou ProvincePork belly, Salt, Millet, PepperA sealed
fermented LNEC
GZCJLocal farmer 5Congjiang County, Southeast Guizhou Miao and Dong Autonomous Prefecture, Guizhou ProvincePork belly, Salt, Millet, Chili, PepperA sealed
fermented LNEC
GZJPLocal farmer 6Jinping County, Southeast Guizhou Miao and Dong Autonomous Prefecture, Guizhou ProvincePork belly, Salt, Chili, PepperA sealed
fermented LNEC
Note: LNEC means local natural environment conditions.
Table 2. The PCR reaction mixture of bacteria and fungi.
BacteriaFungi
Template DNA10.0 ng10.0 ng
Primer F (5.0 μM)1.0 μL0.80 μL
Primer R (5.0 μM)1.0 μL0.80 μL
dNTPs (2.5 mM)2.0 μL2.0 μL
Fast Pfu polymerase0.50 μL0.20 μL
5× Fast Pfu buffer4.0 μL2.0 μL
ddH2OTo a final volume of 20.0 µL
Table 3. Richness and diversity of bacteria and fungi of SR from different regions.
Simple IDShannonSimpsonACEChao1
BacteriaFungiBacteriaFungiBacteriaFungiBacteriaFungi
HNXX2.08 ± 0.45 a3.50 ± 0.21 a0.23 ± 0.08 a0.06 ± 0.02 e135.91 ± 21.93 a136.11 ± 18.66 c136.15 ± 6.39 a137.83 ± 25.86 c
GXRS1.78 ± 0.39 a1.30 ± 0.36 c0.29 ± 0.09 a0.37 ± 0.09 c187.52 ± 43.89 a138.74 ± 20.28 c153.54 ± 19.70 a129.51 ± 25.23 c
GZCJ1.71 ± 0.48 a0.28 ± 0.03 d0.36 ± 0.16 a0.89 ± 0.00 a135.44 ± 32.43 a68.06 ± 12.70 d125.69 ± 27.57 a45.67 ± 17.33 d
GZLB1.94 ± 0.40 a3.22 ± 0.21 a,b0.25 ± 0.08 a0.09 ± 0.03 d,e148.85 ± 15.66 a217.38 ± 12.42 b145.66 ± 1.19 a220.91 ± 16.50 b
GZZY2.12 ± 0.27 a3.18 ± 0.27 a,b0.25 ± 0.11 a0.10 ± 0.03 d,e147.49 ± 10.41 a276.27 ± 13.84 a150.16 ± 18.67 a277.17 ± 12.55 a
GZJP1.57 ± 0.07 a0.82 ± 0.26 e0.41 ± 0.07 a0.69 ± 0.11 b134.76 ± 22.91 a89.12 ± 22.06 d130.16 ± 14.58 a,b78.33 ± 15.93 d
Values are presented as the mean ± standard deviation of quintuplicate (n = 3). Different letters in the same column represent significant differences (p < 0.05).
Table 4. GC-IMS detected volatiles of SR from different regions.
NO.Compound NameFormulaCASRelative Content (%)
GZRSHNXXGZJPGZZYGZCJGZLB
Alcohols (16) 11.81 ± 0.07 f17.97 ± 0.16 d19.9 ± 0.34 c29.38 ± 0.24 a25.1 ± 0.08 b16.52 ± 0.43 e
A1EthanolC64175C2H6O4.96 ± 0.1987 e5.70 ± 0.1975 d10.29 ± 0.1351 a8.24 ± 0.1165 c9.21 ± 0.0862 b2.35 ± 0.1598 f
A2PropanolC71238C3H8O2.81 ± 0.0364 a0.90 ± 0.0358 e0.28 ± 0.0220 f2.59 ± 0.0773 b1.06 ± 0.0414 d1.49 ± 0.0473 c
A3IsobutanolC78831C4H10O0.10 ± 0.0013 e0.21 ± 0.0169 d0.17 ± 0.0051 d0.94 ± 0.0399 a0.56 ± 0.0225 c0.66 ± 0.0528 b
A41-penten-3-olC616251C5H10O0.72 ± 0.0137 f2.87 ± 0.1810 b1.65 ± 0.0484 d4.03 ± 0.0317 a1.91 ± 0.0611 c0.95 ± 0.0507 e
A5IsopentanolC123513C5H12O0.84 ± 0.0378 c2.91 ± 0.0411 b0.34 ± 0.0361 d2.94 ± 0.1447 b2.96 ± 0.0426 b3.53 ± 0.0784 a
A62-methyl-1-butanolC137326C5H12O0.19 ± 0.0068 e0.29 ± 0.0401 c0.14 ± 0.0062 f0.60 ± 0.0083 a0.24 ± 0.0023 d0.41 ± 0.0084 b
A7(Z)-2-pentenolC1576950C5H10O0.13 ± 0.0055 d0.58 ± 0.0721 b0.72 ± 0.0275 a0.30 ± 0.0380 c0.19 ± 0.0019 d0.12 ± 0.0118 d
A81-pentanolC71410C5H12O0.86 ± 0.0172 d1.70 ± 0.0471 c0.48 ± 0.0358 e2.70 ± 0.0389 a2.59 ± 0.0216 a2.06 ± 0.1608 b
A93-methyl-1-pentanolC589355C6H14O0.11 ± 0.0071 c0.18 ± 0.0213 b,c0.22 ± 0.0011 b0.58 ± 0.1136 a0.22 ± 0.0045 b0.10 ± 0.0078 c
A101-hexanolC111273C6H14O0.29 ± 0.0272 c0.58 ± 0.083 b0.30 ± 0.0452 c3.92 ± 0.1271 a0.33 ± 0.0303 c0.62 ± 0.0304 b
A11(Z)-3-hexen-1-olC928961C6H12O0.06 ± 0.0073 b0.13 ± 0.0043 b0.05 ± 0.0009 b0.07 ± 0.0269 b0.17 ± 0.0096 b0.56 ± 0.3009 a
A121-octen-3-olC3391864C8H16O0.08 ± 0.0026 e0.21 ± 0.0050 b0.18 ± 0.0149 c0.30 ± 0.0165 a0.10 ± 0.0079 d0.08 ± 0.0054 d,e
A131-octanolC111875C8H18O0.20 ± 0.0044 b0.25 ± 0.0148 a0.10 ± 0.0125 c0.26 ± 0.0540 a0.29 ± 0.0061 a0.07 ± 0.0055 c
A14LinaloolC78706C10H18O0.07 ± 0.0032 d0.47 ± 0.0336 c3.33 ± 0.3002 a1.18 ± 0.0309 b3.57 ± 0.0733 a0.53 ± 0.0190 c
A15cis-p-menth-2-en-1-olC29803825C10H18O0.08 ± 0.0028 c0.23 ± 0.0050 b1.07 ± 0.1186 a0.34 ± 0.0178 b1.04 ± 0.0186 a0.29 ± 0.0070 b
A16alpha-terpineolC98555C10H18O0.32 ± 0.0329 c0.75 ± 0.0402 b0.61 ± 0.0463 b0.40 ± 0.0346 c0.68 ± 0.0337 b2.69 ± 0.1609 a
Ketones (11) 4.24 ± 0.14 e9.05 ± 0.29 d13.1 ± 0.38 b16.6 ± 0.35 a13.68 ± 0.47 b10.28 ± 0.46 c
B12-propanoneC67641C3H6O1.02 ± 0.0118 f1.46 ± 0.0938 d2.36 ± 0.0673 a1.93 ± 0.0232 c2.11 ± 0.0360 b1.24 ± 0.0584 e
B22-butanoneC78933C4H8O2.29 ± 0.0134 e2.30 ± 0.1082 e3.33 ± 0.2072 d7.75 ± 0.1029 a6.74 ± 0.1524 b4.43 ± 0.2777 c
B32-pentanoneC107879C5H10O0.14 ± 0.0070 c0.22 ± 0.0060 c0.62 ± 0.0371 b1.28 ± 0.0470 a1.31 ± 0.0982 a0.14 ± 0.0226 c
B43-hydroxy-2-butanoneC513860C4H8O20.09 ± 0.0052 e,f0.18 ± 0.0136 f4.31 ± 0.1561 a0.71 ± 0.1472 c1.10 ± 0.0550 b0.37 ± 0.0581 d
B54-methyl-3-penten-2-oneC141797C6H10O0.06 ± 0.0036 e0.43 ± 0.0666 a0.26 ± 0.0093 b,c0.12 ± 0.005 d,e0.18 ± 0.0012 c,d0.27 ± 0.0659 b
B62-hexanoneC591786C6H12O0.08 ± 0.0020 f0.30 ± 0.0126 c0.16 ± 0.0058 d0.12 ± 0.0168 e0.32 ± 0.0113b c0.34 ± 0.0244 a
B7Dihydro-2-methyl-3(2H)furanoneC3188009C5H8O20.03 ± 0.0006 d0.11 ± 0.0127 a0.04 ± 0.0034 c0.05 ± 0.002 c,d0.07 ± 0.0040 b0.04 ± 0.0046 c,d
B82-heptanoneC110430C7H14O0.05 ± 0.0045 c0.05 ± 0.0039 c0.08 ± 0.0106 c0.80 ± 0.0629 a0.45 ± 0.0807 b0.07 ± 0.0156 c
B93-octanoneC106683C8H16O0.28 ± 0.1059 d1.15 ± 0.1785 c0.99 ± 0.0878 c3.58 ± 0.2010 a0.89 ± 0.0387 c3.06 ± 0.3374 b
B106-methyl-5-hepten-2-oneC110930C8H14O0.04 ± 0.0052 d0.12 ± 0.0061 c0.51 ± 0.0172 a0.04 ± 0.004 d0.25 ± 0.0125 b0.06 ± 0.0048 d
B11CoumarinC91645C9H6O20.16 ± 0.0208 b2.76 ± 0.3605 a0.46 ± 0.1660 b0.24 ± 0.0190 b0.26 ± 0.0116 b0.25 ± 0.0331 b
Esters (22) 46.37 ± 0.09 a44.95 ± 0.69 a35.62 ± 0.58 b24.38 ± 0.64 c32.21 ± 0.65 d27.53 ± 1.46 e
C1Methyl acetateC79209C3H6O20.88 ± 0.0017 d3.10 ± 0.4606 a1.37 ± 0.0792 c2.26 ± 0.0315 b2.00 ± 0.0138 b2.05 ± 0.1902 b
C2Ethyl acetateC141786C4H8O29.56 ± 0.1527 d23.09 ± 0.1598 a19.99 ± 0.276 b6.22 ± 0.4258 e12.95 ± 0.3376 c12.51 ± 0.2807 c
C3Isopropyl acetateC108214C5H10O20.03 ± 0.0010 b0.07 ± 0.0032 b0.06 ± 0.0050 b0.09 ± 0.0120 b0.08 ± 0.0094 b0.36 ± 0.0702 a
C4Propyl acetateC109604C5H10O27.23 ± 0.1196 b10.54 ± 0.0565 a1.02 ± 0.0262 e3.97 ± 0.244 d3.29 ± 0.0682 f4.43 ± 0.3286 c
C5Ethyl 2-methylpropanoateC97621C6H12O22.15 ± 0.0096 b1.10 ± 0.1287 c1.03 ± 0.0846 c0.49 ± 0.038 d2.82 ± 0.0523 a1.10 ± 0.0878 c
C62-methylpropyl acetateC110190C6H12O20.51 ± 0.0207 b0.16 ± 0.0470 c0.05 ± 0.0012 c0.13 ± 0.0045 c0.06 ± 0.0055 c0.96 ± 0.2729 a
C7Methyl 3-methylbutanoateC556241C6H12O20.28 ± 0.0254 b0.32 ± 0.0250 b0.58 ± 0.0571 a0.09 ± 0.006 c,d0.15 ± 0.0065 c0.07 ± 0.0050 d
C8Ethyl butanoateC105544C6H12O23.54 ± 0.0363 b2.72 ± 0.0295 d4.85 ± 0.0927 a3.22 ± 0.0397 c3.28 ± 0.0316 c0.51 ± 0.0297 e
C9Ethyl 3-methylbutanoateC108645C7H14O23.68 ± 0.0484 b0.38 ± 0.0524 f2.34 ± 0.0673 c0.74 ± 0.044 d4.06 ± 0.0619 a0.56 ± 0.0662 e
C10Isoamyl acetateC123922C7H14O20.61 ± 0.0442 b0.60 ± 0.2229 b0.13 ± 0.0069 c0.65 ± 0.0099 c0.15 ± 0.0351 b2.07 ± 0.3881 a
C11Propyl butanoateC105668C7H14O21.15 ± 0.0852 b0.17 ± 0.0107 d0.96 ± 0.0165 c1.55 ± 0.0362 a0.15 ± 0.0082 d0.11 ± 0.0065 d
C12Methyl hexanoateC106707C7H14O20.08 ± 0.0013 c0.04 ± 0.0000 d0.26 ± 0.0144 b0.37 ± 0.0256 a
C13Ethyl hexanoateC123660C8H16O20.69 ± 0.0250 c0.36 ± 0.0298 d1.11 ± 0.0056 b1.93 ± 0.1395 a0.51 ± 0.0208 d0.37 ± 0.0930 d
C14Methyl heptanoateC106730C8H16O20.11 ± 0.0106 a0.07 ± 0.0033 c,d0.06 ± 0.0055 d0.09 ± 0.002 b,c0.07 ± 0.0041 d0.09 ± 0.0097 b
C15Ethyl 2-hydroxy-4-methylpentanoate-DC10348477C8H16O30.07 ± 0.0084 d0.11 ± 0.0094 b,c0.14 ± 0.0022 b0.11 ± 0.017 b,c0.24 ± 0.0216 a0.10 ± 0.0060 c
C16Ethyl 2-hydroxy-4-methylpentanoate-MC10348477C8H16O30.15 ± 0.0465 d0.21 ± 0.0244 c,d0.13 ± 0.0103 d0.30 ± 0.0075 c0.80 ± 0.0183 a0.59 ± 0.0908 b
C17Ethyl 3-hydroxyhexanoate-MC2305251C8H16O34.06 ± 0.0775 a0.71 ± 0.1820 b0.48 ± 0.0454 c0.35 ± 0.0308 c0.38 ± 0.0354 c0.33 ± 0.0180 c
C18Ethyl 3-hydroxyhexanoate-DC2305251C8H16O310.59 ± 0.382 a0.46 ± 0.0281 b0.48 ± 0.0129 b0.42 ± 0.0286 b0.45 ± 0.0378 b0.37 ± 0.0105 b
C19Ethyl heptanoate-DC106309C9H18O20.22 ± 0.0113 a0.09 ± 0.0048 c,d0.10 ± 0.0042 b0.09 ± 0.007 c,d0.10 ± 0.0036 c0.08 ± 0.0066 d
C20Ethyl heptanoate-MC106309C9H18O20.41 ± 0.0751 a0.16 ± 0.0633 c0.14 ± 0.0106 c0.30 ± 0.0205 b0.15 ± 0.0201 c0.09 ± 0.0110 c
C21(Z)-3-hexenyl butanoateC16491364C10H18O20.17 ± 0.0059 b,c0.19 ± 0.0232 a,b0.17 ± 0.0099 b,c0.21 ± 0.0127 a0.18 ± 0.0227 a,b0.14 ± 0.0044 c
C22Geranyl acetateC105873C12H20O20.23 ± 0.0248 d0.33 ± 0.0256 c0.44 ± 0.0350 b0.94 ± 0.0546 a0.34 ± 0.0289 c0.29 ± 0.0071 c,d
Aldehydes (25) 16.16 ± 0.11 c15.78 ± 0.65 c18.79 ± 0.76 a17.55 ± 0.69 b19.13 ± 0.16 a10 ± 0.04 d
D1PropanalC123386C3H6O0.82 ± 0.0626 f2.47 ± 0.1159 c5.36 ± 0.1381 a2.21 ± 0.011 d4.03 ± 0.0787 b1.25 ± 0.0483 e
D2ButanalC123728C4H8O2.00 ± 0.0091 c1.25 ± 0.0391 d1.99 ± 0.1079 c3.67 ± 0.0515 a3.78 ± 0.0348 a2.75 ± 0.2000 b
D33-methylbutanalC590863C5H10O0.15 ± 0.0067 c0.84 ± 0.0302 b0.21 ± 0.0166 c0.96 ± 0.049 a,b0.86 ± 0.0406 a,b0.98 ± 0.1069 a
D42-methylbutanalC96173C5H10O0.09 ± 0.0026 d0.40 ± 0.0081 c1.21 ± 0.0397 a0.67 ± 0.0614 b0.70 ± 0.0233 b0.38 ± 0.0114 c
D5PentanalC110623C5H10O0.25 ± 0.0066 d0.32 ± 0.0087 c1.32 ± 0.0241 a0.28 ± 0.072 c,d0.42 ± 0.0124 b0.13 ± 0.0129 e
D6(E)-2-pentenalC1576870C5H8O0.07 ± 0.0026 b0.15 ± 0.0053 b0.16 ± 0.0242 b0.67 ± 0.1905 a0.06 ± 0.0013 b0.03 ± 0.0005 b
D73-methyl-2-butenalC107868C5H8O0.11 ± 0.0099 b,c0.20 ± 0.0185 a0.19 ± 0.0149 a0.07 ± 0.0138 c0.19 ± 0.0109 a0.12 ± 0.0354 b
D8Hexanal-MC66251C6H12O1.31 ± 0.1736 b1.94 ± 0.1741 a1.34 ± 0.1765 b1.10 ± 0.0302 b0.66 ± 0.0293 c0.30 ± 0.0246 d
D9Hexanal-DC66251C6H12O3.50 ± 0.0904 b1.61 ± 0.0508 e3.18 ± 0.1823 c2.07 ± 0.102 d5.13 ± 0.1578 a0.69 ± 0.0736 f
D10MethionalC3268493C4H8OS0.05 ± 0.0536 d0.16 ± 0.1638 b0.24 ± 0.2373 a0.11 ± 0.1112 c0.06 ± 0.0037 d
D11HeptanalC111717C7H14O0.81 ± 0.1290 a0.43 ± 0.0297 b0.21 ± 0.0168 c0.25 ± 0.0164 c0.30 ± 0.0096 c0.18 ± 0.0095 c
D12(Z)-4-heptenal-DC6728310C7H12O2.47 ± 0.0436 a0.07 ± 0.0048 d0.07 ± 0.0092 d0.40 ± 0.0130 b0.07 ± 0.0099 d0.18 ± 0.0114 c
D13(Z)-4-heptenal-MC6728310C7H12O0.80 ± 0.0167 b0.57 ± 0.0944 c0.98 ± 0.0551 a0.28 ± 0.090 d0.24 ± 0.0264 d0.39 ± 0.0540 d
D14(E)-2-heptenal-DC18829555C7H12O0.04 ± 0.0036 b0.29 ± 0.0331 b0.04 ± 0.0000 b1.20 ± 0.4321 a0.04 ± 0.0000 b0.05 ± 0.0048 b
D15(E)-2-heptenal-MC18829555C7H12O0.12 ± 0.0079 d0.56 ± 0.0612 b0.11 ± 0.0222 d0.49 ± 0.0395 b0.21 ± 0.0017 c0.71 ± 0.0382 a
D16BenzaldehydeC100527C7H6O0.03 ± 0.0057 d0.08 ± 0.0083 b0.05 ± 0.0000 c,d0.05 ± 0.0045 c0.15 ± 0.0154 a0.05 ± 0.0026 c,d
D172,4-heptadienalC5910850C7H10O0.29 ± 0.0824 c1.50 ± 0.1896 a0.73 ± 0.0547 b0.37 ± 0.0155 c0.28 ± 0.0199 c0.18 ± 0.0164 c
D18OctanalC124130C8H16O0.55 ± 0.0617 c1.10 ± 0.0750 a0.15 ± 0.0076 d0.71 ± 0.0154 b0.22 ± 0.0048 d0.48 ± 0.0188 c
D19BenzeneacetaldehydeC122781C8H8O0.11 ± 0.0027 d0.69 ± 0.0465 a0.14 ± 0.0151 c,d0.40 ± 0.0358 b0.40 ± 0.0174 b0.18 ± 0.0178 c
D20NonanalC124196C9H18O0.15 ± 0.0079 b0.13 ± 0.0024 b,c0.1 ± 0.0070 d0.30 ± 0.0324 a0.08 ± 0.0059 d0.11 ± 0.0067 c,d
D21(Z)-4-decenal-DC21662099C10H18O0.15 ± 0.0370 a0.07 ± 0.0080 b0.07 ± 0.0023 b0.05 ± 0.0011 b0.06 ± 0.0074 b0.06 ± 0.0038 b
D22(Z)-4-decenal-MC21662099C10H18O1.39 ± 0.1362 a0.31 ± 0.0131 c,d0.28 ± 0.0506 c,d0.62 ± 0.0394 b0.35 ± 0.0241 c0.19 ± 0.0083 d
D232-decenalC3913711C10H18O0.40 ± 0.0201 a0.24 ± 0.0291 c,d0.34 ± 0.0028 b0.28 ± 0.0077 c0.40 ± 0.0174 a0.22 ± 0.0137 d
D24(E,E)-2,4-nonadienalC5910872C9H14O0.30 ± 0.0269 a0.13 ± 0.0119 c0.11 ± 0.0093 c0.17 ± 0.0051 b0.11 ± 0.0072 c0.12 ± 0.0072 c
D25(E,E)-2,4-decadienalC25152845C10H16O0.19 ± 0.0210 a0.26 ± 0.0257 a0.24 ± 0.0150 a0.25 ± 0.0267 a0.26 ± 0.0352 a0.22 ± 0.0420 a
Acids (2) 0.16 ± 0.01 c0.26 ± 0.01 b0.51 ± 0.02 a0.09 ± 0.01 d0.17 ± 0.01 c0.09 ± 0.01 d
E1Propanoic acidC79094C3H6O20.19 ± 0.0163 a0.04 ± 0.0018 b0.09 ± 0.0043 c
E23-methylbutanoic acidC503742C5H10O20.16 ± 0.0063 c0.26 ± 0.0098 b0.32 ± 0.0071 a0.05 ± 0.0010 e0.08 ± 0.0037 d0.09 ± 0.0096 d
Alkenes (11) 17.38 ± 0.09 a4.79 ± 0.23 c6.61 ± 0.47 b5.31 ± 0.17 c5.44 ± 0.17 c17.44 ± 0.44 a
F1TricycleneC508327C10H160.08 ± 0.0029 e0.21 ± 0.0399 c0.27 ± 0.0139 b0.07 ± 0.0091 e0.12 ± 0.0047 d0.69 ± 0.0070 a
F2Alpha-pineneC80568C10H160.13 ± 0.0052 d0.29 ± 0.0284 b0.46 ± 0.0332 a0.10 ± 0.009 d0.21 ± 0.0213 c0.27 ± 0.0218 b
F3Beta-pinene-MC127913C10H160.30 ± 0.0090 d0.98 ± 0.0938 c2.04 ± 0.2142 b1.23 ± 0.1524 c1.89 ± 0.0840 b3.57 ± 0.0228 a
F4Beta-pinene-DC127913C10H160.18 ± 0.0091 d0.27 ± 0.0058 d0.42 ± 0.0375 c0.93 ± 0.0477 b0.51 ± 0.0340 c4.90 ± 0.1473 a
F5Beta-pinene-TC127913C10H160.05 ± 0.0114 b0.07 ± 0.0043 b0.09 ± 0.0153 b0.08 ± 0.0116 b0.08 ± 0.0047 b1.40 ± 0.0648 a
F6MyrceneC123353C10H160.15 ± 0.0159 c0.20 ± 0.0038 c0.31 ± 0.0129 b0.29 ± 0.0596 b0.23 ± 0.0078 b,c0.58 ± 0.0646 a
F7Alpha-phellandrene-MC99832C10H162.33 ± 0.0553 a1.44 ± 0.2083 b1.54 ± 0.1210 b1.07 ± 0.1216 c1.39 ± 0.0468 b2.40 ± 0.1704 a
F8Alpha-phellandrene-DC99832C10H1613.61 ± 0.040 a0.45 ± 0.1576 c0.37 ± 0.0304 c1.06 ± 0.1179 b0.29 ± 0.0135 c0.39 ± 0.0560 c
F9Beta-ocimeneC13877913C10H160.27 ± 0.0141 c0.46 ± 0.0313 b0.44 ± 0.0324 b0.19 ± 0.019 d0.33 ± 0.0126 c1.85 ± 0.0619 a
F10Gamma-terpineneC99854C10H160.14 ± 0.0053 c0.17 ± 0.0235 c0.34 ± 0.0266 b0.17 ± 0.0107 c0.16 ± 0.0248 c0.72 ± 0.0114 a
F11TerpinoleneC586629C10H160.14 ± 0.0108 d0.24 ± 0.0081 c0.32 ± 0.0206 b0.12 ± 0.014 d0.22 ± 0.0178 c0.67 ± 0.0404 a
Others (8) 3.87 ± 0.02 e7.18 ± 0.27 b5.47 ± 0.15 d6.68 ± 0.01 c4.28 ± 0.05 e18.11 ± 0.42 a
G1DimethylamineC124403C2H7N2.11 ± 0.2938 b2.70 ± 0.1530 a2.19 ± 0.1176 b1.72 ± 0.0640 c1.36 ± 0.0208 d0.43 ± 0.0143 e
G2Dimethyl disulfideC624920C2H6S20.06 ± 0.0025 c0.04 ± 0.0001 c1.60 ± 0.0556 a0.34 ± 0.0119 b
G32-acetylfuranC1192627C6H6O20.04 ± 0.0048 c0.05 ± 0.0073 c0.04 ± 0.0001 c0.18 ± 0.0128 a0.08 ± 0.0036 b0.07 ± 0.0137 b
G42-pentylfuranC3777693C9H14O0.10 ± 0.0195 d0.35 ± 0.0210 b0.19 ± 0.0133 c0.55 ± 0.0777 a0.22 ± 0.0032 c0.27 ± 0.0493 b,c
G51,8-cineole-DC470826C10H18O0.48 ± 0.0311 b0.35 ± 0.0242 b,c0.15 ± 0.0072 c0.47 ± 0.0178 b0.19 ± 0.0176 c8.57 ± 0.2251 a
G61,8-cineole-MC470826C10H18O0.76 ± 0.2324 d3.21 ± 0.2589 b1.02 ± 0.0743 d3.54 ± 0.1134 b1.69 ± 0.0605 c8.49 ± 0.2093 a
G72,3-diethyl-5-methylpyrazineC18138040C9H14N20.23 ± 0.0039 a,b0.20 ± 0.0477 b0.14 ± 0.0264 c0.10 ± 0.0103 c0.28 ± 0.0186 a0.09 ± 0.0053 c
G8Methyl chavicolC140670C10H12O0.08 ± 0.0036 d0.28 ± 0.0330 a0.14 ± 0.0193 b,c0.10 ± 0.010 c,d0.13 ± 0.0188 c0.18 ± 0.0162 b
The -m and -d following some substances in the list indicate Monomer and Dimer of the same substance. Different letters in the same row represent significant differences (p < 0.05).
Publisher’s Note: MDPI stays neutral with regard to jurisdictional claims in published maps and institutional affiliations.

