
Fattening in Saline and Alkaline Water Improves the Color, Nutritional and Taste Quality of Adult Chinese Mitten Crab Eriocheir sinensis

 , ,
, ,
Abstract
:1. Introduction
2. Materials and Methods
2.1. Experimental Design
2.2. Culture Management
2.3. Sample Collection and Dissection
2.4. Measurements of Color Parameters
2.5. Proximate Composition
2.6. Fatty Acid Profile
2.7. Free Amino Acid Analysis and Taste Activity Value
2.8. Statistical Analysis
3. Results
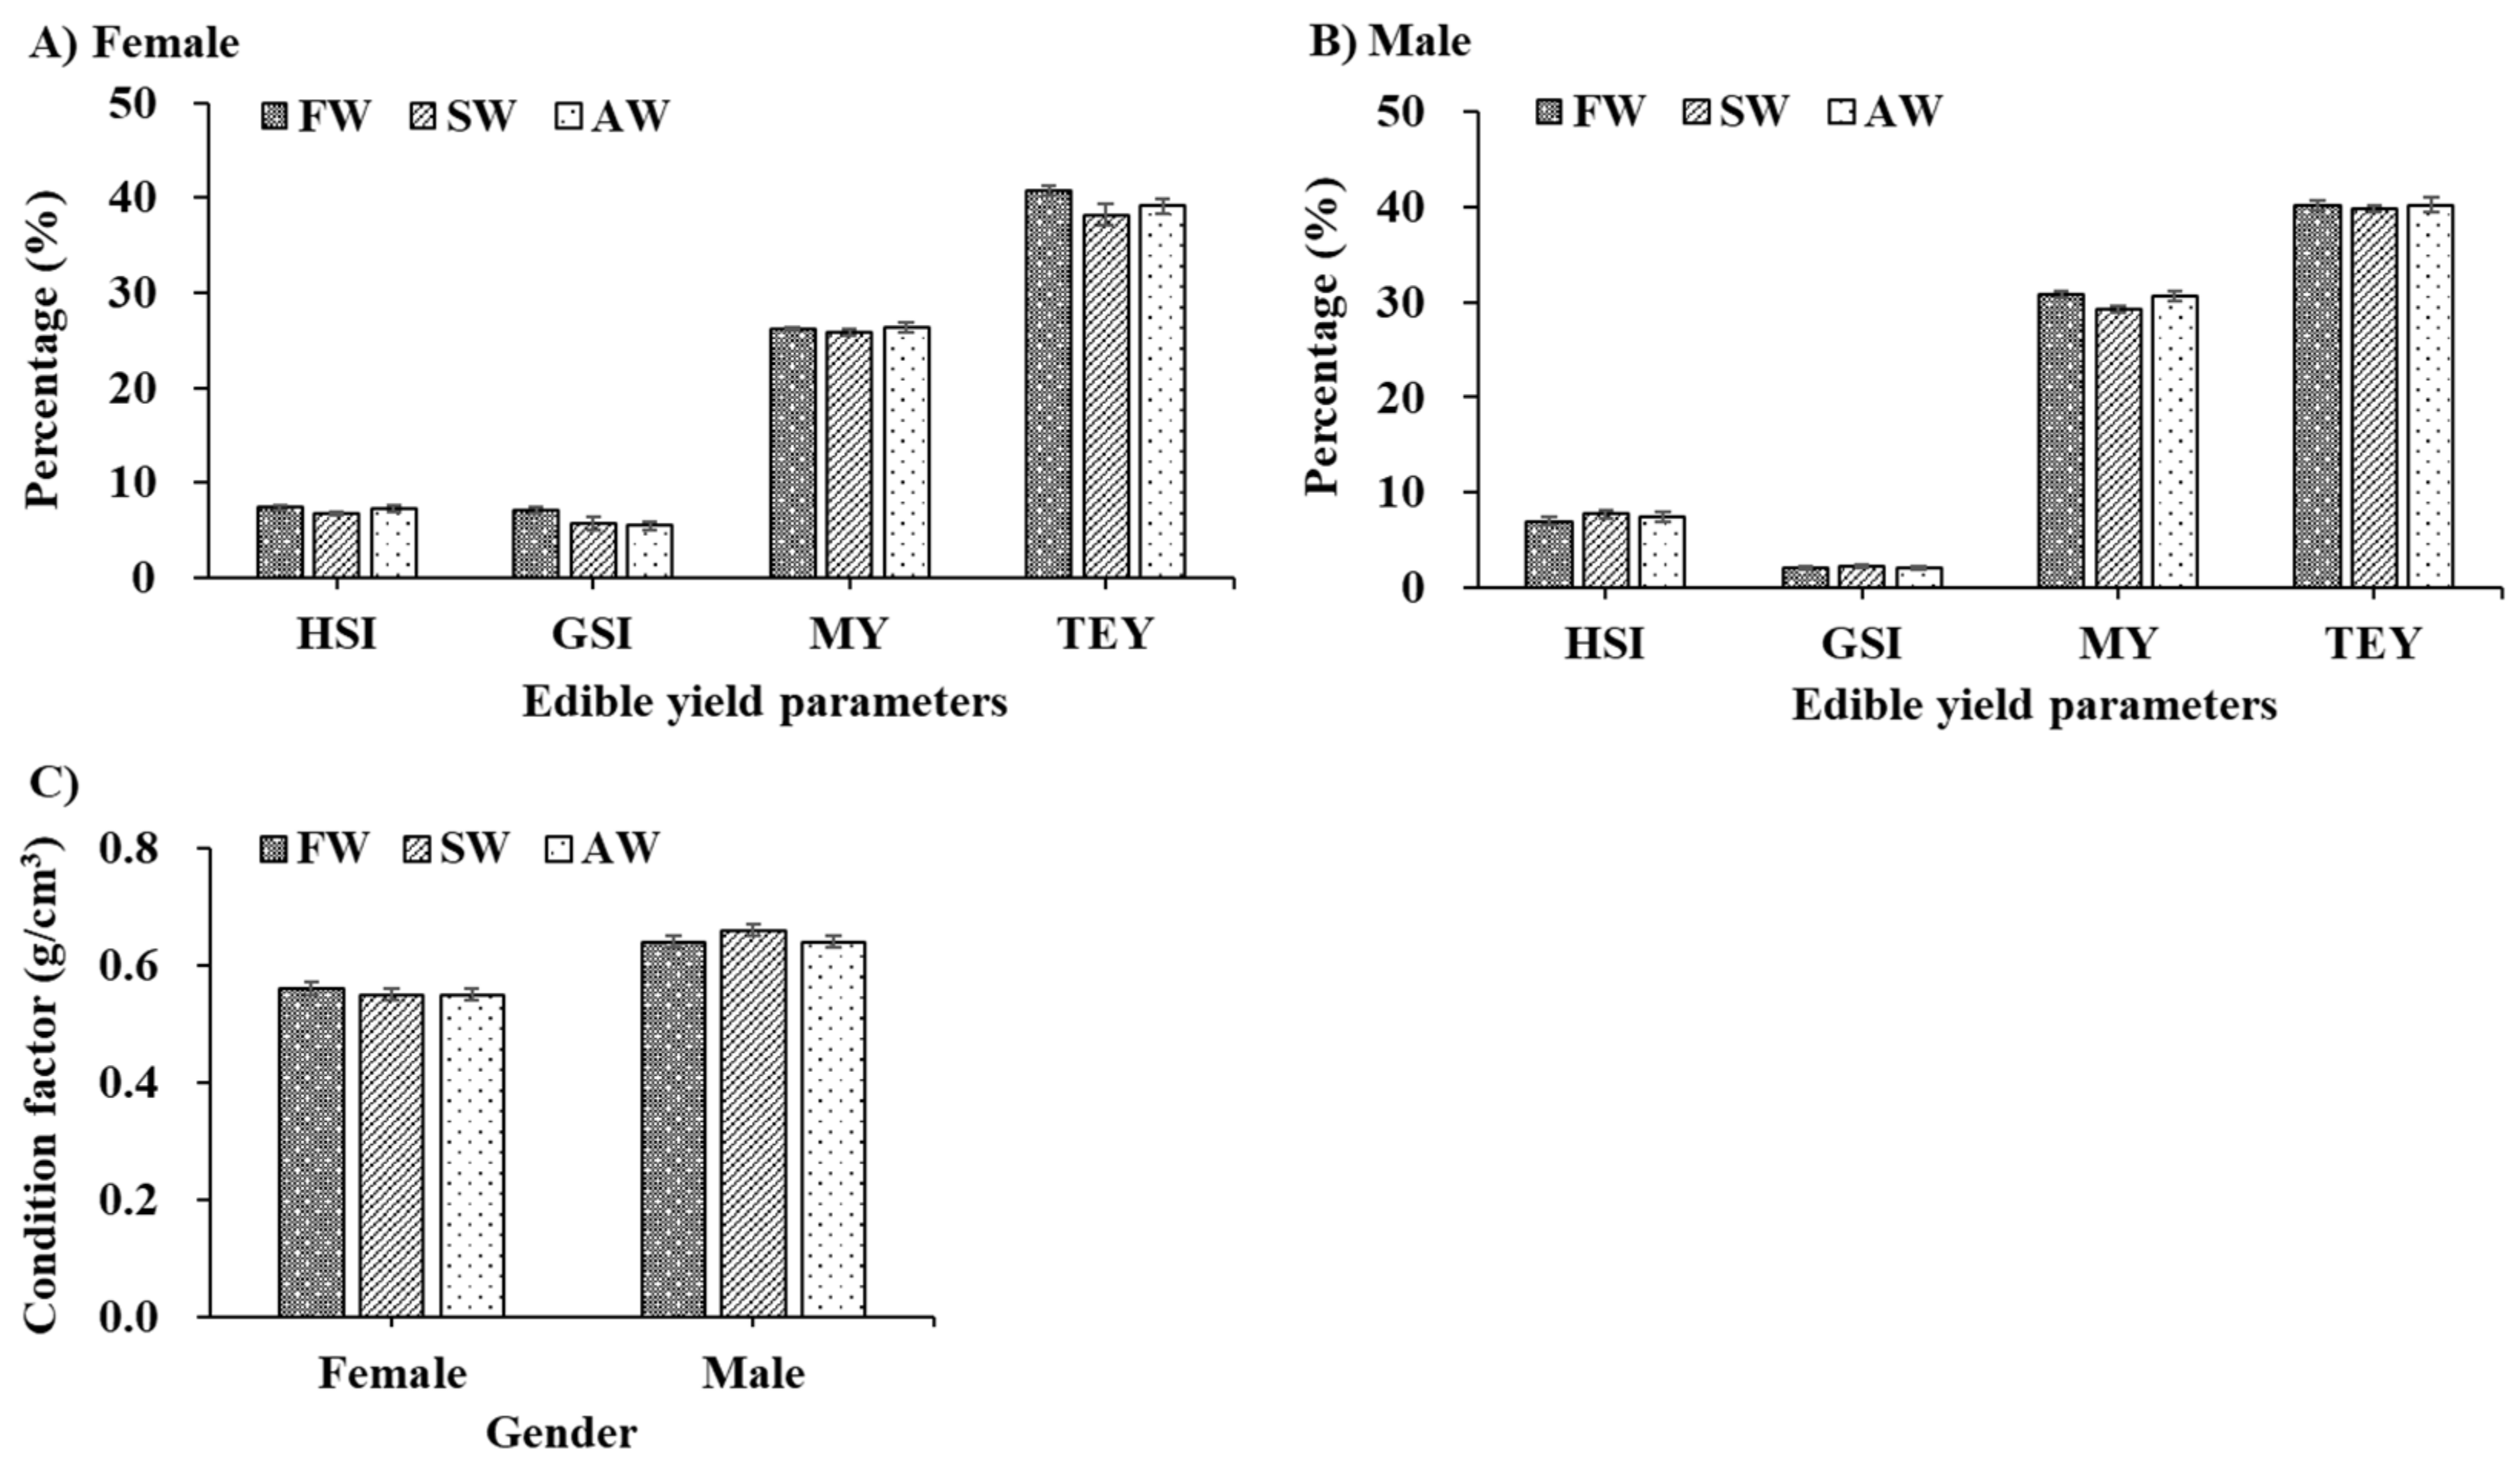
3.1. Gonadal Development and Total Edible Yield
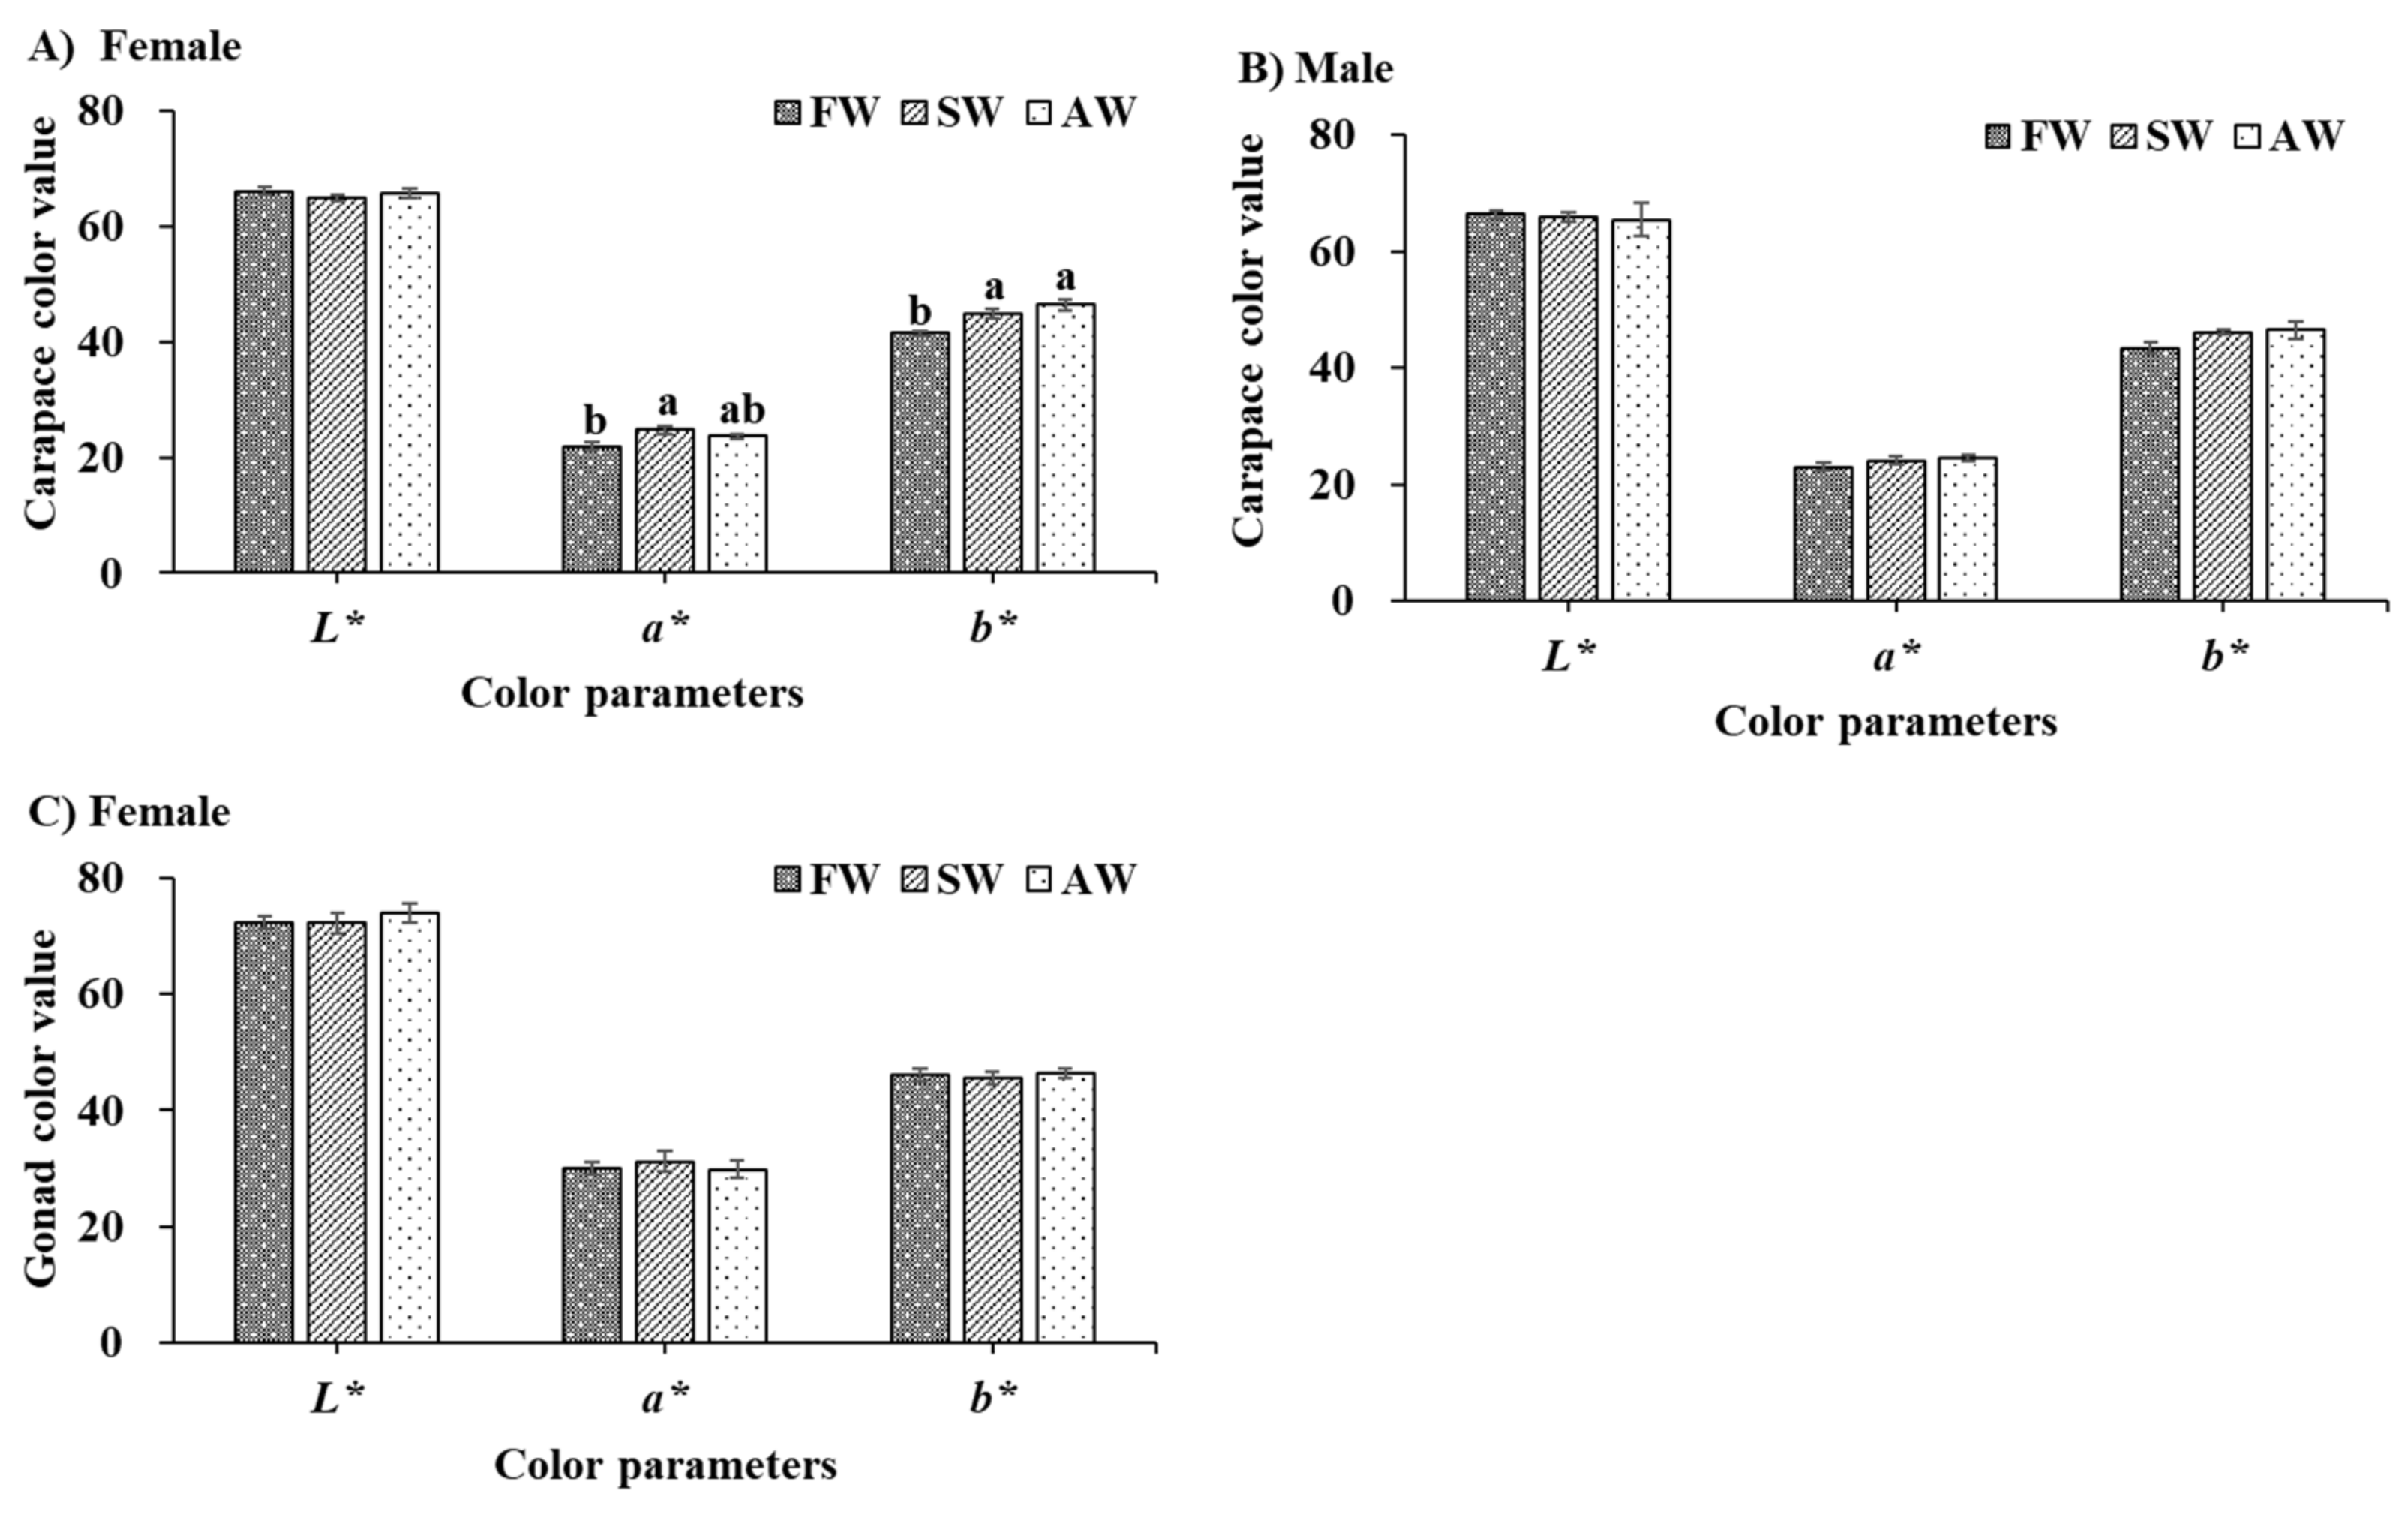
3.2. Color Parameters
3.3. Proximate Composition
3.4. Fatty Acid Profiles
3.5. Free Amino Acid Composition and Taste Activity Value
4. Discussion
4.1. Total Edible Yield
4.2. Color Parameters and Biochemical Composition
4.3. Fatty Acid Composition
4.4. FAA Composition and TAV Analysis
5. Conclusions
Author Contributions
Funding
Institutional Review Board Statement
Informed Consent Statement
Data Availability Statement
Acknowledgments
Conflicts of Interest
References
- Long, X.W.; Guo, Q.; Wang, X.C.; Francis, D.S.; Cheng, Y.X.; Wu, X.G. Effects of fattening period on ovarian development and nutritional quality of adult female Chinese mitten crab Eriocheir sinensis. Aquaculture 2020, 519, 734–748. [Google Scholar] [CrossRef]
- Bureau of Fisheries and Fishery Management, Ministry of Agriculture and Rural affairs of China. 2021 China Fisheries Statistical Yearbook; Chinese Agricultural Press: Beijing, China, 2022; p. 34.
- Cheng, Y.X.; Wu, X.G.; Yang, X.Z.; Hines, A.H. Current trends in hatchery techniques and stock enhancement for Chinese mitten crab, Eriocheir japonica sinensis. Rev. Fish. Sci. Aquac. 2008, 16, 377–384. [Google Scholar] [CrossRef]
- Wang, S.H.; Wang, Y.Z.; Wu, X.G.; Zhang, X.B.; Zhao, J.S.; Yang, J.M.; Cheng, Y.X. Gonadal development and biochemical composition of Chinese mitten crabs (Eriocheir sinensis) from four sources. J. Food Sci. 2021, 86, 1066–1080. [Google Scholar] [CrossRef] [PubMed]
- Wang, Y.Z.; Li, J.H.; Wang, S.H.; Sun, B.H.; Xiong, L.M.; Cheng, Y.X. Composition and nutritional qualities of edible tissues of Chinese mitten crab (Eriocheir sinensis) from Ya Lake over different months. J. Food Compos. Anal. 2022, 105, 104199. [Google Scholar] [CrossRef]
- Sumner, M.E.; Naidu, R. Sodic Soils: Distribution, Properties, Management and Environmental Consequences; Oxford University Press: Oxford, UK, 1998; pp. 1069–1093. [Google Scholar]
- Lin, T.T.; Lai, Q.F.; Yao, Z.L.; Lu, J.X.; Zhou, K.; Wang, H. Combined effects of carbonate alkalinity and pH on survival, growth and haemocyte parameters of the Venus clam Cyclina sinensis. Fish Shellfish Immun. 2013, 35, 525–531. [Google Scholar] [CrossRef]
- Wang, S.H.; Zhao, J.S.; Wu, X.G.; Cheng, Y.X. Growth performance, gonadal development and nutritional composition of adult Eriocheir sinensis from Dongying. J. Shanghai Ocean Univ. 2020, 29, 17–26. [Google Scholar]
- Dong, Z.G.; Shen, S.Y.; LI, X.Y.; Yan, B.L.; SUN, X.W. Fatty acid composition variation and fingerprint of the swimming crab Portunus trituberculatus from China Sea based on multivariate analysis method. J. Fish. China 2013, 37, 192–200. [Google Scholar] [CrossRef]
- Tang, L.; Wang, H.; Wang, C.L.; Mu, C.K.; Wei, H.L.; Yao, H.Z.; Ye, C.Y.; Chen, L.Z.; Shi, C. Temperature potentially induced distinctive flavor of mud crab Scylla paramamosain mediated by gut microbiota. Sci. Rep. 2020, 10, 3720. [Google Scholar] [CrossRef]
- Wu, X.G.; Zhu, S.C.; Zhang, H.C.; Liu, M.M.; Wu, N.; Pan, J.; Luo, M.; Wang, X.C.; Cheng, Y.X. Fattening culture improves the gonadal development and nutritional quality of male Chinese mitten crab Eriocheir sinensis. Aquaculture 2019, 518, 734865. [Google Scholar] [CrossRef]
- Mu, Y.C.; Wang, F.; Dong, S.L.; Huang, G.Q.; Dong, S.S. Effects of salinity fluctuation pattern on growth and energy budget of juvenile shrimp Fenneropenaeus chinensis. J. Shellfish Res. 2005, 24, 1217–1221. [Google Scholar]
- Boyd, C.E.; Tucker, C.S.; Somridhivej, B. Alkalinity and hardness: Critical but elusive concepts in aquaculture. J. World Aquacult. Soc. 2016, 47, 6–41. [Google Scholar] [CrossRef]
- Long, X.W.; Wu, X.G.; Zhao, L.; Ye, H.H.; Cheng, Y.X.; Zeng, C.S. Physiological responses and ovarian development of female Chinese mitten crab Eriocheir sinensis subjected to different salinity conditions. Front. Physiol. 2018, 8, 1072. [Google Scholar] [CrossRef] [Green Version]
- Long, X.W.; Wu, X.G.; Zhu, S.C.; Ye, H.H.; Cheng, Y.X.; Zeng, C.S. Salinity can change the lipid composition of adult Chinese mitten crab after long-term salinity adaptation. PLoS ONE 2019, 14, e0219260. [Google Scholar] [CrossRef]
- Zhang, L.; Yin, M.Y.; Zheng, Y.; Xu, C.H.; Tao, N.P.; Wu, X.G.; Wang, X.C. Brackish water improves the taste quality in meat of adult male Eriocheir sinensis during the postharvest temporary rearing. Food Chem. 2021, 343, 128409. [Google Scholar] [CrossRef]
- Qin, K.X.; Ruan, T.S.; Chen, Y.H.; Liang, G.L.; Wang, H.; Mu, C.K.; Wang, C.L. Effects of temporary rearing time under salinity 7 on the non-volatile flavorings and fatty acids of Eriocheir sinensis. J. Food Compos. Anal. 2022, 107, 104366. [Google Scholar] [CrossRef]
- Chi, B.J.; Liang, L.Q.; Liu, C.L.; Chang, Y.M.; Wang, S.; Han, Q.X.; Gao, G.Q. Adaptability of Tribolodon brandti (Dybowski) to NaCl concentration and alkalinity. J. Fish. Sci. China 2011, 18, 689–694. [Google Scholar] [CrossRef]
- Ren, S.S.; Sun, B.; Luo, L.; Zhang, L.M.; Chang, Y.M.; Liang, L.Q. Tolerance of freshwater shrimp (Macrobrachium nipponense) to alkalinity and low temperature in northeast China. Chin. J. Fish. 2020, 33, 24–28. [Google Scholar]
- Yang, Y.H.; Li, M.S.; Luo, L.; Wang, S.H.; Zhang, R.; Guo, K.; Liu, J.Y.; Li, H.T.; Zhao, Z.G. Study on toxicity of salinity and alkalinity on Eriocheir sinensis. J. Northeast Agric. Univ. Engl. Ed. 2022, 53, 36–41. [Google Scholar]
- Long, X.W.; Wu, X.G.; Zhao, L.; Liu, J.G.; Cheng, Y.X. Effects of dietary supplementation with Haematococcus pluvialis, cell powder on coloration, ovarian development and antioxidation capacity of adult female Chinese mitten crab, Eriocheir sinensis. Aquaculture 2017, 473, 545–553. [Google Scholar] [CrossRef]
- AOAC. Official Methods of Analysis of Association of Official Analytical Chemists, 16th ed.; Association of Official Analytical Chemists: Arlington, VA, USA, 1995; p. 13. [Google Scholar]
- National Health Commission of the People’s Republic of China; State Administration for Market Regulation. GB 5009.6-2016; National Food Safety Standard-Determination of Fat in Food; Standards Press of China: Beijing, China, 2016; pp. 1–2.
- National Health Commission of the People’s Republic of China; State Administration for Market Regulation. GB 5009.168-2016; National Food Safety Standard-Determination of Fatty Acids in Food; Standards Press of China: Beijing, China, 2016; pp. 10–11.
- Shao, L.C.; Wang, C.; He, J.; Wu, X.G.; Cheng, X.G. Meat quality of Chinese mitten crabs fattened with natural and formulated diets. J. Aquat. Food Prod. Technol. 2014, 23, 59–72. [Google Scholar] [CrossRef]
- Tume, R.K.; Sikes, A.L.; Tabrett, S.; Smith, D.M. Effect of background color on the distribution of astaxanthin in black tiger prawn (Penaeus monodon): Effective method for improvement of cooked color. Aquaculture 2009, 296, 129–135. [Google Scholar] [CrossRef]
- Li, Q.Q.; Sun, Q.F.; Liu, Q.; Cheng, Y.X.; Wu, X.G. Estimation of genetic parameters for carotenoid traits in Chinese mitten crab, Eriocheir sinensis, females. Aquaculture 2021, 532, 735990. [Google Scholar] [CrossRef]
- Paliwal, C.; Pancha, I.; Ghosh, T.; Maurya, R.; Chokshi, K.; Vamsi-Bharadwaj, S.V.; Ram, S.; Mishra, S. Selective carotenoid accumulation by varying nutrient media and salinity in Synechocystis sp. CCNM 2501. Bioresour. Technol. 2015, 197, 363–368. [Google Scholar] [CrossRef]
- Rearte, T.A.; Vélez, C.G.; Beligni, M.V.; Figueroa, F.L.; Gómez, P.I.; Flaig, D.; De-Iorio, A.F. Biological characterization of a strain of Golenkinia (Chlorophyceae) with high oil and carotenoid content induced by increased salinity. Algal Res. 2018, 33, 218–230. [Google Scholar] [CrossRef]
- Wu, Q.Y.; Shi, X.; Fang, S.B.; Xie, Z.F.; Guang, M.Y.; Li, S.K.; Zheng, H.P.; Zhang, Y.L.; Ikhwanuddin, M.; Ma, H.Y. Different biochemical composition and nutritional value attribute to salinity and rearing period in male and female mud crab Scylla paramamosain. Aquaculture 2019, 513, 734417. [Google Scholar] [CrossRef]
- FAO; WHO. Fats and oils in human nutrition. In Report of a Joint FAO/WHO Expert Consultation; Food and Agriculture Organization of the United Nations: Rome, Italy, 1994; pp. 202–205. [Google Scholar]
- Muskieta, F.A.J.; Kemperman, R.F.J. Folate and long-chain polyunsaturated fatty acids in psychiatric disease. J. Nutr. Biochem. 2006, 17, 717–727. [Google Scholar] [CrossRef]
- Roynette, C.E.; Calder, P.C.; Dupertuis, Y.M.; Pichard, C. n–3 polyunsaturated fatty acids and colon cancer prevention. Clin. Nutr. 2004, 23, 139–151. [Google Scholar] [CrossRef]
- Izquierdo, M.S.; Robaina, L.; Juárez-Carrillo, E.; Oliva, V.; Hernández-Cruz, C.M.; Afonso, J.M. Regulation of growth, fatty acid composition and delta-6 desaturase expression by dietary lipids in gilthead seabream larvae (Sparus aurata). Fish Physiol. Biochem. 2008, 34, 117–127. [Google Scholar] [CrossRef]
- Xie, D.Z.; Chen, C.Y.; Dong, Y.W.; You, C.H.; Wang, S.Q.; Monroig, Ó.; Tocher, D.R.; Li, Y.Y. Regulation of long-chain polyunsaturated fatty acid biosynthesis in teleost fish. Prog. Lipid Res. 2021, 82, 101095. [Google Scholar] [CrossRef]
- Wang, S.H.; Cheng, Y.X.; Jia, Z.Y.; Li, C.T.; Zhang, X.B.; Shi, L.Y. Comparison of nutritional quality of adult Chinese mitten handed crab (Eriocheir sinensis) with different hepatic color. Chin. J. Fish. 2021, 34, 27–34. [Google Scholar]
- Wang, D.Q.; Zhang, L.; Wu, X.G.; Wang, X.C.; Li, Y.Y. Effect of 8‰ low salinity seawater on taste compounds and sensory evaluation of female Chinese mitten crab during temporary culture. Sci. Technol. Food Ind. 2018, 39, 1–12. [Google Scholar]
- Zhao, L.; Wu, N.; Wang, X.C.; Wu, X.G.; Wang, Y.H. Comparison of the flavor components of Chinese mitten crab at different growth stages. Mod. Food Sci. Technol. 2016, 32, 261–269. [Google Scholar]
- Dermiki, M.; Phanphensophon, N.; Mottram, D.S.; Methven, L. Contributions of non-volatile and volatile compounds to the umami taste and overall flavour of shiitake mushroom extracts and their application as flavour enhancers in cooked minced meat. Food Chem. 2013, 141, 77–83. [Google Scholar] [CrossRef] [PubMed]

| Item | Female | Male | ||||
|---|---|---|---|---|---|---|
| FW | SW | AW | FW | SW | AW | |
| Hepatopancreas | ||||||
| moisture | 59.50 ± 1.60 | 59.62 ± 3.39 | 61.04 ± 2.02 | 55.29 ± 0.66 | 50.34 ± 4.16 | 51.48 ± 3.26 |
| crude protein | 10.86 ± 0.51 | 9.06 ± 0.07 | 9.94 ± 0.86 | 8.96 ± 0.11 | 9.28 ± 2.75 | 8.01 ± 0.85 |
| crude lipid | 24.10 ± 1.01 | 26.99 ± 0.10 | 24.17 ± 0.68 | 30.92 ± 0.07 | 35.11 ± 3.67 | 35.76 ± 1.21 |
| ash | 1.46 ± 0.16 | 1.03 ± 0.06 | 1.19 ± 0.10 | 1.36 ± 0.07 | 1.14 ± 0.30 | 1.07 ± 0 |
| Gonad | ||||||
| moisture | 55.63 ± 1.52 | 53.68 ± 1.71 | 55.02 ± 0.53 | 73.50 ± 0.31 | 72.76 ± 0.35 | 73.34 ± 0.36 |
| crude protein | 28.84 ± 0.08 b | 29.86 ± 0.25 a | 29.31 ± 0.11 ab | 17.61 ± 0.01 b | 18.01 ± 0.02 a | 17.63 ± 0.05 b |
| crude lipid | 7.45 ± 0.09 | 6.72 ± 0.32 | 7.22 ± 0.11 | 0.34 ± 0 | 0.42 ± 0.04 | 0.35 ± 0 |
| ash | 2.17 ± 0.40 | 1.90 ± 0.05 | 2.23 ± 0.34 | 2.46 ± 0.32 | 2.33 ± 0.04 | 2.25 ± 0.01 |
| Muscle | ||||||
| moisture | 79.61 ± 0.25 b | 80.88 ± 0.59 ab | 81.01 ± 0.44 a | 79.33 ± 0.64 | 78.04 ± 0.50 | 78.96 ± 0.50 |
| crude protein | 17.42 ± 0.05 a | 15.71 ± 0.15 b | 15.63 ± 0.30 b | 16.50 ± 0.06 c | 17.98 ± 0.00 a | 17.05 ± 0.11 b |
| crude lipid | 0.38 ± 0.03 | 0.46 ± 0 | 0.37 ± 0.03 | 0.35 ± 0.02 b | 0.48 ± 0 a | 0.38 ± 0.02 b |
| ash | 1.51 ± 0.02 | 1.50 ± 0.03 | 1.49 ± 0.07 | 1.35 ± 0.05 | 1.50 ± 0.01 | 1.47 ± 0.02 |
| Fatty Acid | Hepatopancreas | Gonad | Muscle | ||||||
|---|---|---|---|---|---|---|---|---|---|
| FW | SW | AW | FW | SW | AW | FW | SW | AW | |
| Female | |||||||||
| C14:0 | 1.36 ± 0.12 | 1.40 ± 0.04 | 1.62 ± 0.04 | 0.85 ± 0.02 | 0.83 ± 0.01 | 1.01 ± 0.18 | — | — | — |
| C15:0 | 0.67 ± 0.06 | 0.68 ± 0.02 | 0.76 ± 0.01 | 0.50 ± 0.02 | 0.53 ± 0.01 | 0.55 ± 0.08 | — | — | — |
| C16:0 | 19.68 ± 0.75 | 19.46 ± 0.22 | 20.85 ± 1.74 | 16.03 ± 0.37 | 15.50 ± 0.07 | 16.20 ± 0.40 | 12.53 ± 0.25 | 12.37 ± 0.32 | 13.22 ± 0.25 |
| C17:0 | 0.74 ± 0.03 a | 0.62 ± 0 b | 0.71 ± 0.03 ab | 0.76 ± 0.05 | 0.63 ± 0.02 | 0.74 ± 0.11 | 0.95 ± 0.02 ab | 0.86 ± 0 b | 1.01 ± 0.04 a |
| C18:0 | 3.07 ± 0.02 | 3.19 ± 0.07 | 3.42 ± 0.19 | 3.15 ± 0.17 | 2.82 ± 0.02 | 2.87 ± 0.12 | 9.79 ± 0.02 ab | 9.21 ± 0.21 b | 10.08 ± 0.19 a |
| ∑SFA | 26.54 ± 0.88 | 26.45 ± 0.04 | 28.52 ± 1.89 | 21.38 ± 0.63 | 20.47 ± 0.08 | 21.45 ± 0.88 | 24.01 ± 0.24 ab | 23.12 ± 0.50 b | 25.11 ± 0.15 a |
| C15:1n5 | 0.30 ± 0.03 | 0.28 ± 0.02 | 0.32 ± 0.02 | — | — | — | 0.61 ± 0.03 | 0.66 ± 0.01 | 0.79 ± 0.07 |
| C16:1n7 | 8.70 ± 0.82 | 9.57 ± 0.92 | 9.76 ± 1.32 | 7.80 ± 0.95 | 10.33 ± 0.13 | 10.27 ± 0.48 | 2.97 ± 0.19 | 2.81 ± 0.05 | 2.86 ± 0.46 |
| C18:1n9c | 38.59 ± 0.27 | 36.55 ± 1.04 | 37.94 ± 1.21 | 34.18 ± 0.31 a | 31.40 ± 0.75 b | 32.55 ± 0.46 ab | 25.27 ± 0.32 | 24.92 ± 0.51 | 25.45 ± 0.14 |
| C20:1n9 | 1.33 ± 0.08 | 1.04 ± 0.04 | 1.18 ± 0.14 | 0.48 ± 0.05 a | 0.33 ± 0.02 b | 0.40 ± 0.01 ab | 0.76 ± 0.03 | 0.75 ± 0.02 | 0.74 ± 0.03 |
| ∑MUFA | 49.89 ± 0.71 | 48.34 ± 0.15 | 50.22 ± 2.72 | 42.96 ± 1.22 | 42.57 ± 0.60 | 43.72 ± 0.05 | 29.86 ± 0.54 | 29.46 ± 0.60 | 30.16 ± 0.24 |
| C18:2n6c | 17.06 ± 1.91 | 19.26 ± 0.47 | 15.97 ± 4.03 | 16.96 ± 0.08 | 17.83 ± 0.26 | 16.84 ± 1.41 | 11.25 ± 0.90 | 10.60 ± 0.26 | 9.69 ± 0.04 |
| C18:3n3 | 1.84 ± 0.03 | 2.12 ± 0.20 | 1.59 ± 0.36 | 3.10 ± 0.11 | 3.85 ± 0.23 | 3.31 ± 0.18 | 1.58 ± 0.10 | 1.61 ± 0.01 | 1.36 ± 0.18 |
| C20:2n6 | 1.18 ± 0.03 a | 0.90 ± 0.02 b | 0.87 ± 0.06 b | 1.07 ± 0.07 | 0.92 ± 0.04 | 0.90 ± 0.01 | 1.68 ± 0.05 | 1.62 ± 0.03 | 1.58 ± 0.14 |
| C20:4n6 (ARA) | 0.96 ± 0.09 | 0.80 ± 0.10 | 0.76 ± 0.09 | 3.38 ± 0.03 | 3.32 ± 0.11 | 3.29 ± 0.09 | 6.73 ± 0.17 | 7.02 ± 0.18 | 7.14 ± 0.24 |
| C20:3n3 | 0.37 ± 0 a | 0.30 ± 0.03 b | 0.26 ± 0.01 b | 0.49 ± 0.04 | 0.47 ± 0 | 0.45 ± 0.02 | 0.56 ± 0.02 b | 0.61 ± 0.01 a | 0.58 ± 0.01 ab |
| C20:5n3 (EPA) | 1.03 ± 0.04 | 0.84 ± 0.14 | 0.72 ± 0.18 | 6.48 ± 0.06 | 6.58 ± 0.22 | 6.35 ± 0.07 | 16.50 ± 0.28 | 17.15 ± 0.16 | 16.34 ± 0.33 |
| C22:6n3 (DHA) | 0.44 ± 0.12 | 0.41 ± 0.08 | 0.36 ± 0.07 | 3.24 ± 0.18 | 3.36 ± 0.18 | 2.81 ± 0.09 | 7.62 ± 0.48 | 8.22 ± 0.22 | 7.68 ± 0.21 |
| ∑PUFA | 23.60 ± 0.72 | 25.21 ± 0.05 | 21.15 ± 2.06 | 35.35 ± 0.28 | 36.86 ± 0.23 | 34.51 ± 0.42 | 46.32 ± 0.25 ab | 47.23 ± 0.04 a | 44.83 ± 0.13 b |
| ∑EFA | 19.18 ± 0.84 | 21.58 ± 0.12 | 17.78 ± 1.95 | 20.29 ± 0.08 | 21.86 ± 0.22 | 20.34 ± 0.55 | 13.04 ± 0.44 | 12.40 ± 0.12 | 11.31 ± 0.09 |
| ∑HUFA | 5.09 ± 0.16 | 4.86 ± 0.29 | 4.09 ± 0.34 | 17.08 ± 0.24 | 17.93 ± 0.15 | 16.57 ± 0.23 | 33.19 ± 0.14 b | 34.82 ± 0.06 a | 33.30 ± 0.09 b |
| ∑n-3 PUFA | 3.67 ± 0.13 | 3.66 ± 0.32 | 2.93 ± 0.43 | 13.30 ± 0.27 | 14.26 ± 0.13 | 12.91 ± 0.24 | 26.25 ± 0.08 b | 27.58 ± 0.05 a | 25.95 ± 0.03 b |
| ∑n-6 PUFA | 19.93 ± 1.04 | 21.55 ± 0.19 | 18.22 ± 2.31 | 22.05 ± 0.14 | 22.60 ± 0.20 | 21.60 ± 0.74 | 20.80 ± 0.40 | 19.65 ± 0.02 | 18.89 ± 0.19 |
| n-3/n-6 PUFA | 0.19 ± 0.03 | 0.17 ± 0.02 | 0.16 ± 0 | 0.60 ± 0.01 | 0.63 ± 0 | 0.60 ± 0.05 | 1.31 ± 0.05 | 1.40 ± 0 | 1.37 ± 0.03 |
| ∑DHA + EPA | 1.46 ± 0.15 | 1.25 ± 0.22 | 1.08 ± 0.25 | 9.72 ± 0.23 ab | 9.94 ± 0.04 a | 9.16 ± 0.16 b | 24.11 ± 0.20 b | 25.37 ± 0.05 a | 24.02 ± 0.13 b |
| DHA/EPA | 0.42 ± 0.10 | 0.48 ± 0.02 | 0.51 ± 0.03 | 0.50 ± 0.02 | 0.51 ± 0.04 | 0.44 ± 0.01 | 0.46 ± 0.04 | 0.48 ± 0.02 | 0.47 ± 0.02 |
| Male | |||||||||
| C14:0 | 1.56 ± 0.07 | 1.37 ± 0.13 | 1.62 ± 0.11 | 0.52 ± 0.07 | 0.41 ± 0.05 | 0.49 ± 0.01 | — | — | — |
| C15:0 | 0.83 ± 0.04 a | 0.64 ± 0.01 b | 0.73 ± 0.05 ab | — | — | — | — | — | — |
| C16:0 | 19.92 ± 0.83 a | 17.15 ± 0.07 b | 17.78 ± 0.24 ab | 10.25 ± 0.39 | 9.63 ± 0.44 | 10.21 ± 0.02 | 13.31 ± 0.45 | 12.18 ± 0.04 | 12.60 ± 0.05 |
| C17:0 | 0.91 ± 0.03 a | 0.69 ± 0.01 b | 0.87 ± 0.06 a | 0.90 ± 0.05 | 0.75 ± 0.05 | 0.84 ± 0.01 | 1.10 ± 0.02 | 0.93 ± 0.04 | 1.11 ± 0.09 |
| C18:0 | 3.63 ± 0.06 a | 3.13 ± 0.12 b | 3.40 ± 0.02 ab | 7.79 ± 0.50 | 7.48 ± 0.04 | 7.62 ± 0.07 | 10.27 ± 0.09 | 9.49 ± 0.07 | 10.21 ± 0.30 |
| ∑SFA | 27.90 ± 0.90 a | 23.96 ± 0 b | 25.42 ± 0.42 ab | 19.90 ± 0.09 | 18.80 ± 0.58 | 19.63 ± 0.11 | 25.33 ± 0.48 a | 23.07 ± 0.12 b | 24.50 ± 0.35 ab |
| C15:1n5 | 0.39 ± 0.02 a | 0.28 ± 0.02 b | 0.32 ± 0.02 ab | 0.78 ± 0.04 | 0.83 ± 0.02 | 0.80 ± 0.03 | 0.92 ± 0.02 | 0.83 ± 0.03 | 0.93 ± 0.10 |
| C16:1n7 | 8.56 ± 0.29 | 8.04 ± 1.14 | 9.40 ± 0.82 | 2.49 ± 0.39 | 2.38 ± 0.13 | 3.00 ± 0.13 | 2.87 ± 0.44 | 2.36 ± 0.09 | 2.29 ± 0.11 |
| C18:1n9c | 34.99 ± 1.21 | 32.33 ± 1.28 | 31.71 ± 0.44 | 24.23 ± 0.38 a | 22.65 ± 0.36 b | 24.39 ± 0.17 a | 25.43 ± 0.21 a | 23.41 ± 0.04 c | 24.43 ± 0.12 b |
| C20:1n9 | 1.43 ± 0.05 a | 1.07 ± 0.11 b | 0.97 ± 0.02 b | 1.22 ± 0.03 | 1.09 ± 0.06 | 1.13 ± 0.01 | 0.79 ± 0.04 | 0.75 ± 0.01 | 0.76 ± 0.02 |
| ∑MUFA | 46.65 ± 1.61 | 42.76 ± 0.24 | 43.37 ± 0.46 | 29.21 ± 0.77 | 27.39 ± 0.49 | 29.80 ± 0.32 | 30.47 ± 0.77 a | 27.72 ± 0.09 b | 28.79 ± 0.12 ab |
| C18:2n6c | 16.18 ± 2.20 | 22.52 ± 0.38 | 19.53 ± 1.37 | 8.74 ± 1.14 | 10.71 ± 0.17 | 9.83 ± 0.18 | 10.11 ± 0.58 b | 12.18 ± 0.33 a | 9.90 ± 0.20 b |
| C18:3n3 | 2.56 ± 0.30 | 3.17 ± 0.44 | 3.45 ± 0.22 | 1.13 ± 0.22 | 1.07 ± 0.04 | 1.16 ± 0.16 | 1.60 ± 0.16 | 1.56 ± 0.09 | 1.37 ± 0.06 |
| C20:2n6 | 1.01 ± 0.05 | 0.95 ± 0.18 | 0.83 ± 0.01 | 2.54 ± 0.13 | 2.63 ± 0.11 | 2.55 ± 0.18 | 1.50 ± 0.08 b | 1.72 ± 0.03 a | 1.64 ± 0.02 ab |
| C20:4n6 (ARA) | 1.61 ± 0 | 1.65 ± 0.05 | 1.92 ± 0.13 | 15.21 ± 0.89 | 13.97 ± 0.40 | 14.54 ± 0.53 | 7.63 ± 0.21 | 7.36 ± 0.23 | 8.03 ± 0.26 |
| C20:3n3 | 0.37 ± 0.01 | 0.38 ± 0.02 | 0.38 ± 0.01 | 0.66 ± 0.01 a | 0.55 ± 0.01 b | 0.63 ± 0.02 a | 0.61 ± 0.03 | 0.59 ± 0.01 | 0.62 ± 0.02 |
| C20:5n3 (EPA) | 1.36 ± 0.09 | 1.85 ± 0.21 | 2.09 ± 0.16 | 10.22 ± 0.97 | 10.79 ± 0.20 | 10.40 ± 0.30 | 13.87 ± 0.19 b | 15.48 ± 0.20 a | 15.68 ± 0.26 a |
| C22:6n3 (DHA) | 1.40 ± 0.01 b | 1.96 ± 0.14 a | 2.17 ± 0.08 a | 6.53 ± 0.38 | 6.82 ± 0.32 | 6.00 ± 0.07 | 8.64 ± 0.17 | 9.77 ± 0.26 | 9.35 ± 0.31 |
| ∑PUFA | 25.45 ± 1.13 b | 33.32 ± 0.10 a | 31.23 ± 0.40 ab | 45.37 ± 0.47 | 46.81 ± 0.36 | 45.49 ± 0.14 | 44.20 ± 0.13 c | 48.84 ± 0.10 a | 46.82 ± 0.06 b |
| ∑EFA | 19.00 ± 1.10 | 25.90 ± 0.02 | 23.19 ± 0.51 | 10.22 ± 0.60 | 12.05 ± 0.10 | 11.39 ± 0 | 11.96 ± 0.17 b | 13.93 ± 0.19 a | 11.51 ± 0.14 b |
| ∑HUFA | 8.01 ± 0.20 b | 9.65 ± 0.40 ab | 10.67 ± 0.24 a | 33.75 ± 1.01 | 33.20 ± 0.44 | 32.72 ± 0.01 | 32.34 ± 0.16 b | 34.75 ± 0.30 a | 35.04 ± 0.07 a |
| ∑n-3 PUFA | 5.69 ± 0.28 b | 7.35 ± 0.54 ab | 8.08 ± 0.21 a | 18.54 ± 0.80 | 19.23 ± 0.34 | 18.19 ± 0.39 | 24.71 ± 0.08 b | 27.39 ± 0.25 a | 27.01 ± 0.09 a |
| ∑n-6 PUFA | 19.76 ± 1.23 | 25.97 ± 0.32 | 23.15 ± 0.68 | 26.84 ± 0.05 | 27.58 ± 0.19 | 27.31 ± 0.49 | 19.49 ± 0.23 b | 21.45 ± 0.08 a | 19.81 ± 0 b |
| n-3/n-6 PUFA | 0.29 ± 0.01 | 0.28 ± 0.04 | 0.35 ± 0.03 | 0.69 ± 0.04 | 0.70 ± 0.01 | 0.67 ± 0.04 | 1.27 ± 0.03 | 1.28 ± 0.03 | 1.36 ± 0.01 |
| ∑DHA + EPA | 2.76 ± 0.10 b | 3.80 ± 0.35 a | 4.26 ± 0.08 a | 16.75 ± 1.35 | 17.61 ± 0.52 | 16.40 ± 0.36 | 22.51 ± 0.02 b | 25.25 ± 0.46 a | 25.03 ± 0.05 a |
| DHA/EPA | 1.03 ± 0.06 | 1.07 ± 0.05 | 1.05 ± 0.12 | 0.64 ± 0.02 | 0.63 ± 0.02 | 0.58 ± 0.01 | 0.62 ± 0.02 | 0.63 ± 0.01 | 0.60 ± 0.03 |
| Free Amino Acids | Hepatopancreas | Gonad | Muscle | ||||||
|---|---|---|---|---|---|---|---|---|---|
| FW | SW | AW | FW | SW | AW | FW | SW | AW | |
| Female | |||||||||
| Aspartic acid | 41.33 ± 3.44 b | 58.10 ± 2.80 a | 61.89 ± 3.31 a | 10.23 ± 2.87 | 7.04 ± 1.28 | 8.21 ± 2.04 | 3.72 ± 0.58 | 2.98 ± 0.26 | 3.59 ± 0.22 |
| Arginine | 299.51 ± 28.50 | 275.89 ± 1.46 | 286.47 ± 13.84 | 223.54 ± 18.42 | 291.75 ± 29.03 | 227.79 ± 18.41 | 487.49 ± 1.84 b | 452.77 ± 17.15 b | 544.70 ± 10.59 a |
| Alanine | 164.85 ± 11.12 a | 121.78 ± 7.78 b | 135.10 ± 4.74 ab | 75.95 ± 12.48 | 82.20 ± 24.79 | 66.25 ± 2.35 | 303.43 ± 24.60 | 317.08 ± 18.38 | 354.05 ± 32.29 |
| Cysteine | 11.55 ± 0.19 b | 16.21 ± 0.75 a | 15.54 ± 0.20 a | 0.97 ± 0.65 | 0.41 ± 0.16 | 1.02 ± 0.08 | 3.14 ± 0.96 | 3.30 ± 0.46 | 3.41 ± 0.93 |
| Glutamic acid | 104.54 ± 8.34 | 111.19 ± 4.96 | 115.50 ± 3.16 | 104.86 ± 8.72 | 129.77 ± 34.62 | 120.67 ± 12.59 | 38.13 ± 8.16 | 51.94 ± 3.41 | 61.20 ± 17.91 |
| Glycine | 80.13 ± 0.10 | 80.09 ± 9.62 | 81.19 ± 3.07 | 43.89 ± 9.91 | 51.84 ± 14.00 | 43.84 ± 3.18 | 450.43 ± 33.41 b | 595.76 ± 7.73 a | 461.48 ± 32.33 b |
| Histidine | 32.51 ± 4.82 b | 49.74 ± 3.11 a | 47.94 ± 2.46 ab | 25.62 ± 1.86 b | 33.12 ± 0.52 a | 27.95 ± 0.57 ab | 16.56 ± 0.72 | 22.12 ± 1.52 | 22.44 ± 2.56 |
| Proline | 96.27 ± 14.42 b | 203.41 ± 17.57 a | 202.96 ± 8.17 a | 131.94 ± 17.98 b | 272.57 ± 32.06 ab | 315.82 ± 47.81 a | 238.99 ± 40.97 b | 367.13 ± 51.10 ab | 491.15 ± 44.92 a |
| Serine | 18.09 ± 2.18 | 13.58 ± 0.90 | 14.40 ± 0.37 | 8.48 ± 2.01 | 6.86 ± 0.65 | 4.92 ± 0.01 | 10.08 ± 1.21 | 9.51 ± 1.25 | 6.68 ± 0.15 |
| Tyrosine | 76.31 ± 1.43 b | 86.43 ± 2.69 a | 92.36 ± 0.44 a | 20.80 ± 8.10 | 18.64 ± 2.57 | 13.30 ± 0.86 | 15.11 ± 2.14 | 15.69 ± 2.24 | 21.44 ± 3.70 |
| Isoleucine ▲ | 39.21 ± 2.26 b | 75.79 ± 1.00 a | 49.94 ± 3.33 b | 10.49 ± 2.94 | 10.34 ± 0.90 | 7.87 ± 0.19 | 10.86 ± 1.24 | 13.99 ± 2.29 | 18.23 ± 2.74 |
| Leucine ▲ | 112.38 ± 6.02 b | 167.73 ± 0.95 a | 151.50 ± 1.42 a | 21.59 ± 9.25 | 22.55 ± 0.58 | 15.32 ± 1.56 | 23.33 ± 2.59 | 32.57 ± 6.10 | 40.77 ± 5.96 |
| Lysine ▲ | 158.23 ± 6.43 b | 164.07 ± 4.15 ab | 183.05 ± 0.78 a | 51.43 ± 6.59 b | 93.31 ± 6.33 a | 71.28 ± 1.37 ab | 33.16 ± 2.43 b | 39.17 ± 5.33 ab | 72.64 ± 11.85 a |
| Methionine ▲ | 41.07 ± 1.63 ab | 45.69 ± 2.36 a | 34.73 ± 2.61 b | 16.94 ± 5.20 | 10.69 ± 1.67 | 9.11 ± 0.02 | 21.84 ± 0.31 | 19.75 ± 1.11 | 27.15 ± 3.86 |
| Phenylalanine ▲ | 71.82 ± 1.68 b | 94.11 ± 0.05 a | 94.11 ± 0.41 a | 19.83 ± 6.62 | 19.57 ± 1.26 | 11.83 ± 0.98 | 13.40 ± 2.08 | 15.13 ± 2.95 | 20.63 ± 3.27 |
| Threonine ▲ | 61.61 ± 1.55 b | 79.43 ± 1.42 a | 83.23 ± 4.56 a | 56.60 ± 0.62 | 79.45 ± 11.39 | 59.13 ± 6.06 | 23.66 ± 1.08 | 31.92 ± 7.65 | 38.70 ± 7.42 |
| Valine ▲ | 67.23 ± 1.89 | 69.82 ± 0.68 | 71.94 ± 4.20 | 26.69 ± 4.85 | 21.57 ± 0.62 | 15.48 ± 1.56 | 30.23 ± 1.87 | 38.04 ± 5.00 | 39.45 ± 7.44 |
| ∑EFAA | 551.55 ± 18.37 b | 696.63 ± 5.77 a | 668.50 ± 12.09 a | 203.56 ± 34.83 | 257.49 ± 22.75 | 190.03 ± 11.74 | 156.47 ± 11.60 | 190.56 ± 30.43 | 257.58 ± 42.54 |
| ∑FAA | 1476.65 ± 4.09 b | 1713.04 ± 10.57 a | 1721.86 ± 46.53 a | 849.86 ± 80.54 | 1151.68 ± 95.42 | 1019.80 ± 94.39 | 1723.54 ± 40.57 b | 2028.83 ± 84.18 a | 2227.72 ± 12.45 a |
| PETFAA | 37.35 ± 1.14 | 40.67 ± 0.59 | 38.83 ± 0.35 | 23.78 ± 1.85 a | 22.35 ± 0.12 ab | 18.69 ± 0.58 b | 9.07 ± 0.46 | 9.35 ± 1.11 | 11.55 ± 1.84 |
| Male | |||||||||
| Aspartic acid | 45.09 ± 1.29 | 53.68 ± 7.18 | 55.49 ± 5.88 | 49.91 ± 3.14 | 61.92 ± 5.04 | 66.65 ± 2.83 | 2.29 ± 0.36 | 3.20 ± 0.51 | 2.98 ± 0.63 |
| Arginine | 255.53 ± 29.47 | 247.79 ± 22.87 | 223.99 ± 6.52 | 47.87 ± 1.16 | 45.28 ± 2.40 | 51.45 ± 2.66 | 489.02 ± 32.00 | 537.25 ± 16.27 | 490.85 ± 65.55 |
| Alanine | 141.21 ± 7.13 | 108.50 ± 11.38 | 126.99 ± 6.63 | 71.09 ± 7.57 | 59.15 ± 3.12 | 78.11 ± 3.14 | 300.88 ± 20.95 | 314.91 ± 49.62 | 308.30 ± 36.41 |
| Cysteine | 13.94 ± 0.18 | 15.88 ± 1.73 | 16.23 ± 0.67 | 3.03 ± 0.09 a | 0.12 ± 0.01 c | 2.15 ± 0.16 b | 0.95 ± 0.48 | 2.84 ± 0.65 | 2.49 ± 0.24 |
| Glutamic acid | 88.52 ± 13.75 | 98.54 ± 1522 | 99.91 ± 14.26 | 58.79 ± 7.22 | 50.39 ± 1.58 | 61.69 ± 3.12 | 54.32 ± 9.05 | 74.84 ± 10.81 | 69.55 ± 9.58 |
| Glycine | 66.90 ± 0.94 | 78.89 ± 0.58 | 77.14 ± 8.51 | 27.57 ± 2.43 | 26.67 ± 0.91 | 27.77 ± 0.30 | 437.69 ± 28.26 | 561.13 ± 33.12 | 546.93 ± 33.55 |
| Histidine | 35.56 ± 5.40 | 44.41 ± 4.66 | 45.11 ± 4.08 | 8.75 ± 0.61 c | 11.42 ± 0.16 b | 13.72 ± 0.17 a | 13.17 ± 1.84 b | 21.18 ± 1.86 a | 15.31 ± 0.77 ab |
| Proline | 109.18 ± 0.87 | 253.22 ± 19.02 | 262.20 ± 83.68 | 73.92 ± 12.06 | 108.29 ± 13.53 | 137.26 ± 35.29 | 208.61 ± 21.22 b | 473.18 ± 77.05 a | 476.86 ± 51.06 a |
| Serine | 16.03 ± 1.43 | 13.70 ± 1.22 | 18.50 ± 0.16 | 3.25 ± 0.03 | 3.51 ± 0.57 | 4.10 ± 0.62 | 8.19 ± 1.47 | 8.31 ± 0.10 | 5.51 ± 1.25 |
| Tyrosine | 86.85 ± 2.53 | 80.89 ± 8.96 | 80.48 ± 5.16 | 19.99 ± 1.37 | 19.55 ± 0.41 | 19.56 ± 0.22 | 13.24 ± 1.10 b | 21.22 ± 0.65 a | 17.37 ± 2.43 ab |
| Isoleucine ▲ | 44.24 ± 5.23 | 50.56 ± 5.39 | 54.31 ± 5.51 | 10.55 ± 0.68 b | 12.49 ± 0.37 b | 15.74 ± 0.82 a | 9.60 ± 2.17 | 13.45 ± 1.08 | 12.32 ± 2.79 |
| Leucine ▲ | 126.43 ± 2.35 | 157.29 ± 10.77 | 140.48 ± 11.37 | 15.40 ± 2.35 b | 17.07 ± 0.53 ab | 21.96 ± 0.62 a | 22.63 ± 3.96 | 28.93 ± 1.39 | 26.94 ± 5.53 |
| Lysine ▲ | 174.21 ± 9.13 | 143.66 ± 16.03 | 141.24 ± 7.96 | 26.24 ± 2.88 | 24.41 ± 0.97 | 27.66 ± 0.97 | 44.22 ± 2.36 | 48.05 ± 2.59 | 55.60 ± 6.77 |
| Methionine ▲ | 41.06 ± 0.05 | 43.75 ± 6.20 | 38.58 ± 2.94 | 5.87 ± 0.90 | 4.70 ± 0.70 | 5.86 ± 0.14 | 14.99 ± 0.35 | 22.58 ± 4.11 | 17.47 ± 0.19 |
| Phenylalanine ▲ | 82.88 ± 2.13 | 88.34 ± 10.24 | 86.42 ± 8.34 | 8.15 ± 0.79 | 8.93 ± 0.46 | 10.51 ± 0.10 | 10.21 ± 1.64 | 15.42 ± 0.46 | 12.63 ± 1.75 |
| Threonine ▲ | 70.37 ± 12.98 | 73.90 ± 8.24 | 80.67 ± 4.43 | 9.53 ± 0.15 c | 13.38 ± 0.27 b | 16.66 ± 0.98 a | 21.79 ± 4.77 | 30.70 ± 0.71 | 35.17 ± 5.18 |
| Valine ▲ | 67.41 ± 3.90 | 70.02 ± 6.31 | 72.26 ± 4.05 | 14.90 ± 0.07 a | 9.92 ± 0.82 b | 11.86 ± 0.37 b | 29.14 ± 6.17 | 38.67 ± 5.90 | 34.42 ± 6.19 |
| ∑EFAA | 606.61 ± 35.67 | 627.53 ± 18.24 | 613.95 ± 44.59 | 90.65 ± 7.52 | 90.89 ± 3.38 | 110.27 ± 3.99 | 152.58 ± 21.42 | 197.80 ± 9.65 | 194.54 ± 28.02 |
| ∑FAA | 1465.42 ± 54.30 | 1623.03 ± 111.06 | 1620.00 ± 180.13 | 454.82 ± 23.95 | 477.20 ± 10.18 | 572.73 ± 50.49 | 1680.96 ± 73.19 | 2215.86 ± 200.09 | 2130.69 ± 229.01 |
| PETFAA | 41.36 ± 0.90 | 38.77 ± 1.53 | 38.06 ± 1.48 | 20.07 ± 2.71 | 19.04 ± 0.30 | 19.34 ± 1.01 | 9.04 ± 0.88 | 8.96 ± 0.37 | 9.09 ± 0.34 |
| Free Amino Acids | Flavor Characteristics | Threshold (mg/100 mL) | Hepatopancreas | Gonad | Muscle | ||||||
|---|---|---|---|---|---|---|---|---|---|---|---|
| FW | SW | AW | FW | SW | AW | FW | SW | AW | |||
| Female | |||||||||||
| Aspartic acid | umami (+) | 100 | 0.41 | 0.58 | 0.62 | 0.10 | 0.07 | 0.08 | 0.04 | 0.03 | 0.04 |
| Glutamic acid | umami (+) | 30 | 3.48 | 3.71 | 3.85 | 3.50 | 4.33 | 4.02 | 1.27 | 1.73 | 2.04 |
| ∑TUV | 3.89 | 4.29 | 4.47 | 3.60 | 4.40 | 4.10 | 1.31 | 1.76 | 2.08 | ||
| Alanine | sweetness (+) | 60 | 2.75 | 2.03 | 2.25 | 1.27 | 1.37 | 1.10 | 5.06 | 5.28 | 5.90 |
| Glycine | sweetness (+) | 130 | 0.62 | 0.62 | 0.62 | 0.34 | 0.40 | 0.34 | 3.46 | 4.58 | 3.55 |
| Serine | sweetness (+) | 150 | 0.12 | 0.09 | 0.10 | 0.06 | 0.05 | 0.03 | 0.07 | 0.06 | 0.04 |
| Threonine | sweetness (+) | 260 | 0.24 | 0.31 | 0.32 | 0.22 | 0.31 | 0.23 | 0.09 | 0.12 | 0.15 |
| Proline | sweetness/bitterness (+) | 300 | 0.32 | 0.68 | 0.68 | 0.44 | 0.91 | 1.05 | 0.80 | 1.22 | 1.64 |
| ∑TSV | 4.05 | 3.73 | 3.97 | 2.33 | 3.04 | 2.75 | 9.48 | 11.26 | 11.28 | ||
| Arginine | sweetness/bitterness (−) | 50 | 5.99 | 5.52 | 5.73 | 4.47 | 5.83 | 4.56 | 9.75 | 9.06 | 10.89 |
| Lysine | sweetness/bitterness (−) | 50 | 3.16 | 3.28 | 3.66 | 1.03 | 1.87 | 1.43 | 0.66 | 0.78 | 1.45 |
| Valine | sweetness/bitterness (−) | 40 | 1.68 | 1.75 | 1.80 | 0.67 | 0.54 | 0.39 | 0.76 | 0.95 | 0.99 |
| Methionine | bitterness/sweetness/sulphur (−) | 30 | 1.37 | 1.52 | 1.16 | 0.56 | 0.36 | 0.30 | 0.73 | 0.66 | 0.91 |
| Histidine | bitterness (−) | 20 | 1.63 | 2.49 | 2.40 | 1.28 | 1.66 | 1.40 | 0.15 | 0.17 | 0.23 |
| Isoleucine | bitterness (−) | 90 | 0.44 | 0.84 | 0.55 | 0.12 | 0.11 | 0.09 | 0.12 | 0.16 | 0.20 |
| Leucine | bitterness (−) | 190 | 0.59 | 0.88 | 0.80 | 0.11 | 0.12 | 0.08 | 0.12 | 0.17 | 0.21 |
| Phenylalanine | bitterness (−) | 90 | 0.80 | 1.05 | 1.05 | 0.22 | 0.22 | 0.13 | 0.83 | 1.11 | 1.12 |
| ∑TBV | 15.66 | 17.33 | 17.15 | 8.46 | 10.71 | 8.38 | 13.12 | 13.06 | 16.00 | ||
| Male | |||||||||||
| Aspartic acid | umami (+) | 100 | 0.45 | 0.54 | 0.55 | 0.50 | 0.62 | 0.67 | 0.02 | 0.03 | 0.03 |
| Glutamic acid | umami (+) | 30 | 2.95 | 3.28 | 3.33 | 1.96 | 1.68 | 2.06 | 1.81 | 2.49 | 2.32 |
| ∑TUV | 3.40 | 3.82 | 3.88 | 2.46 | 2.30 | 2.73 | 1.83 | 2.52 | 2.35 | ||
| Alanine | sweetness (+) | 60 | 2.35 | 1.81 | 2.12 | 1.18 | 0.99 | 1.30 | 5.01 | 5.25 | 5.14 |
| Glycine | sweetness (+) | 130 | 0.51 | 0.61 | 0.59 | 0.21 | 0.21 | 0.21 | 3.37 | 4.32 | 4.21 |
| Serine | sweetness (+) | 150 | 0.11 | 0.09 | 0.12 | 0.02 | 0.02 | 0.03 | 0.05 | 0.06 | 0.04 |
| Threonine | sweetness (+) | 260 | 0.27 | 0.28 | 0.31 | 0.04 | 0.05 | 0.06 | 0.08 | 0.12 | 0.14 |
| Proline | sweetness/bitterness (+) | 300 | 0.36 | 0.84 | 0.87 | 0.25 | 0.36 | 0.46 | 0.70 | 1.58 | 1.59 |
| ∑TSV | 3.60 | 3.63 | 4.01 | 1.70 | 1.63 | 2.06 | 9.21 | 11.33 | 11.12 | ||
| Arginine | sweetness/bitterness (−) | 50 | 5.11 | 4.96 | 4.48 | 0.96 | 0.91 | 1.03 | 9.78 | 10.75 | 9.82 |
| Lysine | sweetness/bitterness (−) | 50 | 3.48 | 2.87 | 2.82 | 0.52 | 0.49 | 0.55 | 0.88 | 0.96 | 1.11 |
| Valine | sweetness/bitterness (−) | 40 | 1.69 | 1.75 | 1.81 | 0.37 | 0.25 | 0.30 | 0.73 | 0.97 | 0.86 |
| Methionine | bitterness/sweetness/sulphur (−) | 30 | 1.37 | 1.46 | 1.29 | 0.20 | 0.16 | 0.20 | 0.50 | 0.75 | 0.58 |
| Histidine | bitterness (−) | 20 | 1.78 | 2.22 | 2.26 | 0.44 | 0.57 | 0.69 | 0.11 | 0.17 | 0.14 |
| Isoleucine | bitterness (−) | 90 | 0.49 | 0.56 | 0.60 | 0.12 | 0.14 | 0.17 | 0.11 | 0.15 | 0.14 |
| Leucine | bitterness (−) | 190 | 0.67 | 0.83 | 0.74 | 0.08 | 0.09 | 0.12 | 0.12 | 0.15 | 0.14 |
| Phenylalanine | bitterness (−) | 90 | 0.92 | 0.98 | 0.96 | 0.09 | 0.10 | 0.12 | 0.66 | 1.06 | 0.77 |
| ∑TBV | 15.51 | 15.63 | 14.96 | 2.78 | 2.71 | 3.18 | 12.89 | 14.96 | 13.56 | ||
Publisher’s Note: MDPI stays neutral with regard to jurisdictional claims in published maps and institutional affiliations. |
© 2022 by the authors. Licensee MDPI, Basel, Switzerland. This article is an open access article distributed under the terms and conditions of the Creative Commons Attribution (CC BY) license (https://creativecommons.org/licenses/by/4.0/).
Share and Cite
Wang, S.; Guo, K.; Luo, L.; Zhang, R.; Xu, W.; Song, Y.; Zhao, Z. Fattening in Saline and Alkaline Water Improves the Color, Nutritional and Taste Quality of Adult Chinese Mitten Crab Eriocheir sinensis. Foods 2022, 11, 2573. https://doi.org/10.3390/foods11172573
Wang S, Guo K, Luo L, Zhang R, Xu W, Song Y, Zhao Z. Fattening in Saline and Alkaline Water Improves the Color, Nutritional and Taste Quality of Adult Chinese Mitten Crab Eriocheir sinensis. Foods. 2022; 11(17):2573. https://doi.org/10.3390/foods11172573
Chicago/Turabian StyleWang, Shihui, Kun Guo, Liang Luo, Rui Zhang, Wei Xu, Yingying Song, and Zhigang Zhao. 2022. "Fattening in Saline and Alkaline Water Improves the Color, Nutritional and Taste Quality of Adult Chinese Mitten Crab Eriocheir sinensis" Foods 11, no. 17: 2573. https://doi.org/10.3390/foods11172573
APA StyleWang, S., Guo, K., Luo, L., Zhang, R., Xu, W., Song, Y., & Zhao, Z. (2022). Fattening in Saline and Alkaline Water Improves the Color, Nutritional and Taste Quality of Adult Chinese Mitten Crab Eriocheir sinensis. Foods, 11(17), 2573. https://doi.org/10.3390/foods11172573