
Development of Saturated Fat Replacers: Conventional and Nano-Emulsions Stabilised by Lecithin and Hydroxylpropyl Methylcellulose


Abstract
:1. Introduction
2. Materials and Methods
2.1. Materials
2.2. Reagents and Standards
2.3. Preparation of HPMC Solutions
2.4. Preparation of Conventional Emulsions and Nanoemulsion Stabilised by Lecithin and HPMC
2.5. Interfacial Tension Measurement
2.6. Rheological Measurements
2.6.1. Amplitude Sweep
2.6.2. Frequency Sweep
2.6.3. Temperature Ramp Viscoelasticity
2.7. Textural Analysis
2.8. Measurement of Emulsion Mean Droplet Diameter (MDD), Polydispersity Index (PDI), and Particle Charge (Zeta Potential)
2.9. Creaming Index (CI)
2.10. Determination of Thiobarbituric Acid Reactive Substances (TBARS)
2.11. Scanning Electron Microscopy (SEM)
2.12. Statistical Analysis
3. Results and Discussion
3.1. Characteristic of HPMC Solutions
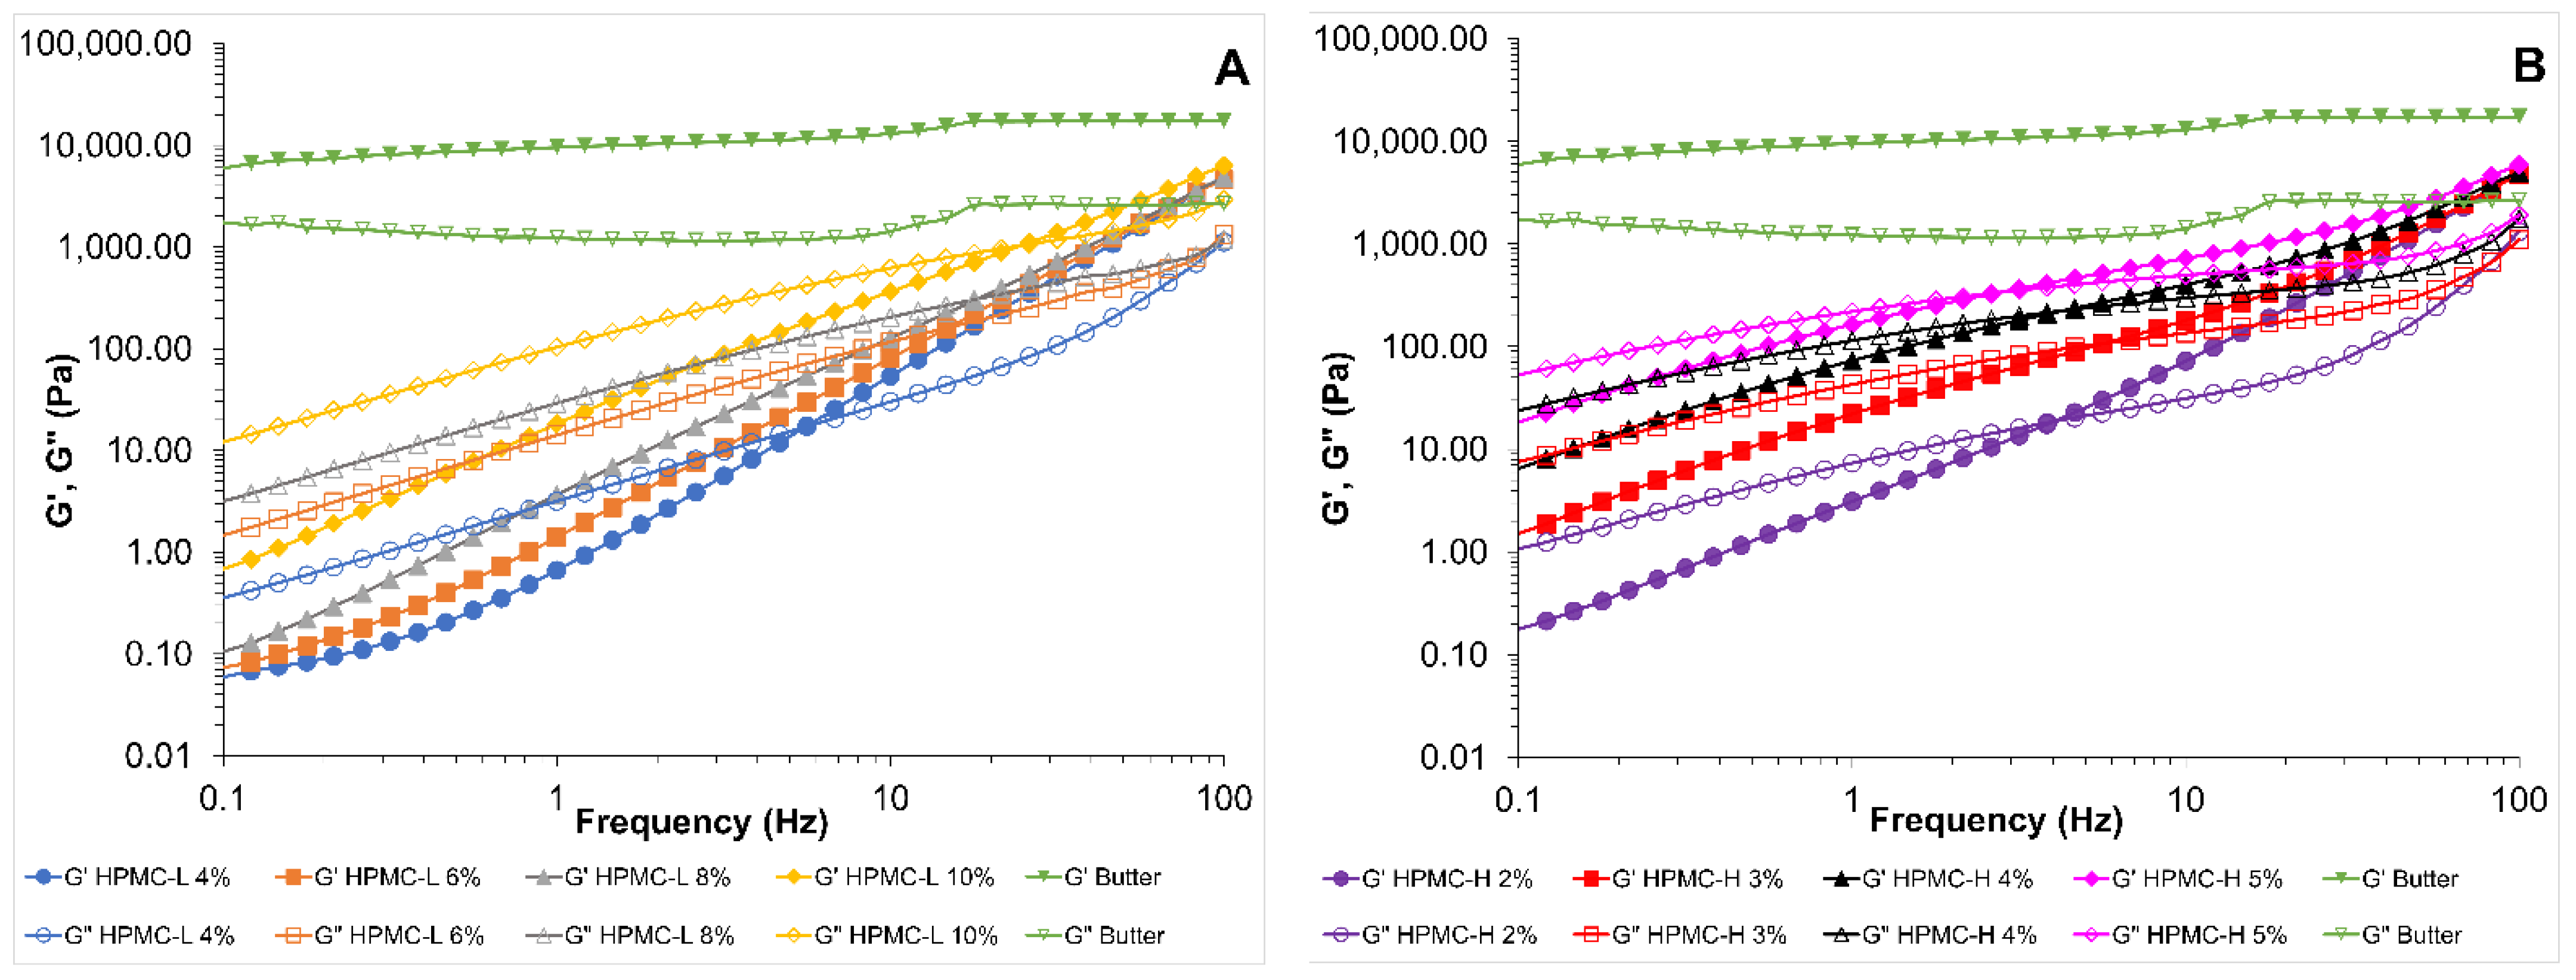
3.1.1. Viscoelastic Properties of HPMC Solutions and Butter
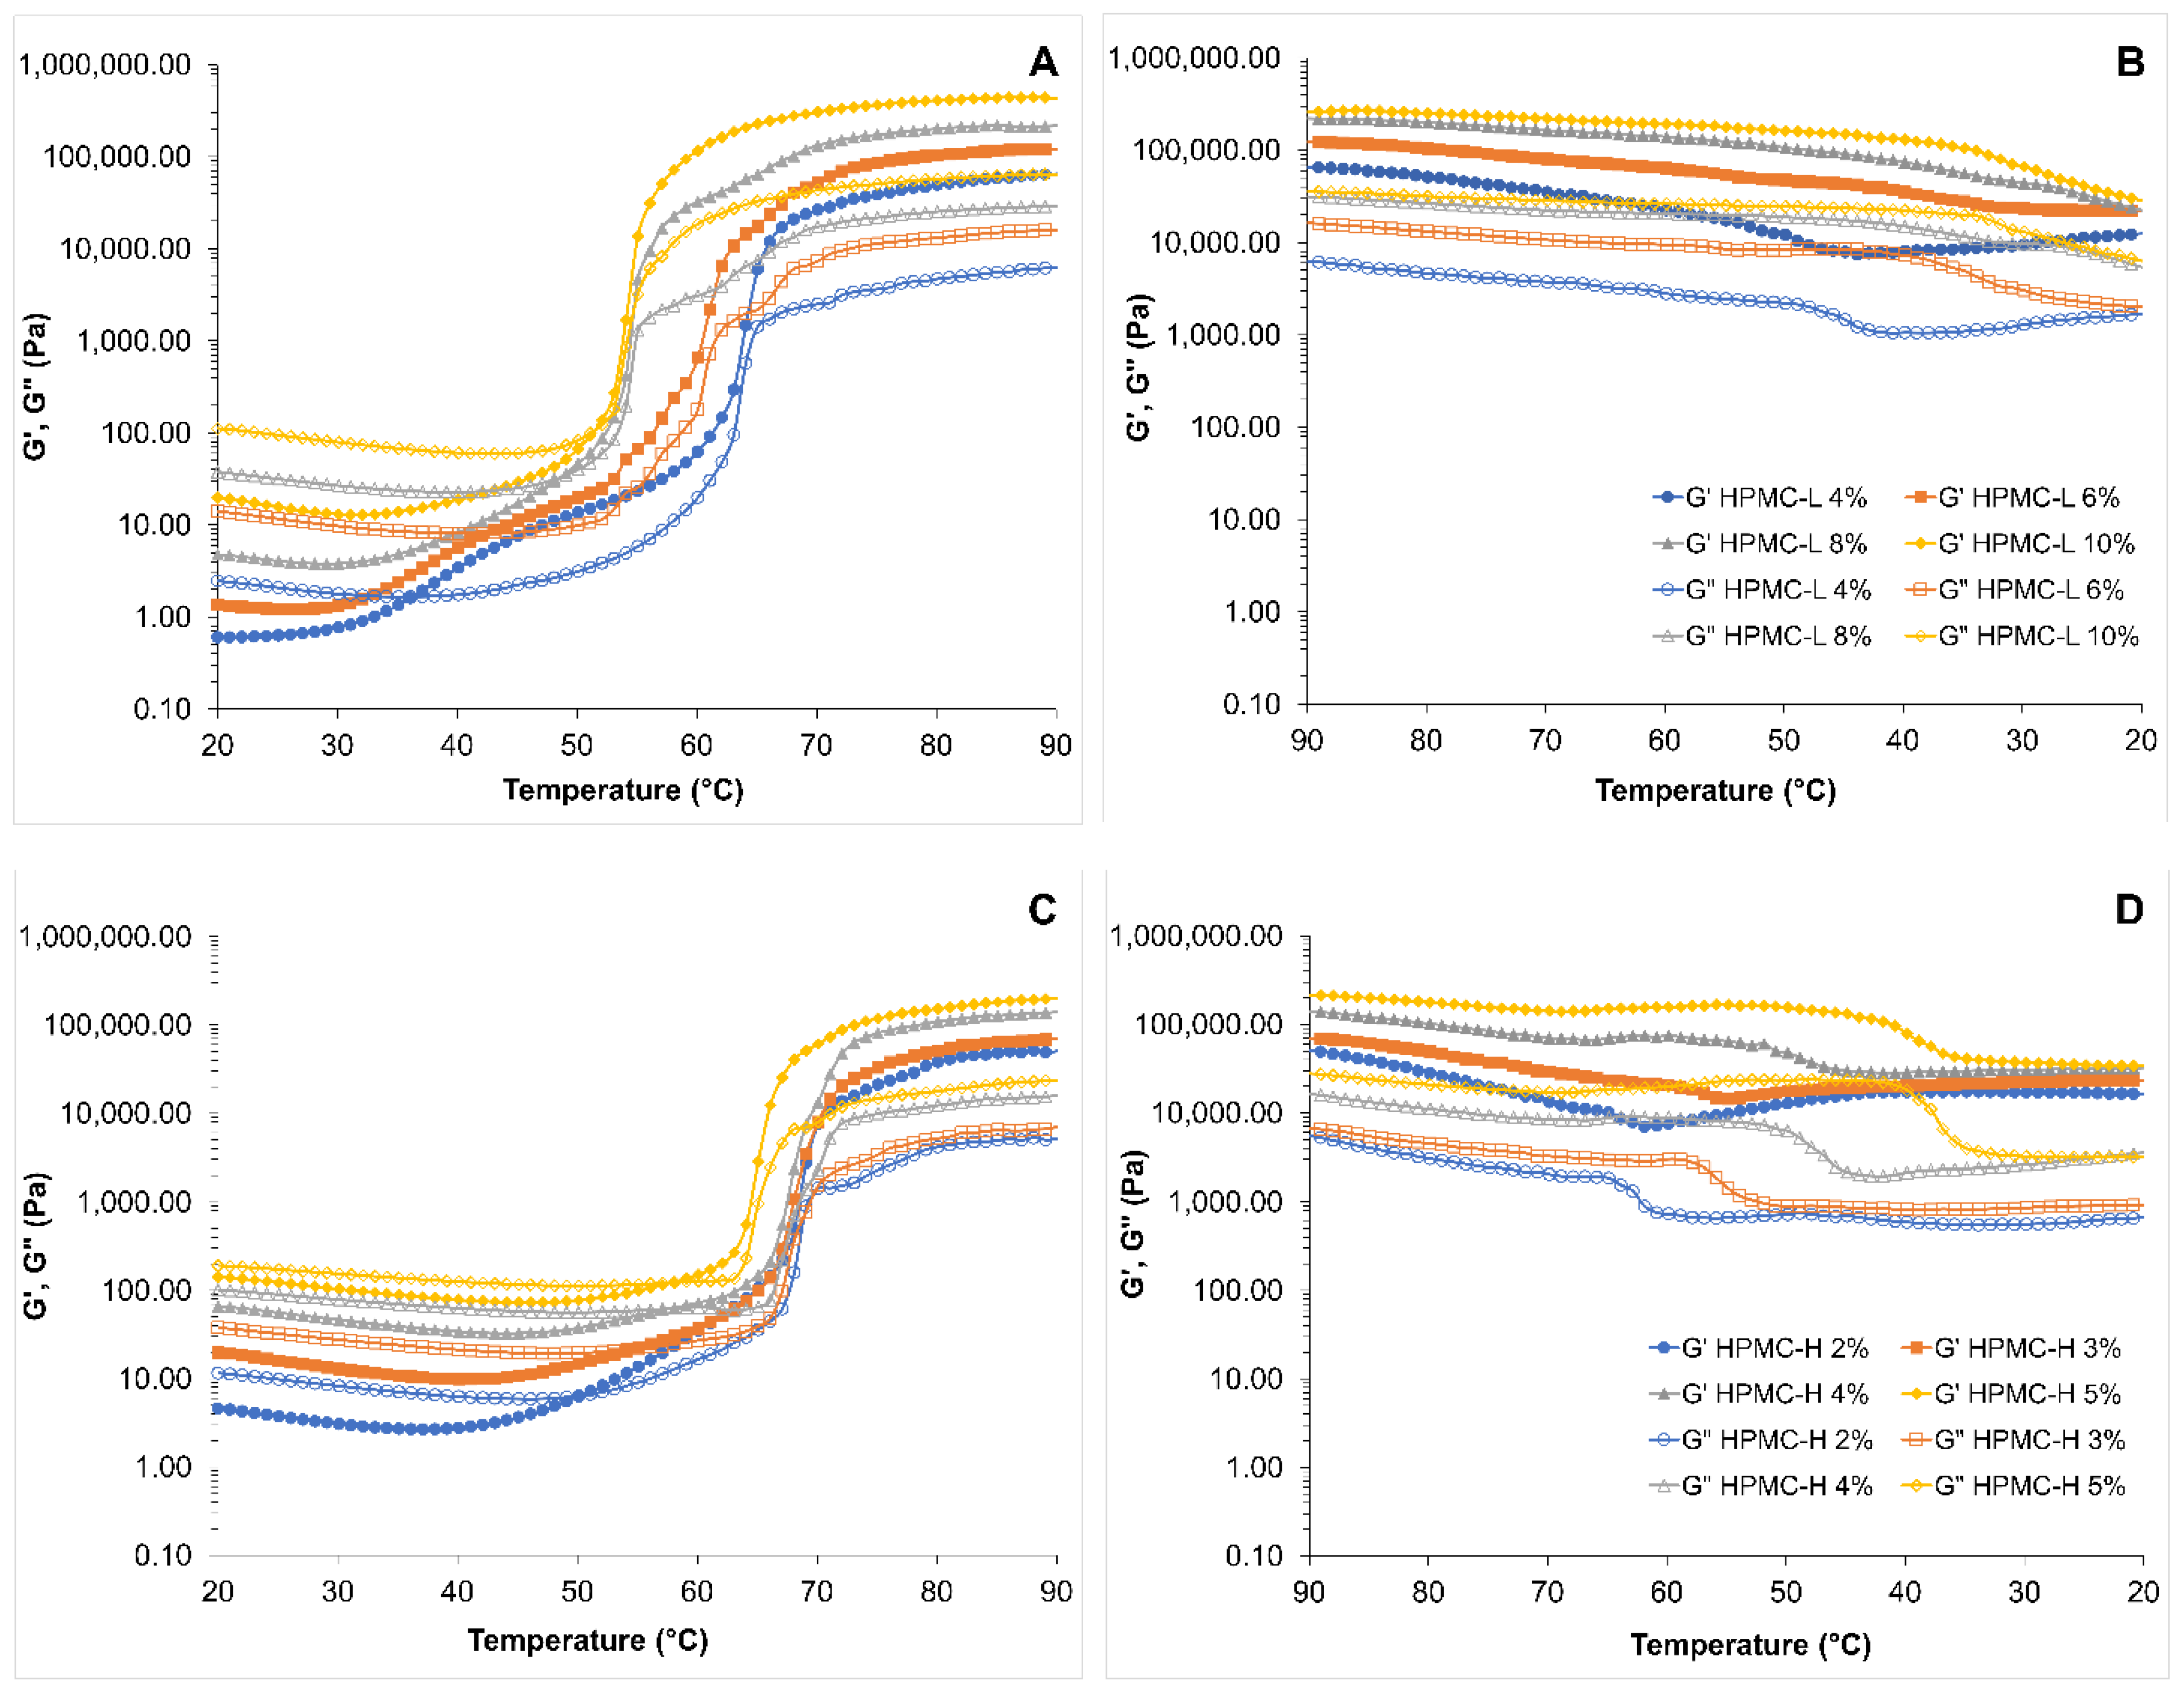
3.1.2. Temperature Ramp Viscoelasticity of HPMC Solutions and Butter
3.1.3. Firmness and Spreadability of HPMC Solutions
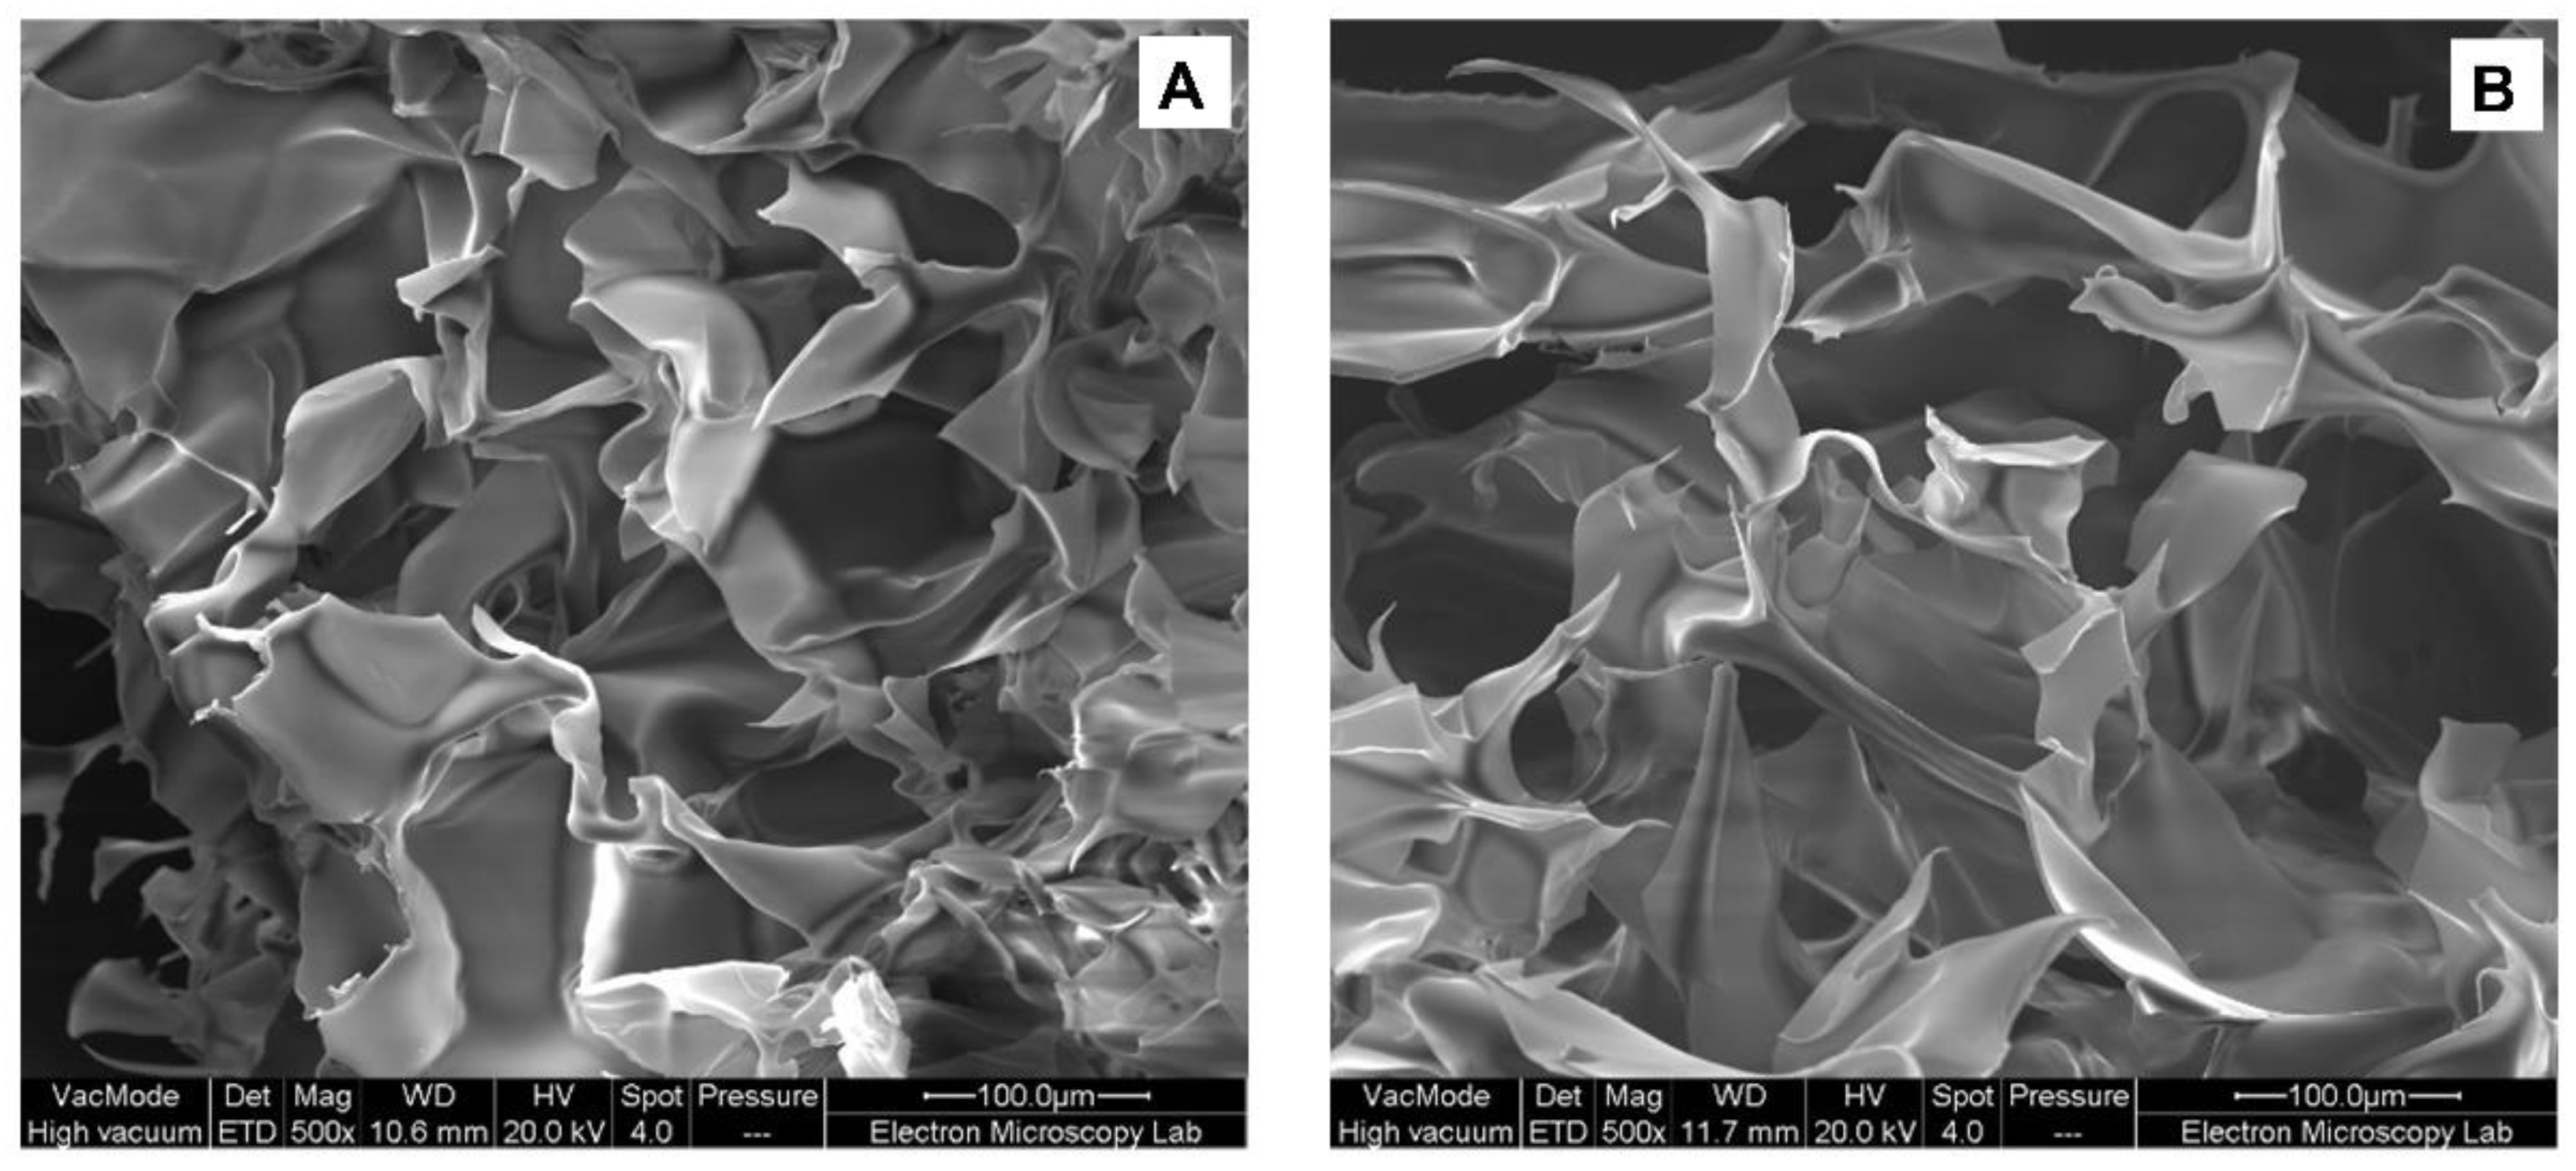
3.1.4. Scanning Electron Microscopy of HPMC Solutions
3.2. Conventional Emulsion and Nanoemulsion Stabilized by Lecithin and HPMC-L
3.2.1. Viscoelastic Properties of Emulsions
3.2.2. Temperature-Dependent Rheological Behaviour of Emulsions
3.2.3. Firmness and Spreadability of Complex Conventional Emulsions and Nanoemulsions
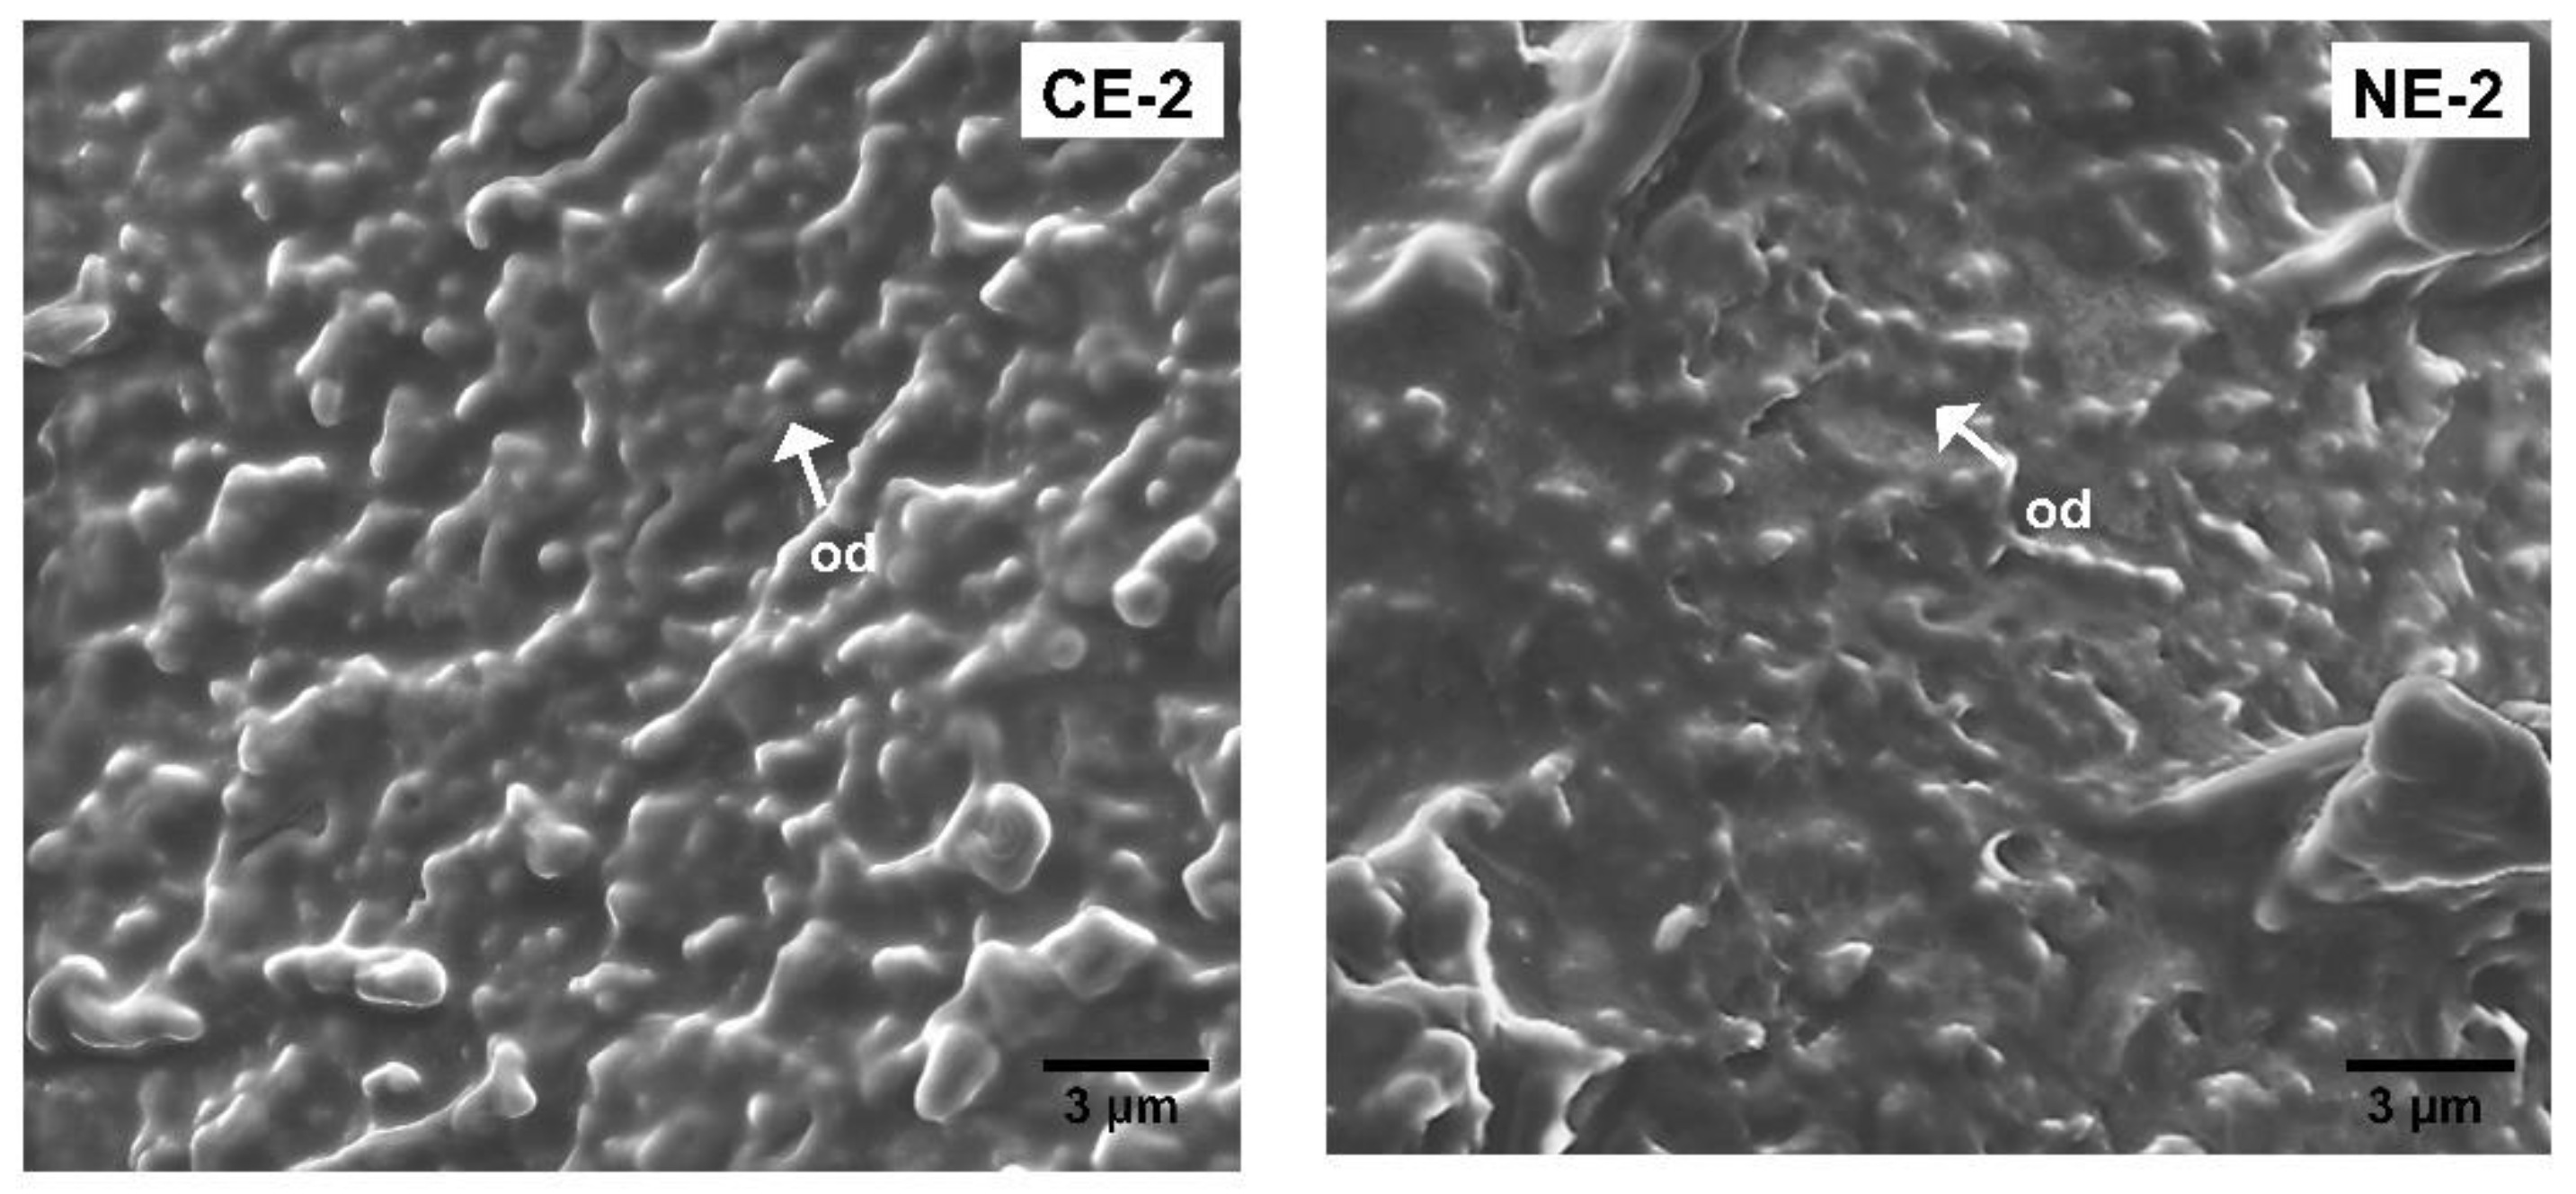
3.2.4. Scanning Electron Microscopy of Complex Conventional Emulsion and Nanoemulsion
3.2.5. Physical and Chemical Stability of Emulsions
Creaming in Emulsions
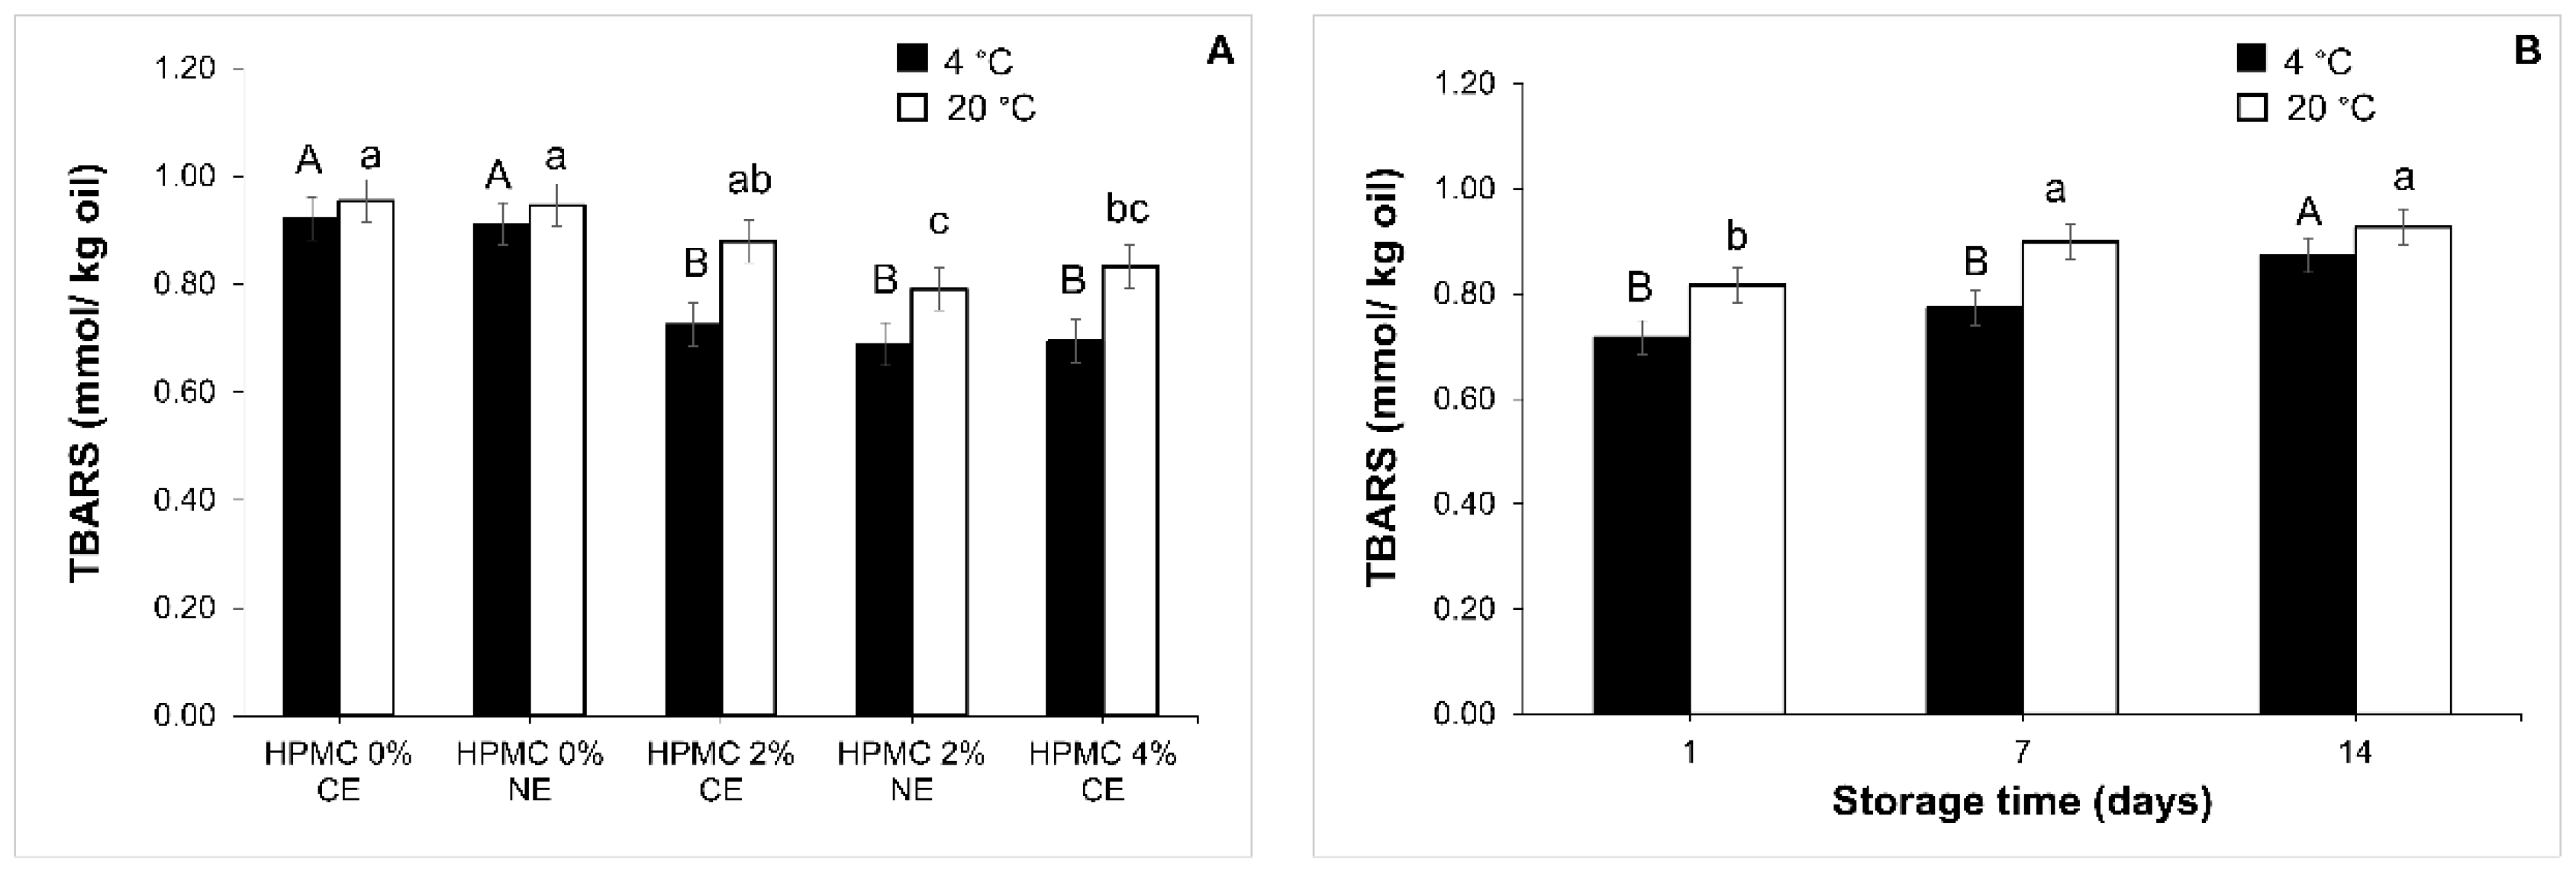
Lipid Oxidation in the Emulsions over Storage Time
4. Conclusions
Supplementary Materials
 . Conventional emulsion (CE-0
  ; CE-2
  ; CE-4
  ). Nanoemulsion (NE-0
  ; NE-2
  ). Filled symbols correspond to elastic modulus (G’) and open symbols to viscous modulus (G”); Table S1: MDD and PDI of conventional (CE) and nanoemulsion (NE) stabilised with lecithin and HPMC (0%, 2%, and 4%).
Author Contributions
Funding
Institutional Review Board Statement
Informed Consent Statement
Data Availability Statement
Acknowledgments
Conflicts of Interest
References
- Buckland, G.; Mayén, A.L.; Agudo, A.; Travier, N.; Navarro, C.; Huerta, J.M.; Chirlaque, M.D.; Barricarte, A.; Ardanaz, E.; Moreno-Iribas, C.; et al. Olive oil intake and mortality within the Spanish population (EPIC-Spain). Am. J. Clin. Nutr. 2012, 96, 142–149. [Google Scholar] [CrossRef] [PubMed] [Green Version]
- Ebbesson, S.O.E.; Voruganti, V.S.; Higgins, P.B.; Fabsitz, R.R.; Ebbesson, L.O.; Laston, S.; Harris, W.S.; Kennish, J.; Umans, B.D.; Wang, H.; et al. Fatty acids linked to cardiovascular mortality are associated with risk factors. Int. J. Circumpolar Health 2015, 74, 28055. [Google Scholar] [CrossRef] [PubMed] [Green Version]
- McClements, D.J.; Decker, E.A. Lipid oxidation in oil-in-water emulsions: Impact of molecular environment on chemical reactions in heterogeneous food systems. J. Food Sci. 2000, 65, 1270–1282. [Google Scholar] [CrossRef]
- McClements, D.J. Emulsion ingredients. In Food Emulsions: Principles, Practices, and Techniques; McClements, D.J., Ed.; CRC Press: Boca Raton, FL, USA, 2016. [Google Scholar]
- Patel, A.R.; Dewettinck, K. Edible oil structuring: An overview and recent updates. Food Funct. 2016, 7, 2–29. [Google Scholar] [CrossRef] [Green Version]
- Morley, W. Reducing saturated fat using emulsion technology. In Reducing Saturated Fats in Foods; Elsevier: Amsterdam, The Netherlands, 2011; pp. 131–157. [Google Scholar]
- Lim, J.; Jeong, S.; Lee, J.; Park, S.; Lee, J.; Lee, S. Effect of shortening replacement with oleogels on the rheological and tomographic characteristics of aerated baked goods: Solid fat replacement with oleogels in muffins. J. Sci. Food Agric. 2017, 97, 3727–3732. [Google Scholar] [CrossRef]
- Giacomozzi, A.S.; Carrín, M.E.; Palla, C.A. Muffins elaborated with optimized monoglycerides oleogels: From solid fat replacer obtention to product quality evaluation: Muffins elaborated with optimized oleogels. J. Food Sci. 2018, 83, 1505–1515. [Google Scholar] [CrossRef]
- Sanz, T.; Quiles, A.; Salvador, A.; Hernando, I. Structural changes in biscuits made with cellulose emulsions as fat replacers. Food Sci. Technol. Int. 2017, 23, 480–489. [Google Scholar] [CrossRef] [Green Version]
- Tarancón, P.; Salvador, A.; Sanz, T. Sunflower oil–water–cellulose ether emulsions as trans-fatty acid-free fat replacers in biscuits: Texture and acceptability study. Food Bioprocess Technol. 2013, 6, 2389–2398. [Google Scholar] [CrossRef]
- Santhanam, A.K.; Lekshmi, M.; Chouksey, M.K.; Tripathi, G.; Gudipati, V. Delivery of omega-3 fatty acids into cake through emulsification of fish oil-in-milk and encapsulation by spray drying with added polymers. Dry. Technol. 2015, 33, 83–91. [Google Scholar] [CrossRef]
- Joung, H.J.; Choi, M.J.; Kim, J.T.; Park, S.H.; Park, H.J.; Shin, G.H. Development of food-grade curcumin nanoemulsion and its potential application to food beverage system: Antioxidant property and In vitro digestion. J. Food Sci. 2016, 81, N745–N753. [Google Scholar] [CrossRef]
- Komaiko, J.S.; McClements, D.J. Formation of food-grade nanoemulsions using low-energy preparation methods: A review of available methods. Compr. Rev. Food Sci. Food Saf. 2016, 15, 331–352. [Google Scholar] [CrossRef]
- Pathakoti, K.; Manubolu, M.; Hwang, H.-M. Nanostructures: Current uses and future applications in food science. J. Food Drug Anal. 2017, 25, 245–253. [Google Scholar] [CrossRef] [PubMed] [Green Version]
- Kim, S.O.; Ha, T.V.A.; Choi, Y.J.; Ko, S. Optimization of homogenization–evaporation process for lycopene nanoemulsion production and its beverage applications. J. Food Sci. 2014, 79, N1604–N1610. [Google Scholar] [CrossRef] [PubMed]
- Mason, T.G.; Wilking, J.N.; Meleson, K.; Chang, C.B.; Graves, S.M. Nanoemulsions: Formation, structure, and physical properties. J. Phys. Condens. Matter 2006, 18, R635–R666. [Google Scholar] [CrossRef] [Green Version]
- Qian, C.; Decker, E.A.; Xiao, H.; McClements, D.J. Physical and chemical stability of β-carotene-enriched nanoemulsions: Influence of pH, ionic strength, temperature, and emulsifier type. Food Chem. 2012, 132, 1221–1229. [Google Scholar] [CrossRef] [PubMed]
- Hategekimana, J.; Chamba, M.V.M.; Shoemaker, C.F.; Majeed, H.; Zhong, F. Vitamin E nanoemulsions by emulsion phase inversion: Effect of environmental stress and long-term storage on stability and degradation in different carrier oil types. Colloids Surf. A Physicochem. Eng. Asp. 2015, 483, 70–80. [Google Scholar] [CrossRef]
- Öztürk, B. Nanoemulsions for food fortification with lipophilic vitamins: Production challenges, stability, and bioavailability: Nanoemulsion delivery systems for lipophilic vitamins. Eur. J. Lipid Sci. Technol. 2017, 119, 1500539. [Google Scholar] [CrossRef]
- Chan, S.W.; Mirhosseini, H.; Taip, F.S.; Ling, T.C.; Tan, C.P. Stability of CoQ10-loaded oil-in-water (O/W) emulsion: Effect of carrier oil and emulsifier type. Food Biophys. 2013, 8, 273–281. [Google Scholar] [CrossRef]
- Sahafi, S.M.; Goli, S.A.H.; Kadivar, M.; Varshosaz, J. Preparation and characterization of bioactive oils nanoemulsions: Effect of oil unsaturation degree, emulsifier type and concentration. J. Dispers. Sci. Technol. 2018, 39, 676–686. [Google Scholar] [CrossRef]
- Gahruie, H.H.; Niakousari, M.; Parastouei, K.; Mokhtarian, M.; Eş, I.; Mousavi Khaneghah, A. Co-encapsulation of vitamin D3 and saffron petals’ bioactive compounds in nanoemulsions: Effects of emulsifier and homogenizer types. J. Food Processing Preserv. 2020, 44, e14629. [Google Scholar] [CrossRef]
- McClements, D.J.; Jafari, S.M. Improving emulsion formation, stability and performance using mixed emulsifiers: A review. Adv. Colloid Interface Sci. 2018, 251, 55–79. [Google Scholar] [CrossRef] [PubMed]
- Jacobsen, C.; Let, M.B.; Nielsen, N.S.; Meyer, A.S. Antioxidant strategies for preventing oxidative flavour deterioration of foods enriched with n-3 polyunsaturated lipids: A comparative evaluation. Trends Food Sci. Technol. 2008, 19, 76–93. [Google Scholar] [CrossRef] [Green Version]
- Kargar, M.; Spyropoulos, F.; Norton, I.T. The effect of interfacial microstructure on the lipid oxidation stability of oil-in-water emulsions. J. Colloid Interface Sci. 2011, 357, 527–533. [Google Scholar] [CrossRef] [PubMed]
- Yoo, Y.J.; Um, I.C. Examination of thermo-gelation behavior of HPMC and HEMC aqueous solutions using rheology. Korea Aust. Rheol. J. 2013, 25, 67–75. [Google Scholar] [CrossRef]
- Li, X.; Al-Assaf, S.; Fang, Y.; Phillips, G.O. Competitive adsorption between sugar beet pectin (SBP) and hydroxypropyl methylcellulose (HPMC) at the oil/water interface. Carbohydr. Polym. 2013, 91, 573–580. [Google Scholar] [CrossRef] [PubMed] [Green Version]
- Seyedlar, R.M.; Nodehi, A.; Atai, M.; Imani, M. Gelation behavior of in situ forming gels based on HPMC and biphasic calcium phosphate nanoparticles. Carbohydr. Polym. 2014, 99, 257–263. [Google Scholar] [CrossRef] [PubMed]
- Hussain, S.; Keary, C.; Craig, D.Q.M. A thermorheological investigation into the gelation and phase separation of hydroxypropyl methylcellulose aqueous systems. Polymer 2002, 43, 5623–5628. [Google Scholar] [CrossRef]
- Silva, S.M.C.; Pinto, F.V.; Antunes, F.E.; Miguel, M.G.; Sousa, J.J.S.; Pais, A.A.C.C. Aggregation and gelation in hydroxypropylmethyl cellulose aqueous solutions. J. Colloid Interface Sci. 2008, 327, 333–340. [Google Scholar] [CrossRef] [Green Version]
- Sanz, T.; Falomir, M.; Salvador, A. Reversible thermal behaviour of vegetable oil cellulose ether emulsions as fat replacers. Influence of glycerol. Food Hydrocoll. 2015, 46, 19–27. [Google Scholar] [CrossRef]
- Meng, Z.; Qi, K.; Guo, Y.; Wang, Y.; Liu, Y. Physical properties, microstructure, intermolecular forces, and oxidation stability of soybean oil oleogels structured by different cellulose ethers. Eur. J. Lipid Sci. Technol. 2018, 120, 1700287. [Google Scholar] [CrossRef]
- Meng, Z.; Qi, K.; Guo, Y.; Wang, Y.; Liu, Y. Effects of thickening agents on the formation and properties of edible oleogels based on hydroxypropyl methyl cellulose. Food Chem. 2018, 246, 137–149. [Google Scholar] [CrossRef]
- Sanz, T.; Laguna, L.; Salvador, A. Biscuit dough structural changes during heating: Influence of shortening and cellulose ether emulsions. Food Sci. Technol. 2015, 62, 962–969. [Google Scholar] [CrossRef] [Green Version]
- Bueschelberger, H.G.; Tirok, S.; Stoffels, I.; Schoeppe, A. Lecithins; John Wiley & Sons, Ltd.: Chichester, UK, 2004; pp. 21–60. [Google Scholar]
- Liu, S.Q.; Joshi, S.C.; Lam, Y.C. Effects of salts in the Hofmeister series and solvent isotopes on the gelation mechanisms for hydroxypropylmethylcellulose hydrogels. J. Appl. Polym. Sci. 2008, 109, 363–372. [Google Scholar] [CrossRef]
- Ding, C.; Zhang, M.; Li, G. Rheological properties of collagen/hydroxypropyl methylcellulose (COL/HPMC) blended solutions. J. Appl. Polym. Sci. 2014, 131, e40042. [Google Scholar] [CrossRef]
- Arancibia, C.; Navarro-Lisboa, R.; Zúñiga, R.N.; Matiacevich, S. Application of CMC as thickener on nanoemulsions based on olive oil: Physical properties and stability. Int. J. Polym. Sci. 2016, 2016, 6280581. [Google Scholar] [CrossRef] [Green Version]
- Taha, A.; Hu, T.; Hu, H.; Zhang, Z.; Bakry, A.M.; Khalifa, I.; Pan, S. Effect of different oils and ultrasound emulsification conditions on the physicochemical properties of emulsions stabilized by soy protein isolate. Ultrason.-Sonochem. 2018, 49, 283–293. [Google Scholar] [CrossRef]
- Kampa, J.; Khalil Ghawi, S.; Rodriguez-Garcia, J. Optimisation of the physicochemical stability of extra virgin olive oil-in-water nanoemulsion: Processing parameters and stabiliser type. Eur. Food Res. Technol. 2022, 106489. [Google Scholar] [CrossRef]
- Bai, L.; Huan, S.; Gu, J.; McClements, D.J. Fabrication of oil-in-water nanoemulsions by dual-channel microfluidization using natural emulsifiers: Saponins, phospholipids, proteins, and polysaccharides. Food Hydrocoll. 2016, 61, 703–711. [Google Scholar] [CrossRef] [Green Version]
- Luo, X.; Zhou, Y.; Bai, L.; Liu, F.; Zhang, Z.; Zhang, R.; Zheng, B.; Deng, Y.; McClements, D.J. Production of highly concentrated oil-in-water emulsions using dual-channel microfluidization: Use of individual and mixed natural emulsifiers (saponin and lecithin). Food Res. Int. 2017, 96, 103–112. [Google Scholar] [CrossRef] [Green Version]
- El-Sukkary, M.M.A.; Syed, N.A.; Aiad, I.; El-Azab, W.I.M. Synthesis and characterization of some alkyl polyglycosides surfactants. J. Surfactants Deterg. 2008, 11, 129–137. [Google Scholar] [CrossRef]
- Mukherjee, I.; Moulik, S.P.; Rakshit, A.K. Tensiometric determination of Gibbs surface excess and micelle point: A critical revisit. J. Colloid Interface Sci. 2013, 394, 329–336. [Google Scholar] [CrossRef]
- Vithanage, C.R.; Grimson, M.J.; Smith, B.G. The effect of temperature on the rheology of butter, a spreadable blend and spreads. J. Texture Stud. 2009, 40, 346–369. [Google Scholar] [CrossRef]
- Stefan, K.; Kocevski, D. Determination of the rheological properties of mayonnaise. Int. J. Eng. 2013, 4, 8269. [Google Scholar]
- Chetana, R.; Bhavana, K.P.; Babylatha, R.; Geetha, V.; Suresh Kumar, G. Studies on eggless mayonnaise from rice bran and sesame oils. J. Food Sci. Technol. 2019, 56, 3117–3125. [Google Scholar] [CrossRef]
- Glibowski, P.; Zarzycki, P.; Krzepkowska, M. The rheological and instrumental textural properties of selected table fats. Int. J. Food Prop. 2008, 11, 678–686. [Google Scholar] [CrossRef]
- Guerra-Rosas, M.I.; Morales-Castro, J.; Ochoa-Martínez, L.A.; Salvia-Trujillo, L.; Martín-Belloso, O. Long-term stability of food-grade nanoemulsions from high methoxyl pectin containing essential oils. Food Hydrocoll. 2016, 52, 438–446. [Google Scholar] [CrossRef]
- Sharif, H.R.; Williams, P.A.; Sharif, M.K.; Khan, M.A.; Majeed, H.; Safdar, W.; Shamoon, M.; Shoaib, M.; Haider, J.; Zhong, F. Influence of OSA-starch on the physico chemical characteristics of flax seed oil-eugenol nanoemulsions. Food Hydrocoll. 2017, 66, 365–377. [Google Scholar] [CrossRef]
- Qiu, C.; Zhao, M.; Decker, E.A.; McClements, D.J. Influence of protein type on oxidation and digestibility of fish oil-in-water emulsions: Gliadin, caseinate, and whey protein. Food Chem. 2015, 175, 249–257. [Google Scholar] [CrossRef]
- Perone, N.; Torrieri, E.; Cavella, S.; Masi, P. Effect of rosemary oil and HPMC concentrations on film structure and properties. Food Bioprocess Technol. 2014, 7, 605–609. [Google Scholar] [CrossRef]
- Bodvik, R.; Dedinaite, A.; Karlson, L.; Bergström, M.; Bäverbäck, P.; Pedersen, J.S.; Edwards, K.; Karlsson, G.; Varga, I.; Claesson, P.M. Aggregation and network formation of aqueous methylcellulose and hydroxypropylmethylcellulose solutions. Colloids Surf. A Physicochem. Eng. Asp. 2010, 354, 162–171. [Google Scholar] [CrossRef]
- Li, L.; Thangamathesvaran, P.M.; Yue, C.Y.; Tam, K.C.; Hu, X.; Lam, Y.C. Gel network structure of methylcellulose in water. Langmuir 2001, 17, 8062–8068. [Google Scholar] [CrossRef]
- Joshi, S.C. Sol-gel behavior of hydroxypropyl methylcellulose (HPMC) in ionic media including drug release. Materials 2011, 4, 1861–1905. [Google Scholar] [CrossRef] [Green Version]
- Lim, C.; Song, Y.H.; Song, Y.; Seo, J.H.; Hwang, D.S.; Lee, D.W. Adaptive amphiphilic interaction mechanism of hydroxypropyl methylcellulose in water. Appl. Surf. Sci. 2021, 565, e150535. [Google Scholar] [CrossRef]
- Desbrières, J.; Hirrien, M.; Ross-Murphy, S.B. Thermogelation of methylcellulose: Rheological considerations. Polymer 2000, 41, 2451–2461. [Google Scholar] [CrossRef]
- Zhu, M.; Wen, X.; Zhao, J.; Liu, F.; Ni, Y.; Ma, L.; Li, J. Effect of industrial chemical refining on the physicochemical properties and the bioactive minor components of peanut oil. J. Am. Oil Chem. Soc. 2016, 93, 285–294. [Google Scholar] [CrossRef]
- Sun, W.; Sun, D.; Wei, Y.; Liu, S.; Zhang, S. Oil-in-water emulsions stabilized by hydrophobically modified hydroxyethyl cellulose: Adsorption and thickening effect. J. Colloid Interface Sci. 2007, 311, 228–236. [Google Scholar] [CrossRef]
- McClements, D. Comments on viscosity enhancement and depletion flocculation by polysaccharides. Food Hydrocoll. 2000, 14, 173–177. [Google Scholar] [CrossRef]
- Wang, Y.; Wei, X.; Li, J.; Wang, F.; Wang, Q.; Chen, J.; Kong, L. Study on nanocellulose by high pressure homogenization in homogeneous isolation. Fibers Polym. 2015, 16, 572–578. [Google Scholar] [CrossRef]
- Qian, C.; McClements, D.J. Formation of nanoemulsions stabilized by model food-grade emulsifiers using high-pressure homogenization: Factors affecting particle size. Food Hydrocoll. 2011, 25, 1000–1008. [Google Scholar] [CrossRef]
- Floury, J.; Desrumaux, A.; Lardières, J. Effect of high-pressure homogenization on droplet size distributions and rheological properties of model oil-in-water emulsions. Innov. Food Sci. Emerg. Technol. 2000, 1, 127–134. [Google Scholar] [CrossRef]
- Silva, H.D.; Cerqueira, M.A.; Vicente, A.A. Influence of surfactant and processing conditions in the stability of oil-in-water nanoemulsions. J. Food Eng. 2015, 167, 89–98. [Google Scholar] [CrossRef] [Green Version]
- Mehmood, T.; Ahmed, A.; Ahmed, Z.; Ahmad, M.S. Optimization of soya lecithin and Tween 80 based novel vitamin D nanoemulsions prepared by ultrasonication using response surface methodology. Food Chem. 2019, 289, 664–670. [Google Scholar] [CrossRef]
- Dickinson, E. Introduction to Food Colloids; Oxford University Press: Oxford, UK, 1992. [Google Scholar]
- Sovilj, V.J.; Petrović, L.B. Influence of hydroxypropylmethyl cellulose–sodium dodecylsulfate interaction on the solution conductivity and viscosity and emulsion stability. Carbohydr. Polym. 2006, 64, 41–49. [Google Scholar] [CrossRef]
- Borreani, J.; Espert, M.; Salvador, A.; Sanz, T.; Quiles, A.; Hernando, I. Oil-in-water emulsions stabilised by cellulose ethers: Stability, structure and in vitro digestion. Food Funct. 2017, 8, 1547–1557. [Google Scholar] [CrossRef] [PubMed]
- Tadros, T.; Izquierdo, R.; Esquena, J.; Solans, C. Formation and stability of nano-emulsions. Adv. Colloid Interface Sci. 2004, 108, 303–318. [Google Scholar] [CrossRef] [PubMed]
- Gohtani, S.; Sirendi, M.; Yamamoto, N.; Kajikawa, K.; Yamano, Y. Effect of droplet size on oxidation of docosahexanenoic acid in emulsion system. J. Dispers. Sci. Technol. 1999, 20, 1319–1325. [Google Scholar] [CrossRef]
- Sun, Y.-E.; Wang, W.-D.; Chen, H.-W.; Li, C. Autoxidation of unsaturated lipids in food emulsion. Crit. Rev. Food Sci. Nutr. 2011, 51, 453–466. [Google Scholar] [CrossRef]
- Gunstone, F. Oils and Fats in the Food Industry; John Wiley & Sons: Hoboken, NJ, USA, 2009; Volume 6. [Google Scholar]
 . Conventional emulsion (CE-0 ; CE-2 ; CE-4 ). Nanoemulsion (NE-0 ; NE-2 ). Filled symbols correspond to elastic modulus (G’) and open symbols to viscous modulus (G”).
. Conventional emulsion (CE-0 ; CE-2 ; CE-4 ). Nanoemulsion (NE-0 ; NE-2 ). Filled symbols correspond to elastic modulus (G’) and open symbols to viscous modulus (G”).
. Conventional emulsion (CE-0 ; CE-2 ; CE-4 ). Nanoemulsion (NE-0 ; NE-2 ). Filled symbols correspond to elastic modulus (G’) and open symbols to viscous modulus (G”).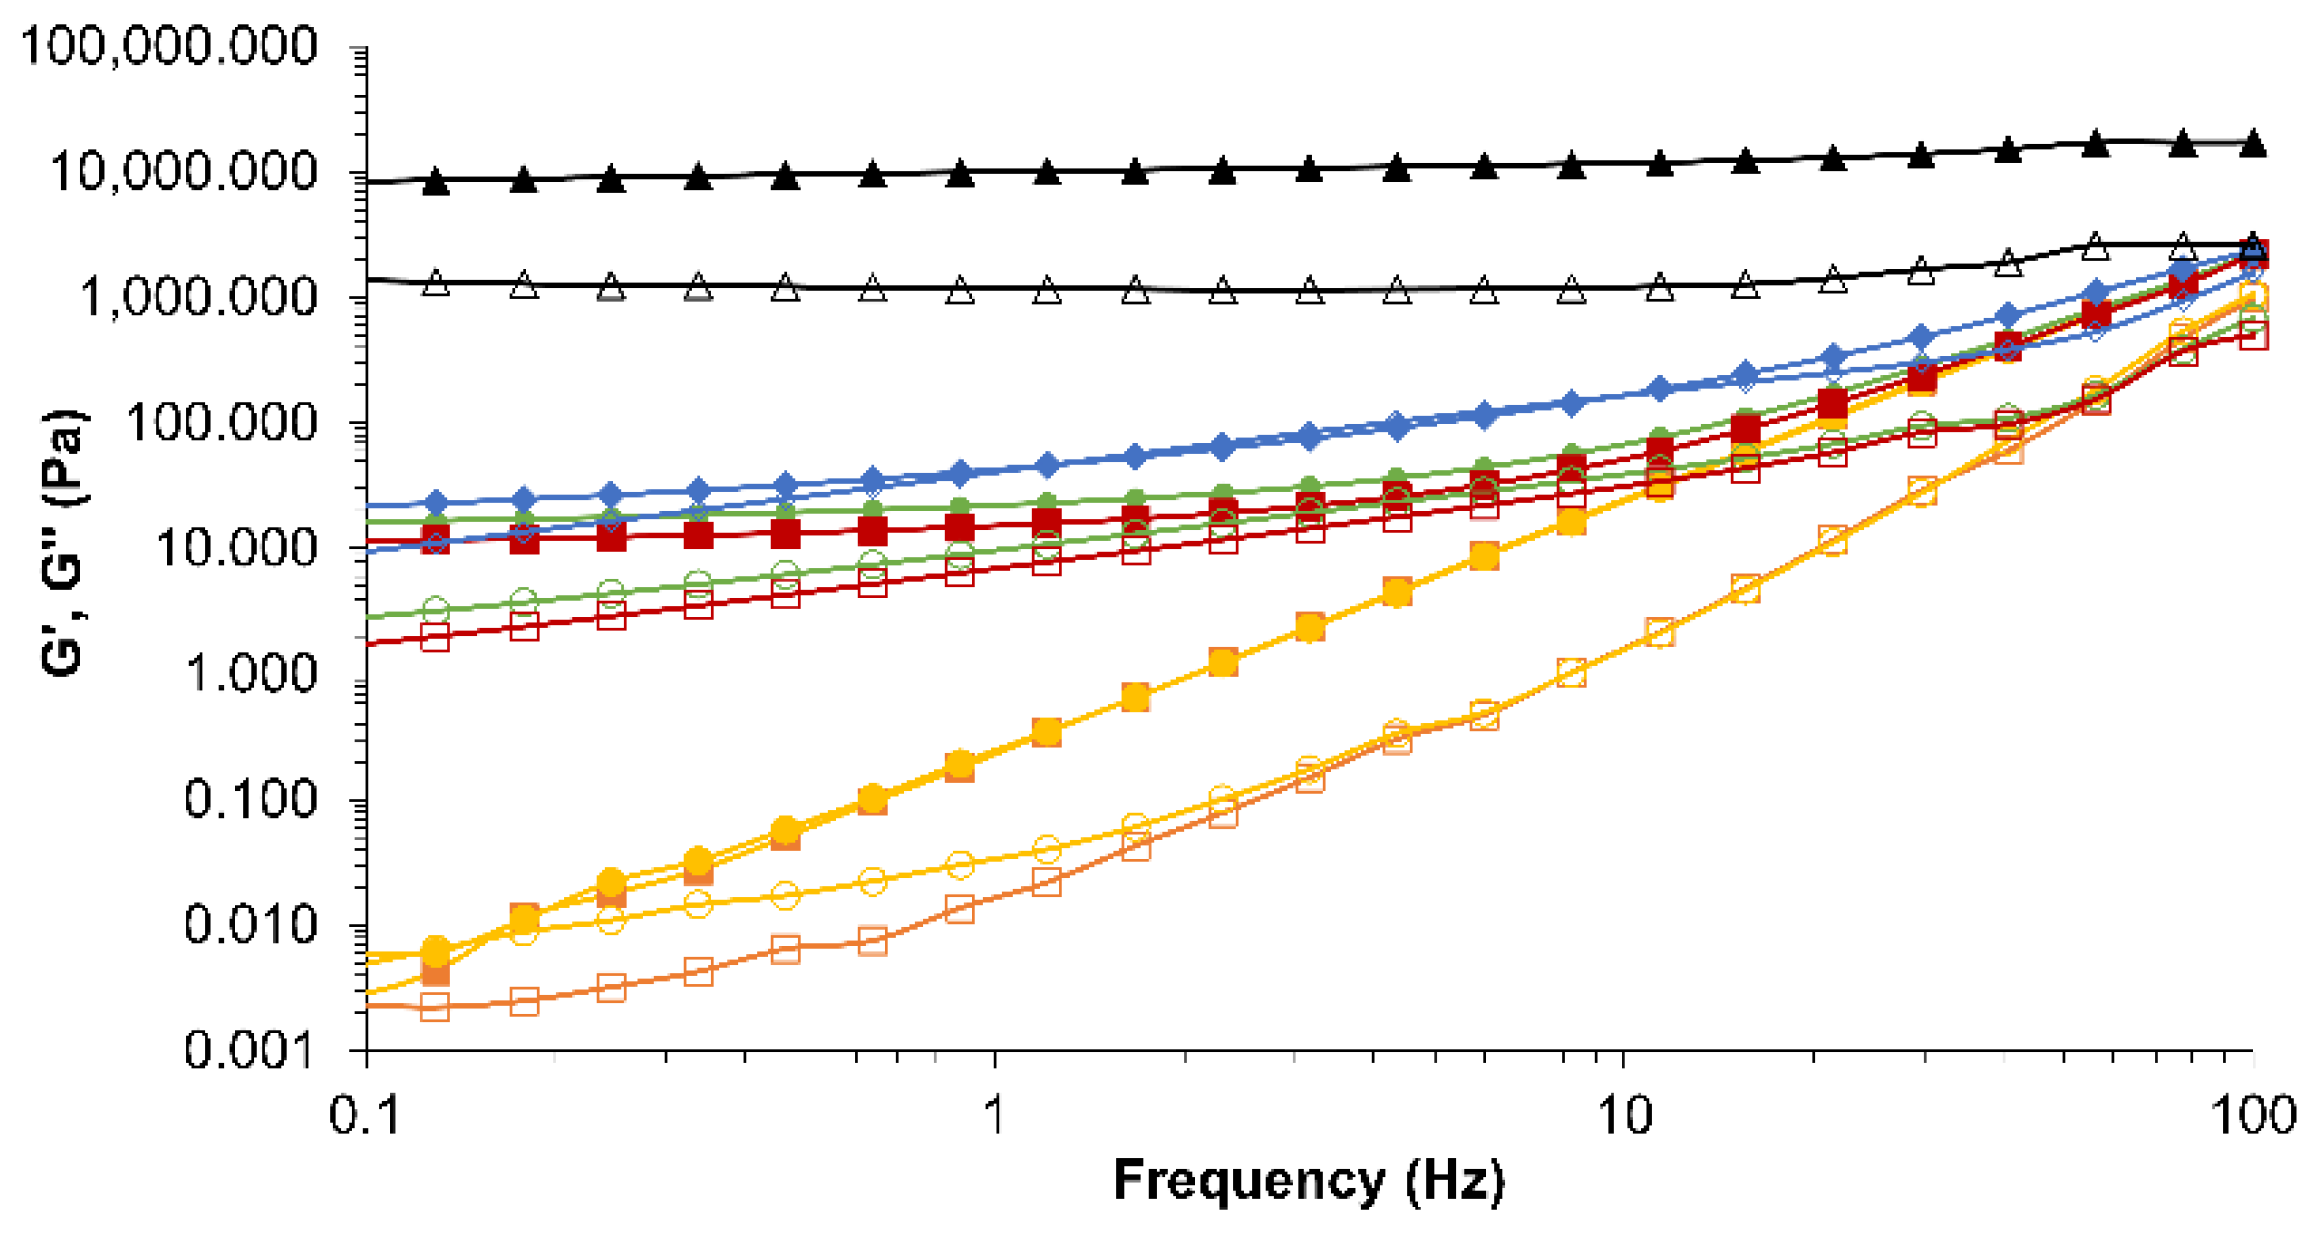 , CE-2 ; CE-4 ). Nanoemulsion (NE-0 , NE-2 ). Filled symbols correspond to elastic modulus (G’) and open symbols to viscous modulus (G”). Frequency = 1 Hz, heating rate = 1 °C/min.
, CE-2 ; CE-4 ). Nanoemulsion (NE-0 , NE-2 ). Filled symbols correspond to elastic modulus (G’) and open symbols to viscous modulus (G”). Frequency = 1 Hz, heating rate = 1 °C/min.
, CE-2 ; CE-4 ). Nanoemulsion (NE-0 , NE-2 ). Filled symbols correspond to elastic modulus (G’) and open symbols to viscous modulus (G”). Frequency = 1 Hz, heating rate = 1 °C/min.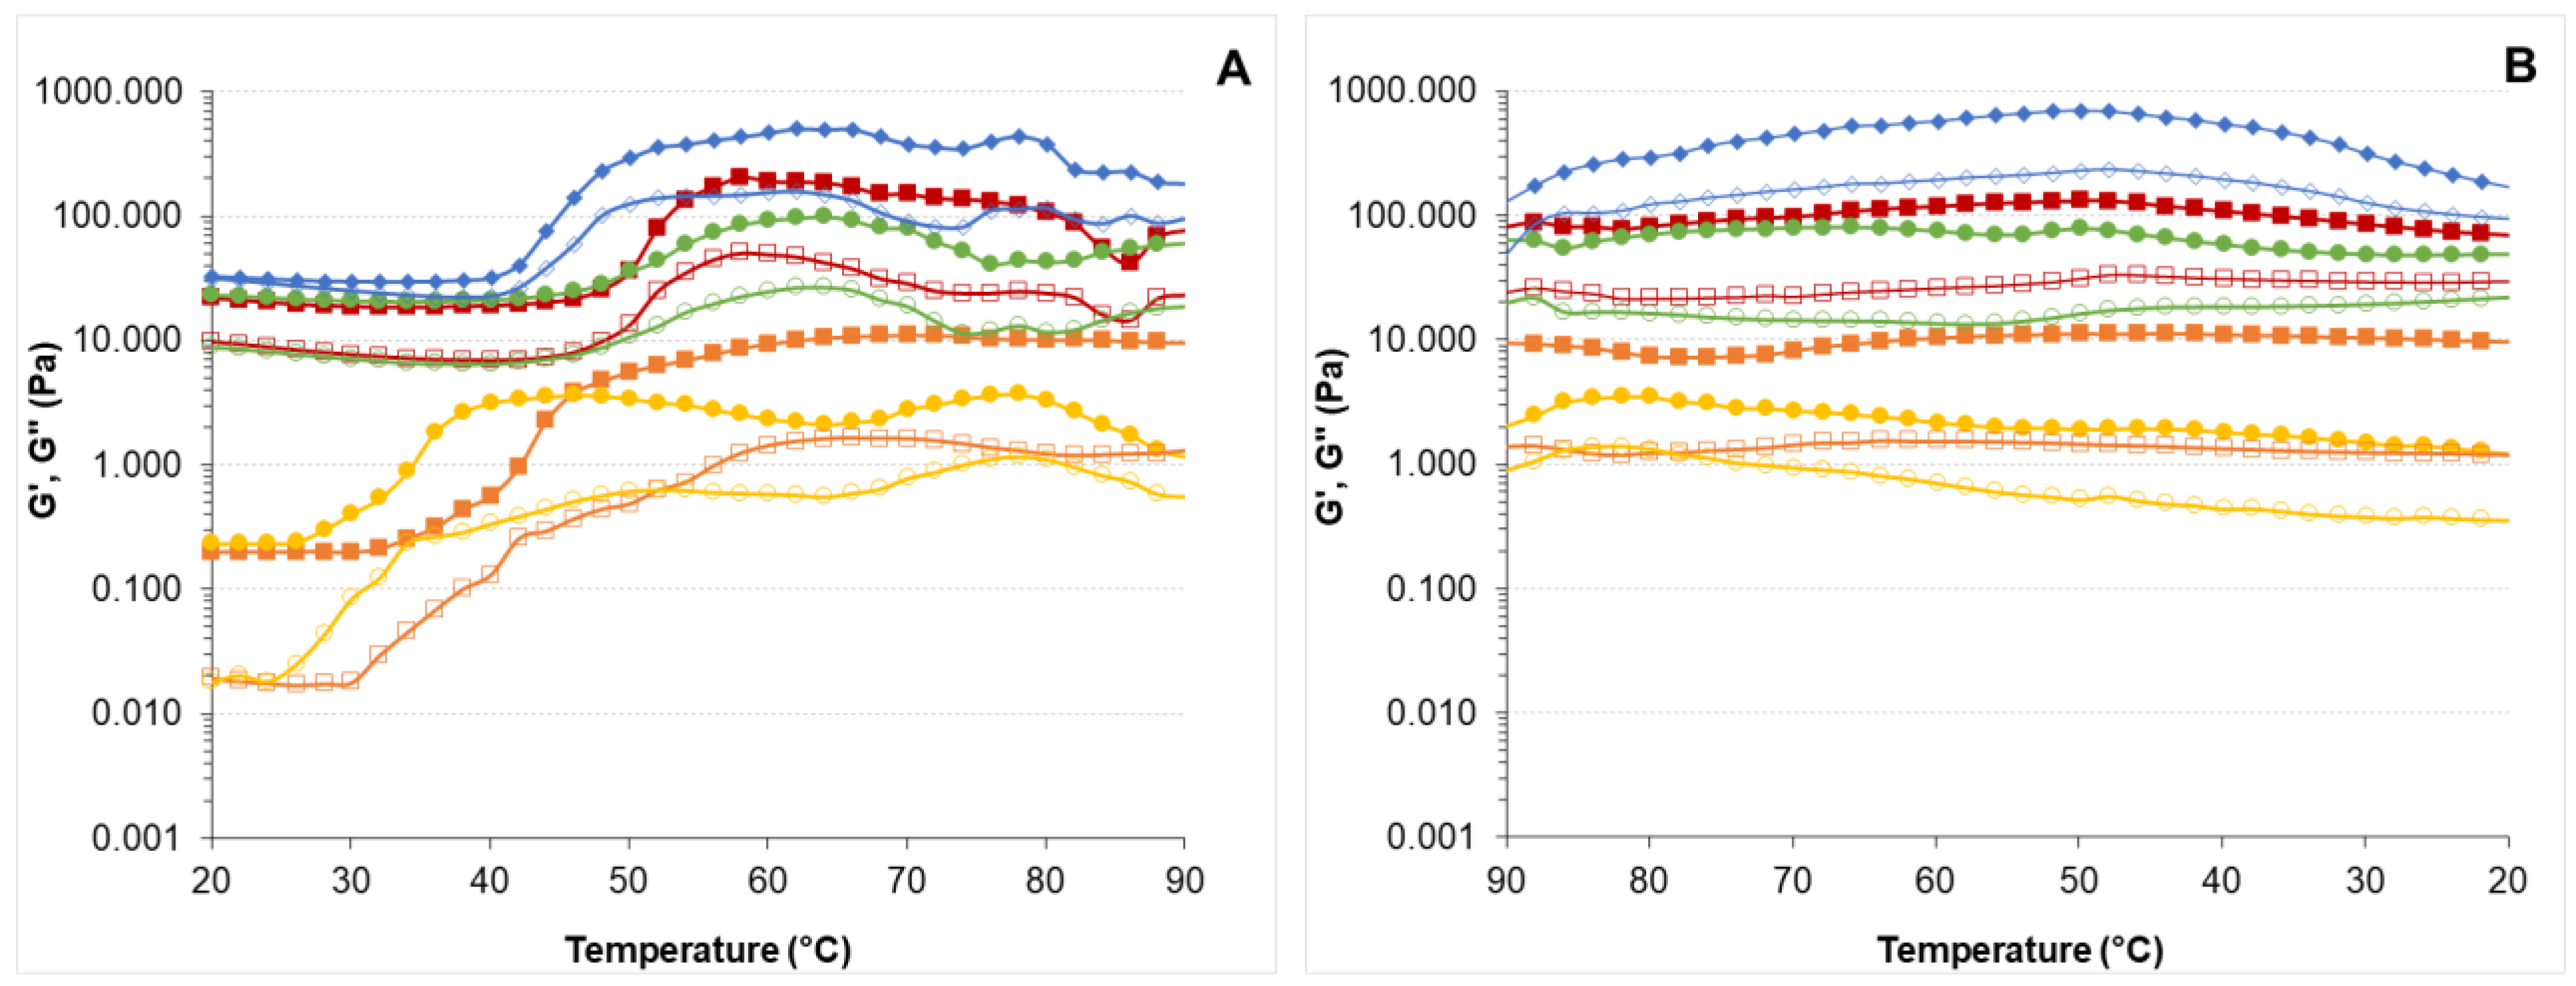
 , CE-2 ; CE-4 ). Nanoemulsion (NE-0 ; NE-2 ). Values with different superscript letters are significantly different (p < 0.05).
, CE-2 ; CE-4 ). Nanoemulsion (NE-0 ; NE-2 ). Values with different superscript letters are significantly different (p < 0.05).
, CE-2 ; CE-4 ). Nanoemulsion (NE-0 ; NE-2 ). Values with different superscript letters are significantly different (p < 0.05).

| Samples | Viscosity (mPa·s) | Methoxy (%) | Hydroxypropyl (%) | Molecular Weight (g/mol) |
|---|---|---|---|---|
| HPMC-L | 80–120 | 21.4 | 7.2 | 26,000 |
| HPMC-H | 3000–56,000 | 28.9 | 8.1 | 86,000 |
| Samples | Firmness (N) | Work of Shear (N·s) |
|---|---|---|
| Butter | 0.35 f (0.06) | 0.26 de (0.04) |
| HPMC-L 4% | 0.24 f (0.02) | 0.10 e (0.01) |
| HPMC-L 6% | 0.92 e (0.02) | 0.48 d (0.02) |
| HPMC-L 8% | 2.39 d (0.06) | 1.31 c (0.10) |
| HPMC-L 10% | 5.17 b (0.46) | 2.86 b (0.26) |
| HPMC-H 2% | 0.87 e (0.06) | 0.49 d (0.03) |
| HPMC-H 3% | 2.23 d (0.14) | 1.39 c (0.09) |
| HPMC-H 4% | 3.44 c (0.22) | 2.94 b (0.22) |
| HPMC-H 5% | 8.05 a (0.26) | 5.77 a (0.19) |
| Samples | Firmness (N) | Work of Shear (N·s) |
|---|---|---|
| Butter | 0.33 c (0.03) | 0.24 bc (0.06) |
| CE-2 | 0.44 b (0.02) | 0.29 b (0.01) |
| NE-2 | 0.30 c (0.02) | 0.18 c (0.02) |
| CE-4 | 1.87 a (0.11) | 1.14 a (0.06) |
Publisher’s Note: MDPI stays neutral with regard to jurisdictional claims in published maps and institutional affiliations. |
© 2022 by the authors. Licensee MDPI, Basel, Switzerland. This article is an open access article distributed under the terms and conditions of the Creative Commons Attribution (CC BY) license (https://creativecommons.org/licenses/by/4.0/).
Share and Cite
Kampa, J.; Frazier, R.; Rodriguez-Garcia, J. Development of Saturated Fat Replacers: Conventional and Nano-Emulsions Stabilised by Lecithin and Hydroxylpropyl Methylcellulose. Foods 2022, 11, 2536. https://doi.org/10.3390/foods11162536
Kampa J, Frazier R, Rodriguez-Garcia J. Development of Saturated Fat Replacers: Conventional and Nano-Emulsions Stabilised by Lecithin and Hydroxylpropyl Methylcellulose. Foods. 2022; 11(16):2536. https://doi.org/10.3390/foods11162536
Chicago/Turabian StyleKampa, Jansuda, Richard Frazier, and Julia Rodriguez-Garcia. 2022. "Development of Saturated Fat Replacers: Conventional and Nano-Emulsions Stabilised by Lecithin and Hydroxylpropyl Methylcellulose" Foods 11, no. 16: 2536. https://doi.org/10.3390/foods11162536
APA StyleKampa, J., Frazier, R., & Rodriguez-Garcia, J. (2022). Development of Saturated Fat Replacers: Conventional and Nano-Emulsions Stabilised by Lecithin and Hydroxylpropyl Methylcellulose. Foods, 11(16), 2536. https://doi.org/10.3390/foods11162536