
Formation of Intermediate Amylose Rice Starch–Lipid Complex Assisted by Ultrasonication


Abstract
:1. Introduction
2. Materials and Methods
2.1. Brown Rice Sample and Starch Preparation
2.2. Production of the NK Starch–FA Complex Assisted by Ultrasonication
2.3. Characterization of the NK Starch–FA Complex Assisted by Ultrasonication
2.4. Statistical Analysis
3. Results and Discussion
3.1. Effect of Ultrasonic Condition, FA Concentration, and FA Chain Length on the Starch–FA Complexes Formation Presented by CI and In Vitro Digestibility
3.1.1. Effect of Ultrasonic Time
3.1.2. Effect of Ultrasonic Amplitude
3.1.3. Effect of FA Concentration
3.1.4. Effect of FA Chain Length
3.2. Physico-Chemical Properties
3.2.1. Water Absorption Capacity (WAC) and Oil Absorption Capacity (OAC)
3.2.2. Swelling and Solubility Indices
3.2.3. Light Transmittance (LT)
3.3. Pasting Behaviors
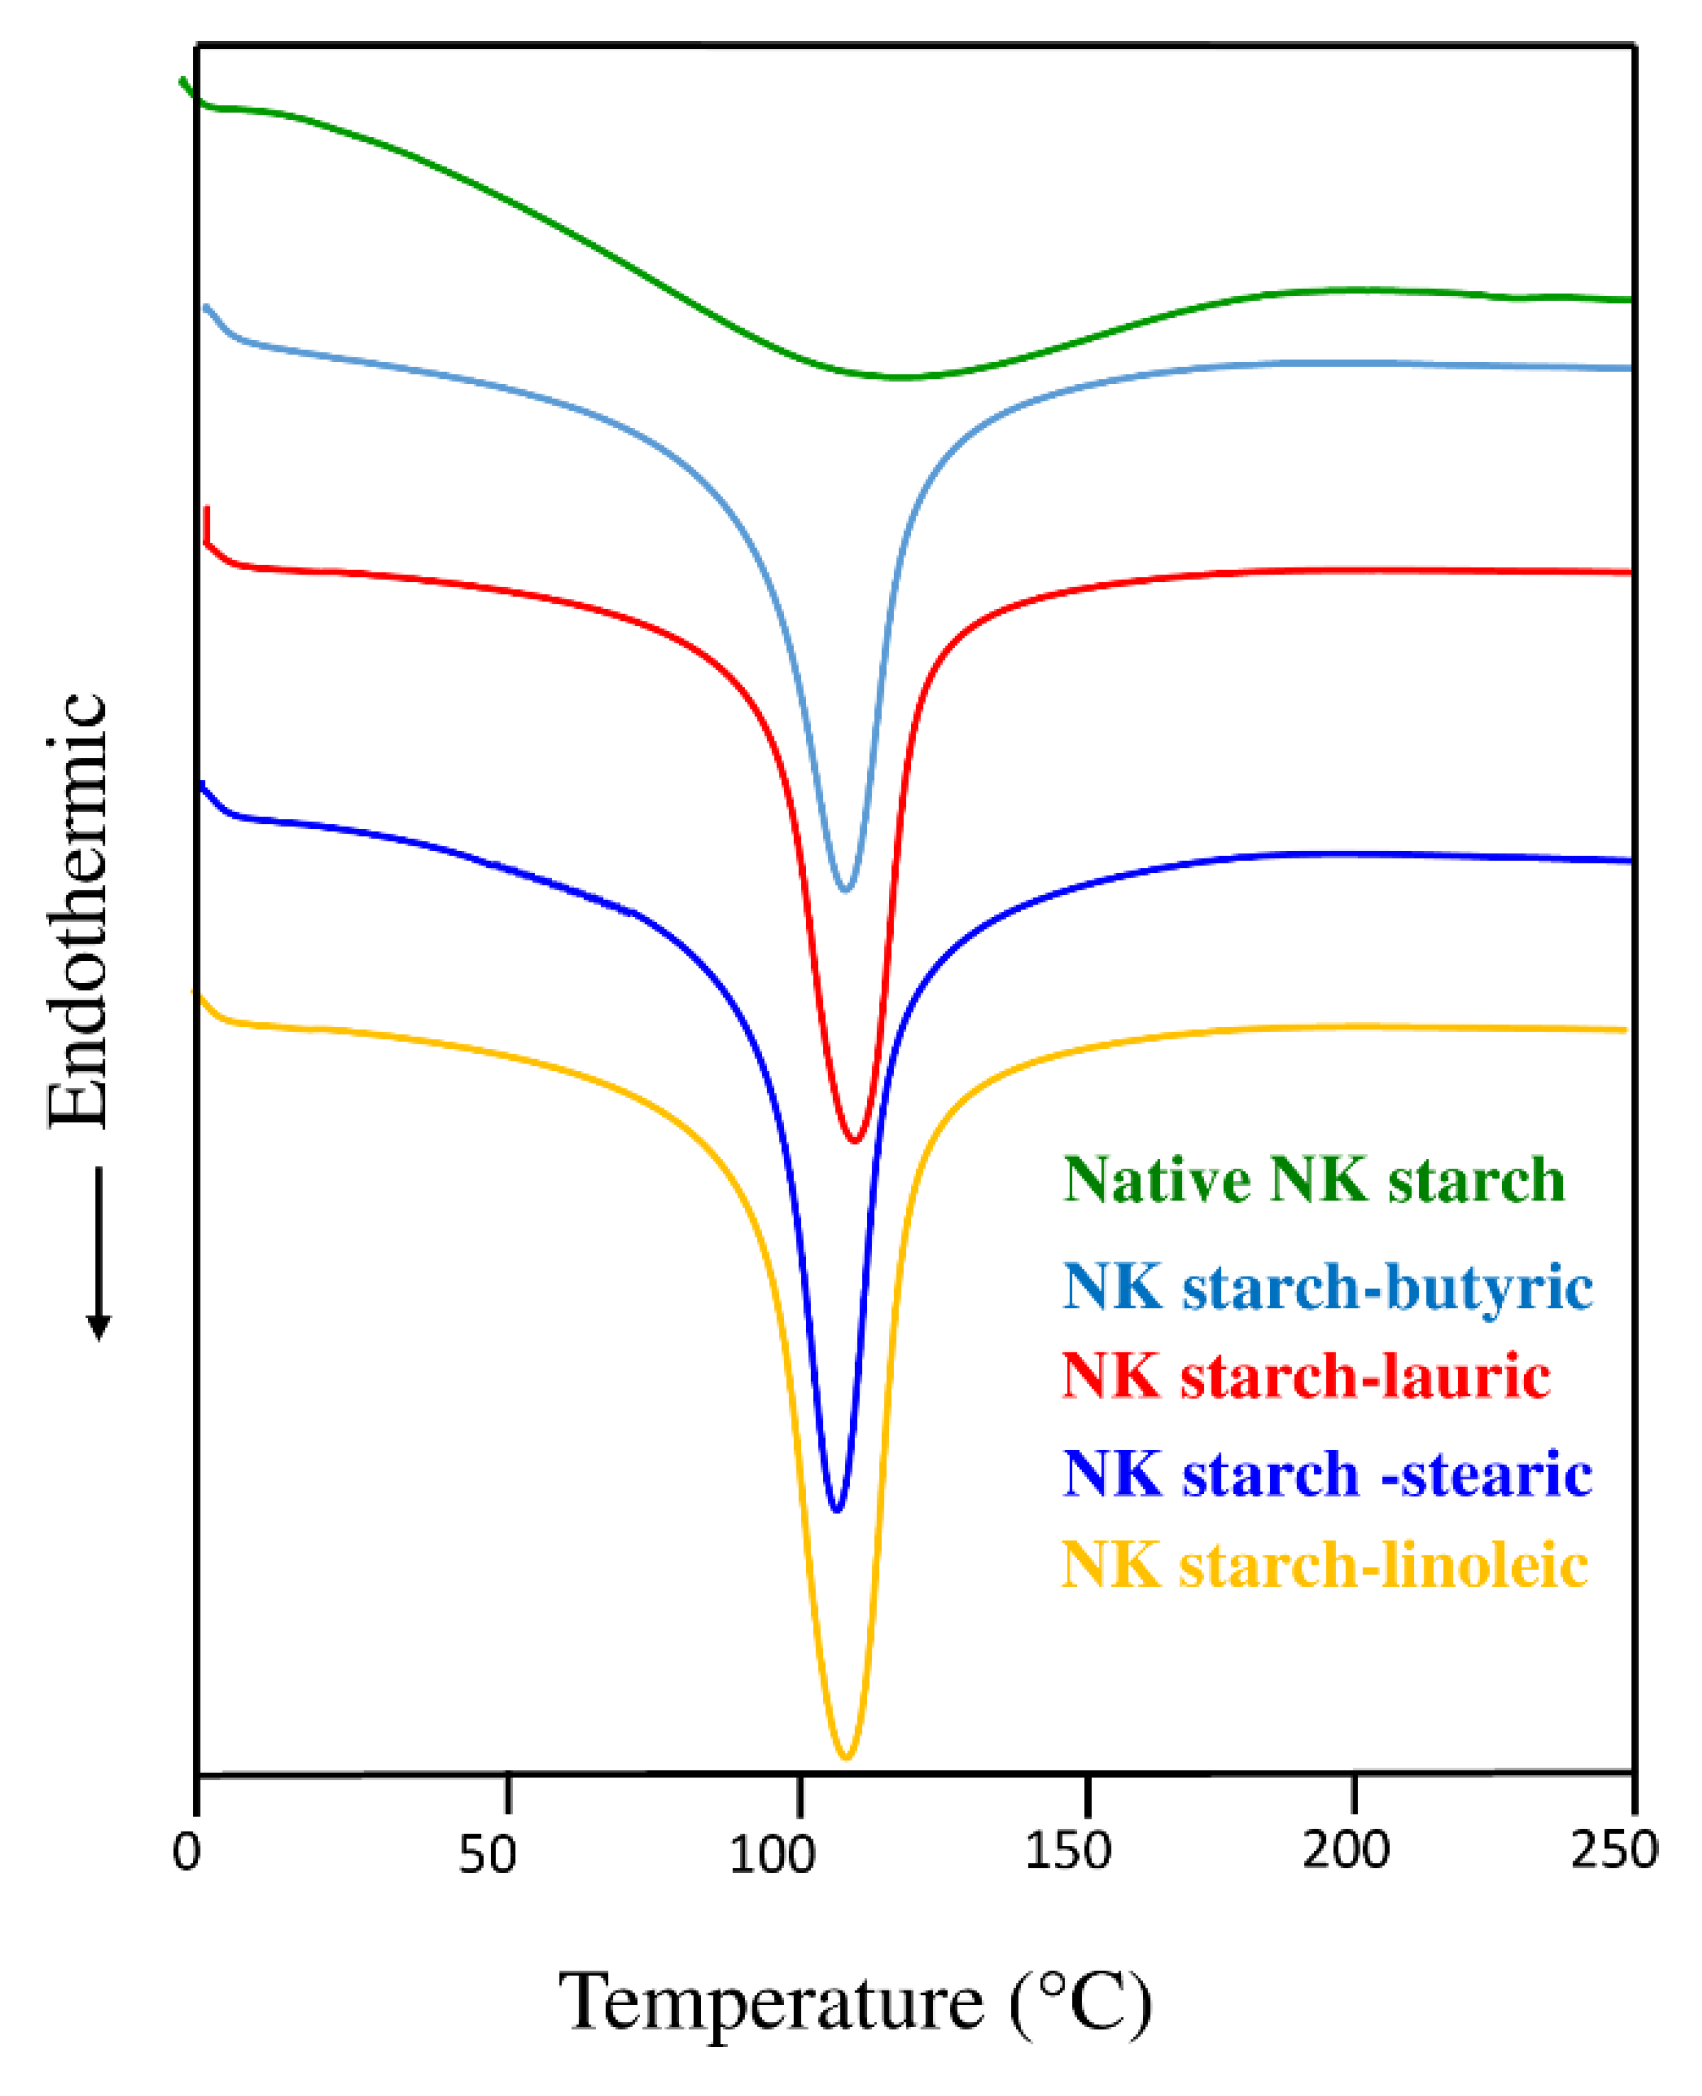
3.4. Thermal Properties
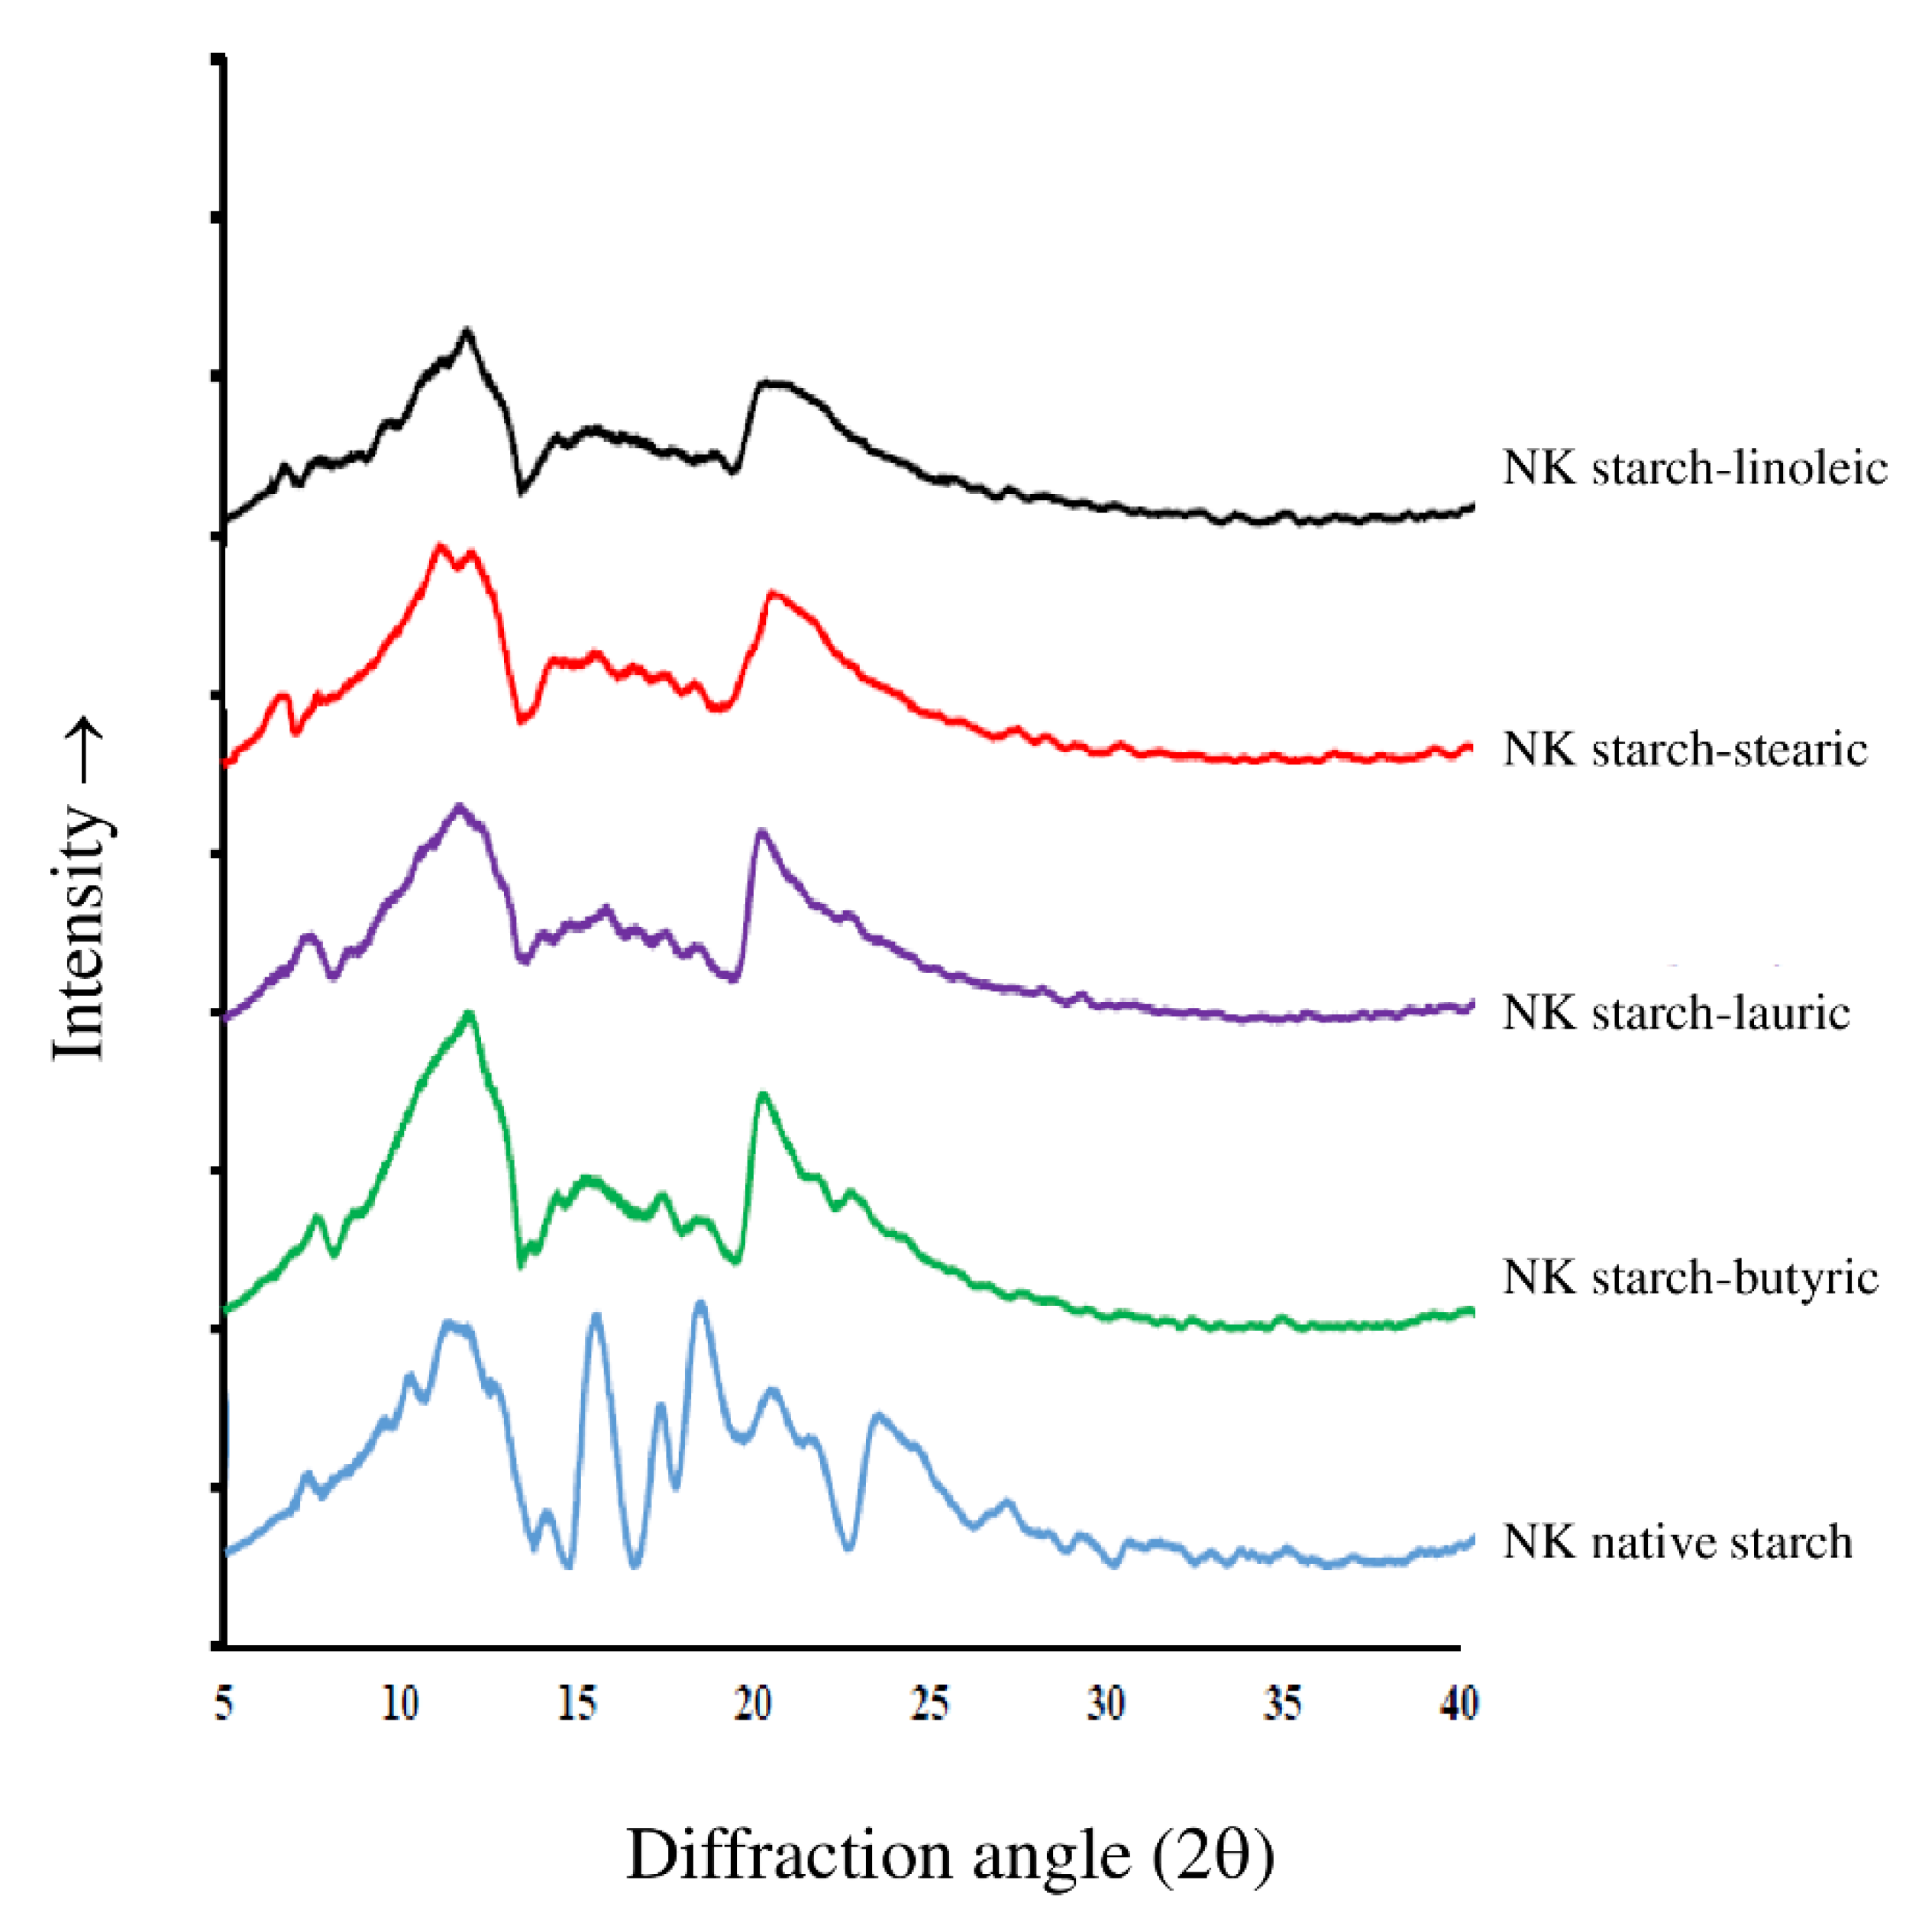
3.5. XRD Pattern
3.6. FTIR Spectra
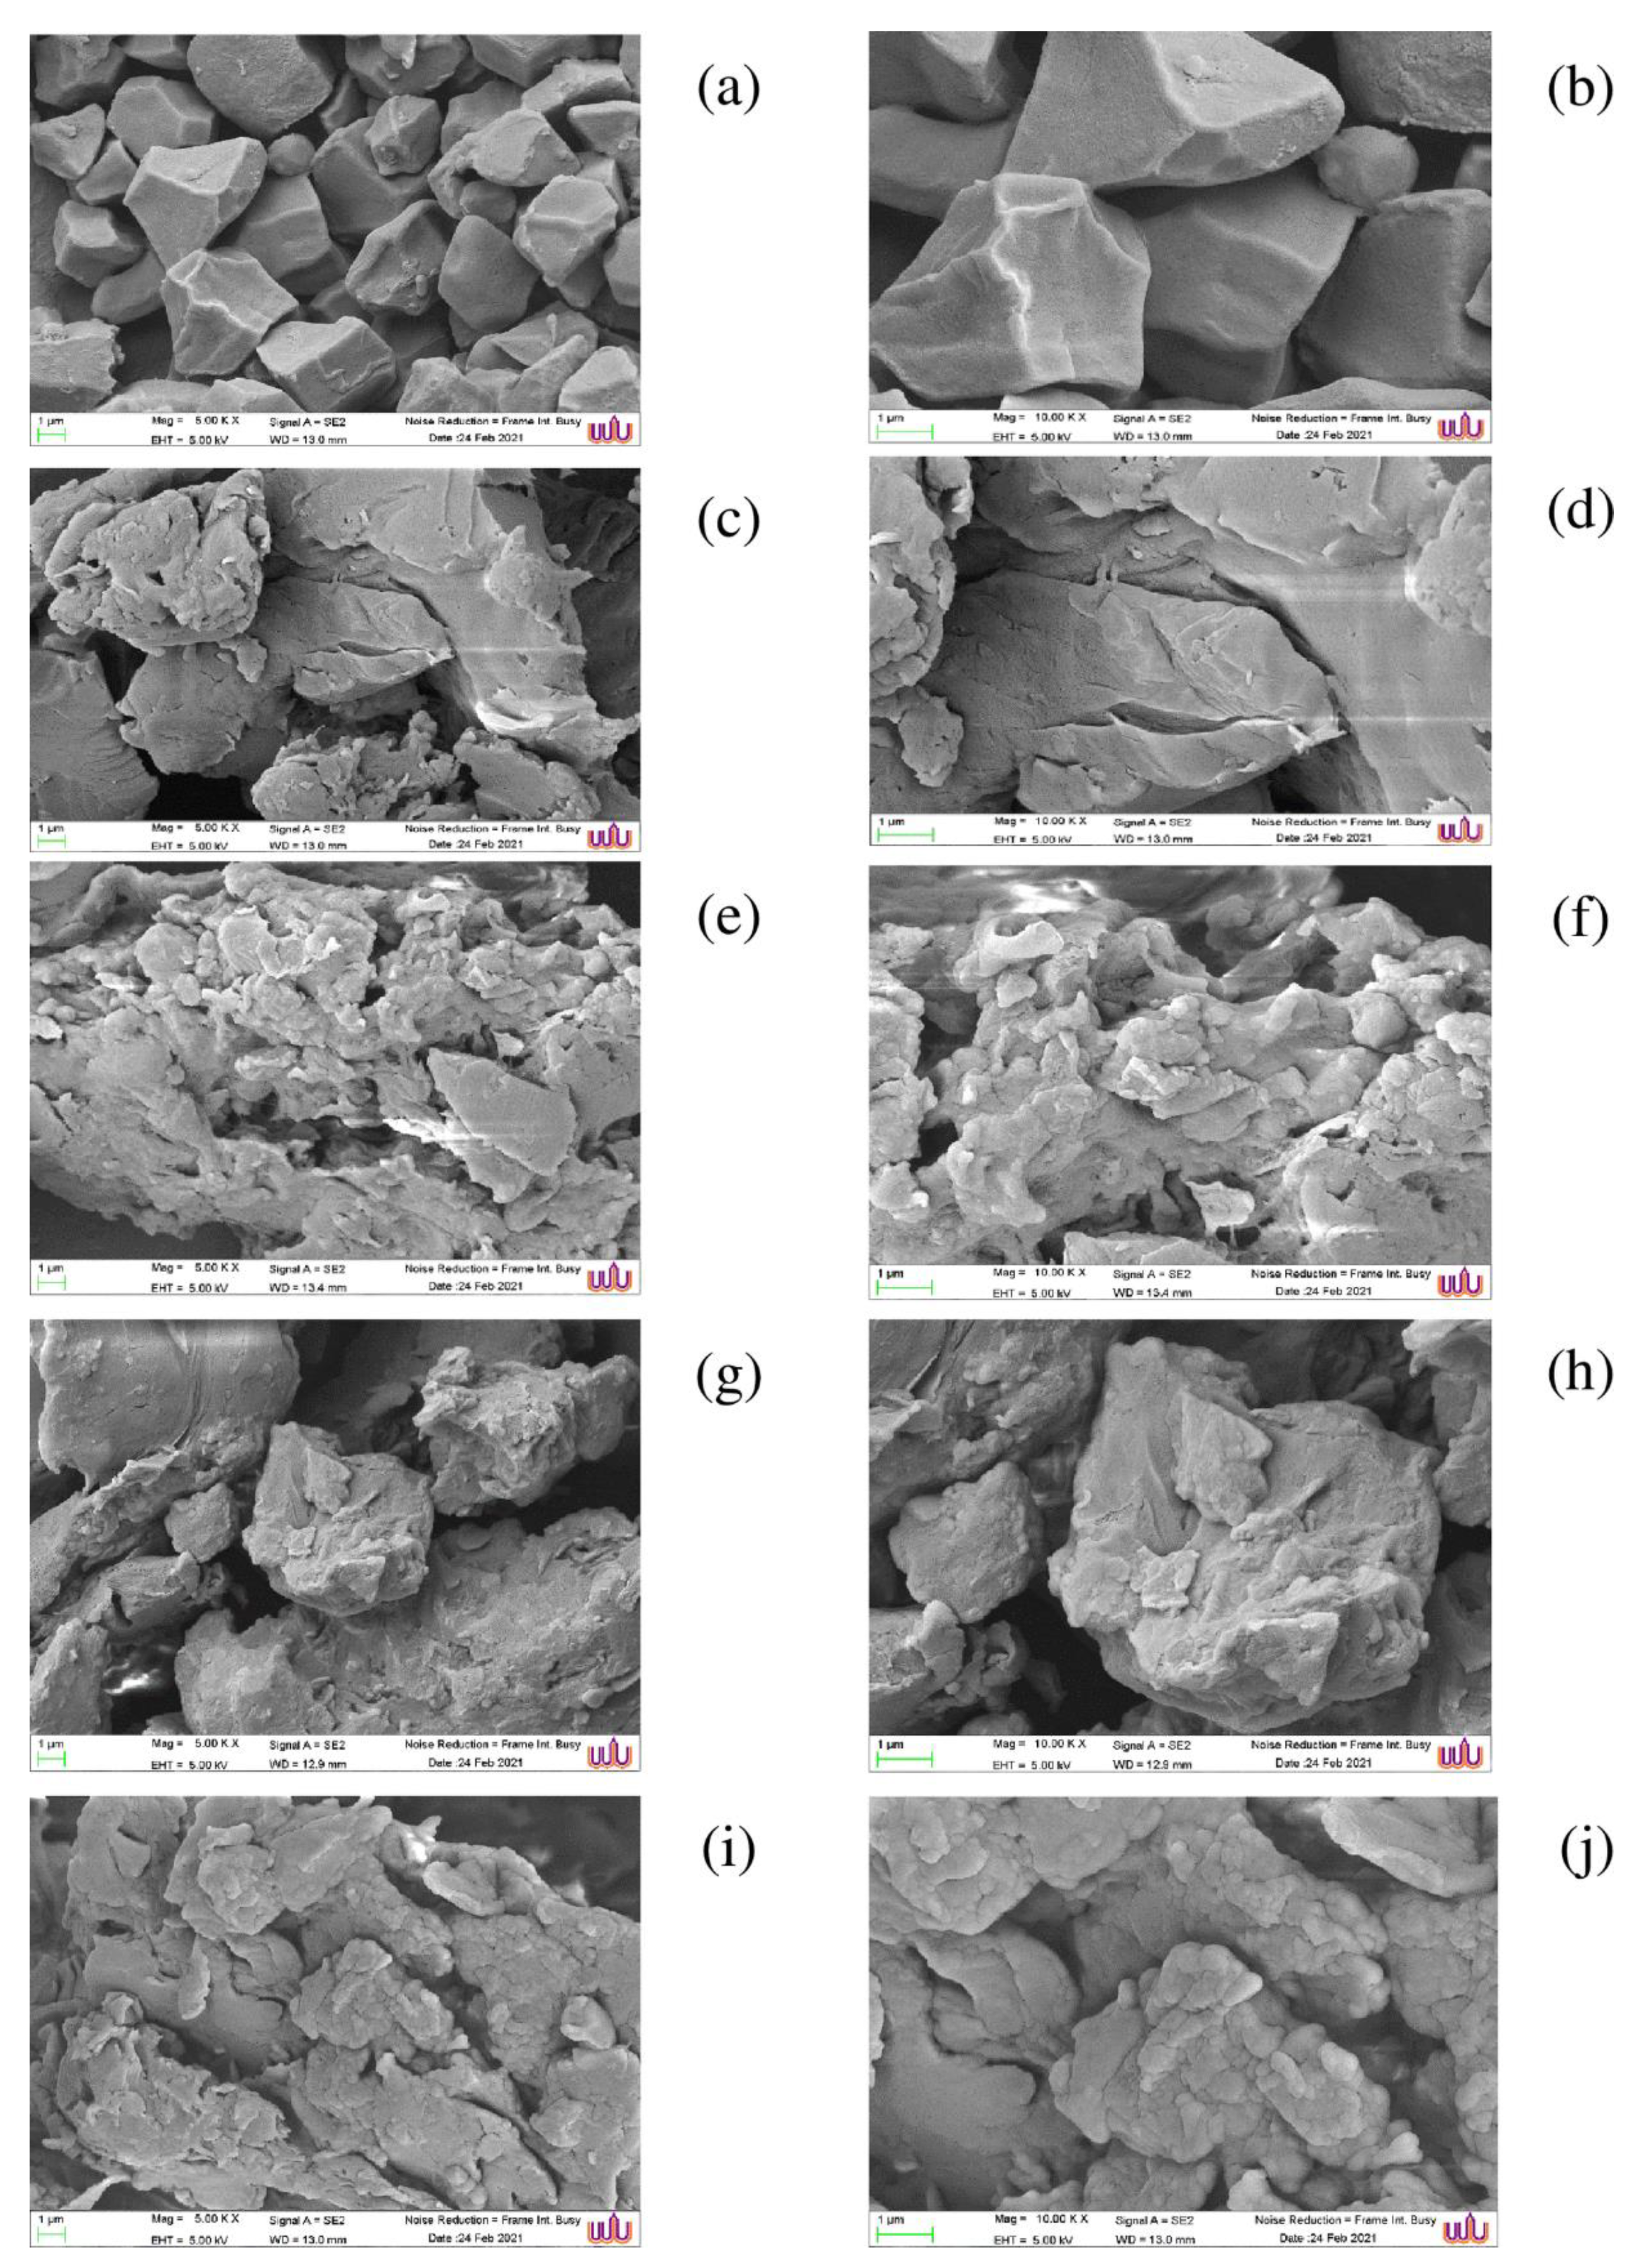
3.7. SEM
3.8. In Vitro Bioactivities of Starch–FA Complexes
3.8.1. Bile Acid Binding Capacity
3.8.2. Radical Scavenging Activity
3.8.3. Proliferation of Bifidobacteria
4. Conclusions
Author Contributions
Funding
Institutional Review Board Statement
Informed Consent Statement
Data Availability Statement
Acknowledgments
Conflicts of Interest
References
- Hódsági, M.; Gelencsér, T.; Gergely, S.; Salgó, A. In vitro digestibility of native and resistant starches: Correlation to the change of its rheological properties. Food Bioproc. Technol. 2012, 5, 1038–1048. [Google Scholar] [CrossRef]
- Zheng, B.; Wang, T.; Wang, H.; Chen, L.; Zhou, Z. Studies on nutritional intervention of rice starch-oleic acid complex (resistant starch type V) in rats fed by high-fat diet. Carbohydr. Polym. 2020, 246, 116637. [Google Scholar] [CrossRef] [PubMed]
- Crowe, T.C.; Seligman, S.A.; Copeland, L. Inhibition of enzymic digestion of amylose by free FAs in vitro contributes to resistant starch formation. J. Nutr. 2000, 130, 2006–2008. [Google Scholar] [CrossRef] [PubMed]
- Lu, Z.H.; Belanger, N.; Donner, E.; Liu, Q. Debranching of pea starch using pullulanase and ultrasonication synergistically to enhance slowly digestible and resistant starch. Food Chem. 2018, 268, 533–541. [Google Scholar] [CrossRef]
- Zhang, B.; Huang, Q.; Luo, F.X.; Fu, X. Structural characterisations and digestibility of d ebranched high-amylose maize starch complexed with lauric acid. Food Hydrocoll. 2012, 28, 174–181. [Google Scholar] [CrossRef]
- Kang, X.; Liu, P.; Gao, W.; Wu, Z.; Yu, B.; Wang, R.; Sun, C. Preparation of starch-lipid complex by ultrasonication and its film forming capacity. Food Hydrocoll. 2020, 99, 105340. [Google Scholar] [CrossRef]
- De Pilli, T.; Derossi, A.; Talja, R.A.; Jouppila, K.; Severini, C. Study of starch-lipid complexes in model system and real food produced using extrusion-cooking technology. Innov. Food Sci. Emerg. Technol. 2011, 12, 610–616. [Google Scholar] [CrossRef]
- Wang, R.; Liu, P.; Cui, B.; Kang, X.; Yu, B. Effects of different treatment methods on properties of potato starch-lauric acid complex and potato starch-based films. Int. J. Biol. Macromol. 2019, 124, 34–40. [Google Scholar] [CrossRef]
- Raza, H.; Liang, Q.; Ameer, K.; Ma, H.; Ren, X. Dual-frequency power ultrasound effects on the complexing index, physicochemical properties, and digestion mechanism of arrowhead starch-lipid complexes. Ultrason. Sonochem. 2022, 84, 105978. [Google Scholar] [CrossRef]
- Mariscal-Moreno, R.M.; Figueroa-Cárdenas, J.D.D.; Santiago-Ramos, D.; Rayas-Duarte, P. Amylose lipid complexes formation as an alternative to reduce amylopectin retrogradation and staling of stored tortillas. Int. J. Food Sci. Technol. 2019, 54, 1651–1657. [Google Scholar] [CrossRef]
- Meng, S.; Ma, Y.; Cui, J.; Sun, D.W. Preparation of corn starch–fatty acid complexes by high-pressure homogenization. Starch-Stärke 2014, 66, 809–817. [Google Scholar] [CrossRef]
- Chen, B.; Jia, X.; Miao, S.; Zeng, S.; Guo, Z.; Zhang, Y.; Zheng, B. Slowly digestible properties of lotus seed starch-glycerine monostearin complexes formed by high pressure homogenization. Food Chem. 2018, 252, 115–125. [Google Scholar] [CrossRef]
- Guo, Z.; Jia, X.; Miao, S.; Chen, B.; Lu, X.; Zheng, B. Structural and thermal properties of amylose-fatty acid complexes prepared via high hydrostatic pressure. Food Chem. 2018, 264, 172–179. [Google Scholar] [CrossRef]
- Ding, Y.; Luo, F.; Lin, Q. Insights into the relations between the molecular structures and digestion properties of retrograded starch after ultrasonic treatment. Food Chem. 2019, 294, 248–259. [Google Scholar] [CrossRef]
- Sit, N.; Misra, S.; Deka, S.C. Yield and functional properties of taro starch as affected by ultrasound. Food Bioproc. Tech. 2014, 7, 1950–1958. [Google Scholar] [CrossRef]
- You, Q.; Zhang, X.; Fang, X.; Yin, X.; Luo, C.; Wan, M. Ultrasonic-assisted preparation and characterization of RS3 from pea starch. Food Bioproc. Tech. 2019, 12, 1244–1249. [Google Scholar] [CrossRef]
- Zhang, X.; Mi, T.; Gao, W.; Wu, Z.; Yuan, C.; Cui, B.; Dai, Y.; Liu, P. Ultrasonication effects on physicochemical properties of starch-lipid complex. Food Chem. 2022, 388, 133054. [Google Scholar] [CrossRef]
- Chumsri, P.; Chaijan, M.; Panpipat, W. A comparison of nutritional values, physicochemical features and in vitro bioactivities of Southern Thai short-grain brown rice with commercial long-grain varieties. Int. J. Food Sci. Technol. 2021, 56, 6515–6526. [Google Scholar] [CrossRef]
- Sun, X.; Dong, Z.; Liang, J. Preparation of resistant rice starch and processing technology optimization. Starch-Stärke 2021, 74, 2100218. [Google Scholar] [CrossRef]
- Tang, M.C.; Copeland, L. Analysis of complexes between lipids and wheat starch. Carbohydr. Polym. 2007, 67, 80–85. [Google Scholar] [CrossRef]
- Englyst, K.; Goux, A.; Meynier, A.; Quigley, M.; Englyst, H.; Brack, O.; Vinoy, S. Inter-laboratory validation of the starch digestibility method for determination of rapidly digestible and slowly digestible starch. Food Chem. 2018, 245, 1183–1189. [Google Scholar] [CrossRef]
- Ashwar, B.A.; Gani, A.; Wani, I.A.; Shah, A.; Masoodi, F.A.; Saxena, D.C. Production of resistant starch from rice by dual autoclaving-retrogradation treatment: In vitro digestibility, thermal and structural characterization. Food Hydrocoll. 2016, 56, 108–117. [Google Scholar] [CrossRef]
- Li, X.; Gao, X.; Lu, J.; Mao, X.; Wang, Y.; Feng, D.; Gao, W. Complex formation, physicochemical properties of different concentration of palmitic acid yam (Dioscorea pposita Thunb.) starch preparation mixtures. LWT 2019, 101, 130–137. [Google Scholar] [CrossRef]
- Zhang, Y.; Zeng, H.; Wang, Y.; Zeng, S.; Zheng, W.B. Structural characteristics and crystalline properties of lotus seed resistant starch and its prebiotic effects. Food Chem. 2014, 155, 311–318. [Google Scholar] [CrossRef]
- Liu, P.; Wang, R.; Kang, X.; Cui, B.; Yu, B. Effects of ultrasonic treatment on amylose-lipid complex formation and properties of sweet potato starch-based films. Ultrason. Sonochem. 2018, 44, 215–222. [Google Scholar] [CrossRef]
- Chang, F.; He, X.; Fu, X.; Huang, Q.; Jane, J.L. Effects of heat treatment and moisture contents on interactions between lauric acid and starch granules. J. Agric. Food Chem. 2014, 62, 7862–7868. [Google Scholar] [CrossRef]
- Thakur, R.; Pristijono, P.; Golding, J.B.; Stathopoulos, C.E.; Scarlett, C.J.; Bowyer, M.; Vuong, Q.V. Amylose-lipid complex as a measure of variations in physical, mechanical and barrier attributes of rice starch-ι-carrageenan biodegradable edible film. Food Packag. Shelf Life 2017, 14, 108–115. [Google Scholar] [CrossRef]
- Kawai, K.; Takato, S.; Sasaki, T.; Kajiwara, K. Complex formation, thermal properties, and in-vitro digestibility of gelatinized potato starch-FA mixtures. Food Hydrocoll. 2012, 27, 228–234. [Google Scholar] [CrossRef]
- Wang, S.; Wang, J.; Yu, J.; Wang, S. Effect of FAs on functional properties of normal wheat and waxy wheat starches: A structural basis. Food Chem. 2016, 190, 285–292. [Google Scholar] [CrossRef] [PubMed]
- Wang, L.; Wang, W.; Wang, Y.; Xiong, G.; Mei, X.; Wu, W.; Liao, L. Effects of FA chain length on properties of potato starch-FA complexes under partially gelatinization. Int. J. Food Prop. 2018, 21, 2121–2134. [Google Scholar] [CrossRef]
- Kaur, K.; Singh, N. Amylose-lipid complex formation during cooking of rice flour. Food Chem. 2000, 71, 511–517. [Google Scholar] [CrossRef]
- Gani, A.; Gazanfar, T.; Jan, R.; Wani, S.M.; Masoodi, F.A. Effect of gamma irradiation on the physicochemical and morphological properties of starch extracted from lotus stem harvested from Dal lake of Jammu and Kashmir, India. J. Saudi Soc. Agric. Sci. 2013, 12, 109–115. [Google Scholar] [CrossRef]
- Oppong, D.; Panpipat, W.; Chaijan, M. Chemical, physical, and functional properties of Thai indigenous brown rice flours. PLoS ONE. 2021, 16, e0255694. [Google Scholar] [CrossRef]
- Zhang, G.; Maladen, M.D.; Hamaker, B.R. Detection of a novel three component complex consisting of starch, protein, and free FA. J. Agric. Food Chem. 2003, 51, 2801–2805. [Google Scholar] [CrossRef]
- Xu, X.; Chen, Y.; Luo, Z.; Lu, X. Different variations in structures of A-and B-type starches subjected to microwave treatment and their relationships with digestibility. LWT 2019, 99, 179–187. [Google Scholar] [CrossRef]
- Zhou, D.; Ma, Z.; Yin, X.; Hu, X.; Boye, J.I. Structural characteristics and physicochemical properties of field pea starch modified by physical, enzymatic, and acid treatments. Food Hydrocoll. 2019, 93, 386–394. [Google Scholar] [CrossRef]
- Shi, S.; Dong, Y.; Li, Q.; Liu, T.; Yu, X. Morphology, structural, thermal and rheological properties of wheat starch-palmitic acid complexes prepared during steam cooking. RSC Adv. 2020, 10, 30087–30093. [Google Scholar] [CrossRef]
- Simsek, S.; El, S.N. Production of resistant starch from taro (Colocasia esculenta L. Schott) corm and determination of its effects on health by in vitro methods. Carbohydr. Polym. 2012, 90, 1204–1209. [Google Scholar] [CrossRef]
- Setchell, K.D.; Kohli, R. Bile acids and bile flow: New functions of old molecules. In Zakim and Boyer’s Hepatology: A Textbook of Liver Disease E-Book, 7th ed.; Boyer, T., Terrault, N., Lindor, K.D., Eds.; Elsevier: Philadelphia, PA, USA, 2016. [Google Scholar]
- Zhou, D.; Ma, Z.; Xu, J.; Li, X.; Hu, X. Resistant starch isolated from enzymatic, physical, and acid treated pea starch: Preparation, structural characteristics, and in vitro bile acid capacity. LWT 2019, 116, 108541. [Google Scholar] [CrossRef]
- Abadie, C.; Hug, M.; Kübli, C.; Gains, N. Effect of cyclodextrins and undigested starch on the loss of chenodeoxycholate in the faeces. Biochem. J. 1994, 299, 725–730. [Google Scholar] [CrossRef]
- Zhou, Q.; Fu, X.; Dhital, S.; Zhai, H.; Huang, Q.; Zhang, B. In vitro fecal fermentation outcomes of starch-lipid complexes depend on starch assembles more than lipid type. Food Hydrocoll. 2021, 120, 106941. [Google Scholar] [CrossRef]


| Parameter | Native NK | NK–Butyric | NK–Lauric | NK–Stearic | NK–Linoleic |
|---|---|---|---|---|---|
| Water absorption capacity (g/g) | 1.73 ± 0.03 d | 4.35 ± 0.01 b | 4.42 ± 0.07 b | 4.27 ± 0.02 c | 4.57 ± 0.01 a |
| Oil absorption capacity (g/g) | 2.19 ± 0.09 a | 1.85 ± 0.02 e | 1.95 ± 0.001 b | 1.93 ± 0.01 c | 1.90 ± 0.03 d |
| Swelling index (g/g) | |||||
| 60 °C | 1.70 ± 0.60 e | 8.51 ± 0.07 b | 6.45 ± 0.09 c | 4.72 ± 0.05 d | 8.67 ± 0.11 a |
| 70 °C | 2.17 ± 0.06 e | 10.65 ± 0.08 b | 7.28 ± 0.08 c | 5.50 ± 0.10 d | 15.55 ± 0.09 a |
| 80 °C | 4.47 ± 0.09 e | 12.88 ± 0.11 b | 10.65 ± 0.13 c | 7.90 ± 0.11 d | 19.30 ± 0.24 a |
| 90 °C | 6.54 ± 0.08 e | 16.41 ± 0.06 b | 12.59 ± 0.16 d | 13.56 ± 0.08 c | 21.50 ± 0.22 a |
| Solubility index (g/g) | |||||
| 60 °C | 0.55 ± 0.01 d | 0.73 ± 0.01 a | 0.58 ± 0.01 c | 0.65 ± 0.02 b | 0.65 ± 0.04 b |
| 70 °C | 0.57 ± 0.01 e | 0.78 ± 0.01 b | 0.59 ± 0.01 d | 0.67 ± 0.01 c | 0.82 ± 0.01 a |
| 80 °C | 0.57 ± 0.01 e | 0.79 ± 0.01 b | 0.65 ± 0.01 d | 0.71 ± 0.01 c | 0.85 ± 0.01 a |
| 90 °C | 0.59 ± 0.01 e | 0.85 ± 0.01 b | 0.67 ± 0.01 d | 0.73 ± 0.01 c | 0.87 ± 0.01 a |
| Light transmittance (%) | |||||
| 0 h | 5.68 ± 0.03 e | 28.06 ± 0.05 b | 10.24 ± 0.07 c | 7.62 ± 0.06 d | 29.75 ± 0.15 a |
| 24 h | 3.66 ± 0.02 e | 26.44 ± 0.08 a | 7.46 ± 0.19 c | 4.17 ± 0.04 d | 25.54 ± 0.18 b |
| 48 h | 2.71 ± 0.01 d | 23.89 ± 0.07 a | 5.08 ± 0.14 c | 2.70 ± 0.07 d | 22.69 ± 0.09 b |
| 72 h | 1.97 ± 0.01 d | 16.61 ± 0.07 b | 4.22 ± 0.04 c | 2.04 ± 0.04 d | 21.32 ± 0.23 a |
| 96 h | 0.63 ± 0.02 d | 10.48 ± 0.18 a | 1.28 ± 0.04 c | 1.55 ± 0.08 b | 10.65 ± 0.12 a |
| 120 h | 0.21 ± 0.01 e | 5.36 ± 0.02 a | 1.08 ± 0.03 c | 0.47 ± 0.02 d | 4.61 ± 0.05 b |
| Parameter | Native NK | NK–Butyric | NK–LAURIC | NK–Stearic | NK–Linoleic |
|---|---|---|---|---|---|
| RVA pasting properties | |||||
| Peak viscosity (cP) | 4222 ± 19 a | 3295 ± 76 b | 2275 ± 10 d | 847 ± 24 e | 2787 ± 34 c |
| Trough viscosity (cP) | 3128 ± 62 a | 2802 ± 23 b | 1736 ± 9 d | 604 ± 10 e | 2324 ± 22 c |
| Breakdown viscosity (cP) | 1095 ± 87 a | 493 ± 54 b | 539 ± 7 b | 243 ± 14 c | 463 ± 13 b |
| Final viscosity (cP) | 6660 ± 60 a | 3492 ± 55 b | 2084 ± 36 d | 641 ± 19 e | 2950 ± 44 c |
| Setback viscosity (cP) | 3532 ± 73 a | 710 ± 55 b | 349 ± 20 c | 37 ± 9 d | 626 ± 26 b |
| Pasting temperature (°C) | 82.10 ± 1.8 b | 50.36 ± 0.1 d | 66.63 ± 0.25 c | 90.50 ± 3.3 a | 50.31 ± 0.2 d |
| Thermal property | |||||
| Onset temperature; To (°C) | 62.51 ± 5.2 d | 96.80 ± 2.62 c | 95.57 ± 2.8 c | 99.82 ± 1.71 b | 100.48 ± 1.2 a |
| Endothermic peak; Tp (°C) | 120.33 ± 4.2 a | 113.6 ± 1.4 b | 113.93 ± 0.8 b | 112.64 ± 1.6 b | 115.13 ± 1.7 b |
| End temperature; Tend (°C) | 179.54 ± 6.1 a | 125.48 ± 1.12 b | 125.50 ± 0.8 b | 123.04 ± 0.78 c | 126.28 ± 1.2 b |
| Enthalpy; ΔH (J/g) | 84.96 ± 6.3 e | 616.30 ± 5.34 c | 637.27 ± 5.7 b | 528.82 ± 4.6 d | 718.53 ± 4.5 a |
| Parameter | Native NK | NK–Butyric | NK–Lauric | NK–Stearic | NK–Linoleic |
|---|---|---|---|---|---|
| Bile acid-binding capacity (%) | 12.02 ± 0.01 e | 12.98 ± 0.01 c | 14.23 ± 0.25 b | 15.21 ± 0.08 a | 12.64 ± 0.07 d |
| DPPH radical scavenging activity (%) | 41.78 ± 0.08 e | 48.06 ± 0.11 b | 54.74 ± 0.05 a | 45.12 ± 0.40 d | 47.21 ± 0.16 c |
| Bifidobacterium cell (OD600 nm) * | |||||
| 1.25 g/L | 0.05 ± 0.01 b | 0.08 ± 0.02 a | 0.04 ± 0.01 b | 0.10 ± 0.01 a | 0.04 ± 0.01 b |
| 2.5 g/L | 0.09 ± 0.01 c | 0.12 ± 0.02 b | 0.06 ± 0.02 d | 0.13 ± 0.01 b | 0.18 ± 0.01 a |
| 5 g/L | 0.17 ± 0.04 d | 0.26 ± 0.05 c | 0.13 ± 0.05 d | 0.32 ± 0.04 b | 0.40 ± 0.01 a |
| 10 g/L | 0.30 ± 0.01 c | 0.35 ± 0.005 c | 0.50 ± 0.05 b | 0.70 ± 0.01 a | 0.51 ± 0.09 b |
| 20 g/L | 0.87 ± 0.01 b | 0.82 ± 0.06 b | 0.90 ± 0.01 a | 0.60 ± 0.03 c | 0.80 ± 0.04 b |
| 40 g/L | 0.80 ± 0.02 a | 0.80 ± 0.08 a | 0.63 ± 0.03 b | 0.52 ± 0.09 c | 0.66 ± 0.02 b |
Publisher’s Note: MDPI stays neutral with regard to jurisdictional claims in published maps and institutional affiliations. |
© 2022 by the authors. Licensee MDPI, Basel, Switzerland. This article is an open access article distributed under the terms and conditions of the Creative Commons Attribution (CC BY) license (https://creativecommons.org/licenses/by/4.0/).
Share and Cite
Chumsri, P.; Panpipat, W.; Cheong, L.-Z.; Chaijan, M. Formation of Intermediate Amylose Rice Starch–Lipid Complex Assisted by Ultrasonication. Foods 2022, 11, 2430. https://doi.org/10.3390/foods11162430
Chumsri P, Panpipat W, Cheong L-Z, Chaijan M. Formation of Intermediate Amylose Rice Starch–Lipid Complex Assisted by Ultrasonication. Foods. 2022; 11(16):2430. https://doi.org/10.3390/foods11162430
Chicago/Turabian StyleChumsri, Paramee, Worawan Panpipat, Ling-Zhi Cheong, and Manat Chaijan. 2022. "Formation of Intermediate Amylose Rice Starch–Lipid Complex Assisted by Ultrasonication" Foods 11, no. 16: 2430. https://doi.org/10.3390/foods11162430
APA StyleChumsri, P., Panpipat, W., Cheong, L.-Z., & Chaijan, M. (2022). Formation of Intermediate Amylose Rice Starch–Lipid Complex Assisted by Ultrasonication. Foods, 11(16), 2430. https://doi.org/10.3390/foods11162430