
Application of Laser-Induced Breakdown Spectroscopy and Chemometrics for the Quality Evaluation of Foods with Medicinal Properties: A Review

 ,
,  ,
,  and
and 
Abstract
: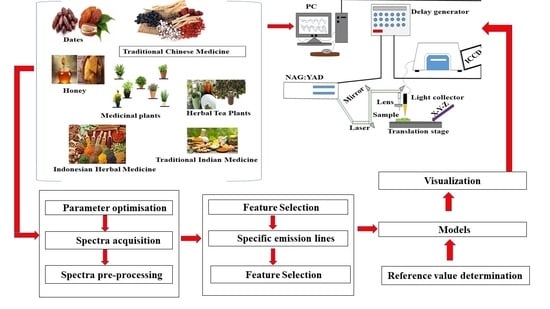
1. Introduction
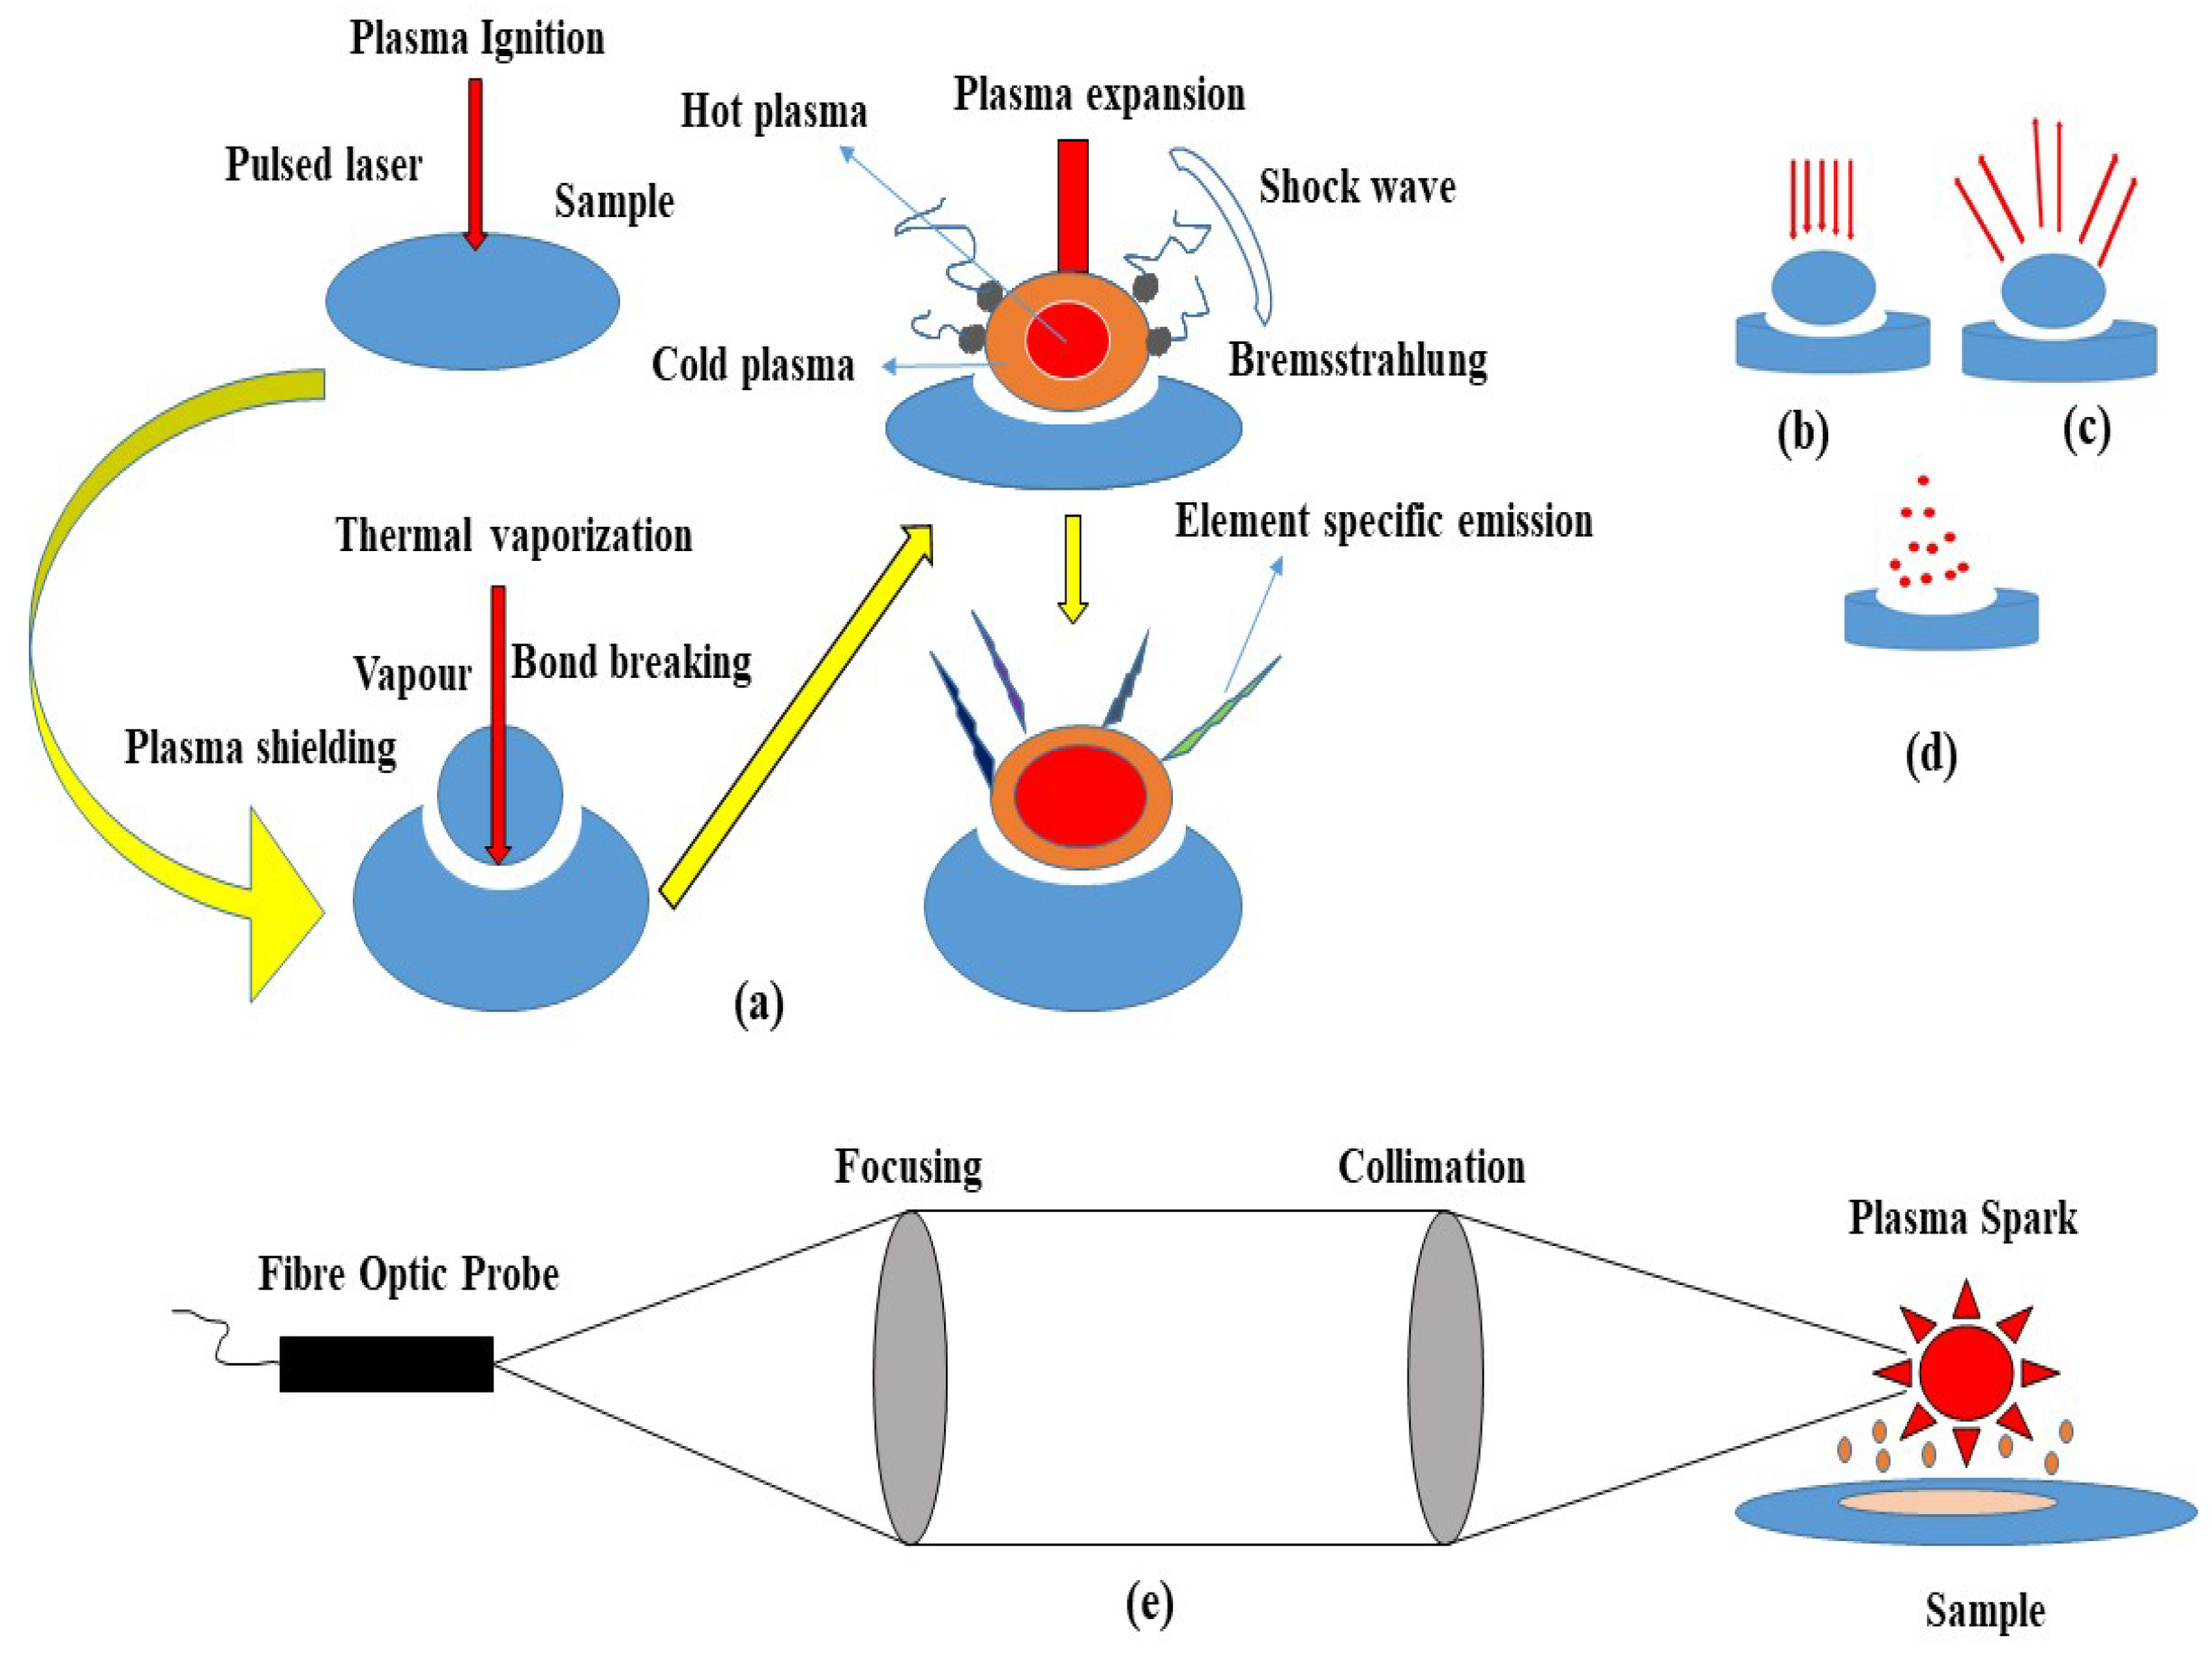
2. Principles Related to LIBS
LIBS Plasma Production
3. The Theoretical Approach of LIBS
4. Advantages and Disadvantages of LIBS
5. Prospects Related to Using LIBS in Herbal Technology
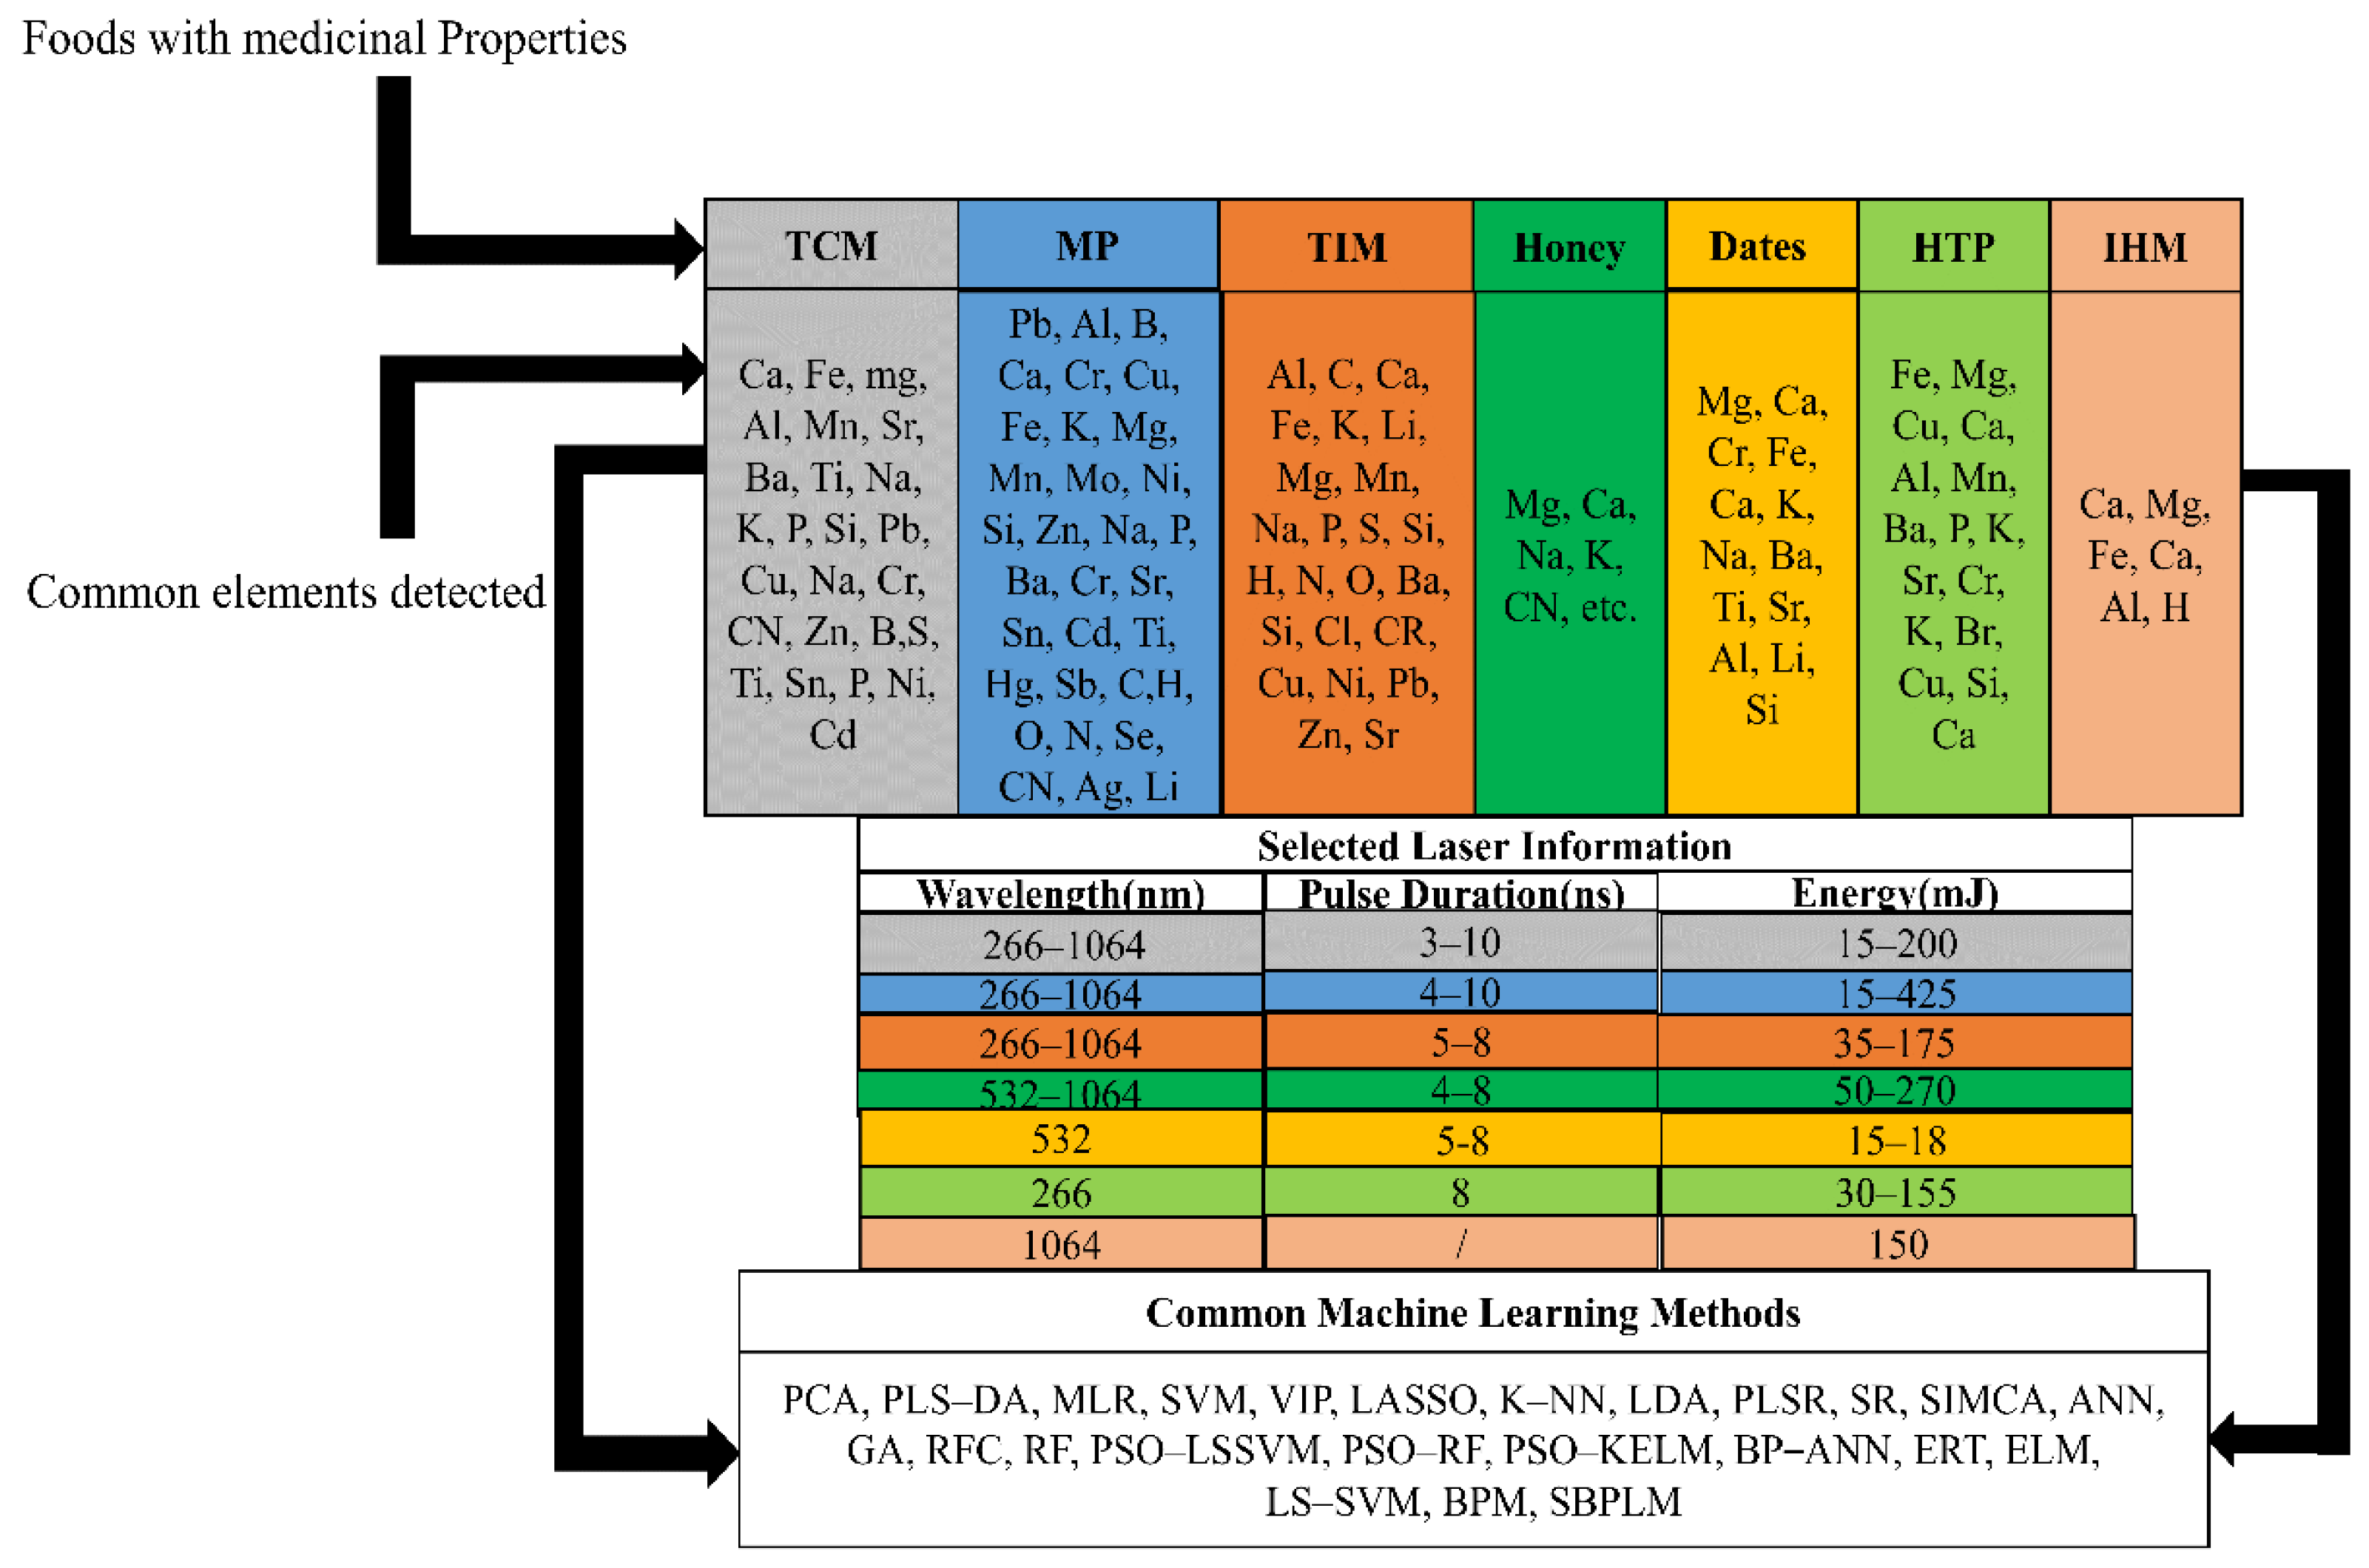
6. Quality Assurance, Chemical Constituent and Risk Assessment of Foods with Medicinal Properties Using LIBS
6.1. Traditional Chinese Medicine (TCM)
6.2. Medicinal Plant and Indian Herbal Medicine
6.3. Honey
6.4. Date Fruits
6.5. Herbal Tea Plant
6.6. Indonesian Herbal Medicine
7. Conclusions and Remarks
Author Contributions
Funding
Institutional Review Board Statement
Informed Consent Statement
Data Availability Statement
Acknowledgments
Conflicts of Interest
Abbreviations
| LIBS | Laser-Induced Breakdown Spectroscopy |
| ML | Machine Learning |
| HM | Herbal Medicine |
| FMPs | Foods with Medicinal Properties |
| TCM | Traditional Chinese Medicine |
| MP | Medicinal Plants |
| TIM | Traditional Indian Medicine |
| IHM | Indonesian Herbal Medicine |
| HTP | Herbal Tea Plant |
| LTE | Local Thermal Equilibrium |
| WHO | World Health Organization |
| CFDA | China Food and Drug Administration |
| FDA | Food and Drug Administration |
| EMA | European Medicines Agency |
| MFDS | Ministry of Food and Drug Safety |
| LF | Laser-induced fluorescence |
| PCA | Principal Component Analysis |
| SVM | Support Vector Machine |
| PLS | Partial Least Squares |
| PLS-DA | Partial Least Squares Discriminant Analysis |
| ANN | Artificial Neural Network |
| BP-ANN | Back Propagation Artificial Neural Network |
| ELM | Extreme Learning Machine |
| SIMCA | Soft Independent Modeling of Class Analogy; |
| K-NN | K-Nearest Neighbor |
| RF | Random Forest |
| MLR | Multiple Linear Regression |
| LS-SVM | Least Squares Support Vector Machines |
| LASSO | Least Absolute Shrinkage and Selection Operator |
| PSO-LSSVM | Particle Swarm Optimization-Least Squares Support Vector Machine |
| PSO-RF | Particle Swarm Optimization-Random Forest |
| PSO-KELM | Particle Swarm Optimization-Kernel Extreme Learning Machine |
| CF-LIBS | Calibration Free-LIBS |
| SLST | Solid liquid solid transformation |
| LDA | Linear Discriminant Analysis |
| GA | Genetic Algorithm |
| VIP | Variable Importance In Projection |
| LTE | Local Thermodynamic Equilibrium |
| SR | Selectivity Ratio |
| MSL | Mars Science Laboratory |
| LIF | Laser-induced fluorescence |
| ERT | Extremely Randomized Trees |
| ICP-OES | Inductively Coupled Plasma-Optical Emission Spectrometry |
| RFC | Random Forest Classifiers |
| HPLC-RID | High-Pressure Liquid Chromatography-Refractive Index Detector |
| EO | Electro-optical; BPM, Boltzmann Plot Method |
| SBLPM | Stark Broadened Line Profile Method |
| DP-LIBS | Double Pulse Laser-Induced Breakdown Spectroscopy |
| SP-LIBS | Single Pulse Laser-Induced Breakdown Spectroscopy |
| PAT | Process Analytical Technology |
References
- Hahn, D.W.; Omenetto, N. Laser-induced breakdown spectroscopy (LIBS), part I: Review of basic diagnostics and plasma-particle interactions: Still-challenging issues within the analytical plasma community. Appl. Spectrosc. 2010, 64, 335–366. [Google Scholar] [CrossRef] [PubMed] [Green Version]
- Miziolek, A.W.; Palleschi, V.; Schechter, I. Laser Induced Breakdown Spectroscopy; Cambridge University Press: Cambridge, UK, 2006. [Google Scholar]
- Rai, P.K.; Srivastava, A.K.; Sharma, B.; Dhar, P.; Mishra, A.K.; Watal, G. Use of laser-induced breakdown spectroscopy for the detection of glycemic elements in Indian medicinal plants. Evid. Based Complementary Altern. Med. 2013, 2013, 406365. [Google Scholar] [CrossRef] [PubMed]
- Andersen, M.-B.S.; Frydenvang, J.; Henckel, P.; Rinnan, Å. The potential of laser-induced breakdown spectroscopy for industrial at-line monitoring of calcium content in comminuted poultry meat. Food Control 2016, 64, 226–233. [Google Scholar] [CrossRef]
- Bilge, G.; Boyacı, İ.H.; Eseller, K.E.; Tamer, U.; Çakır, S. Analysis of bakery products by laser-induced breakdown spectroscopy. Food Chem. 2015, 181, 186–190. [Google Scholar] [CrossRef] [PubMed]
- Bilge, G.; Sezer, B.; Eseller, K.E.; Berberoglu, H.; Topcu, A.; Boyaci, I.H. Determination of whey adulteration in milk powder by using laser induced breakdown spectroscopy. Food Chem. 2016, 212, 183–188. [Google Scholar] [CrossRef] [PubMed]
- Bilge, G.; Sezer, B.; Eseller, K.E.; Berberoglu, H.; Koksel, H.; Boyaci, I.H. Ash analysis of flour sample by using laser-induced breakdown spectroscopy. Spectrochim. Acta Part B At. Spectrosc. 2016, 124, 74–78. [Google Scholar] [CrossRef]
- Bilge, G.; Sezer, B.; Eseller, K.E.; Berberoğlu, H.; Köksel, H.; Boyacı, İ.H. Determination of Ca addition to the wheat flour by using laser-induced breakdown spectroscopy (LIBS). Eur. Food Res. Technol. 2016, 242, 1685–1692. [Google Scholar] [CrossRef]
- Bilge, G.; Velioglu, H.M.; Sezer, B.; Eseller, K.E.; Boyaci, I.H. Identification of meat species by using laser-induced breakdown spectroscopy. Meat Sci. 2016, 119, 118–122. [Google Scholar] [CrossRef]
- Gondal, M.; Habibullah, Y.; Baig, U.; Oloore, L. Direct spectral analysis of tea samples using 266 nm UV pulsed laser-induced breakdown spectroscopy and cross validation of LIBS results with ICP-MS. Talanta 2016, 152, 341–352. [Google Scholar] [CrossRef]
- Mehder, A.O.; Habibullah, Y.B.; Gondal, M.A.; Baig, U. Qualitative and quantitative spectro-chemical analysis of dates using UV-pulsed laser induced breakdown spectroscopy and inductively coupled plasma mass spectrometry. Talanta 2016, 155, 124–132. [Google Scholar] [CrossRef]
- Hahn, D.W.; Omenetto, N. Laser-induced breakdown spectroscopy (LIBS), Part II: Review of instrumental and methodological approaches to material analysis and applications to different fields. Appl. Spectrosc. 2012, 66, 347–419. [Google Scholar] [CrossRef] [PubMed]
- Brennecke, J.; Stark, A.; Russell, R.B.; Cohen, S.M. Principles of microRNA-target recognition. PLoS Biol. 2005, 3, e85. [Google Scholar] [CrossRef]
- Ogura, Y.; Bonen, D.K.; Inohara, N.; Nicolae, D.L.; Chen, F.F.; Ramos, R.; Britton, H.; Moran, T.; Karaliuskas, R.; Duerr, R.H.; et al. A frameshift mutation in NOD2 associated with susceptibility to Crohn’s disease. Nature 2001, 411, 603–606. [Google Scholar] [CrossRef] [PubMed]
- Yang, X.; Wang, Y.; Byrne, R.; Schneider, G.; Yang, S. Concepts of artificial intelligence for computer-assisted drug discovery. Chem. Rev. 2019, 119, 10520–10594. [Google Scholar] [CrossRef] [Green Version]
- Wang, M.; Jiang, L.; Wang, S.; Guo, Q.; Tian, F.; Chu, Z.; Zhang, J.; Li, X.; Lu, Y. Multiscale visualization of colloidal particle lens array mediated plasma dynamics for dielectric nanoparticle enhanced femtosecond laser-induced breakdown spectroscopy. Anal. Chem. 2019, 91, 9952–9961. [Google Scholar] [CrossRef] [PubMed]
- Tian, H.; Jiao, L.; Dong, D. Rapid determination of trace cadmium in drinking water using laser-induced breakdown spectroscopy coupled with chelating resin enrichment. Sci. Rep. 2019, 9, 1–8. [Google Scholar] [CrossRef] [Green Version]
- Breiman, L. Random forests. Mach. Learn. 2001, 45, 5–32. [Google Scholar] [CrossRef] [Green Version]
- Chen, T.; Zhang, T.; Li, H. Applications of laser-induced breakdown spectroscopy (LIBS) combined with machine learning in geochemical and environmental resources exploration. TrAC Trends Anal. Chem. 2020, 133, 116113. [Google Scholar] [CrossRef]
- Huang, G.-B.; Zhu, Q.-Y.; Siew, C.-K. Extreme learning machine: Theory and applications. Neurocomputing 2006, 70, 489–501. [Google Scholar] [CrossRef]
- Anabitarte, F.; Cobo, A.; Lopez-Higuera, J.M. Laser-Induced Breakdown Spectroscopy: Fundamentals, Applications, and Challenges. ISRN Spectrosc. 2012, 2012, 285240. [Google Scholar] [CrossRef] [Green Version]
- Wong, D.M.; Bolshakov, A.; Russo, R.E. Laser Induced Breakdown Spectroscopy; Academic Press: New York, NY, USA, 2010; pp. 1281–1287. [Google Scholar]
- Cremers, D.A.; Radziemski, L.J.; Loree, T.R. Spectrochemical analysis of liquids using the laser spark. Appl. Spectrosc. 1984, 38, 721–729. [Google Scholar] [CrossRef]
- Singh, J.; Thakur, S. Laser-Induced Breakdown Spectroscopy; Elsevier Science: Amsterdam, The Netherlands, 2007. [Google Scholar]
- Federer, H. Geometric Measure Theory; Springer: Berlin/Heidelberg, Germany, 1996. [Google Scholar]
- WHO. General Guidelines for Methodologies on Research and Evaluation of Traditional Medicine; World Health Organization: Geneva, Switzerland, 2000. [Google Scholar]
- Sendker, J.; Sheridan, H. Composition and Quality Control of Herbal Medicines. In Toxicology of Herbal Products; Pelkonen, O., Duez, P., Vuorela, P.M., Vuorela, H., Eds.; Springer: Cham, Switzerland, 2017; pp. 29–65. [Google Scholar]
- He, T.-T.; Ung, C.O.L.; Hu, H.; Wang, Y.-T. Good manufacturing practice (GMP) regulation of herbal medicine in comparative research: China GMP, cGMP, WHO-GMP, PIC/S and EU-GMP. Eur. J. Integr. Med. 2015, 7, 55–66. [Google Scholar] [CrossRef]
- Goodarzi, M.; Russell, P.J.; Vander Heyden, Y. Similarity analyses of chromatographic herbal fingerprints: A review. Anal. Chim. Acta 2013, 804, 16–28. [Google Scholar] [CrossRef] [PubMed]
- Bansal, A.; Chhabra, V.; Rawal, R.K.; Sharma, S. Chemometrics: A new scenario in herbal drug standardization. J. Pharm. Anal. 2014, 4, 223–233. [Google Scholar] [CrossRef] [PubMed] [Green Version]
- Kibble, M.; Saarinen, N.; Tang, J.; Wennerberg, K.; Mäkelä, S.; Aittokallio, T. Network pharmacology applications to map the unexplored target space and therapeutic potential of natural products. Nat. Prod. Rep. 2015, 32, 1249–1266. [Google Scholar] [CrossRef]
- Szakiel, A.; Pączkowski, C.; Henry, M. Influence of environmental abiotic factors on the content of saponins in plants. Phytochem. Rev. 2011, 10, 471–491. [Google Scholar] [CrossRef]
- Ning, Z.; Lu, C.; Zhang, Y.; Zhao, S.; Liu, B.; Xu, X.; Liu, Y. Application of plant metabonomics in quality assessment for large-scale production of traditional Chinese medicine. Planta Med. 2013, 79, 897–908. [Google Scholar] [CrossRef] [Green Version]
- Liu, C.X.; Cheng, Y.Y.; Guo, D.A.; Zhang, T.J.; Li, Y.Z.; Hou, W.B.; Huang, L.Q.; Xu, H.Y. A new concept on quality marker for quality assessment and process control of chinese medicines. Chin. Herb. Med. 2017, 9, 3–13. [Google Scholar] [CrossRef]
- Tistaert, C.; Dejaegher, B.; Heyden, Y.V. Chromatographic separation techniques and data handling methods for herbal fingerprints: A review. Anal. Chim. Acta 2011, 690, 148–161. [Google Scholar] [CrossRef]
- Guo, D.a. Quality Marker Concept Inspires the Quality Research of Traditional Chinese Medicines. Chin. Herb. Med. 2017, 9, 1–2. [Google Scholar] [CrossRef]
- Li, P.; Qi, L.W.; Liu, E.H.; Zhou, J.L.; Wen, X.D. Analysis of Chinese herbal medicines with holistic approaches and integrated evaluation models. TrAC Trends Anal. Chem. 2008, 27, 66–77. [Google Scholar] [CrossRef]
- Wu, C.; Lee, S.-L.; Taylor, C.; Li, J.; Chan, Y.-M.; Agarwal, R.; Temple, R.; Throckmorton, D.; Tyner, K. Scientific and regulatory approach to botanical drug development: A US FDA Perspective. J. Nat. Prod. 2020, 83, 552–562. [Google Scholar] [CrossRef] [PubMed]
- Lee, G.J.; Lee, J.H.; Park, J.H.; Kwon, S.W.; Lim, J.; Lee, S.; Lee, J. Assessment of chemical equivalence in herbal materials using chromatographic fingerprints by combination of three similarity indices and three-dimensional kernel density estimation. Anal. Chim. Acta 2018, 1037, 220–229. [Google Scholar] [CrossRef] [PubMed]
- Huang, Y.; Wu, Z.; Su, R.; Ruan, G.; Du, F.; Li, G. Current application of chemometrics in traditional Chinese herbal medicine research. J. Chromatogr. B 2016, 1026, 27–35. [Google Scholar] [CrossRef] [PubMed]
- Tang, J.L.; Liu, B.Y.; Ma, K.W. Traditional Chinese medicine. Lancet 2008, 372, 1938–1940. [Google Scholar] [CrossRef]
- Zhang, H.; Tan, C.e.; Wang, H.; Xue, S.; Wang, M. Study on the history of Traditional Chinese Medicine to treat diabetes. Eur. J. Integr. Med. 2010, 2, 41–46. [Google Scholar] [CrossRef]
- Normile, D. Asian medicine. The new face of traditional Chinese medicine. Science 2003, 299, 188–190. [Google Scholar] [CrossRef]
- Paterson, R.R. Cordyceps: A traditional Chinese medicine and another fungal therapeutic biofactory? Phytochemistry 2008, 69, 1469–1495. [Google Scholar] [CrossRef] [Green Version]
- Lin, A.X.; Chan, G.; Hu, Y.; Ouyang, D.; Ung, C.O.L.; Shi, L.; Hu, H. Internationalization of traditional Chinese medicine: Current international market, internationalization challenges and prospective suggestions. Chin. Med. 2018, 13, 9. [Google Scholar] [CrossRef] [Green Version]
- Luo, L.; Ren, J.; Zhang, F.; Zhang, W.; Li, C.; Qiu, Z.; Huang, D. The effects of air pollution on length of hospital stay for adult patients with asthma. Int. J. Health Plan. Manag. 2018, 33, e751–e767. [Google Scholar] [CrossRef]
- Yuanzhe, Z.-C.; Liu, Y.; Saleem, S.; Zhang, Q.; Yu, C.; Qu, Y.; Xu, L. Online in situ detection and rapid distinguishing of saffron. J. Laser Appl. 2020, 32, 032020. [Google Scholar]
- Coghlan, M.L.; Maker, G.; Crighton, E.; Haile, J.; Murray, D.C.; White, N.E.; Byard, R.W.; Bellgard, M.I.; Mullaney, I.; Trengove, R.; et al. Combined DNA, toxicological and heavy metal analyses provides an auditing toolkit to improve pharmacovigilance of traditional Chinese medicine (TCM). Sci. Rep. 2015, 5, 17475. [Google Scholar] [CrossRef] [Green Version]
- Hajar, E.W.I.; Sulaiman, A.Z.B.; Sakinah, A.M.M. Assessment of Heavy Metals Tolerance in Leaves, Stems and Flowers of Stevia Rebaudiana Plant. Procedia Environ. Sci. 2014, 20, 386–393. [Google Scholar] [CrossRef] [Green Version]
- Hou, F.; Wen, L.; Peng, C.; Guo, J. Identification of marine traditional Chinese medicine dried seahorses in the traditional Chinese medicine market using DNA barcoding. Mitochondrial DNA Part A 2016, 29, 1–6. [Google Scholar] [CrossRef]
- Wang, J.; Li, X.; Zheng, P.; Zheng, S.; Zhao, H.; Mao, X.; Wang, X.; Lai, C. Spectral characterization of collinear double-pulse laser induced breakdown spectroscopy (DP-LIBS) for the analysis of the Chinese Traditional Medicine Artemisia annua. Anal. Lett. 2020, 53, 2921–2934. [Google Scholar] [CrossRef]
- Liu, F.; Wang, W.; Shen, T.; Peng, J.; Kong, W. Rapid identification of kudzu powder of different origins using laser-induced breakdown spectroscopy. Sensors 2019, 19, 1453. [Google Scholar] [CrossRef] [Green Version]
- Liu, X.; Zhang, Q.; Wu, Z.; Shi, X.; Zhao, N.; Qiao, Y. Rapid elemental analysis and provenance study of Blumea balsamifera DC using laser-induced breakdown spectroscopy. Sensors 2014, 15, 642–655. [Google Scholar] [CrossRef] [PubMed] [Green Version]
- Rai, P.K.; Jaiswal, D.; Rai, N.; Pandhija, S.; Rai, A.K.; Watal, G. Role of glycemic elements of Cynodon dactylon and Musa paradisiaca in diabetes management. Lasers Med. Sci. 2008, 24, 761–768. [Google Scholar] [CrossRef] [PubMed]
- Tewari, D.; Manchanda, A.K.; Patni, P. Pharmacognostical, Biochemical and Elemental investigation of Ocimum basilicum plants available in western Himalayas. Int. J. Res. Pharm. Biomed. Sci. 2012, 3, 840–845. [Google Scholar]
- Tripathi, D.K.; Pathak, A.K.; Chauhan, D.K.; Dubey, N.K.; Rai, A.K.; Prasad, R. An efficient approach of Laser Induced Breakdown Spectroscopy (LIBS) and ICAP-AES to detect the elemental profile of Ocimum L. species. Biocatal. Agric. Biotechnol. 2015, 4, 471–479. [Google Scholar] [CrossRef]
- Zhu, C.; Tang, Z.; Li, Q.; Zhou, R.; Lv, J.; Zhang, W.; Zhan, K.; Li, X.; Zeng, X. Lead of detection in rhododendron leaves using laser-induced breakdown spectroscopy assisted by laser-induced fluorescence. Sci. Total Environ. 2020, 738, 139402. [Google Scholar] [CrossRef] [PubMed]
- Iqbal, J.; Asghar, H.; Shah, S.; Naeem, M.; Abbasi, S.; Ali, R. Elemental analysis of sage (herb) using calibration-free laser-induced breakdown spectroscopy. Appl. Opt. 2020, 59, 4927–4932. [Google Scholar] [CrossRef] [PubMed]
- Baudelet, M.; Smith, B.W. The first years of laser-induced breakdown spectroscopy. J. Anal. At. Spectrom. 2013, 28, 624–629. [Google Scholar] [CrossRef]
- Wu, L.; Du, B.; Vander Heyden, Y.; Chen, L.; Zhao, L.; Wang, M.; Xue, X. Recent advancements in detecting sugar-based adulterants in honey—A challenge. TrAC Trends Anal. Chem. 2017, 86, 25–38. [Google Scholar] [CrossRef]
- Peng, J.; Xie, W.; Jiang, J.; Zhao, Z.; Zhou, F.; Liu, F. Fast quantification of honey adulteration with laser-induced breakdown spectroscopy and chemometric methods. Foods 2020, 9, 341. [Google Scholar] [CrossRef] [Green Version]
- Zhang, W.; Xue, J. Economically motivated food fraud and adulteration in China: An analysis based on 1553 media reports. Food Control 2016, 67, 192–198. [Google Scholar] [CrossRef]
- Kendall, H.; Clark, B.; Rhymer, C.; Kuznesof, S.; Hajslova, J.; Tomaniova, M.; Brereton, P.; Frewer, L. A systematic review of consumer perceptions of food fraud and authenticity: A European perspective. Trends Food Sci. Technol. 2019, 94, 79–90. [Google Scholar] [CrossRef]
- Lastra-Mejías, M.; Izquierdo, M.; González-Flores, E.; Cancilla, J.C.; Izquierdo, J.G.; Torrecilla, J.S. Honey exposed to laser-induced breakdown spectroscopy for chaos-based botanical classification and fraud assessment. Chemom. Intell. Lab. Syst. 2020, 199, 103939. [Google Scholar] [CrossRef]
- Wang, J.; Li, X.; Zheng, P.; Zheng, S.; Mao, X.; Zhao, H.; Liu, R. Characterization of the Chinese Traditional Medicine Artemisia annua by laser-induced breakdown spectroscopy (LIBS) with 532 nm and 1064 nm excitation. Anal. Lett. 2019, 53, 1–15. [Google Scholar] [CrossRef]
- Gondal, M.A. Elemental analysis of Moringa oleifera seeds by laser-induced breakdown spectroscopy (LIBS) and its anti-cancer and anti-microbial studies. bioRxiv 2020, 2020.2004.2015.042663. [Google Scholar] [CrossRef]
- Wang, J.; Liao, X.; Zheng, P.; Xue, S.; Peng, R. Classification of Chinese herbal medicine by laser-induced breakdown spectroscopy with principal component analysis and artificial neural network. Anal. Lett. 2018, 51, 575–586. [Google Scholar] [CrossRef]
- Liu, X.; Xiaoqing, C.; Li, K.; Wang, X.; Lin, Z.; Wu, Z.; Zheng, Q. Geographical authenticity evaluation of Mentha haplocalyx by LIBS coupled with multivariate analyses. Plasma Sci. Technol. 2020, 22, 074006. [Google Scholar] [CrossRef]
- Wang, J.; Xue, S.; Zheng, P.; Chen, Y.; Peng, R. Determination of lead and copper in Ligusticum wallichii by laser-induced breakdown spectroscopy. Anal. Lett. 2017, 50, 2000–2011. [Google Scholar] [CrossRef]
- Shen, T.; Li, W.; Zhang, X.; Kong, W.; Liu, F.; Wang, W.; Peng, J. High-sensitivity determination of nutrient elements in Panax notoginseng by laser-induced breakdown spectroscopy and chemometric methods. Molecules 2019, 24, 1525. [Google Scholar] [CrossRef] [PubMed] [Green Version]
- Liang, J.; Yan, C.; Zhang, Y.; Zhang, T.; Zheng, X.; Li, H. Rapid discrimination of Salvia miltiorrhiza according to their geographical regions by laser induced breakdown spectroscopy (LIBS) and particle swarm optimization-kernel extreme learning machine (PSO-KELM). Chemom. Intell. Lab. Syst. 2020, 197, 103930. [Google Scholar] [CrossRef]
- Liang, J.; Li, M.; Du, Y.; Yan, C.; Zhang, Y.; Zhang, T.; Zheng, X.; Li, H. Data fusion of laser induced breakdown spectroscopy (LIBS) and infrared spectroscopy (IR) coupled with random forest (RF) for the classification and discrimination of compound salvia miltiorrhiza. Chemom. Intell. Lab. Syst. 2020, 207, 104179. [Google Scholar] [CrossRef]
- Rehan, I.; Khan, M.Z.; Ali, I.; Rehan, K.; Sultana, S.; Shah, S. Spectroscopic analysis of high protein nigella seeds (Kalonji) using laser-induced breakdown spectroscopy and inductively coupled plasma/optical emission spectroscopy. Appl. Phys. B 2018, 124, 49. [Google Scholar] [CrossRef]
- Wang, Y.; Su, M.; Sun, D.; Wu, C.; Zhang, X.; Lu, Q.; Dong, C. Comparative study of magnesium and calcium in Codonopsis pilosula samples detected by CF-LIBS and LCGD-AES. Microchem. J. 2018, 137, 318–323. [Google Scholar] [CrossRef]
- Wang, J.; Shi, M.; Zheng, P.; Xue, S.; Peng, R. Quantitative Analysis of Ca, Mg, and K in the Roots of Angelica pubescens f. biserrata by Laser-Induced Breakdown Spectroscopy Combined with Artificial Neural Networks. J. Appl. Spectrosc. 2018, 85, 1–7. [Google Scholar] [CrossRef]
- Han, W.; Maogen, S.; Sun, D.-X.; Yin, Y.-P.; Wang, Y.; Gao, C.; Yang, F.; Fu, Y. Analysis of metallic elements dissolution in the Astragalus at different decocting time by using LIBS technique. Plasma Sci. Technol. 2020, 22, 085501. [Google Scholar] [CrossRef]
- Al Adel, F.F.; Gondal, M.A.; Lais, A.; Al-Dakheel, R.K.; Dastageer, M.A. Spectrochemical analysis of cinnamon using advanced analytical XPS and LIBS Techniques. Arab. J. Sci. Eng. 2021, 46, 5993–6006. [Google Scholar] [CrossRef]
- Dai, S.; Shang, Z.; Wang, F.; Cao, Y.; Shi, X.; Lin, Z.; Wang, Z.; Li, N.; Lu, J.; Qiao, Y.; et al. Novelty application of multi-omics correlation in the discrimination of sulfur-fumigation and non-sulfur-fumigation Ophiopogonis Radix. Sci. Rep. 2017, 7, 9971. [Google Scholar] [CrossRef] [PubMed] [Green Version]
- Schenk, E.R.; Almirall, J.R. Elemental analysis of cotton by laser-induced breakdown spectroscopy. Appl. Opt. 2010, 49, C153–C160. [Google Scholar] [CrossRef]
- Jiang, Y.; Kang, J.; Wang, Y.; Chen, Y.; Li, R. Rapid and sensitive analysis of trace leads in medicinal herbs using laser-induced breakdown spectroscopy-laser-induced fluorescence (LIBS-LIF). Appl. Spectrosc. 2019, 73, 1284–1291. [Google Scholar] [CrossRef]
- Andrade, D.F.; Pereira-Filho, E.R.; Konieczynski, P. Comparison of ICP OES and LIBS analysis of medicinal herbs rich in flavonoids from Eastern Europe. J. Braz. Chem. Soc. 2017, 28, 838–847. [Google Scholar] [CrossRef]
- Mnayer, D.; Fabiano-Tixier, A.-S.; Petitcolas, E.; Ruiz, K.; Hamieh, T.; Chemat, F. Simultaneous extraction of essential oils and flavonoids from onions using turbo extraction-distillation. Food Anal. Methods 2015, 8, 586–595. [Google Scholar] [CrossRef]
- Jabbar, A.; Akhtar, M.; Mehmood, S.; Kurniawan, K.H.; Hedwig, R.; Baig, M.A. Analytical approach of laser-induced breakdown spectroscopy to detect elemental profile of medicinal plants leaves. Indones. J. Chem. 2019, 19, 11. [Google Scholar] [CrossRef]
- Amuah, C.L.Y.; Eghan, M.J.; Anderson, B.; Osei-Wusu Adueming, P.; Opoku-Ansah, J.; Buah-Bassuah, P.K. Laser-induced fluorescence combined with multivariate techniques identifies the geographical origin of antimalarial herbal plants. J. Opt. Soc. Am. A Opt. Image Sci. Vis. 2020, 37, C103–C110. [Google Scholar] [CrossRef]
- Aldakheel, R.K.; Rehman, S.; Almessiere, M.A.; Khan, F.A.; Gondal, M.A.; Mostafa, A.; Baykal, A. Bactericidal and in vitro cytotoxicity of moringa oleifera seed extract and its elemental analysis using laser-induced breakdown spectroscopy. Pharmaceuticals 2020, 13, 193. [Google Scholar] [CrossRef]
- Aldakheel, R.; Gondal, M.; Nasr, M.; Almessiere, M.; Idris, N. Spectral analysis of Miracle Moringa tree leaves using X-ray photoelectron, laser induced breakdown and inductively coupled plasma-optical emission spectroscopic techniques. Talanta 2020, 217, 121062. [Google Scholar] [CrossRef]
- Mehta, S.; Rai, P.K.; Rai, N.; Rai, A.K.; Bićanić, D.D.; Watal, G. Role of spectral studies in detection of antibacterial phytoelements and phytochemicals of Moringa oleifera. Food Biophys. 2011, 6, 497–502. [Google Scholar] [CrossRef]
- Khoshroo, H.; Khadem, H.; Bahreini, M.; Tavassoli, S.H.; Hadian, J. Quantitative analysis of essential oils of Thymus daenensis using laser-induced fluorescence and Raman spectroscopy. Appl. Opt. 2015, 54, 9533–9539. [Google Scholar] [CrossRef] [PubMed]
- Shukla, S.; Rai, P.K.; Chatterji, S.; Rai, N.K.; Rai, A.K.; Watal, G. LIBS Based Screening of Glycemic Elements of Ficus religiosa. Food Biophys. 2012, 7, 43–49. [Google Scholar] [CrossRef]
- Fatima, I.; Hussain, T.; Rafay, M.; Kanwal, S.; Rauf, N.; Malik, T.S.S.; Mahmood, T. Untargeted elemental and metabolomic profiling of some poaceae species using LIBS and GC-MS Methods. Commun. Soil Sci. Plant Anal. 2021, 52, 1037–1050. [Google Scholar] [CrossRef]
- Krajcarová, L.; Novotný, K.; Kummerová, M.; Dubová, J.; Gloser, V.; Kaiser, J. Mapping of the spatial distribution of silver nanoparticles in root tissues of Vicia faba by laser-induced breakdown spectroscopy (LIBS). Talanta 2017, 173, 28–35. [Google Scholar] [CrossRef] [PubMed]
- Tiwari, M.; Agrawal, R.; Pathak, A.K.; Rai, A.K.; Rai, G.K. Laser-induced breakdown spectroscopy: An approach to detect adulteration in turmeric. Spectrosc. Lett. 2013, 46, 155–159. [Google Scholar] [CrossRef]
- Aldakheel, R.K.; Gondal, M.A.; Nasr, M.M.; Dastageer, M.A.; Almessiere, M.A. Quantitative elemental analysis of nutritional, hazardous and pharmacologically active elements in medicinal Rhatany root using laser induced breakdown spectroscopy. Arab. J. Chem. 2021, 14, 102919. [Google Scholar] [CrossRef]
- Shahida, S.; Khan, M.I.; Azad, S.; Ahmed, N.; Lashari, M.H.; Khraisheh, M.; Almomani, F.; Zafar, S. Use of laser-induced break spectroscopy for the determination of major and trace elements in Zanthoxylum armatum. Emergent Mater. 2020, 3, 625–636. [Google Scholar] [CrossRef]
- Sharma, N.; Singh, V.K.; Lee, Y.; Kumar, S.; Rai, P.K.; Pathak, A.K.; Singh, V.K. Analysis of mineral elements in medicinal plant samples using LIBS and ICP-OES. At. Spectrosc. 2020, 41, 234–241. [Google Scholar] [CrossRef]
- Alresawum, Y. Laser induced breakdown spectroscopy (LIBS) for minerals analysis and for monitoring the change in elemental compositions of the mixtures of herbal medicines. Chem. Mater. Res. 2017, 9, 68–76. [Google Scholar]
- Rehan, K.; Rehan, I.; Khan, M.Z.; Farooq, Z.; Sultana, S.; Sarwar, M.; Rehman, M.U. Spectral analysis of mint (pudina) using laser-induced breakdown spectroscopy and inductively coupled plasma/atomic emission spectroscopy. Laser Phys. 2019, 29, 055702. [Google Scholar] [CrossRef]
- Nespeca, M.G.; Vieira, A.L.; Júnior, D.S.; Neto, J.A.G.; Ferreira, E.C. Detection and quantification of adulterants in honey by LIBS. Food Chem. 2020, 311, 125886. [Google Scholar] [CrossRef] [PubMed]
- Stefas, D.; Gyftokostas, N.; Kourelias, P.; Nanou, E.; Kokkinos, V.; Bouras, C.; Couris, S. A laser-based method for the detection of honey adulteration. Appl. Sci. 2021, 11, 6435. [Google Scholar] [CrossRef]
- Stefas, D.; Gyftokostas, N.; Kourelias, P.; Nanou, E.; Tananaki, C.; Kanelis, D.; Liolios, V.; Kokkinos, V.; Bouras, C.; Couris, S. Honey discrimination based on the bee feeding by laser induced breakdown spectroscopy. Food Control. 2022, 134, 108770. [Google Scholar] [CrossRef]
- Zhao, Z.; Chen, L.; Liu, F.; Zhou, F.; Peng, J.; Sun, M. Fast classification of geographical origins of honey based on laser-induced breakdown spectroscopy and multivariate analysis. Sensors 2020, 20, 1878. [Google Scholar] [CrossRef] [Green Version]
- Novotný, K.; Lutzký, F.; Galiova, M.; Kaiser, J.; Malina, R.; Kanický, V.; Otruba, V.t. Double pulse laser ablation and plasma: Time resolved spectral measurements. Chem. Listy 2008, 102, 1399–1402. [Google Scholar]
- Zafar, A.; Ahmed, N.; Umar, Z.A.; Baig, M.A. Spectrochemical analysis of dates available in Pakistan using laser induced breakdown spectroscopy (LIBS) and laser ablation time-of-flight mass spectrometer (LA-TOF-MS). Laser Phys. 2019, 29, 085602. [Google Scholar] [CrossRef]
- Sharma, N.; Khajuria, Y.; Sharma, J.; Gondal, M.A.; Kumar, V.; Dwivedi, Y.; Singh, V.K. Spectroscopic Analysis of Rhizomes of Black Turmeric (Curcuma caesia). In AIP Conference Proceedings; AIP Publishing LLC: Melville, NY, USA, 2018. [Google Scholar]
- Rehan, I.; Gondal, M.; Rehan, K.; Sultana, S.; Dastageer, M.; Al-Adel, F. LIBS for the detection of lead in ready to use henna paste and nutrients in fresh henna leaves and cultivated soils. Talanta 2019, 199, 203–211. [Google Scholar] [CrossRef]
- Mehta, S.; Rai, P.K.; Rai, D.K.; Rai, N.K.; Rai, A.K.; Bicanic, D.; Sharma, B.; Watal, G. LIBS-based detection of antioxidant elements in seeds of emblica officinalis. Food Biophys. 2010, 5, 186–192. [Google Scholar] [CrossRef]
- Rehan, I.; Muhammad, R.; Rehan, K.K.K.; Sultana, S. Quantitative analysis of shilajit using laser-induced breakdown spectroscopy and inductively coupled plasma/optical emission spectroscopy. J. Nutr. Food Sci. 2017, 7, 1–9. [Google Scholar] [CrossRef]
- Khumaeni, A.; Hartadi, B.S.; Wardaya, A.; Sugito, H.; Budi, W. Identification and analysis of major elements in indonesian herbal medicine using laser-induced plasma spectroscopy. Rasayan J. Chem. 2020, 12, 898–902. [Google Scholar] [CrossRef]
- Zivkovic, S.; Savovic, J.; Kuzmanovic, M.; Petrovic, J.; Momcilovic, M. Alternative analytical method for direct determination of Mn and Ba in peppermint tea based on laser induced breakdown spectroscopy. Microchem. J. 2018, 137, 410–417. [Google Scholar] [CrossRef]
- Yousif, M.A.M.; Supervisor, N.A.A.A. Characterization of Gum arabic Using Laser Induced Breakdown Spectroscopy LIBS. Ph.D. Thesis, Sudan University of Science and Technology, Khartoum, Sudan, 2017. [Google Scholar]
- Lui, S.L.; Godwal, Y.; Taschuk, M.T.; Tsui, Y.Y.; Fedosejevs, R. Detection of lead in water using laser-induced breakdown spectroscopy and laser-induced fluorescence. Anal. Chem. 2008, 80, 1995–2000. [Google Scholar] [CrossRef] [PubMed]
- Fortes, F.J.; Laserna, J.J. Characteristics of solid aerosols produced by optical catapulting studied by laser-induced breakdown spectroscopy. Appl. Surf. Sci. 2010, 256, 5924–5928. [Google Scholar] [CrossRef]
- Abdelhamid, M.; Fortes, F.J.; Harith, M.A.; Laserna, J.J. Analysis of explosive residues in human fingerprints using optical catapulting–laser-induced breakdown spectroscopy. J. Anal. At. Spectrom. 2011, 26, 1445–1450. [Google Scholar] [CrossRef]


| Herb | Chemometric Technique | Laser | Best Result | Ref. | ||
|---|---|---|---|---|---|---|
| Wavelength (nm) | Pulse Duration (ns) | Energy Used (mJ) | ||||
| Saffron | PCA | 1064 | 10 | 260 | / | [66] |
| B. balsamifera | PCA, PLS-DA | 1064 | 3 | 90 | / | [54] |
| Herbal medicine | PCA, ANN | 1064 | 5.82 | 100 | 99.89% | [67] |
| Artemisia annua | / | 532 | 6 | 200 | / | [65] |
| Artemisia annua | / | 1064 | 5.82 | 100 | DP-LIBS > SP-LIBS | [52] |
| Kudzu powder | ELM, SIMCA, K-NN, RF | 532 | 8 | 200 | 100% | [53] |
| Mentha haplocalyx | PCA, LS-SVM | 1064 | 3-5 | 400 | / | [68] |
| Ligusticum wallichii | MLR | 1064 | 5.82 | 100 | LOD = 15.7 µg/g | [69] |
| Panax notoginseng | PLS, SVM, Lasso, LS-SVM | 532 | 8 | 200 | / | [70] |
| Salvia miltiorrhiza | PCA, PSO-LSSVM, PSO-RF, PSO-KELM | 1064 | 5.82 | 100 | 94.87% | [71] |
| Salvia miltiorrhiza | RF | 532 | / | 110 | 96.19% | [72] |
| Nigella seeds (Kalonji) | / | 532 | 5 | 200 | / | [73] |
| Codonopsis pilosula | / | 1064 | 10 | / | / | [74] |
| Angelica pubescens Biserrata | ANN | 1064 | 5.82 | 100 | / | [75] |
| Astragalus | / | 1064 | 8 | 15 | / | [76] |
| Cinnamon | / | 266 | 8 | 50 | / | [77] |
| Herb | Chemometric Technique | Laser | Best Result | Ref. | ||
|---|---|---|---|---|---|---|
| Wavelength (nm) | Pulse Duration (ns) | Energy Used (mJ) | ||||
| Sage (herb) | PCA, BP-ANN | 1064 | 4 | 400 | / | [58] |
| Rheum. Officinale | / | 1064 | 10 | 15 | R2 = 0.996 | [80] |
| Species of herbs | / | 1064 | 8 | 100 | / | [81] |
| Allium cepa (Onion) | / | 532 | / | / | / | [82] |
| Medicinal plant leaves | BPM | 1064 | 8 | 200 | 7 torr | [83] |
| Antimalarial herbal plants | SVM, LDA, K-NN | 445 | / | / | SVM = 100%, KNN = 100% | [84] |
| Moringa Oleifera seed | / | 266 | 8 | 30 | / | [85] |
| Moringa Oleifera | / | 266 | 8 | 30 | / | [85] |
| Miracle Moringa tree leaves | / | 266 | 8 | 50 | / | [86] |
| Moringa Oleifera | / | / | / | 175 | / | [87] |
| Thymus Daenensis | Cluster analysis | 200–1100 | / | / | / | [88] |
| Ficus religiosa | / | / | / | / | / | [89] |
| Poaceae Species | / | 532 | 5 | / | / | [90] |
| Root tissues of vicia faba | / | 266, 1064 | / | 5, 100 | / | [91] |
| Turmeric | / | 532 | 4 | 425 | / | [92] |
| Rhatany root | / | / | 8 | 50 | / | [93] |
| Zanthoxylum Armatum | / | 532, 1064 | 5 | 200, 400 | / | [94] |
| Rhododendron leaves | / | 1064 | 6 | / | R2 = 99.7% | [57] |
| Medicinal plant samples | PLS-DA | 1064 | 10 | 17 | / | [95] |
| Ocimum species | PCA | 532 | 4 | 425 | / | [56] |
| Mixtures of herbal medicines | PCA | 1064 | 10 | 17 | / | [96] |
| Mint (pudina) | BPM, SBLPM | 532 | 5 | / | / | [97] |
| Herb | Chemometric Technique | Laser | Best Result | Ref. | ||
|---|---|---|---|---|---|---|
| Wavelength (nm) | Pulse Duration (ns) | Energy Used (mJ) | ||||
| Honey | Algorithm based on chaotic parameters | / | 6 | 270 | >90% | [64] |
| Honey | PLS, PLS-DA | 1064 | 8 | 50 | 100% | [98] |
| Honey | LDA, ERT | 1064 | 4 | 70 | >90% | [99] |
| Honey | LDA, RFC | 1064 | 5 | 70 | >90% | [100] |
| Honey | PCA, SVM, LDA | 532 | / | 30 | 99.7% | [101] |
| Honey | PLSR, GA, VIP, SR | 532 | / | 80 | RMSE = 8.9% | [61] |
| Dates | / | / | 8 | 15–18 | / | [11] |
| Dates | / | 532 | 5 | / | / | [102] |
| Indonesian herbal medicine | / | 1064 | / | 150 | / | [108] |
| Rhizomes of black turmeric | / | 266 | 8 | 35 | / | [104] |
| Fresh henna leaves | / | 532 | 5 | / | 16.0 ± 0.2 mg/Kg | [105] |
| Emblica Officinalis seeds | / | / | / | 175 | 47.09% (p < 0.001) | [106] |
| Shilajit | / | 1064 | / | 100 | / | [107] |
| Peppermint tea | / | / | / | 155 | 99.7% | [109] |
| Tea samples | / | 266 | 8 | 30 | / | [10] |
Publisher’s Note: MDPI stays neutral with regard to jurisdictional claims in published maps and institutional affiliations. |
© 2022 by the authors. Licensee MDPI, Basel, Switzerland. This article is an open access article distributed under the terms and conditions of the Creative Commons Attribution (CC BY) license (https://creativecommons.org/licenses/by/4.0/).
Share and Cite
Kabir, M.H.; Guindo, M.L.; Chen, R.; Sanaeifar, A.; Liu, F. Application of Laser-Induced Breakdown Spectroscopy and Chemometrics for the Quality Evaluation of Foods with Medicinal Properties: A Review. Foods 2022, 11, 2051. https://doi.org/10.3390/foods11142051
Kabir MH, Guindo ML, Chen R, Sanaeifar A, Liu F. Application of Laser-Induced Breakdown Spectroscopy and Chemometrics for the Quality Evaluation of Foods with Medicinal Properties: A Review. Foods. 2022; 11(14):2051. https://doi.org/10.3390/foods11142051
Chicago/Turabian StyleKabir, Muhammad Hilal, Mahamed Lamine Guindo, Rongqin Chen, Alireza Sanaeifar, and Fei Liu. 2022. "Application of Laser-Induced Breakdown Spectroscopy and Chemometrics for the Quality Evaluation of Foods with Medicinal Properties: A Review" Foods 11, no. 14: 2051. https://doi.org/10.3390/foods11142051
APA StyleKabir, M. H., Guindo, M. L., Chen, R., Sanaeifar, A., & Liu, F. (2022). Application of Laser-Induced Breakdown Spectroscopy and Chemometrics for the Quality Evaluation of Foods with Medicinal Properties: A Review. Foods, 11(14), 2051. https://doi.org/10.3390/foods11142051