
Encapsulation of Caffeic Acid in Carob Bean Flour and Whey Protein-Based Nanofibers via Electrospinning


Abstract
: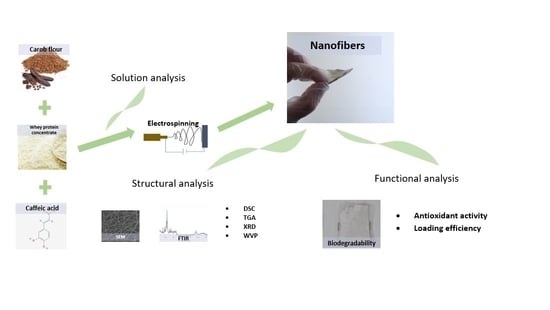
1. Introduction
2. Materials and Methods
2.1. Materials
2.2. Solution Preparation
2.3. Solution Properties
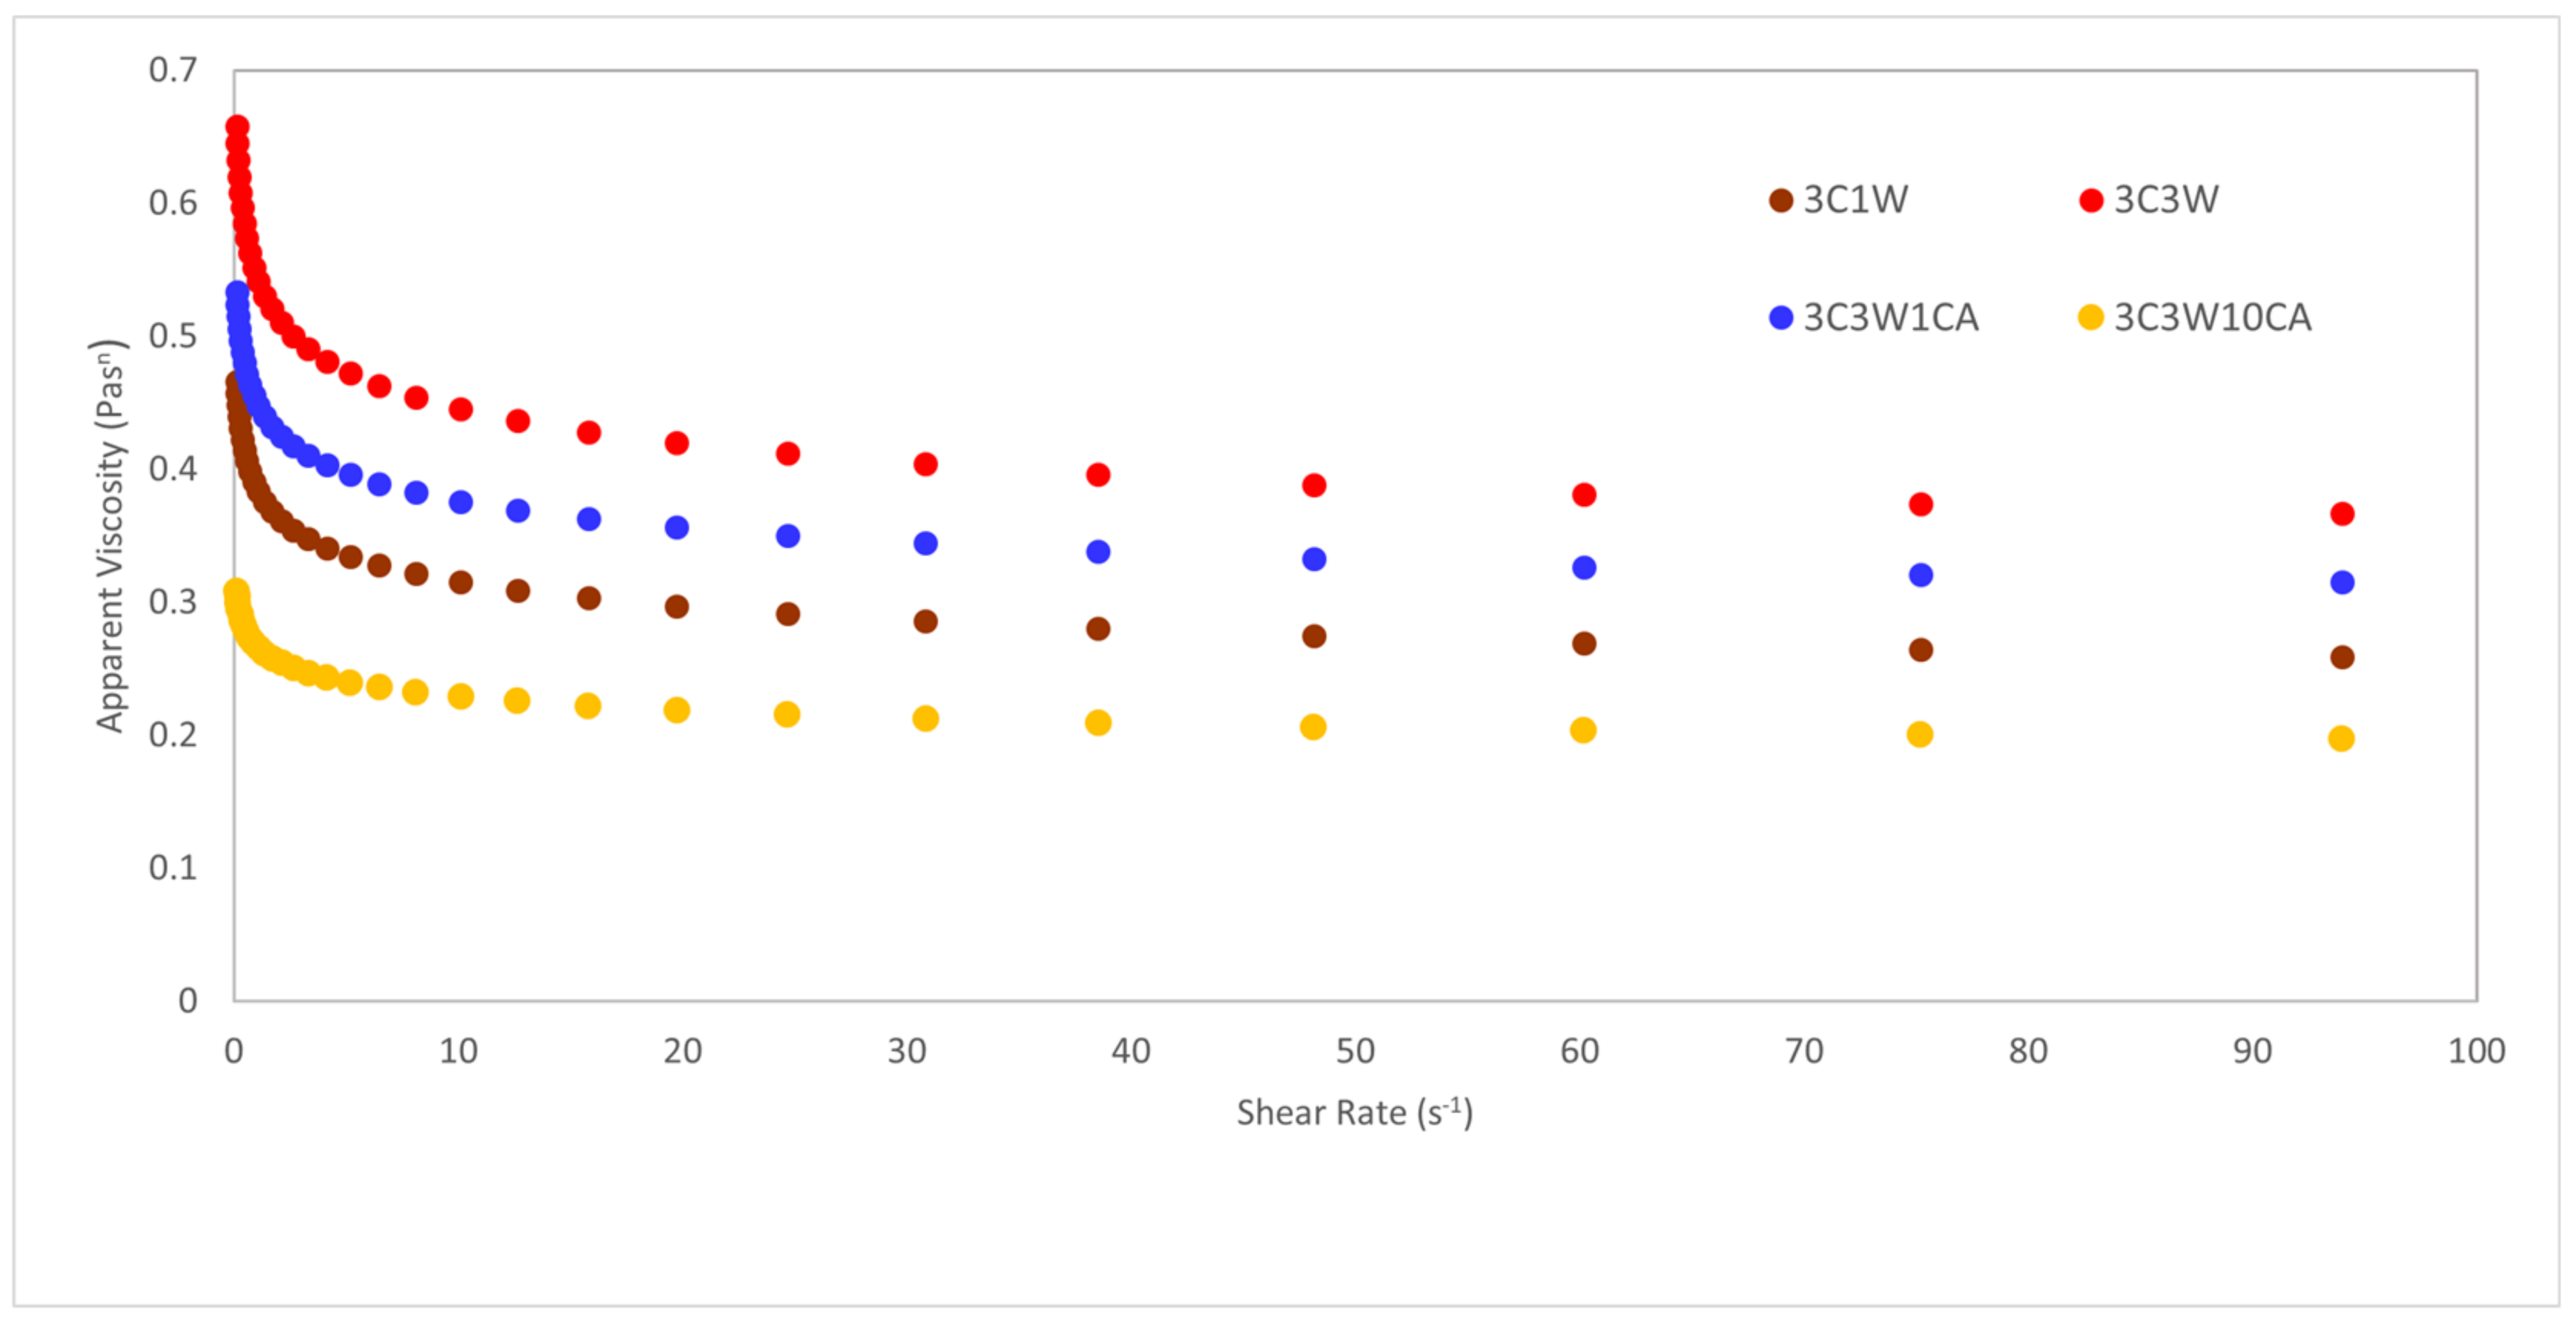
2.3.1. Rheological Properties
2.3.2. Electrical Conductivity
2.4. Electrospinning Process
2.5. Characterization of Films
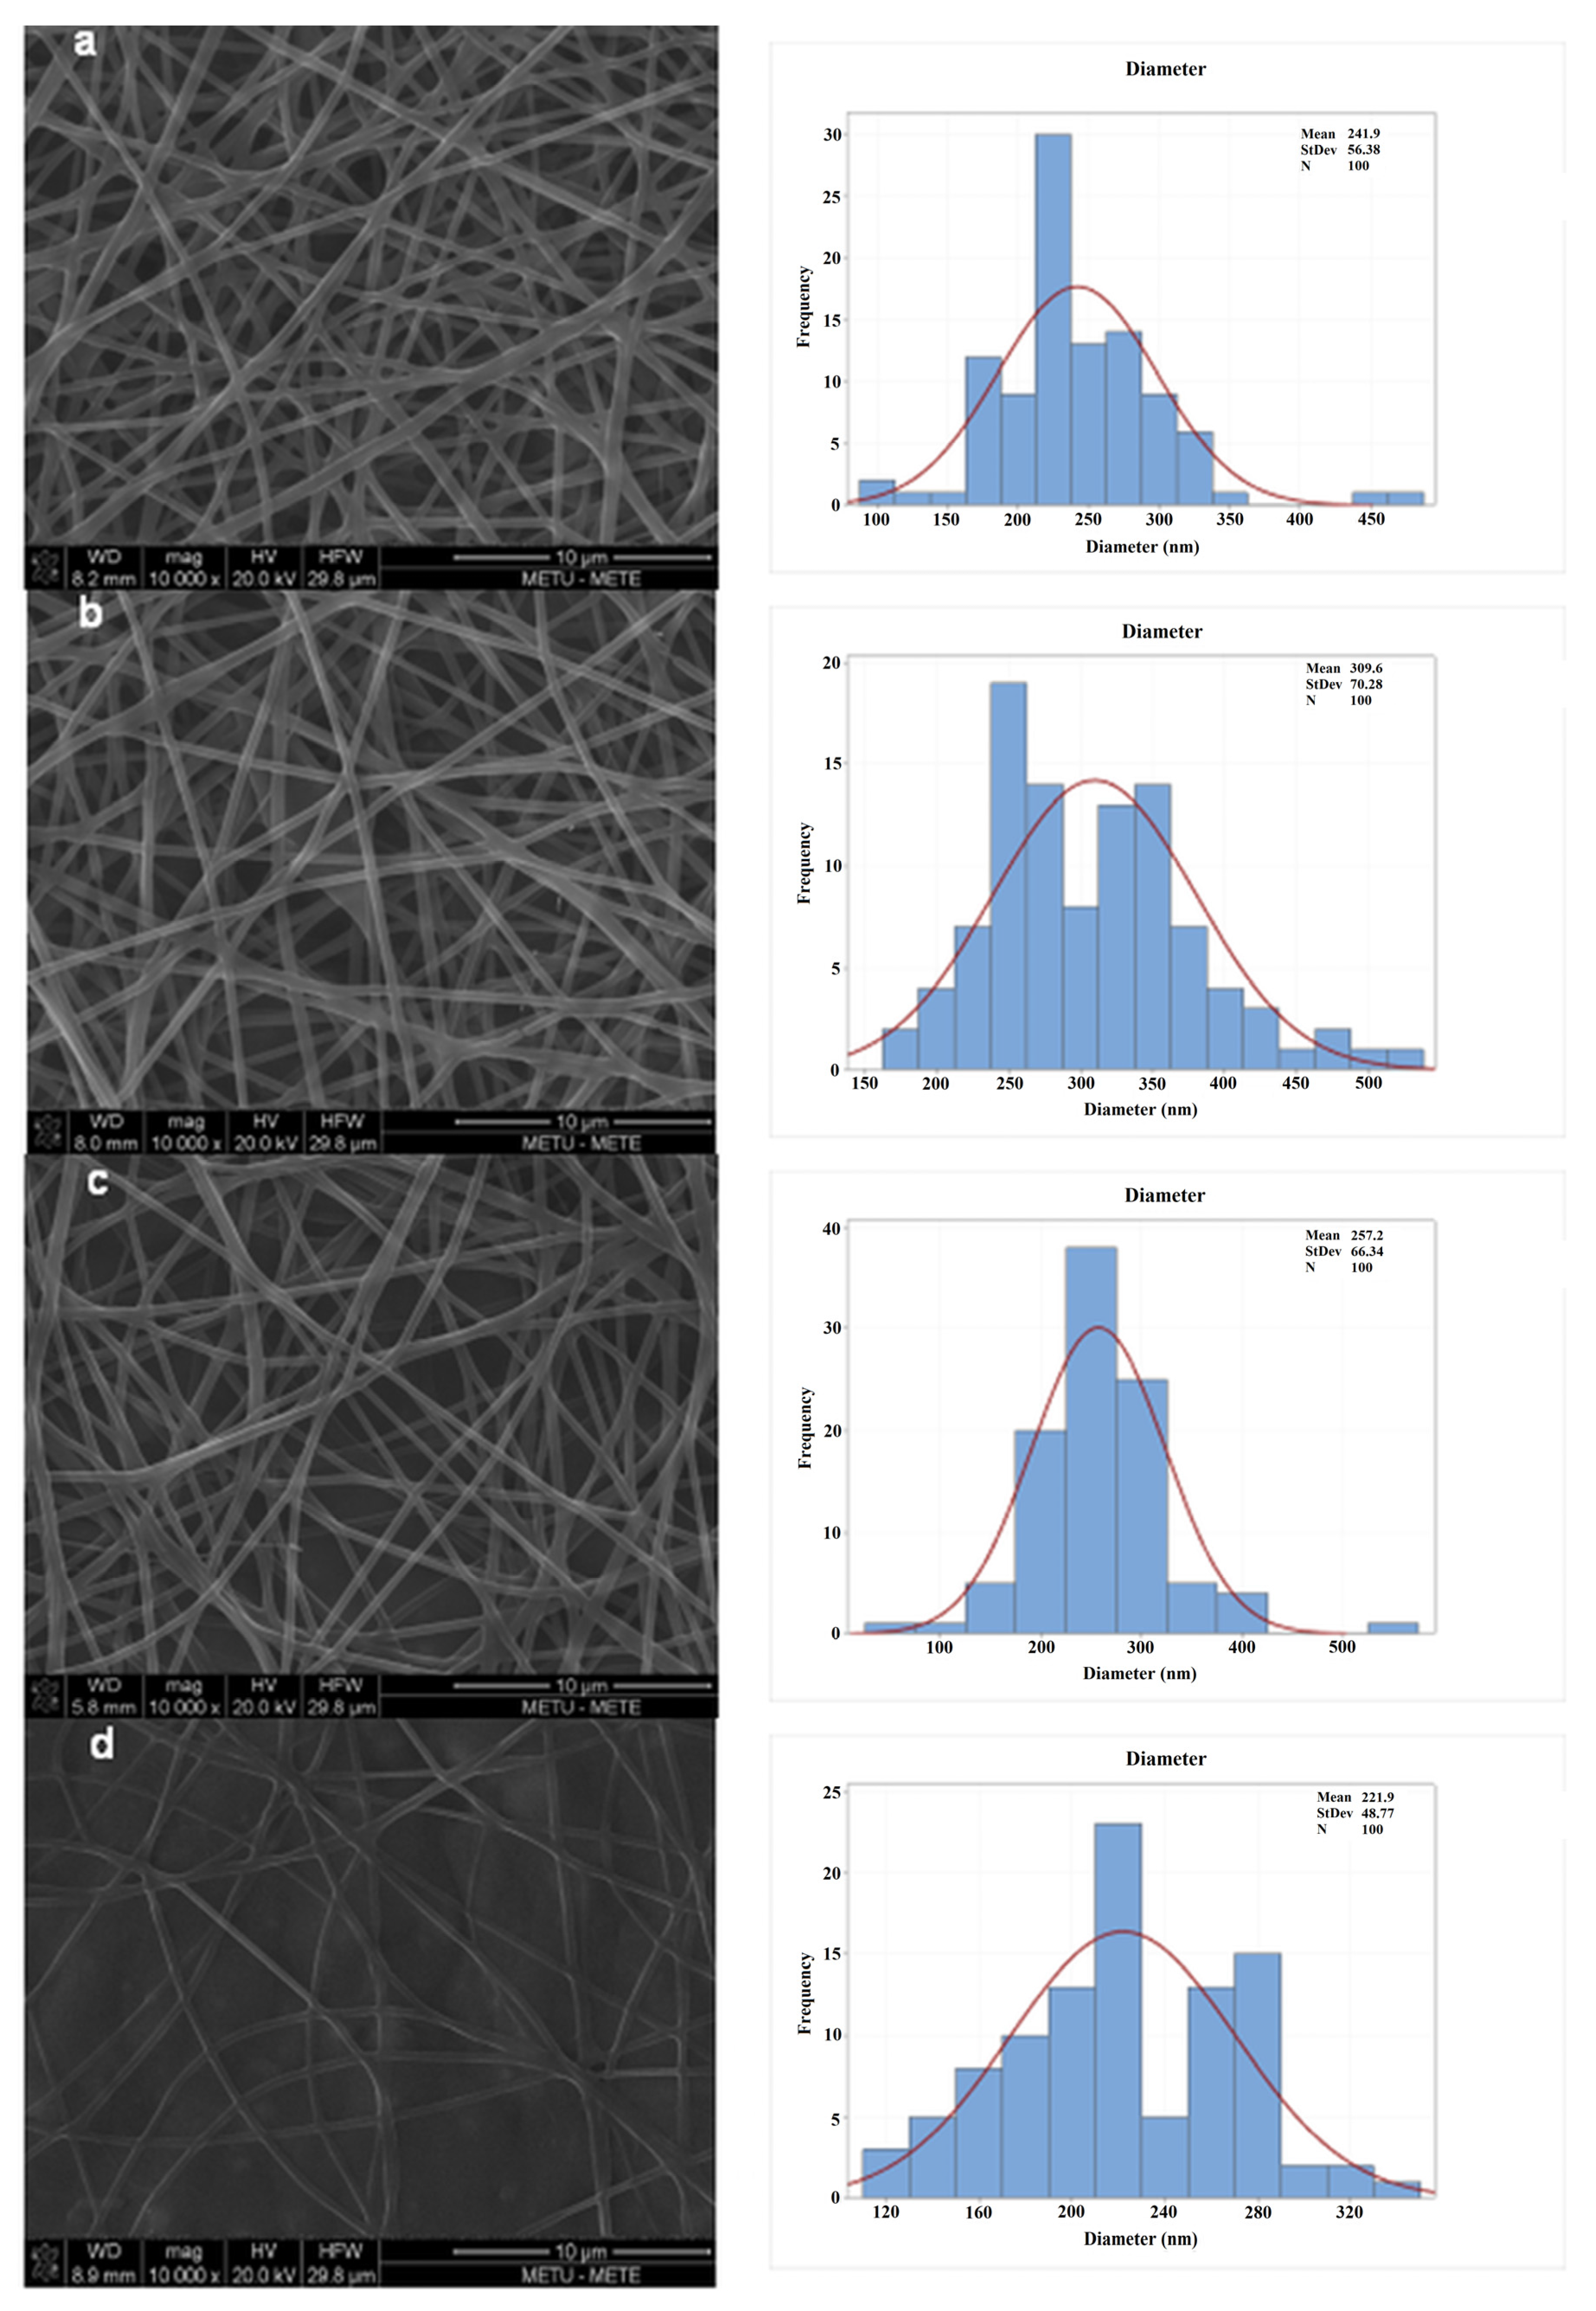
2.5.1. Morphological Analysis
2.5.2. Differential Scanning Calorimetry
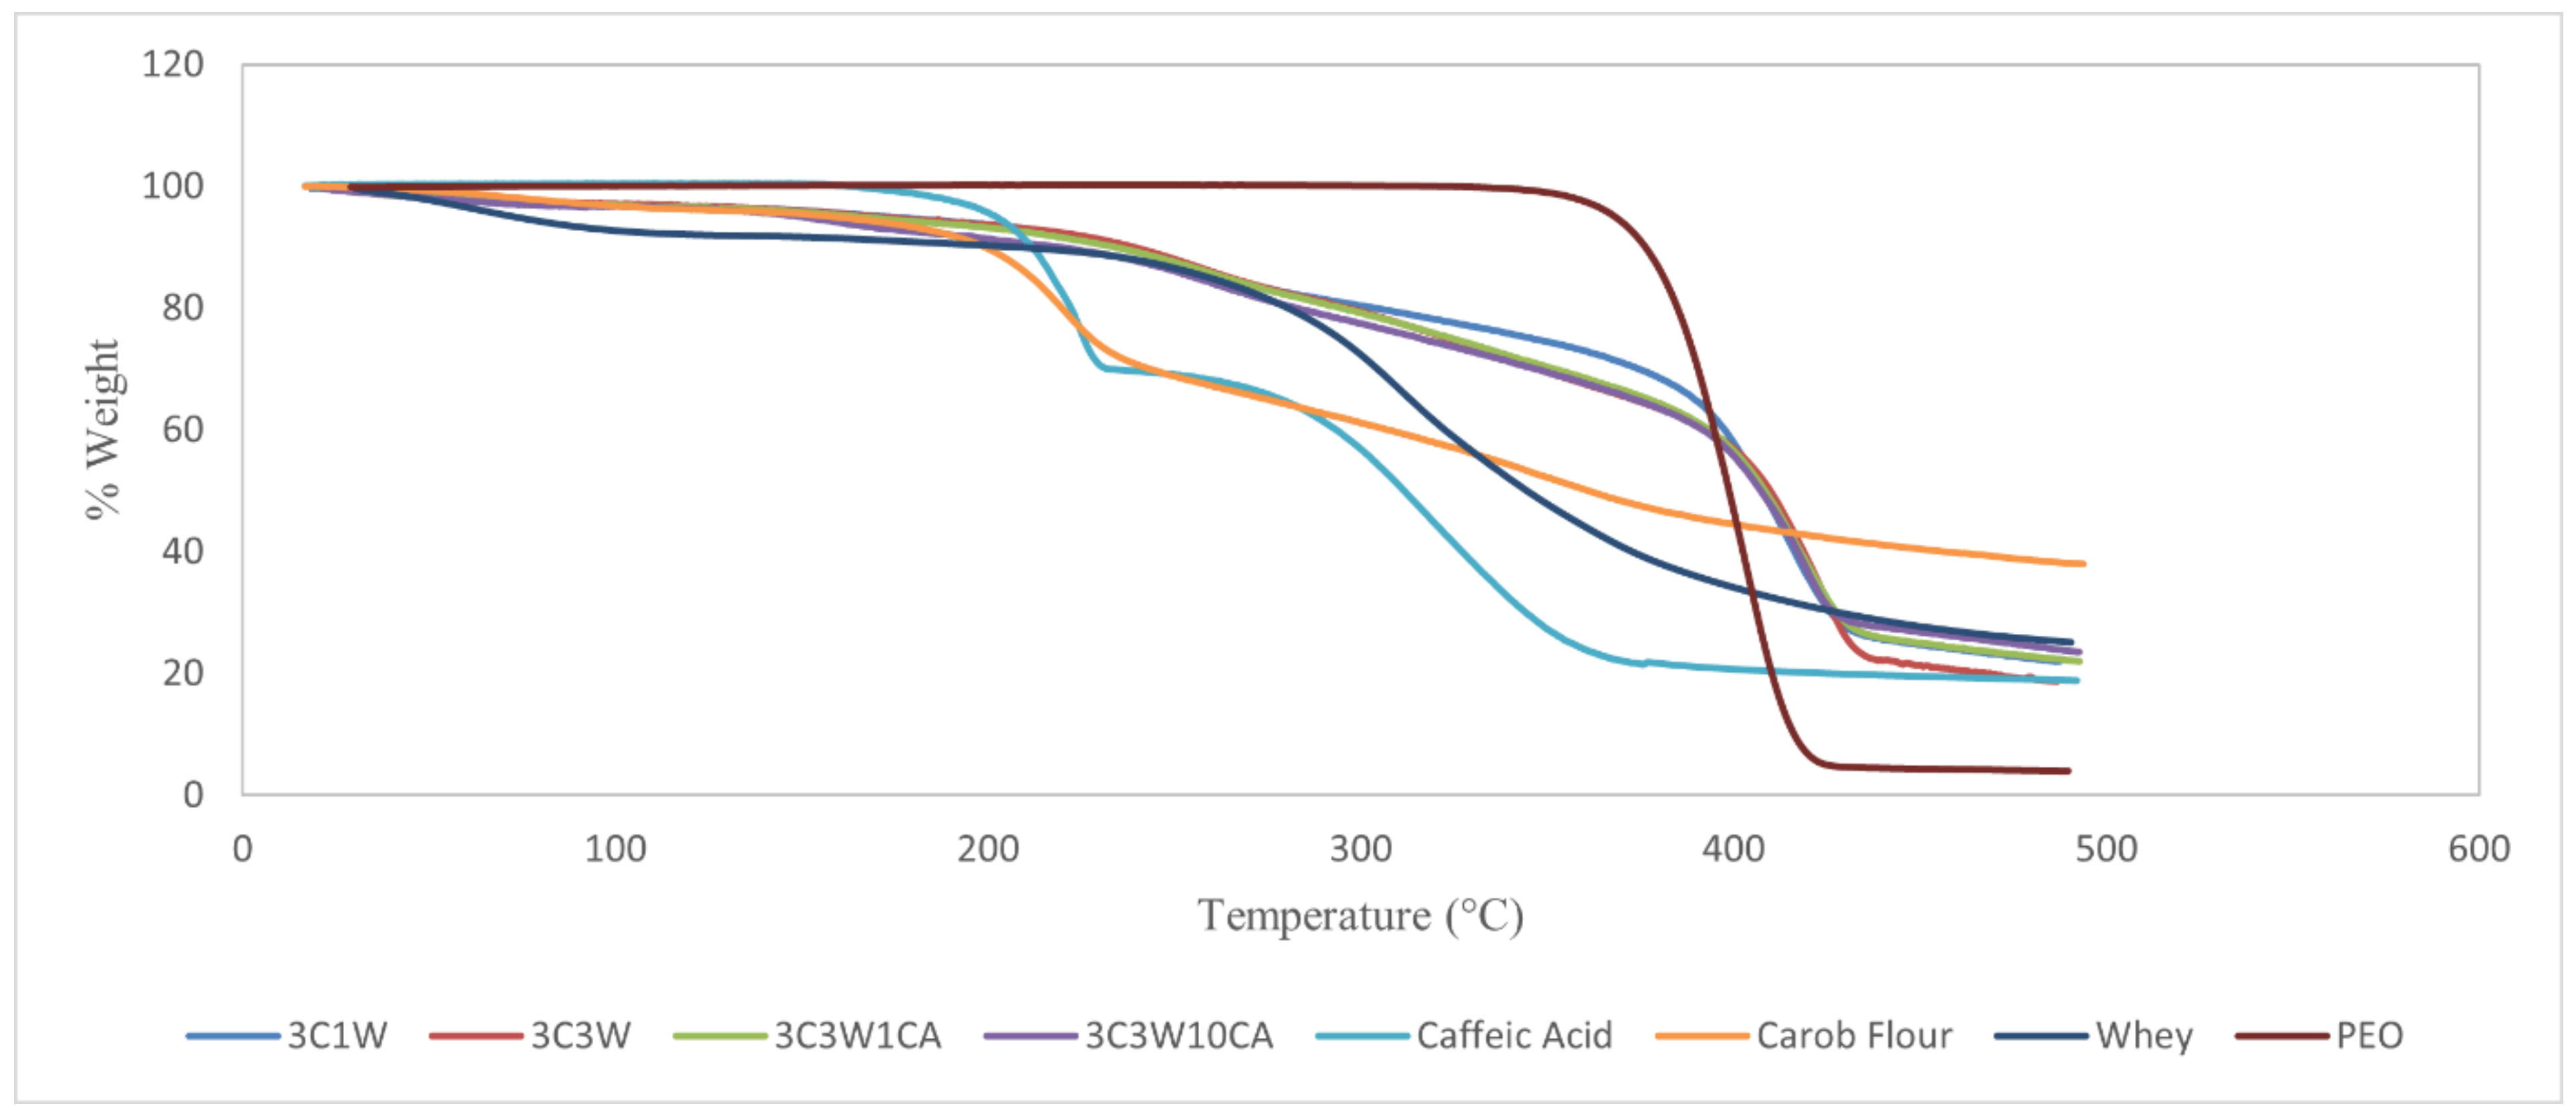
2.5.3. Thermogravimetric Analysis
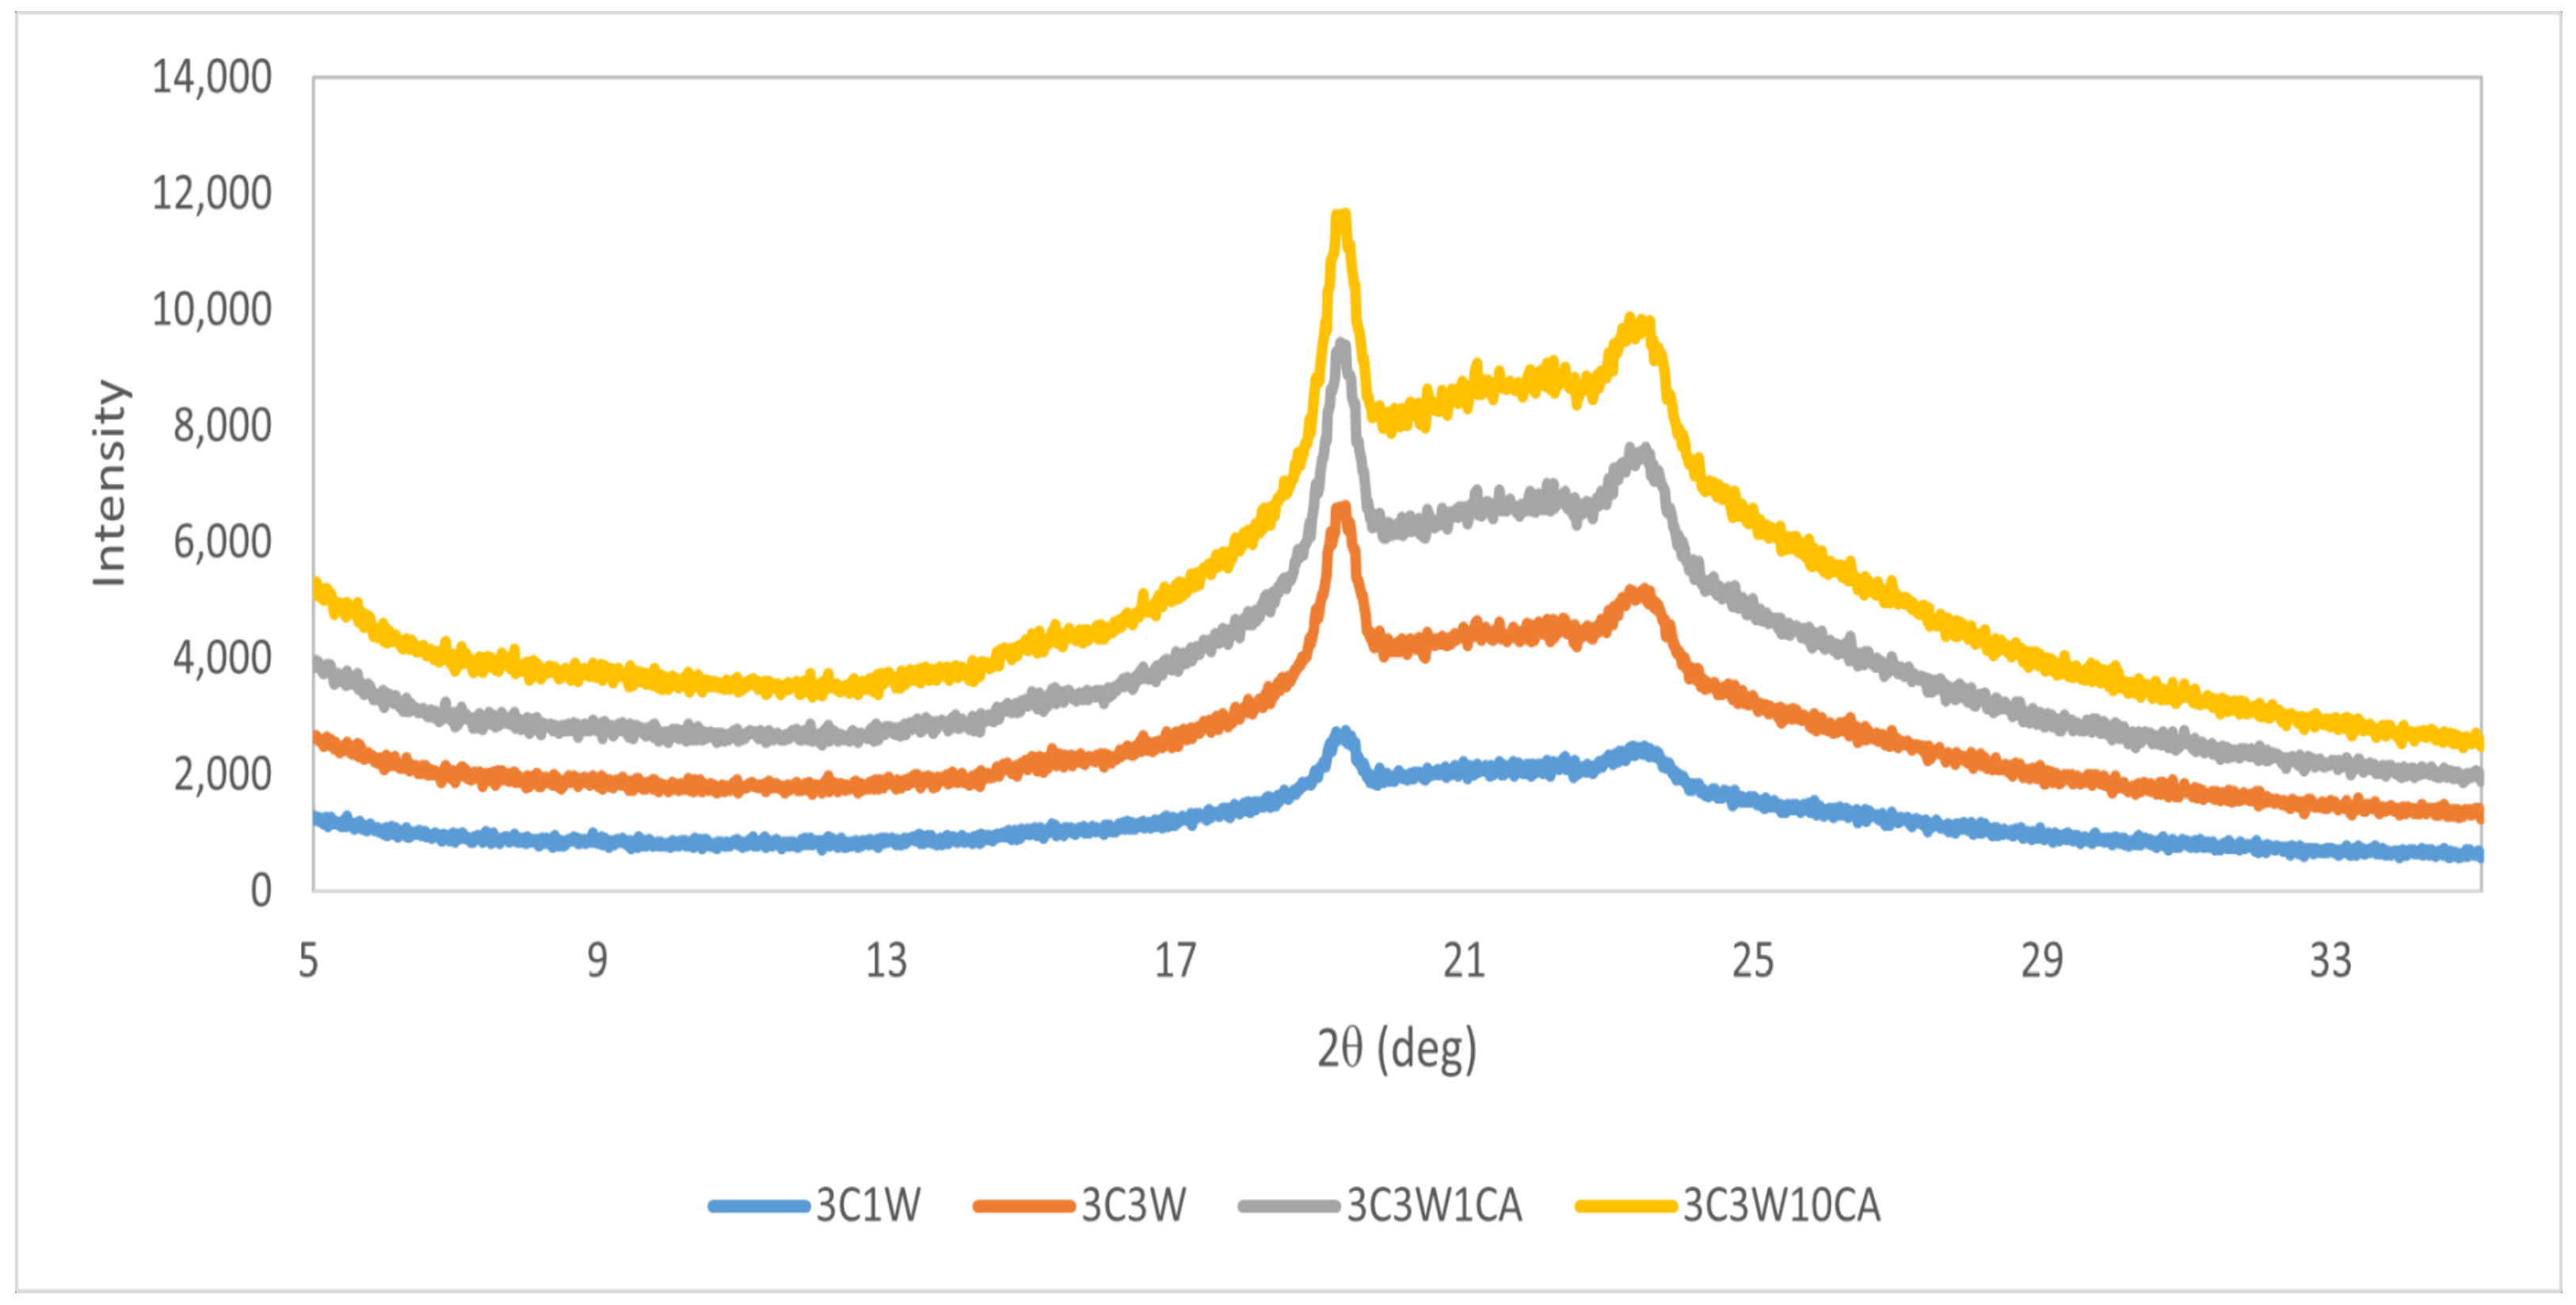
2.5.4. X-ray Diffraction
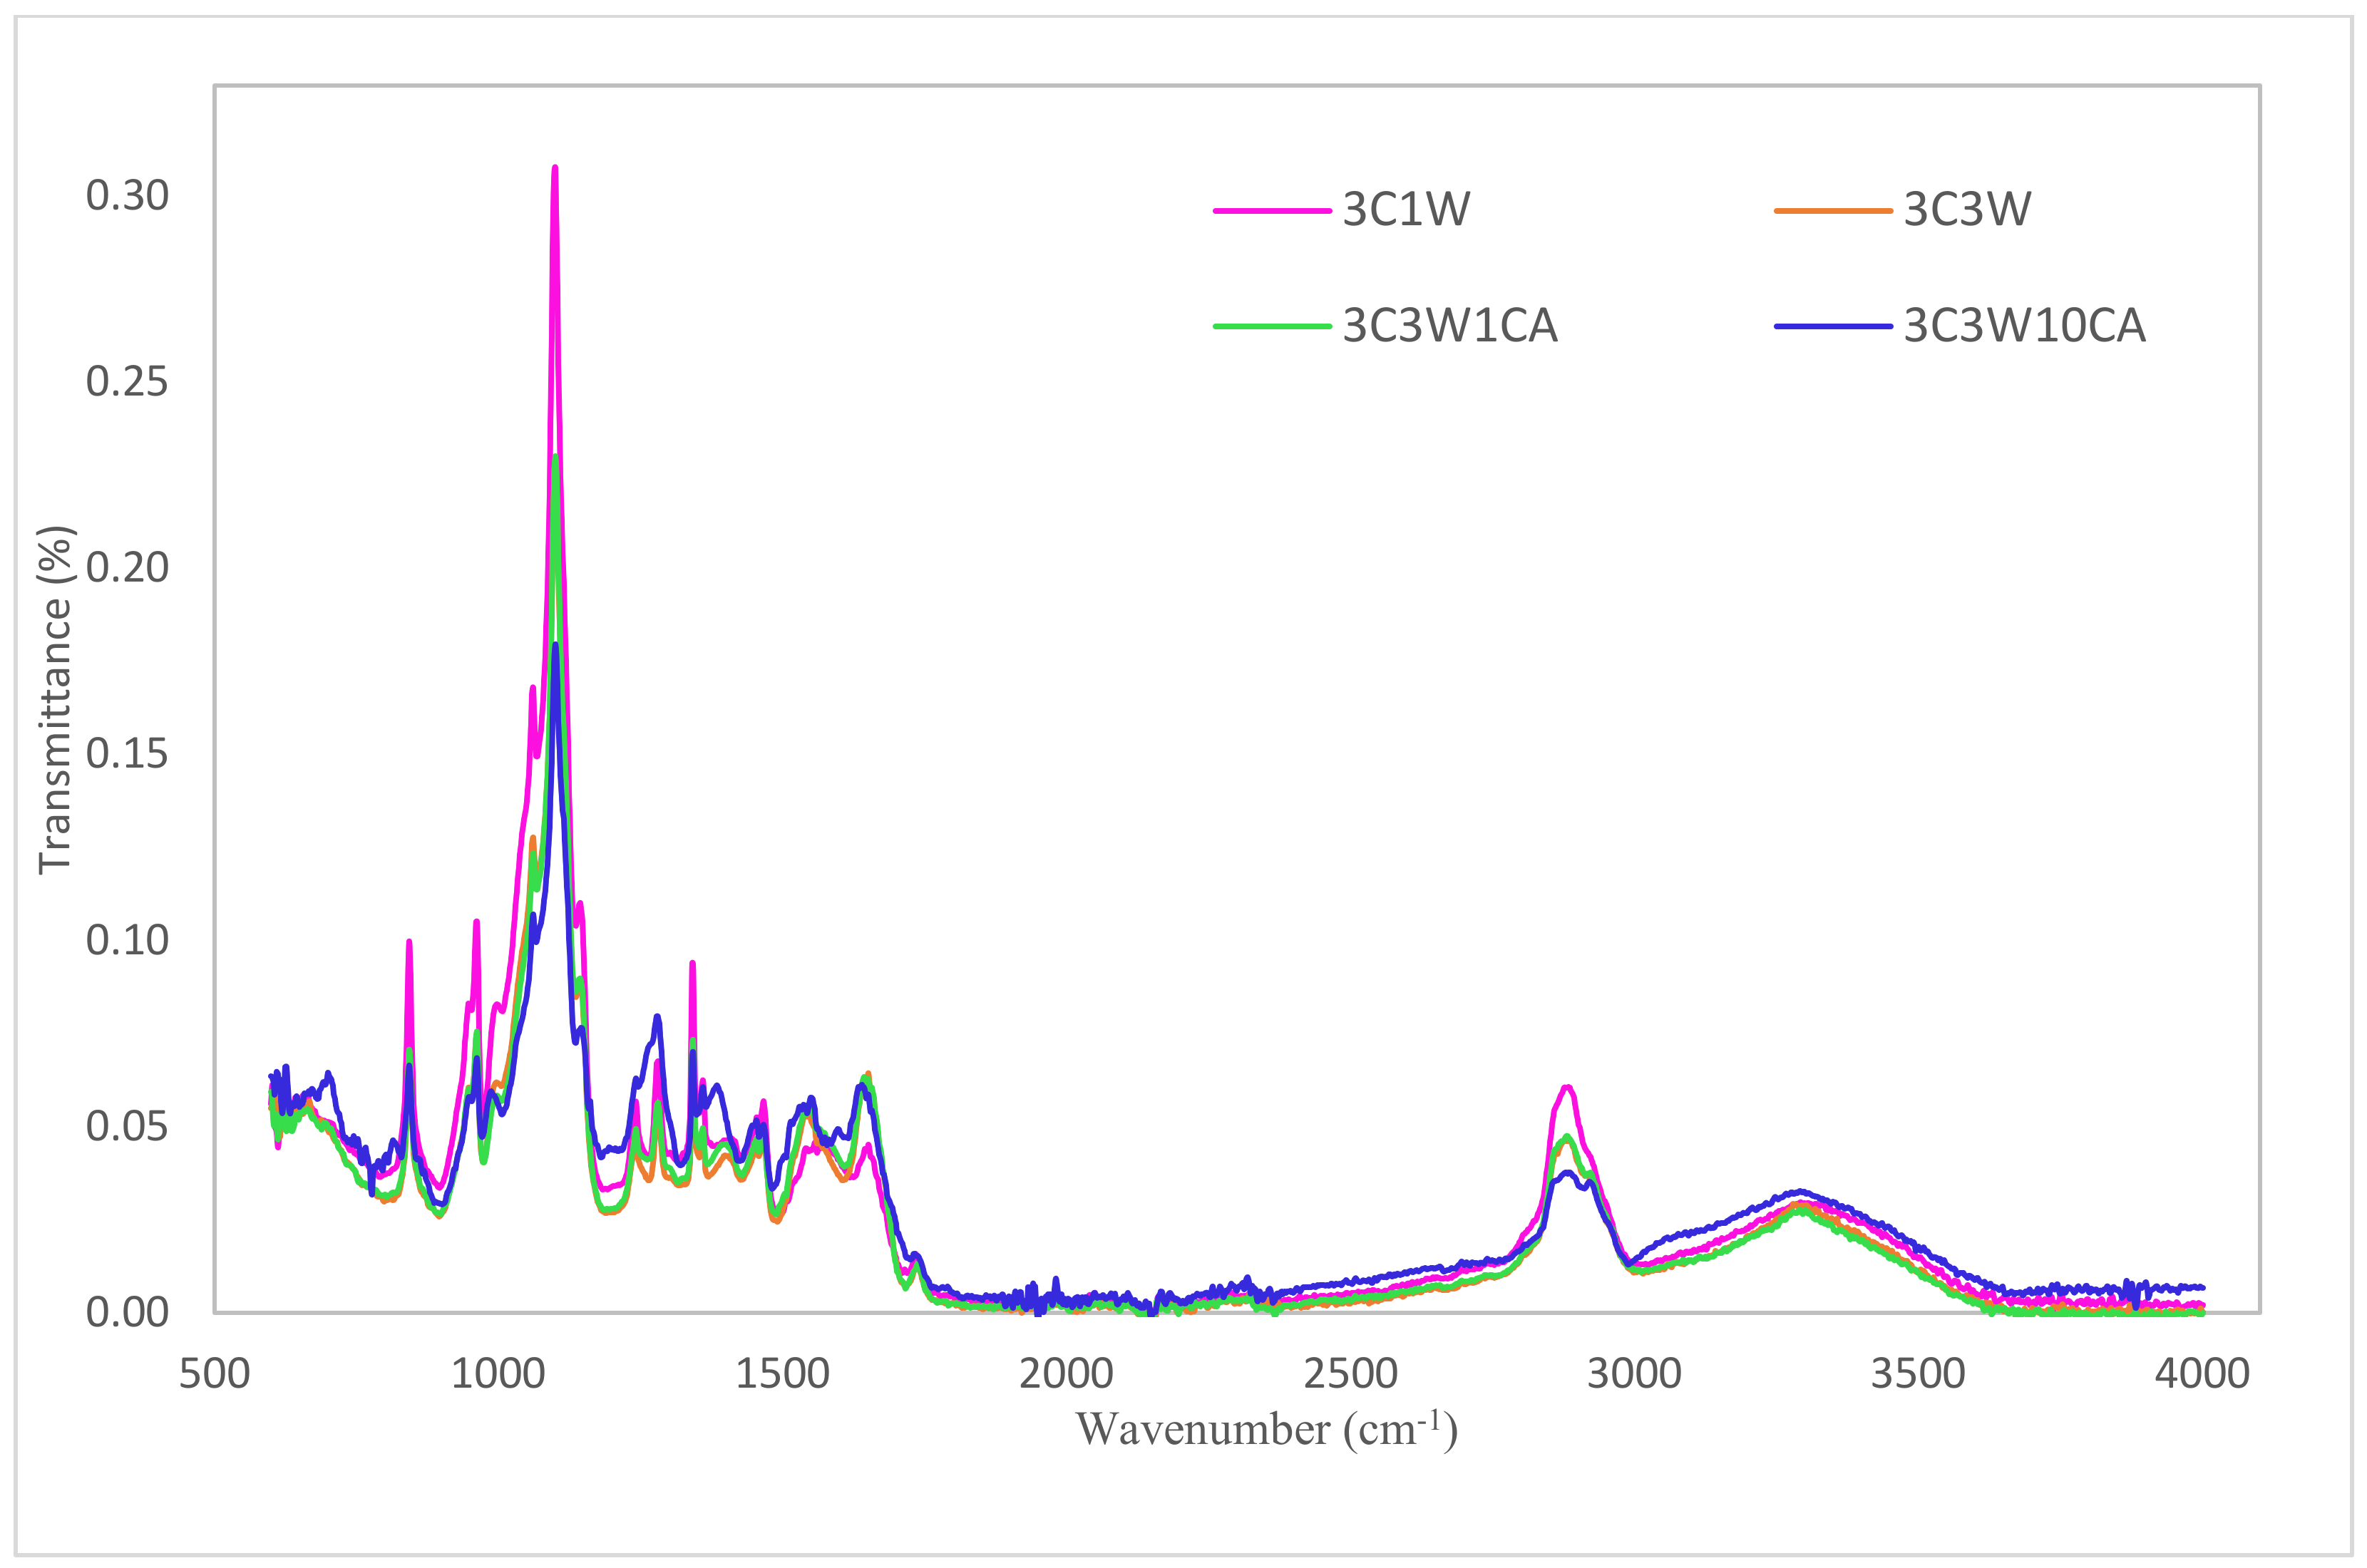
2.5.5. Fourier Transform Infrared Analysis
2.5.6. Water Vapor Permeability
- WVP: water vapor permeability (g·m−1 ·s−1 ·Pa−1);
- ΔX: film thickness (m);
- WVTR: water vapor transmission rate (g·m−2·s−1);
- Pwi: partial pressure of the water vapor inside the cup (Pa);
- Pwo: partial pressure of the water vapor outside the cup (Pa).
2.5.7. Antioxidant Activity
- AA: antioxidant activity of fibers;
- Acontrol: absorbance of the control sample at 517 nm;
- Asample: absorbance of the fibers at 517 nm.
2.5.8. Loading Efficiency
2.5.9. Biodegradability
2.6. Statistical Analysis
3. Results and Discussion
3.1. Solution Properties and Their Relation to Fiber Morphology
3.2. Differential Scanning Calorimetry
3.3. Thermogravimetric Analysis
3.4. X-ray Diffraction
3.5. Fourier Transform Infrared Analysis
3.6. Water Vapor Permeability
3.7. Loading Efficiency (LE%) and Antioxidant Activity (AA%)
3.8. Biodegradability
4. Conclusions
Author Contributions
Funding
Institutional Review Board Statement
Informed Consent Statement
Data Availability Statement
Conflicts of Interest
References
- Celebioglu, A.; Uyar, T. Design of Polymer-Free Vitamin-A Acetate/Cyclodextrin Nanofibrous Webs: Antioxidant and Fast-Dissolving Properties. Food Funct. 2020, 11, 7626–7637. [Google Scholar] [CrossRef] [PubMed]
- Vilchez, A.; Acevedo, F.; Cea, M.; Seeger, M.; Navia, R. Applications of Electrospun Nanofibers with Antioxidant Properties: A Review. Nanomaterials 2020, 10, 175. [Google Scholar] [CrossRef] [PubMed] [Green Version]
- Rani, P.; Yu, X.; Liu, H.; Li, K.; He, Y.; Tian, H.; Kumar, R. Material, Antibacterial and Anticancer Properties of Natural Polyphenols Incorporated Soy Protein Isolate: A Review. Eur. Polym. J. 2021, 152, 110494. [Google Scholar] [CrossRef]
- Guan, X.; Li, L.; Li, S.; Liu, J.; Huang, K. A Food-Grade Continuous Electrospun Fiber of Hordein/Chitosan with Water Resistance. Food Biosci. 2020, 37, 100687. [Google Scholar] [CrossRef]
- Zhang, C.; Li, Y.; Wang, P.; Zhang, H. Electrospinning of Nanofibers: Potentials and Perspectives for Active Food Packaging. Compr. Rev. Food Sci. Food Saf. 2020, 19, 479–502. [Google Scholar] [CrossRef] [PubMed]
- Rangaraj, V.M.; Rambabu, K.; Banat, F.; Mittal, V. Natural Antioxidants-Based Edible Active Food Packaging: An Overview of Current Advancements. Food Biosci. 2021, 43, 101251. [Google Scholar] [CrossRef]
- Shao, P.; Niu, B.; Chen, H.; Sun, P. Fabrication and Characterization of Tea Polyphenols Loaded Pullulan-CMC Electrospun Nanofiber for Fruit Preservation. Int. J. Biol. Macromol. 2018, 107, 1908–1914. [Google Scholar] [CrossRef]
- Alehosseini, A.; Gómez-mascaraque, L.G.; Ghorani, B.; López-rubio, A. Stabilization of a Saffron Extract through Its Encapsulation within Electrospun/Electrosprayed Zein Structures. LWT Food Sci. Technol. 2019, 113, 108280. [Google Scholar] [CrossRef]
- Aslaner, G.; Sumnu, G.; Sahin, S. Encapsulation of Grape Seed Extract in Rye Flour and Whey Protein–Based Electrospun Nanofibers. Food Bioprocess Technol. 2021, 14, 1118–1131. [Google Scholar] [CrossRef]
- Aydogdu, A.; Yildiz, E.; Aydogdu, Y.; Sumnu, G.; Sahin, S.; Ayhan, Z. Food Hydrocolloids Enhancing Oxidative Stability of Walnuts by Using Gallic Acid Loaded Lentil Flour Based Electrospun Nanofibers as Active Packaging Material. Food Hydrocoll. 2019, 95, 245–255. [Google Scholar] [CrossRef]
- Luzi, F.; Torre, L.; Puglia, D. Antioxidant Packaging Films Based on Ethylene Vinyl Alcohol Copolymer (EVOH) and Caffeic Acid. Molecules 2020, 25, 3953. [Google Scholar] [CrossRef] [PubMed]
- Chen, H.; Wang, J.; Cheng, Y.; Wang, C.; Liu, H.; Bian, H.; Pan, Y.; Sun, J.; Han, W. Application of Protein-Based Films and Coatings for Food Packaging: A Review. Polymers 2019, 11, 2039. [Google Scholar] [CrossRef] [PubMed] [Green Version]
- Oguz, S.; Tam, N.; Aydogdu, A.; Sumnu, G.; Sahin, S. Development of Novel Pea Flour-Based Nanofibres by Electrospinning Method. Int. J. Food Sci. Technol. 2018, 53, 1269–1277. [Google Scholar] [CrossRef]
- Tam, N.; Oguz, S.; Aydogdu, A.; Sumnu, G.; Sahin, S. Influence of Solution Properties and PH on the Fabrication of Electrospun Lentil Flour/HPMC Blend Nanofibers. Food Res. Int. 2017, 102, 616–624. [Google Scholar] [CrossRef] [PubMed]
- Uygun, E.; Yildiz, E.; Sumnu, G.; Sahin, S. Microwave Pretreatment for the Improvement of Physicochemical Properties of Carob Flour and Rice Starch–Based Electrospun Nanofilms. Food Bioprocess Technol. 2020, 13, 838–850. [Google Scholar] [CrossRef]
- Woranuch, S.; Pangon, A.; Puagsuntia, K.; Subjalearndee, N.; Intasanta, V. Rice Flour-Based Nanostructures via a Water-Based System: Transformation from Powder to Electrospun Nanofibers under Hydrogen-Bonding Induced Viscosity, Crystallinity and Improved Mechanical Property. RSC Adv. 2017, 7, 19960–19966. [Google Scholar] [CrossRef] [Green Version]
- Papaefstathiou, E.; Agapiou, A.; Giannopoulos, S.; Kokkinofta, R. Nutritional Characterization of Carobs and Traditional Carob Products. Food Sci. Nutr. 2018, 6, 2151–2161. [Google Scholar] [CrossRef]
- Zhu, B.J.; Zayed, M.Z.; Zhu, H.X.; Zhao, J.; Li, S.P. Functional Polysaccharides of Carob Fruit: A Review. Chin. Med. 2019, 14, 40. [Google Scholar] [CrossRef] [Green Version]
- Muthu, T.S.; Kumar, K.S.; Rajini, N.; Siengchin, S.; Ayrilmis, N.; Rajulu, A.V. A Comprehensive Review of Electrospun Nanofibers: Food and Packaging Perspective. Compos. Part B 2019, 175, 107074. [Google Scholar] [CrossRef]
- Aman, M.; Ramazani, S.; Rostami, M.; Raeisi, M.; Tabibiazar, M.; Ghorbani, M. Food Hydrocolloids Fabrication of Food-Grade Nano Fi Bers of Whey Protein Isolate—Guar Gum Using the Electrospinning Method. Food Hydrocoll. 2019, 90, 99–104. [Google Scholar] [CrossRef]
- Kutzli, I.; Gibis, M.; Baier, S.K.; Weiss, J. Food Hydrocolloids Electrospinning of Whey and Soy Protein Mixed with Maltodextrin—Influence of Protein Type and Ratio on the Production and Morphology of Fibers. Food Hydrocoll. 2019, 93, 206–214. [Google Scholar] [CrossRef]
- Colín-Orozco, J.; Zapata-Torres, M.; Rodríguez-Gattorno, G.; Pedroza-Islas, R. Properties of Poly (Ethylene Oxide)/Whey Protein Isolate Nanofibers Prepared by Electrospinning. Food Biophys. 2015, 10, 134–144. [Google Scholar] [CrossRef]
- Vega-Lugo, A.C.; Lim, L.T. Effects of Poly(Ethylene Oxide) and PH on the Electrospinning of Whey Protein Isolate. J. Polym. Sci. Part B Polym. Phys. 2012, 50, 1188–1197. [Google Scholar] [CrossRef]
- Kuntzler, S.G.; Costa, J.A.V.; de Morais, M.G. Development of Electrospun Nanofibers Containing Chitosan/PEO Blend and Phenolic Compounds with Antibacterial Activity. Int. J. Biol. Macromol. 2018, 117, 800–806. [Google Scholar] [CrossRef] [PubMed]
- Neo, Y.P.; Ray, S.; Jin, J.; Gizdavic-Nikolaidis, M.; Nieuwoudt, M.K.; Liu, D.; Quek, S.Y. Encapsulation of Food Grade Antioxidant in Natural Biopolymer by Electrospinning Technique: A Physicochemical Study Based on Zein-Gallic Acid System. Food Chem. 2013, 136, 1013–1021. [Google Scholar] [CrossRef]
- Tatlisu, N.B.; Yilmaz, M.T.; Arici, M. Fabrication and Characterization of Thymol-Loaded Nanofiber Mats as a Novel Antimould Surface Material for Coating Cheese Surface. Food Packag. Shelf Life 2019, 21, 100347. [Google Scholar] [CrossRef]
- Yildiz, E.; Sumnu, G.; Kahyaoglu, L.N. Monitoring Freshness of Chicken Breast by Using Natural Halochromic Curcumin Loaded Chitosan/PEO Nanofibers as an Intelligent Package. Int. J. Biol. Macromol. 2021, 170, 437–446. [Google Scholar] [CrossRef]
- Aydogdu, A.; Sumnu, G.; Sahin, S. Fabrication of Gallic Acid Loaded Hydroxypropyl Methylcellulose Nanofibers by Electrospinning Technique as Active Packaging Material. Carbohydr. Polym. 2019, 208, 241–250. [Google Scholar] [CrossRef]
- Da Silva Filipini, G.; Romani, V.P.; Guimarães Martins, V. Biodegradable and Active-Intelligent Films Based on Methylcellulose and Jambolão (Syzygium cumini) Skins Extract for Food Packaging. Food Hydrocoll. 2020, 109, 106139. [Google Scholar] [CrossRef]
- Liu, Y.; Liang, X.; Wang, S.; Qin, W.; Zhang, Q. Electrospun Antimicrobial Polylactic Acid/Tea Polyphenol Nanofibers for Food-Packaging Applications. Polymers 2018, 10, 561. [Google Scholar] [CrossRef] [Green Version]
- Mohammadi, M.A. Application of Electrospinning Technique in Development of Intelligent Food Packaging: A Short Review of Recent Trends. Food Sci. Nutr. 2020, 8, 4656–4665. [Google Scholar] [CrossRef] [PubMed]
- Ashraf, R.; Sofi, H.S.; Malik, A.; Beigh, M.A.; Hamid, R.; Sheikh, F.A. Recent Trends in the Fabrication of Starch Nanofibers: Electrospinning and Non-Electrospinning Routes and Their Applications in Biotechnology. Appl. Biochem. Biotechnol. 2019, 187, 47–74. [Google Scholar] [CrossRef] [PubMed]
- Aydogdu, A.; Kirtil, E.; Sumnu, G.; Oztop, M.H.; Aydogdu, Y. Utilization of Lentil Flour as a Biopolymer Source for the Development of Edible Films. J. Appl. Polym. Sci. 2018, 135, 46356. [Google Scholar] [CrossRef]
- Beikzadeh, S.; Akbarinejad, A.; Swift, S.; Perera, J.; Kilmartin, P.A.; Travas-Sejdic, J. Cellulose Acetate Electrospun Nanofibers Encapsulating Lemon Myrtle Essential Oil as Active Agent with Potent and Sustainable Antimicrobial Activity. React. Funct. Polym. 2020, 157, 104769. [Google Scholar] [CrossRef]
- Sullivan, S.T.; Tang, C.; Kennedy, A.; Talwar, S.; Khan, S.A. Food Hydrocolloids Electrospinning and Heat Treatment of Whey Protein Nano Fi Bers. Food Hydrocoll. 2014, 35, 36–50. [Google Scholar] [CrossRef]
- Wilk, S.; Benko, A. Advances in Fabricating the Electrospun Biopolymer-Based Biomaterials. J. Funct. Biomater. 2021, 12, 26. [Google Scholar] [CrossRef]
- Zhong, J.; Mohan, S.D.; Bell, A.; Terry, A.; Mitchell, G.R.; Davis, F.J. Electrospinning of Food-Grade Nanofibres from Whey Protein. Int. J. Biol. Macromol. 2018, 113, 764–773. [Google Scholar] [CrossRef]
- Ignatova, M.G.; Manolova, N.E.; Rashkov, I.B.; Markova, N.D.; Toshkova, R.A.; Georgieva, A.K.; Nikolova, E.B. Poly(3-Hydroxybutyrate)/Caffeic Acid Electrospun Fibrous Materials Coated with Polyelectrolyte Complex and Their Antibacterial Activity and In Vitro Antitumor Effect against HeLa Cells. Mater. Sci. Eng. C 2016, 65, 379–392. [Google Scholar] [CrossRef]
- Hernández-Fernández, J.; Rayón, E.; López, J.; Arrieta, M.P. Enhancing the Thermal Stability of Polypropylene by Blending with Low Amounts of Natural Antioxidants. Macromol. Mater. Eng. 2019, 304, 1900379. [Google Scholar] [CrossRef]
- Ignatova, M.; Manolova, N.; Rashkov, I.; Markova, N. Antibacterial and Antioxidant Electrospun Materials from Poly(3-Hydroxybutyrate) and Polyvinylpyrrolidone Containing Caffeic Acid Phenethyl Ester—“In” and “on” Strategies for Enhanced Solubility. Int. J. Pharm. 2018, 545, 342–356. [Google Scholar] [CrossRef]
- Nikbaht, M.; Salehi, M.; Rezayat, S.M.; Majidi, R.F. Various Parameters in the Preparation of Chitosan/Polyethylene Oxide Electrospun Nanofibers Containing Aloe Vera Extract for Medical Applications. Nanomed. J. 2020, 7, 21–28. [Google Scholar] [CrossRef]
- Yu, S.H.; Hsieh, H.Y.; Pang, J.C.; Tang, D.W.; Shih, C.M.; Tsai, M.L.; Tsai, Y.C.; Mi, F.L. Active Films from Water-Soluble Chitosan/Cellulose Composites Incorporating Releasable Caffeic Acid for Inhibition of Lipid Oxidation in Fish Oil Emulsions. Food Hydrocoll. 2013, 32, 9–19. [Google Scholar] [CrossRef]
- Benbettaieb, N.; Nyagaya, J.; Seuvre, A.M.; Debeaufort, F. Antioxidant Activity and Release Kinetics of Caffeic and P-Coumaric Acids from Hydrocolloid-Based Active Films for Healthy Packaged Food. J. Agric. Food Chem. 2018, 66, 6906–6916. [Google Scholar] [CrossRef] [PubMed]
- Araghi, M.; Moslehi, Z.; Nafchi, A.M.; Mostahsan, A.; Salamat, N.; Garmakhany, A.D. Cold Water Fish Gelatin Modification by a Natural Phenolic Cross-Linker (Ferulic Acid and Caffeic Acid). Food Sci. Nutr. 2015, 3, 370–375. [Google Scholar] [CrossRef]
- Aydogdu, A.; Sumnu, G.; Sahin, S. A Novel Electrospun Hydroxypropyl Methylcellulose/Polyethylene Oxide Blend Nanofibers: Morphology and Physicochemical Properties. Carbohydr. Polym. 2018, 181, 234–246. [Google Scholar] [CrossRef]
- Rodsamran, P.; Sothornvit, R. Lime Peel Pectin Integrated with Coconut Water and Lime Peel Extract as a New Bioactive Film Sachet to Retard Soybean Oil Oxidation. Food Hydrocoll. 2019, 97, 105173. [Google Scholar] [CrossRef]
- Insaward, A.; Duangmal, K.; Mahawanich, T. Mechanical, Optical, and Barrier Properties of Soy Protein Film as Affected by Phenolic Acid Addition. J. Agric. Food Chem. 2015, 63, 9421–9426. [Google Scholar] [CrossRef]
- Fathi, M.; Mirlohi, M.; Varshosaz, J.; Madani, G. Novel Caffeic Acid Nanocarrier: Production, Characterization, and Release Modeling. J. Nanomater. 2013, 2013, 9. [Google Scholar] [CrossRef]
- Wang, A.; Leible, M.; Lin, J.; Weiss, J.; Zhong, Q. Caffeic Acid Phenethyl Ester Loaded in Skim Milk Microcapsules: Physicochemical Properties and Enhanced in Vitro Bioaccessibility and Bioactivity against Colon Cancer Cells. J. Agric. Food Chem. 2020, 68, 14978–14987. [Google Scholar] [CrossRef]
- Chen, J.H.; Ho, C.-T. Antioxidant Activities of Caffeic Acid and Its Related Hydroxycinnamic Acid Compounds. J. Agric. Food Chem. 1997, 45, 2374–2378. [Google Scholar] [CrossRef]
- Youssef, M.K.E.; El-Manfaloty, M.M.; Ali, H.M. Assessment of Proximate Chemical Composition, Nutritional Status, Fatty Acid Composition and Phenolic Compounds of Carob (Ceratonia siliqua L.). Food Public Health 2013, 3, 304–308. [Google Scholar] [CrossRef]
- Ivanković, A.; Talić, S.; Lasić, M. Biodegradable packaging in the food industry. J. Food Saf. Food Qual. 2017, 68, 26–38. [Google Scholar] [CrossRef]
- Alqahtani, N.; Alnemr, T.; Ali, S. Development of Low-Cost Biodegradable Films from Corn Starch and Date Palm Pits (Phoenix dactylifera). Food Biosci. 2021, 42, 101199. [Google Scholar] [CrossRef]
- Medina-Jaramillo, C.; Ochoa-Yepes, O.; Bernal, C.; Famá, L. Active and Smart Biodegradable Packaging Based on Starch and Natural Extracts. Carbohydr. Polym. 2017, 176, 187–194. [Google Scholar] [CrossRef] [PubMed]
- Medina Jaramillo, C.; Gutiérrez, T.J.; Goyanes, S.; Bernal, C.; Famá, L. Biodegradability and Plasticizing Effect of Yerba Mate Extract on Cassava Starch Edible Films. Carbohydr. Polym. 2016, 151, 150–159. [Google Scholar] [CrossRef] [PubMed]


| Name | Composition |
|---|---|
| 3C1W | 3% (w/v) Carob flour-1% (w/v) WPC |
| 3C3W | 3% (w/v) Carob flour-3% (w/v) WPC |
| 3C3W1CA | 3% (w/v) Carob flour-3% (w/v) WPC-1% (w/w) CA |
| 3C3W10CA | 3% (w/v) Carob flour-3% (w/v) WPC- 10% (w/w) CA |
| Solutions | n | k (Pa sn) | Electrical Conductivity (mS/cm) | Average Fiber Diameter (nm) |
|---|---|---|---|---|
| 3C1W | 0.9121 ± 0.0013 a * | 0.386 ± 0.020 c | 4.03 ± 0.03 c | 242 ± 56 bc |
| 3C3W | 0.9124 ± 0.0086 a | 0.545 ± 0.012 a | 4.10 ± 0.01 c | 310 ± 70 a |
| 3C3W1CA | 0.9215 ± 0.0002 a | 0.451 ± 0.015 b | 4.78 ± 0.03 b | 257 ± 66 b |
| 3C3W10CA | 0.9330 ± 0.0175 a | 0.267 ± 0.002 d | 5.69 ± 0.12 a | 222 ± 49 c |
| Sample | Tg (°C) | Tm (°C) | ΔHm (J· g-1) |
|---|---|---|---|
| 3C1W | −5.28 ± 0.877 a * | 63.9 ± 0.141 a | 40.89 ± 0.156 a |
| 3C3W | −9.36 ± 0.509 b | 60.92 ± 0.113 b | 36.47 ± 0.665 b |
| 3C3W1CA | −9.83 ± 0.467 b | 61.05 ± 0.071 b | 28.15 ± 0.071 c |
| 3C3W10CA | −9.47 ± 0.240 b | 62.71 ± 0.580 a | 28.16 ± 0.226 c |
| Sample | WVP×10−10 (g·s−1 ·m−1 ·Pa−1) |
|---|---|
| 3C1W | 2.95 ± 0.21 a * |
| 3C3W | 1.38 ± 0.14 c |
| 3C3W1CA | 2.06 ± 0.08 b |
| 3C3W10CA | 1.91 ± 0.10 bc |
| Sample | LE (%) | AA (%) |
|---|---|---|
| 3C3W | - | 0.85 ± 0.03 c |
| 3C3W1CA | 76.4 ± 1.3 b * | 31.47 ± 0.69 b |
| 3C3W10CA | 94.0 ± 1.7 a | 92.95 ± 1.19 a |
Publisher’s Note: MDPI stays neutral with regard to jurisdictional claims in published maps and institutional affiliations. |
© 2022 by the authors. Licensee MDPI, Basel, Switzerland. This article is an open access article distributed under the terms and conditions of the Creative Commons Attribution (CC BY) license (https://creativecommons.org/licenses/by/4.0/).
Share and Cite
Zeren, S.; Sahin, S.; Sumnu, G. Encapsulation of Caffeic Acid in Carob Bean Flour and Whey Protein-Based Nanofibers via Electrospinning. Foods 2022, 11, 1860. https://doi.org/10.3390/foods11131860
Zeren S, Sahin S, Sumnu G. Encapsulation of Caffeic Acid in Carob Bean Flour and Whey Protein-Based Nanofibers via Electrospinning. Foods. 2022; 11(13):1860. https://doi.org/10.3390/foods11131860
Chicago/Turabian StyleZeren, Sema, Serpil Sahin, and Gulum Sumnu. 2022. "Encapsulation of Caffeic Acid in Carob Bean Flour and Whey Protein-Based Nanofibers via Electrospinning" Foods 11, no. 13: 1860. https://doi.org/10.3390/foods11131860
APA StyleZeren, S., Sahin, S., & Sumnu, G. (2022). Encapsulation of Caffeic Acid in Carob Bean Flour and Whey Protein-Based Nanofibers via Electrospinning. Foods, 11(13), 1860. https://doi.org/10.3390/foods11131860