Utilising a Real-Time Continuous Glucose Monitor as Part of a Low Glycaemic Index and Load Diet and Determining Its Effect on Improving Dietary Intake, Body Composition and Metabolic Parameters of Overweight and Obese Young Adults: A Randomised Controlled Trial
Abstract
:1. Introduction
2. Materials and Methods
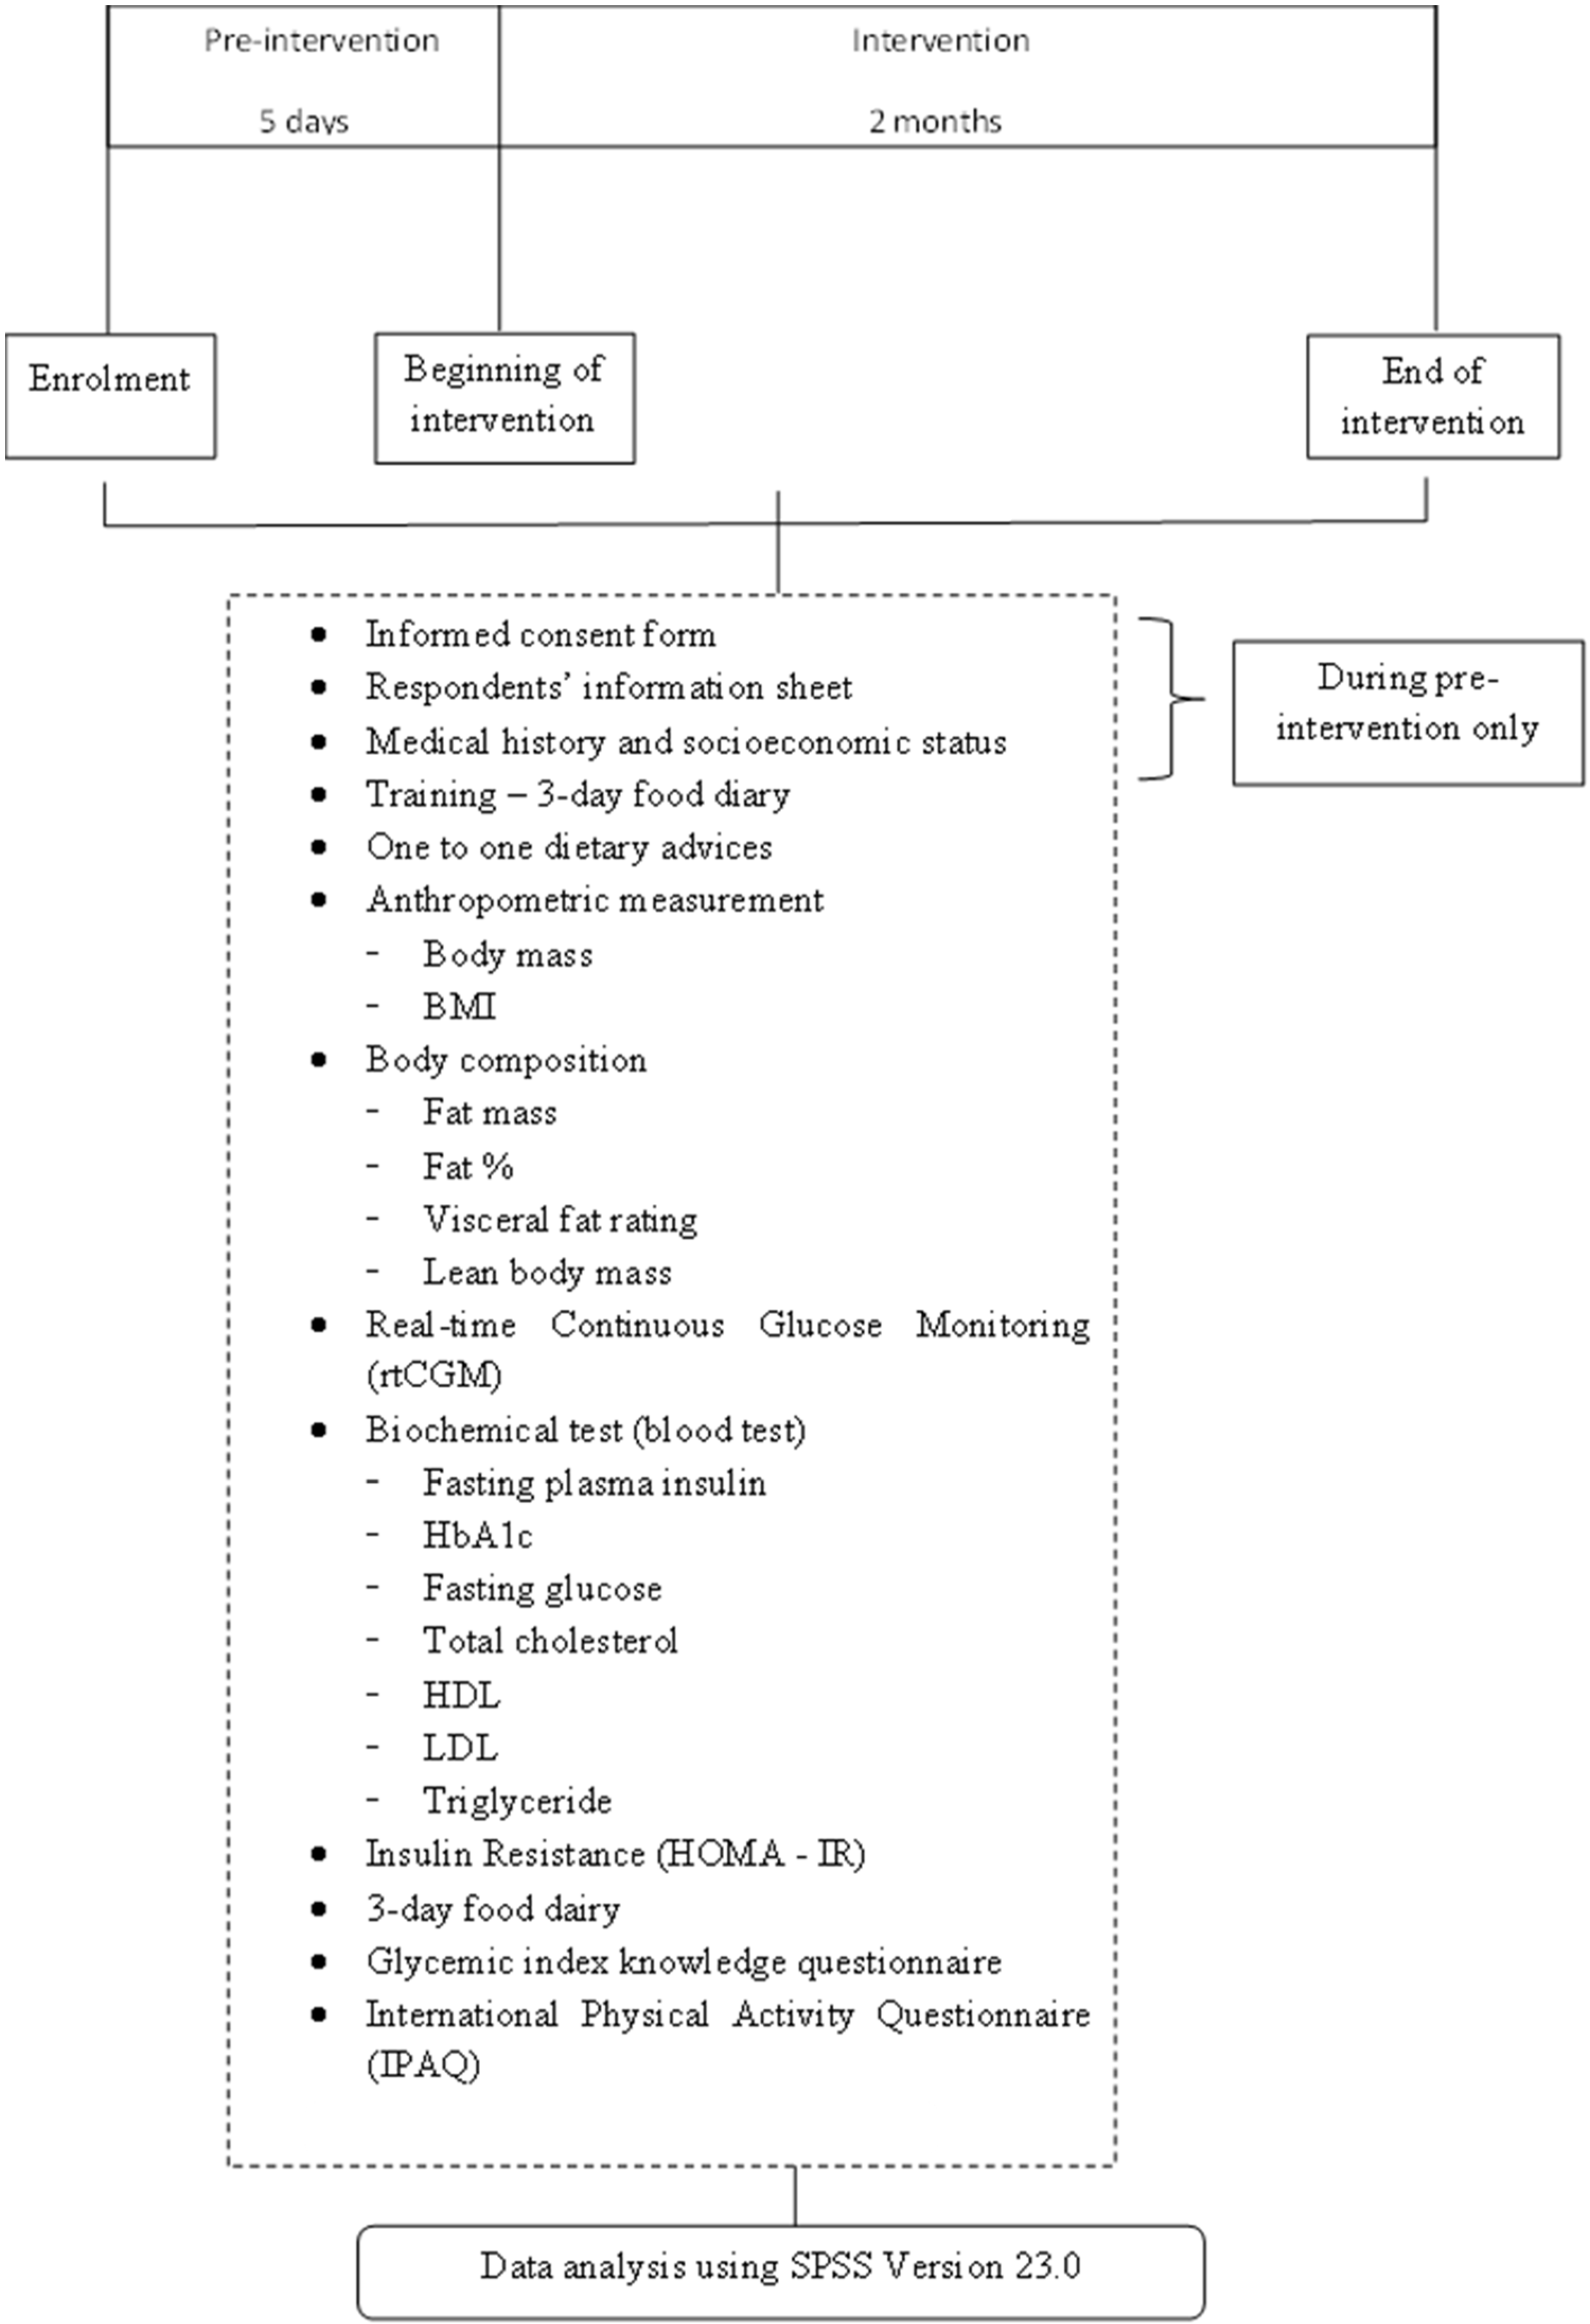
2.1. Study Design
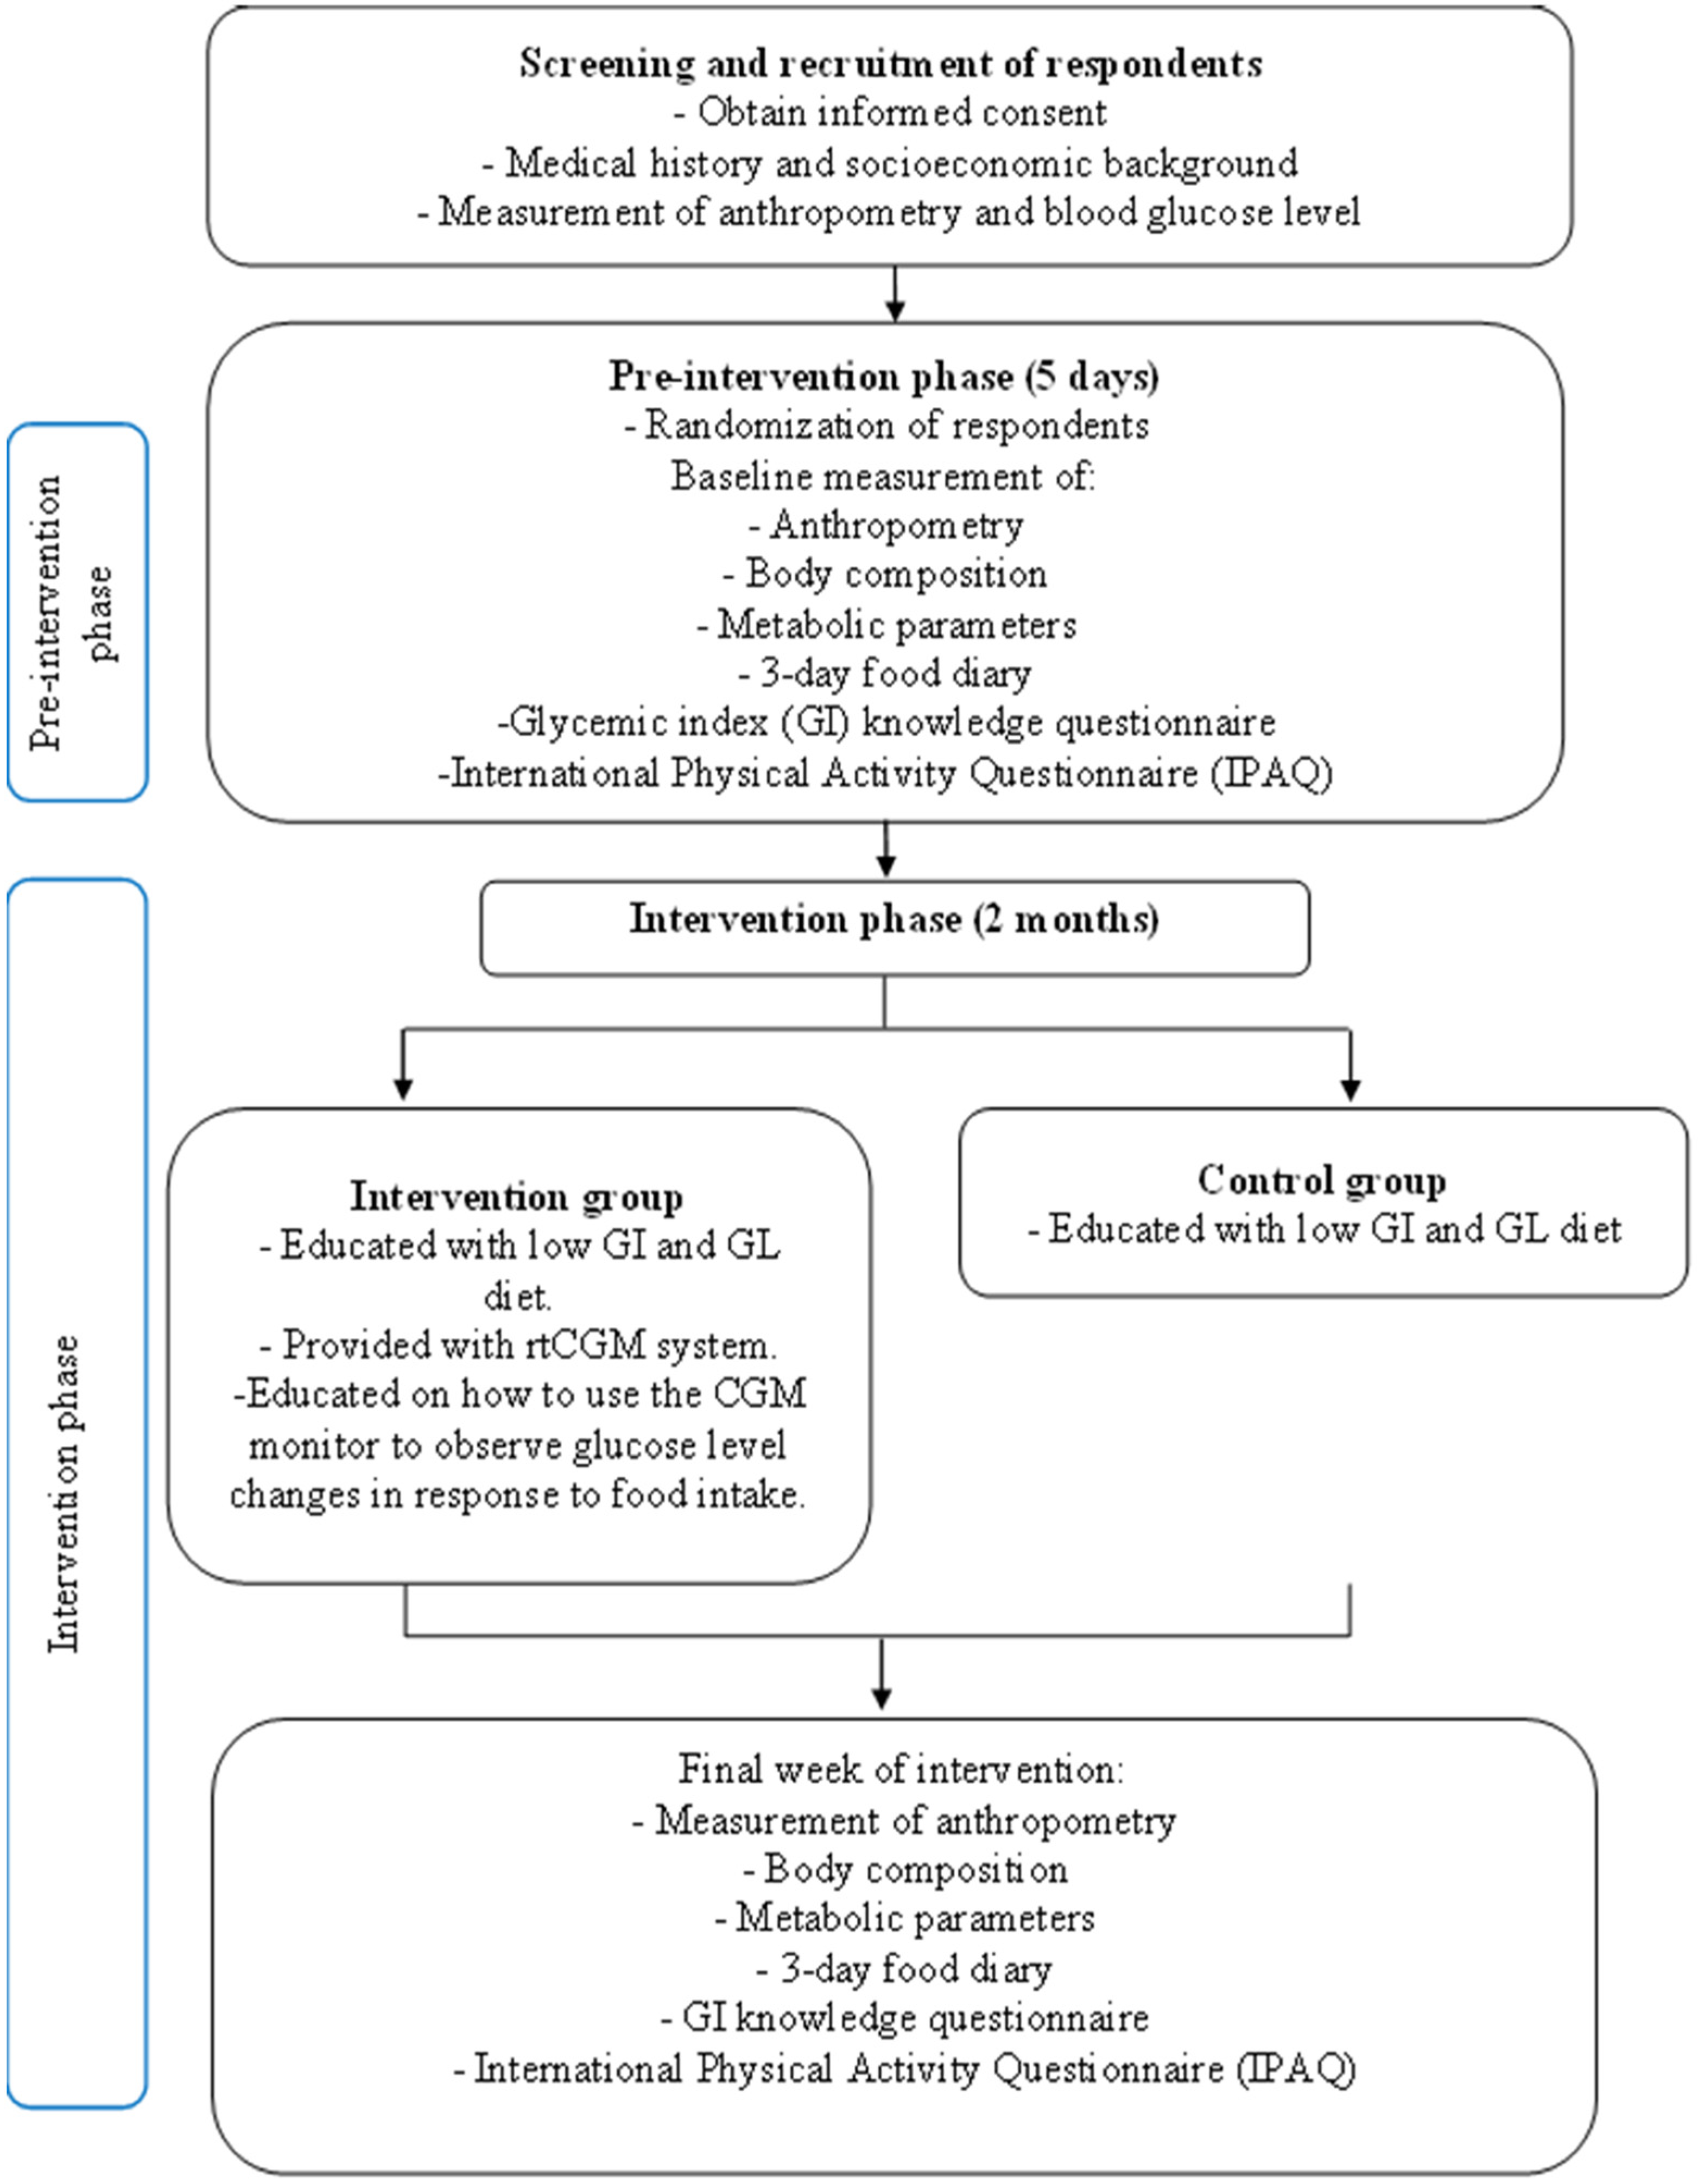
2.2. Phases of Intervention
2.2.1. Screening of Participants
2.2.2. Pre-Intervention Phase
2.2.3. Intervention Phase
2.3. Sampling
2.4. Dietary Intervention
2.5. Assessment of Glycaemic Index Nutrition Knowledge
2.6. Physical Activities
2.7. Food Record
2.8. Anthropometric and Body Composition Measurement
2.9. Biochemical Analysis
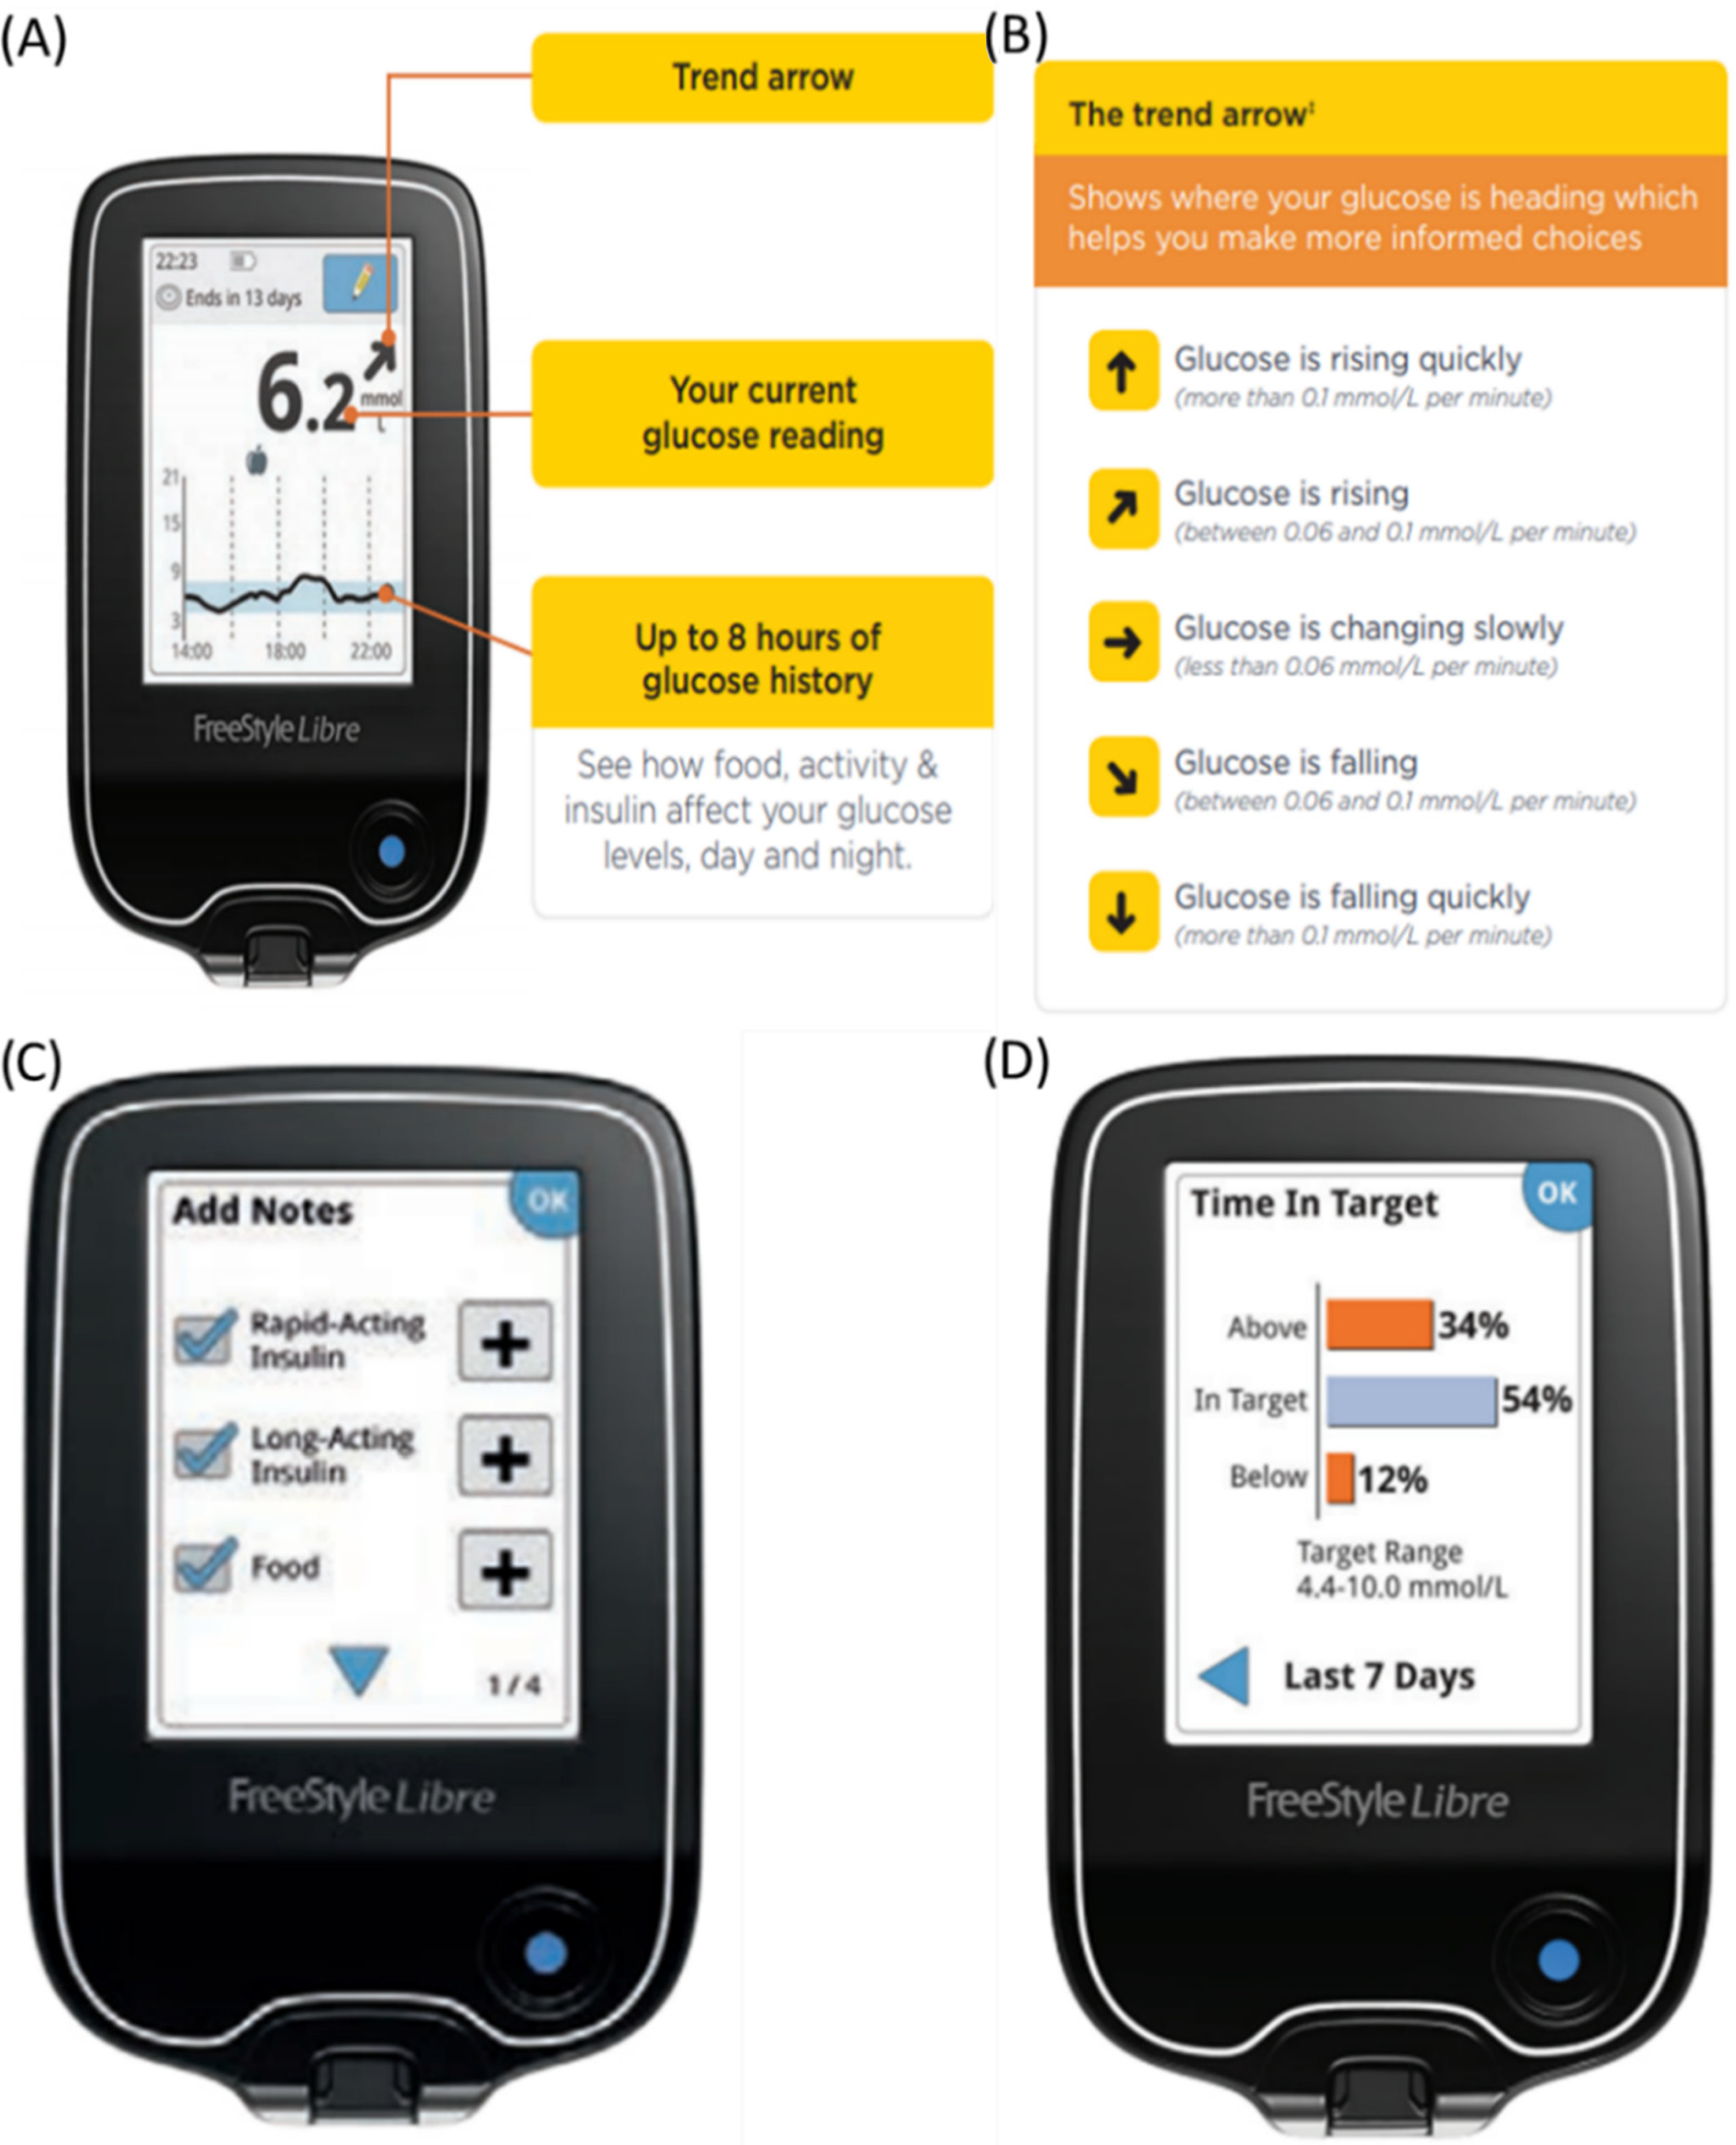
2.10. Continuous Glucose Measurement
2.11. Statistical Analysis
3. Results
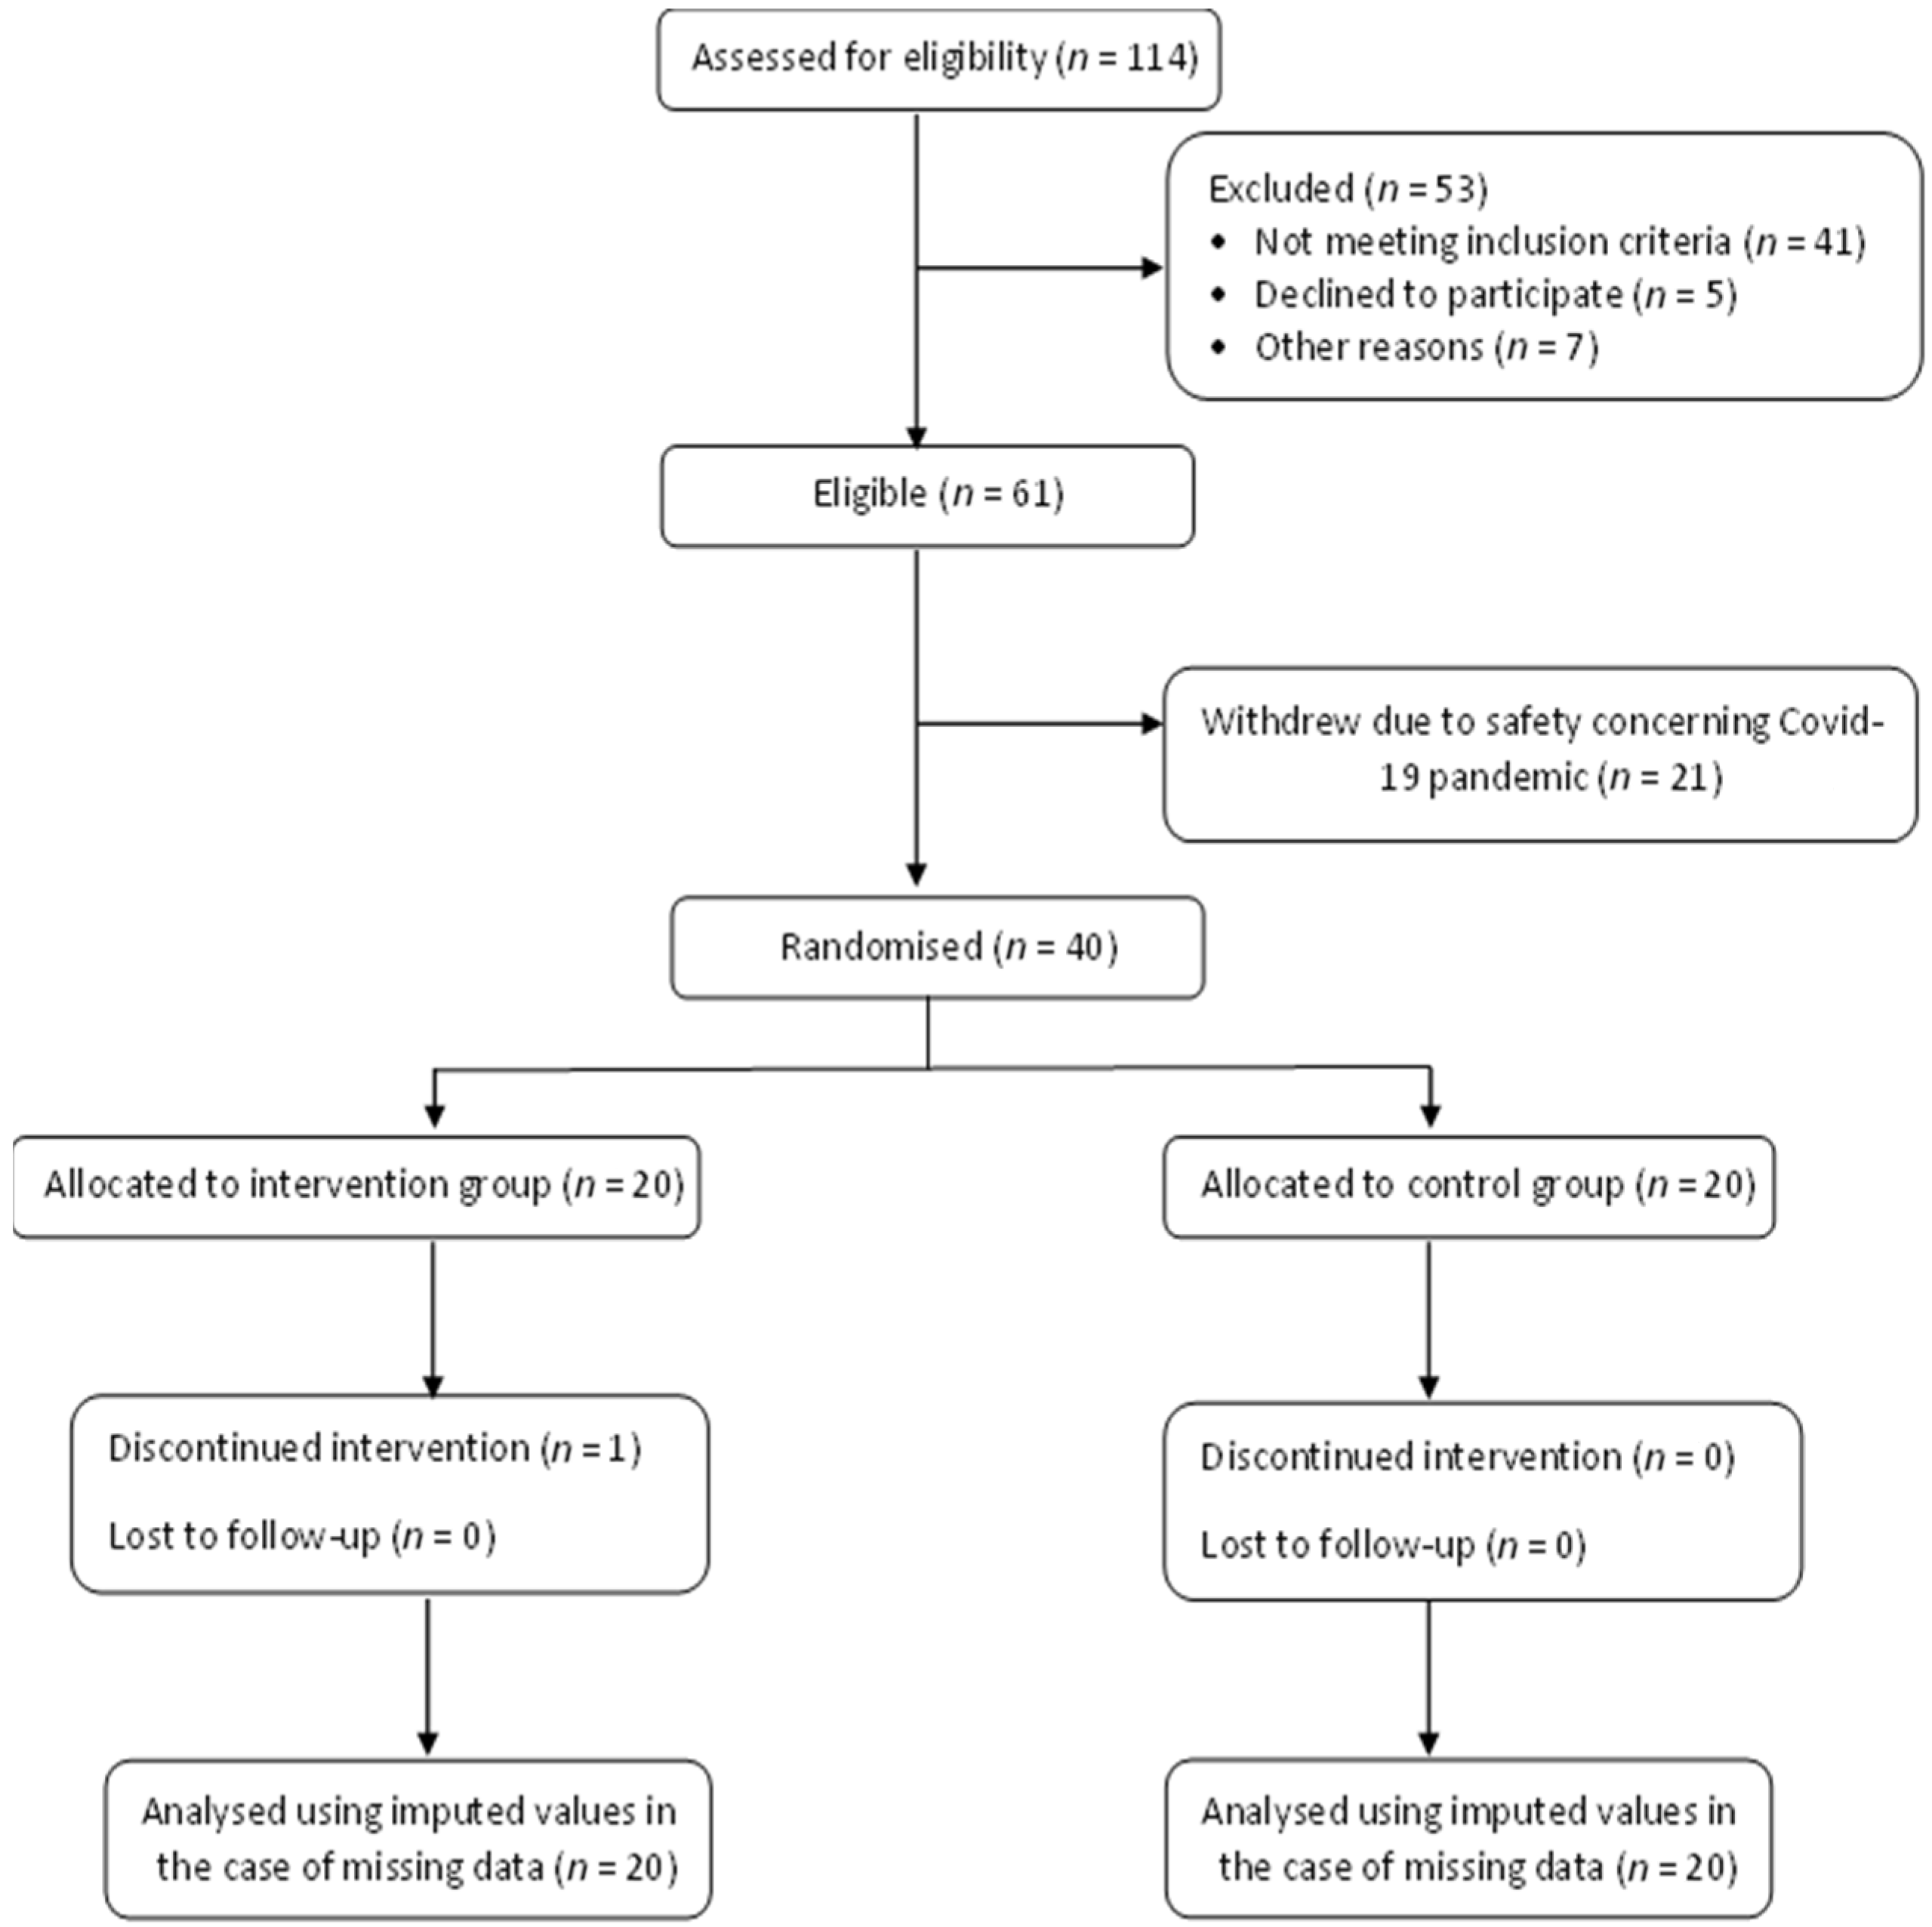
3.1. Participants
3.2. Physical Activities
3.3. Glycaemic Index (GI) and Glycaemic Load (GL) Knowledge
3.4. Dietary Intake
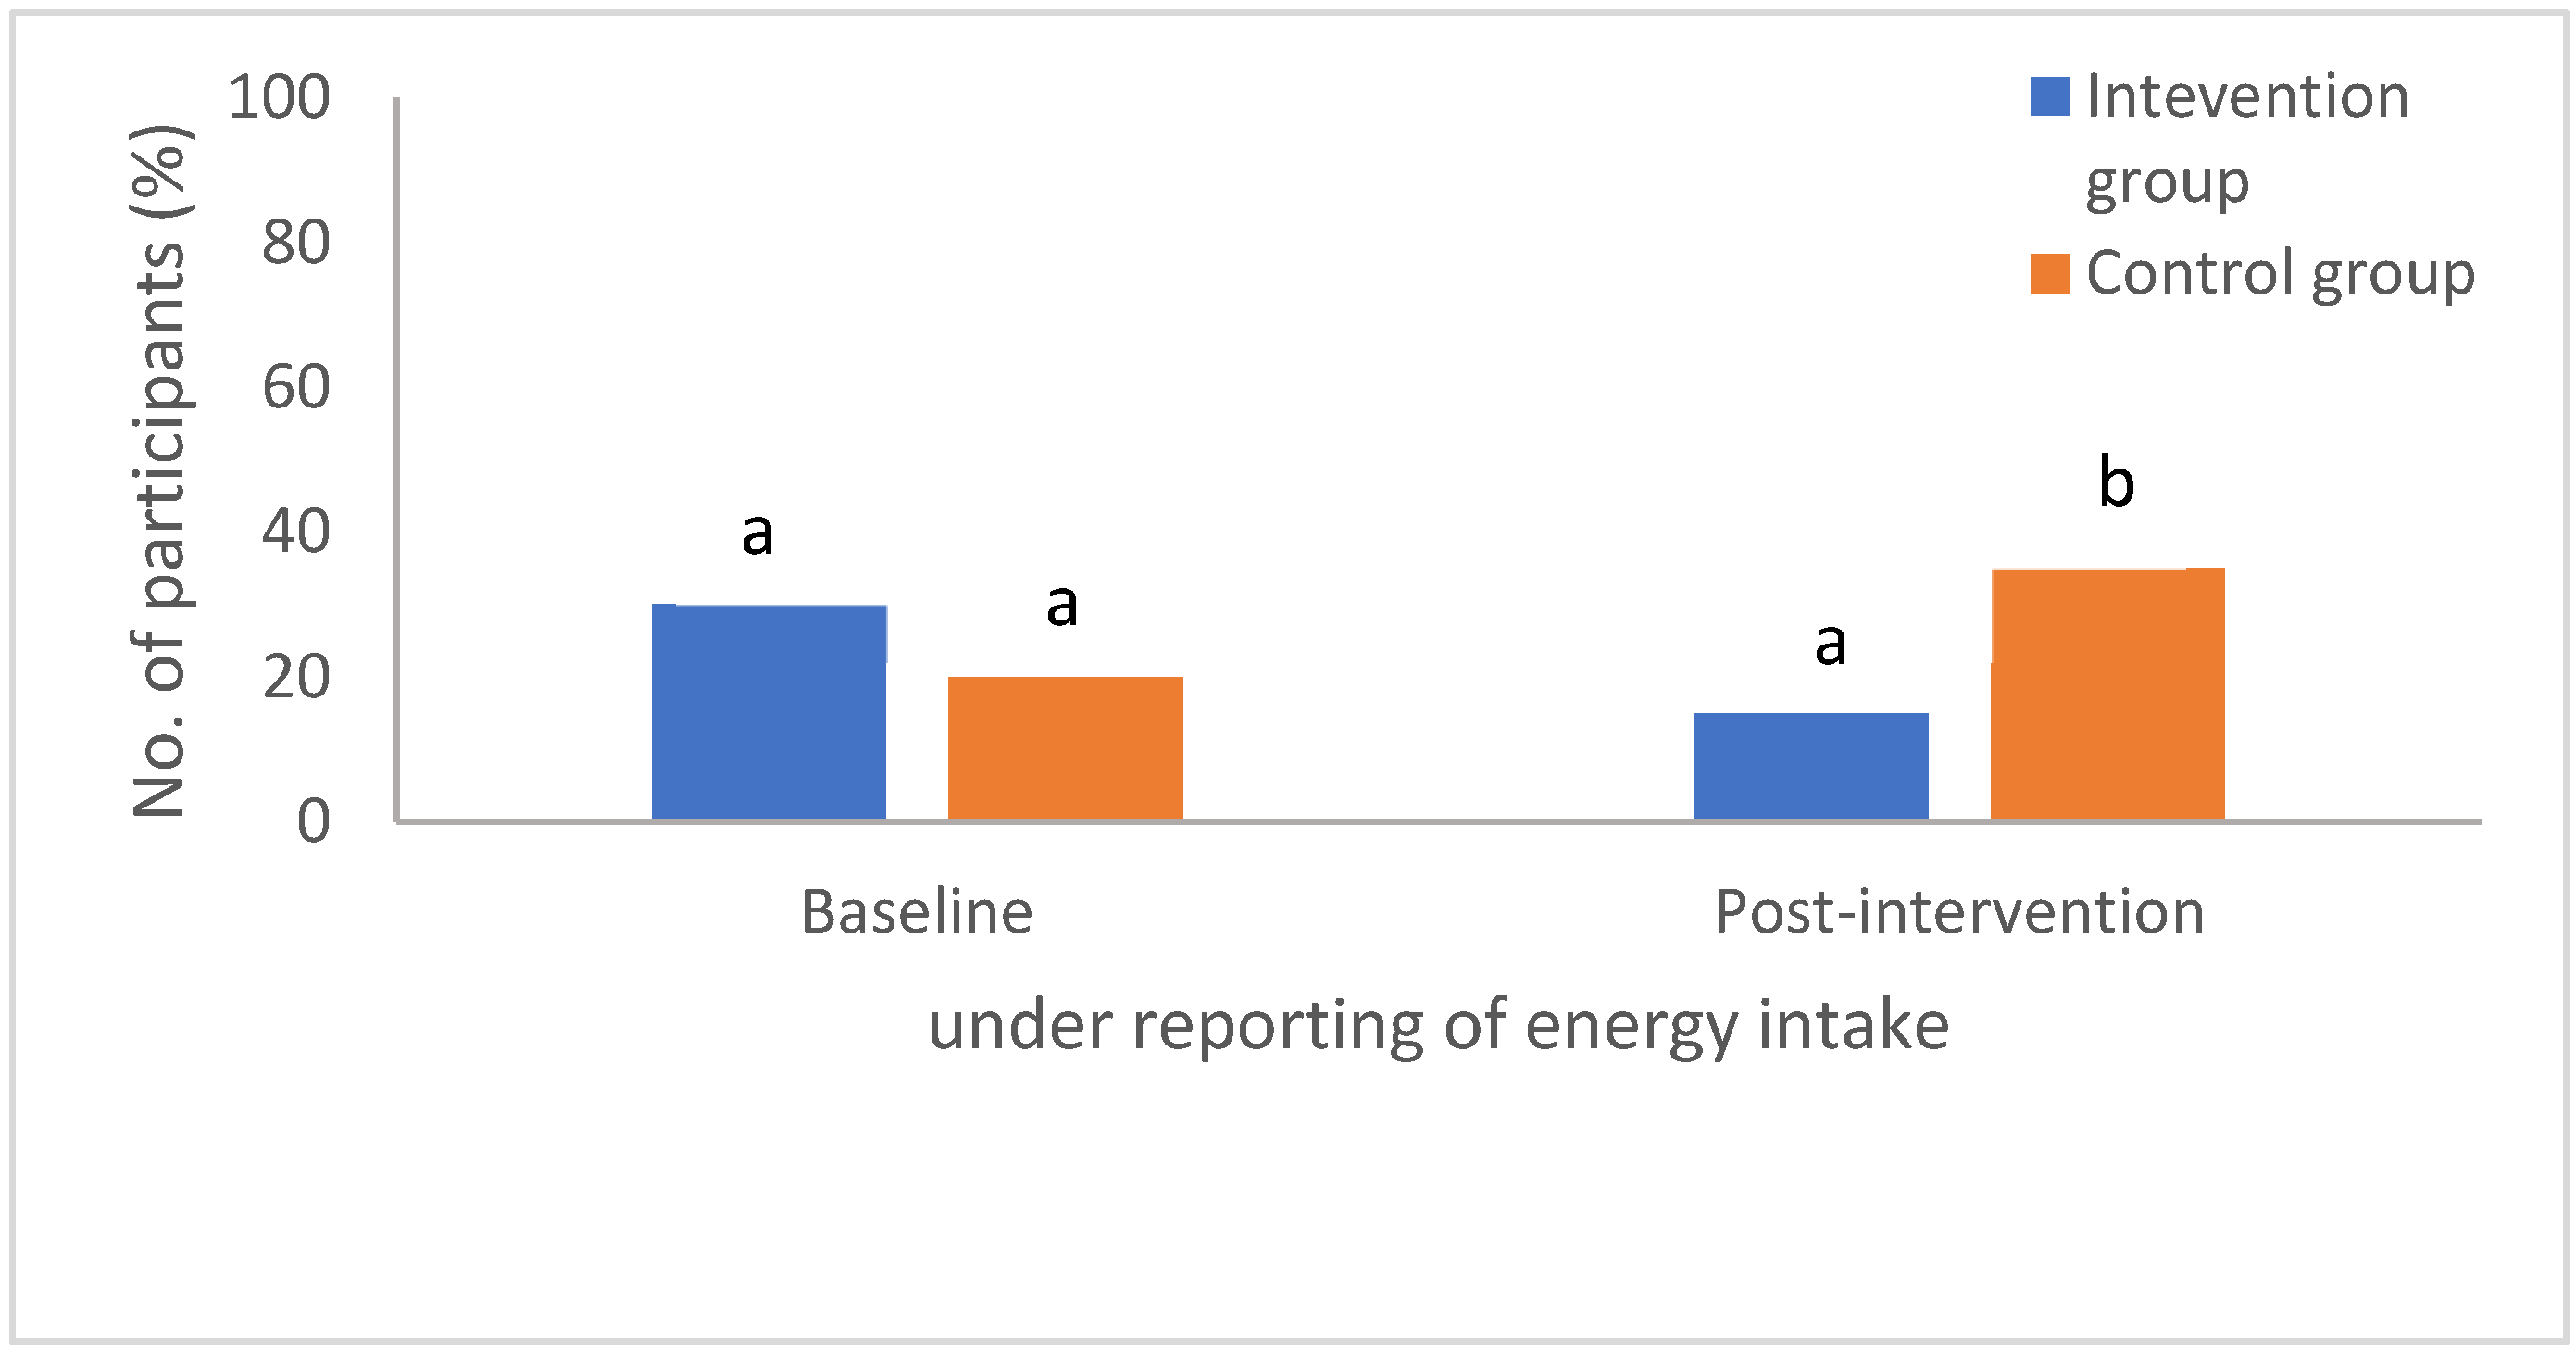
3.5. Under-Reporting of Dietary Intake
3.6. Anthropometric Measurement and Body Composition
3.7. Metabolic Parameters
4. Discussion
5. Conclusions
Author Contributions
Funding
Institutional Review Board Statement
Informed Consent Statement
Data Availability Statement
Acknowledgments
Conflicts of Interest
References
- World Health Organization (WHO). Global Strategy on Human Resources for Health: Workforce 2030; WHO: Geneva, Switzerland, 2016. [Google Scholar]
- Taylor, P.J.; Thompson, C.H.; Luscombe-Marsh, N.D.; Wycherley, T.P.; Wittert, G.; Brinkworth, G.D. Efficacy of real-time continuous glucose monitoring to improve effects of a prescriptive lifestyle intervention in type 2 diabetes: A Pilot Study. Diabetes Ther. 2019, 10, 509–522. [Google Scholar] [CrossRef] [PubMed] [Green Version]
- Samdal, G.B.; Eide, G.E.; Barth, T. Effective behaviour change techniques for physical activity and healthy eating in overweight and obese adults; systematic review and meta-regression analyses. Int. J. Behav. Nutr. Phys. Act. 2017, 4, 42–46. [Google Scholar] [CrossRef] [PubMed] [Green Version]
- Mihai, D.A.; Stefan, D.S.; Stegaru, D.; Bernea, G.E.; Vacaroiu, I.A.; Papacocea, T.; Lupușoru, M.O.D.; Nica, A.E.; Stiru, O.; Dragos, D.; et al. Continuous glucose monitoring devices: A brief presentation (Review). Exp. Ther. Med. 2022, 23, 174. [Google Scholar] [CrossRef] [PubMed]
- Zhou, J.; Li, H.; Ran, X.; Yang, W.; Li, Q.; Peng, Y.; Jia, W. Reference values for continuous glucose monitoring in Chinese subjects. Diabetes Care 2009, 32, 1188–1193. [Google Scholar] [CrossRef] [Green Version]
- Zafar, M.I.; Mills, K.E.; Zheng, J.; Peng, M.M.; Ye, X.; Chen, L.L. Low glycaemic index diets as an intervention for obesity: A systematic review and meta-analysis. Obes. Rev. 2018, 20, 290–315. [Google Scholar] [CrossRef]
- Faul, F.; Erdfelder, E.; Lang, A.-G.; Buchner, A. G*Power 3: A flexible statistical power ram for the social, behavioral, and biomedical sciences. Behav. Res. Methods 2007, 39, 175–191. [Google Scholar] [CrossRef]
- Sloth, B.; Krog-Mikkelsen, I.; Flint, A.; Tetens, I.; Björck, I.; Vinoy, S.; Raben, A. No difference in body weight decrease between a low-glycemic-index and a high-glycemic-index diet but reduced LDL cholesterol after 10-wk ad libitum intake of the low-glycemic-index diet. Am. J. Clin. Nutr. 2004, 80, 337–347. [Google Scholar] [CrossRef]
- Shyam, S.; Arshad, F.; Abdul Ghani, R.; Chinna, K.; Nisak, M.Y.B.; Azmi, N.K. Effect of Including Glycaemic Index (GI) Nutrition Education, within the Conventional Healthy Dietary Recommendation Framework, on Body Weight and Composition of Women with Prior Gestational Diabetes Mellitus: Results from a One-Year Randomised Controlled Trial. Malays. J. Nutr. 2015, 21, 269–283. [Google Scholar]
- Yusof, B.N.M.; Talib, R.A.; Kamaruddin, N.A.; Karim, N.A.; Chinna, K.; Gilbertson, H. A low-GI diet is associated with a short-term improvement of glycaemic control in Asian patients with type 2 diabetes. Diabetes Obes. Metab. 2009, 11, 387–396. [Google Scholar] [CrossRef]
- Amano, Y.; Sugiyama, M.; Lee, J.S.; Kawakubo, K.; Mori, K.; Tang, A.C.; Akabayashi, A. Glycemic index-based nutritional education improves blood glucose control in Japanese adults: A randomized controlled trial. Diabetes Care 2007, 30, 1874–1876. [Google Scholar] [CrossRef] [Green Version]
- Bouche, C.; Rizkalla, S.W.; Luo, J.; Vidal, H.; Veronese, A.; Pacher, N.; Slama, G. Five-Week, Low-Glycemic Index Diet Decreases Total Fat Mass and Improves Plasma Lipid Profile in Moderately Overweight Nondiabetic Men. Diabetes Care 2002, 25, 822–828. [Google Scholar] [CrossRef] [PubMed] [Green Version]
- Gardner, C.; Trepanowski, J.; Del Gobbo, L.; Hauser, M.; Rigdon, J.; Ioannidis, J.; Desai, M.; King, A. Effect of Low-Fat vs Low-Carbohydrate Diet on 12-Month Weight Loss in Overweight Adults and the Association With Genotype Pattern or Insulin Secretion. JAMA 2018, 319, 667. [Google Scholar] [CrossRef] [PubMed]
- Ebbeling, C.B.; Leidig, M.M.; Sinclair, K.B.; Hangen, J.P.; Ludwig, D.S. A reduced-glycemic load diet in the treatment of adolescent obesity. Arch. Pediatr. Adolesc. Med. 2003, 157, 773–779. [Google Scholar] [CrossRef] [PubMed]
- Shishehbor, F.; Mansoori, A.; Shirani, F. Vinegar consumption can attenuate postprandial glucose and insulin responses; a systematic review and meta-analysis of clinical trials. Diabetes Res. Clin. Pract. 2017, 127, 1–9. [Google Scholar] [CrossRef] [PubMed]
- Quek, R.; Bi, X.; Henry, C.J. Impact of protein-rich meals on glycaemic response of rice. Br. J. Nutr. 2016, 115, 1194–1201. [Google Scholar] [CrossRef] [Green Version]
- Sekaran, U.; Bougie, R. Research Methods for Business: A Skill Building Approach, 6th ed.; John Wiley & Sons Ltd.: West Sussex, UK, 2013. [Google Scholar]
- Craig, C.L.; Marshall, A.L.; Sjöström, M.; Bauman, A.E.; Booth, M.L.; Ainsworth, B.E.; Pratt, M.; Ekelund, U.L.F.; Yngve, A.; Sallis, J.F.; et al. International Physical Activity Questionnaire: 12-country reliability and validity. Med. Sci. Sports Exerc. 2003, 35, 1381–1395. [Google Scholar] [CrossRef] [Green Version]
- Yang, Y.J.; Kim, M.Y.; Hwang, S.H.; Ahn, Y.; Shim, J.E.; Kim, D.H. Relative validities of 3-day food records and the food frequency questionnaire. Nutr. Res. Pract. 2010, 2, 142–148. [Google Scholar] [CrossRef] [Green Version]
- McMillan-Price, J.; Petocz, P.; Atkinson, F.; O’Neill, K.; Samman, S.; Steinbeck, K.; Caterson, I.; Brand-Miller, J. Comparison of 4 Diets of Varying Glycemic Load on Weight Loss and Cardiovascular Risk Reduction in Overweight and Obese Young Adults. Arch. Intern. Med. 2006, 166, 1466. [Google Scholar] [CrossRef]
- Shyam, S.; Fatimah, A.; Rohana, A.G.; Norasyikin, A.W.; Karuthan, C.; Shanita, N.; Nor Azmi, K. Lowering dietary glycaemic index through nutrition education among Malaysian women with a history of gestational diabetes mellitus. Malays. J. Nutr. 2013, 19, 9–23. [Google Scholar]
- Ng, T.K.W. DietPLUS-a User-friendly ‘2 in 1′ Food Composition Database and Calculator of Nutrient Intakes. Malays. J. Nutr. 2010, 16, 125–130. [Google Scholar]
- Shyam, S.; Wai, T.N.K.; Arshad, F. Adding glycaemic index and glycaemic load functionality to DietPLUS, a Malaysian food composition database and diet intake calculator. Asia Pac. J. Clin. Nutr. 2012, 21, 201–208. [Google Scholar] [PubMed]
- Crenier, L.; Lytrivi, M.; Van Dalem, A.; Keymeulen, B.; Corvilain, B. Glucose complexity estimates insulin resistance in either nondiabetic individuals or in type 1 diabetes. J. Clin. Endocrinol. Metab. 2016, 101, 1490–1497. [Google Scholar] [CrossRef] [PubMed] [Green Version]
- University of Cambridge. The EM Algorithm and Mixed (Random Effects) Model Approaches to Missing Values; University of Cambridge: Cambridge, UK, 2014; Available online: https://imaging.mrc-cbu.cam.ac.uk/statswiki/FAQ/emalgm (accessed on 2 October 2021).
- Goldberg, G.R.; Black, A.E.; Jebb, S.A.; Cole, T.J.; Murgatroyd, P.R.; Coward, W.A.; Prentice, A.M. Critical evaluation of energy intake data using fundamental principles of energy physiology: 1, Derivation of cut-off limits to identify under-recording. Eur. J. Clin. Nutr. 1991, 45, 569–581. [Google Scholar] [PubMed]
- World Health Organization (WHO). Overweight and Obesity. 2020. Available online: https://www.who.int/gho/ncd/risk_factors/overweight_text/en/ (accessed on 25 October 2021).
- Anuar, N.M.; Yusof, B.N.M.; Hasbullah, F.Y.; Adznam, S.N.; Zakaria, N.F.; Hashim, N. Levels of Knowledge about the Glycemic Index Concept among Women with Gestational Diabetes Mellitus. Malays. J. Med. Health Sci. 2020, 16, 185–191. [Google Scholar]
- Melanson, K.; Summers, A.; Nguyen, V.; Brosnahan, J.; Lowndes, J.; Angelopoulos, T.; Rippe, J. Body composition, dietary composition, and components of metabolic syndrome in overweight and obese adults after a 12-week trial on dietary treatments focused on portion control, energy density, or glycemic index. Nutr. J. 2012, 11, 57. [Google Scholar] [CrossRef] [Green Version]
- Gemming, L.; Jiang, Y.; Swinburn, B.; Utter, J.; Mhurchu, C.N. Under-reporting remains a key limitation of self-reported dietary intake: An analysis of the 2008/09 New Zealand Adult Nutrition Survey. Eur. J. Clin. Nutr. 2014, 68, 259–264. [Google Scholar] [CrossRef]
- Kye, S.; Kwon, S.O.; Lee, S.Y.; Lee, J.; Kim, B.H.; Suh, H.J.; Moon, H.K. Under-reporting of energy intake from 24-hour dietary recalls in the Korean National Health and Nutrition Examination Survey. Osong Public Health Res. Perspect. 2014, 5, 85–91. [Google Scholar] [CrossRef] [Green Version]
- Chekima, K.; Wong, B.T.Z.; Noor, M.I.; Ooi, Y.B.H.; Yan, S.W.; Chekima, B. Use of a Continuous Glucose Monitor to Determine the Glycaemic Index of Rice-Based Mixed Meals, Their Effect on a 24 h Glucose Profile and Its Influence on Overweight and Obese Young Adults’ Meal Preferences. Foods 2022, 11, 983. [Google Scholar] [CrossRef]
| Variable | Intervention, (Mean ± SD) (n = 20) | Control, (Mean ± SD) (n = 20) | p-Value |
|---|---|---|---|
| Age, y | 26 ± 6 | 25 ± 5 | 0.63 |
| Female, No. (%) | 12 (60) | 11 (55) | 0.72 |
| Height, cm | 164.5 ± 0.1 | 163.4 ± 0.1 | 0.85 |
| Weight, kg | 77.3 ± 10.4 | 78.3 ± 12.6 | 0.82 |
| BMI | 29.3 ± 3.7 | 29.9 ± 7.2 | 0.72 |
| Fat mass (kg) | 29.8 ± 6.9 | 29.7 ± 14.7 | 0.98 |
| Muscle mass (kg) | 44.8 ± 9.6 | 48.4 ± 8.8 | 0.76 |
| Visceral fat rating | 9.5 ± 2.6 | 9.3 ± 3.3 | 0.40 |
| Fasting plasma glucose (mmol/L) | 5.0 ± 0.5 | 4.8 ± 0.3 | 0.32 |
| HbA1c (%) | 5.2 ± 0.3 | 5.2 ± 0.6 | 0.64 |
| Fasting plasma insulin (pmol/L) | 12 ± 6.4 | 9.5 ± 4.4 | 0.16 |
| HOMA-IR | 2.5 ± 1.4 | 1.9 ± 0.9 | 0.11 |
| Total cholesterol (mmol/L) | 4.6 ± 1.2 | 4.5 ± 0.9 | 0.60 |
| HDL cholesterol (mmol/L) | 1.2 ± 0.3 | 1.1 ± 0.2 | 0.47 |
| LDL cholesterol (mmol/L) | 3.1 ± 0.7 | 2.9 ± 0.8 | 0.71 |
| Triglycerides (mmol/L) | 1.1 ± 0.7 | 0.9 ± 0.3 | 0.24 |
| Total/HDL ratio | 4.9 ± 0.9 | 4.7 ± 0.8 | 0.34 |
| Variable | Group | Physical Activities (MET-min/Week), Mean ± SD | within-Group Differences, Mean (95% CI) | a p-Value | between-Group Differences, Mean (95% CI) | b p-Value | |
|---|---|---|---|---|---|---|---|
| Baseline | Post-Intervention | ||||||
| Physical activities | Intervention | 521.2 ± 518.3 | 547.2 ± 574.3 | 25.9 (−71.9 to 123.8) | 0.59 | −28.5 (−171.9 to 114.8) | 0.69 |
| Control | 498.0 ± 472.9 | 495.4 ± 372.1 | −2.6 (−113.9 to 108.7) | 0.96 | |||
| Variable | Group | Glycaemic Index Knowledge (%) Mean ± SD | within-Group Differences, Mean (95% CI) | a p-Value | between-Group Differences, Mean (95% CI) | b p-Value | |
|---|---|---|---|---|---|---|---|
| Baseline | Post-Intervention | ||||||
| GI and GL knowledge score (%) | Intervention | 52.4 ± 21.6 | 84.3 ± 15.3 | 31.9 (21.8 to 42.0) | <0.001 | 8.08 (−4.92 to 21.08) | 0.10 |
| Control | 50.0 ± 26.4 | 90.0 ± 13.1 | 40.0 (33.2 to 56.7) | <0.001 | |||
| Variable | Group | Mean ± SD | within-Group Differences, Mean (95% CI) | a p-Value | between-Group Differences, Mean (95% CI) | b p-Value | |
|---|---|---|---|---|---|---|---|
| Baseline | Post-Intervention | ||||||
| Total energy intake, Kcal | Intervention | 1904 ± 284 | 1564 ± 237 | 339 (308 to 370) | <0.001 | −17 (−53 to 17) | 0.32 |
| Control | 1931 ± 252 | 1609 ± 210 | 322 (302 to 341) | <0.001 | |||
| Carbohydrate, g | Intervention | 277.9 ± 33.1 | 191.8 ± 27.3 | 86.1 (76.9 to 95.3) | <0.001 | −15.2 (−20.9 to −9.5) | 0.04 |
| Control | 274.9 ± 40.6 | 204.1 ± 26.4 | 70.9 (53.8 to 87.9) | <0.001 | |||
| Carbohydrate, % Kcal | Intervention | 58.7 ± 3.5 | 49.3 ± 4.0 | 9.5 (7.4 to 11.6) | <0.001 | −3.6 (−6.9 to −0.3) | 0.03 |
| Control | 56.9 ± 4.2 | 51.1 ± 6.4 | 5.8 (2.2 to 9.4) | 0.003 | |||
| Protein, g | Intervention | 69.3 ± 16.3 | 72.6 ± 14.2 | −3.3 (−8.8 to 2.2) | 0.22 | 2.3 (7.4 to −11.9) | 0.64 |
| Control | 71.4 ± 14.0 | 76.9 ± 11.7 | −5.6 (−13.9 to 2.9) | 0.18 | |||
| Protein, % Kcal | Intervention | 14.4 ± 1.6 | 18.6 ± 2.3 | −4.2 (−5.4 to −2.9) | <0.001 | −0.5 (−2.1 to 1.1) | 0.78 |
| Control | 15.0 ± 3.5 | 19.7 ± 2.5 | −4.7 (−6.0 to −2.4) | <0.001 | |||
| Fat, g | Intervention | 52.3 ± 7.8 | 54.0 ± 10.9 | −1.7 (−4.1 to 0.6) | 0.13 | 7.8 (1.7 to 13.9) | 0.04 |
| Control | 58.7 ± 14.5 | 52.7 ± 15.1 | 6.1 (−1.7 to 13.8) | 0.11 | |||
| Fat, % Kcal | Intervention | 24.9 ± 1.7 | 30.9 ± 2.6 | −6.0 (−7.2 to −4.8) | <0.001 | 3.7 (1.4 to 6.0) | 0.05 |
| Control | 27.1 ± 4.7 | 29.4 ± 7.7 | −2.2 (−6.4 to 1.9) | 0.27 | |||
| Glycaemic index | Intervention | 72.6 ± 4.5 | 42.9 ± 4.1 | 29.8 (27.6 to 31.9) | <0.001 | −10.0 (−13.1 to −6.9) | 0.006 |
| Control | 71.0 ± 5.0 | 51.3 ± 4.5 | 19.7 (17.3 to 22.2) | <0.001 | |||
| Glycaemic load | Intervention | 126.3 ± 11.8 | 78.3 ± 4.1 | 48.0 (42.5 to 53.5) | <0.001 | −19.9 (−29.0 to −10.7) | 0.008 |
| Control | 123.9 ± 12.4 | 95.8 ± 8.7 | 28.1 (20.4 to 35.9) | <0.001 | |||
| Variable | Intervention (Mean ± SD) | Control (Mean ± SD) | between-Group Differences, Mean (95% CI) | p-Value |
|---|---|---|---|---|
| Total energy intake, kcal | 1362 ± 127 | 1143 ± 163 | 219 (198 to 240) | < 0.001 |
| Carbohydrate, % kcal | 47.6 ± 3.71 | 44.3 ± 4.18 | 3.3 (0.7 to 5.9) | 0.009 |
| Protein, % kcal | 19.3 ± 2.1 | 21.7 ± 3.4 | −2.4 (−4.3 to −0.5) | 0.04 |
| Fat, % kcal | 32.1 ± 3.5 | 32.4 ± 6.7 | −0.3 (−2.7 to 2.1) | 0.37 |
| Glycaemic index | 44.7 ± 4.9 | 55.4 ± 4.4 | −10.7 (−15.8 to −5.6) | 0.004 |
| Glycaemic load | 85 ± 12.9 | 102 ± 17.6 | −17 (−24.8 to −9.2) | 0.003 |
| Variable | Group | (Mean ± SD) | within-Group Differences, Mean (95% CI) | a p-Value | between-Group Differences, Mean (95% CI) | b p-Value | |
|---|---|---|---|---|---|---|---|
| Baseline | Post-Intervention | ||||||
| Weight, kg | Intervention | 77.3 ± 10.4 | 74.3 ± 11.3 | 3.1 (2.3 to 3.8) | <0.001 | −0.8 (−1.4 to −0.2) | 0.03 |
| Control | 78.3 ± 12.6 | 76 ± 13.1 | 2.3 (1.5 to 3.0) | <0.001 | |||
| BMI, kg/m2 | Intervention | 29.3 ± 3.7 | 28.1 ± 3.9 | 1.2 (0.9 to 1.4) | <0.001 | −0.2 (−0.6 to 0.2) | 0.09 |
| Control | 29.9 ± 7.2 | 28.9 ± 6.8 | 0.9 (0.6 to 1.2) | <0.001 | |||
| Fat mass, kg | Intervention | 29.8 ± 6.9 | 27.0 ± 7.5 | 2.8 (2.1 to 3.3) | <0.001 | −0.7 (−1.1 to −0.3) | 0.04 |
| Control | 29.7 ± 14.7 | 27.7 ± 14.4 | 2 (1.4 to 2.7) | <0.001 | |||
| Fat mass, % | Intervention | 38.7 ± 7.8 | 36.5 ± 8.4 | 2.2 (1.6 to 2.7) | <0.001 | −0.6 (−1.3 to 0.1) | 0.07 |
| Control | 36.8 ± 11.7 | 35.2 ± 12.0 | 1.6 (1 to 2.1) | <0.001 | |||
| Muscle mass, kg | Intervention | 44.8 ± 9.6 | 44.5 ± 9.4 | 0.3 (0.1 to 0.6) | 0.01 | −0.2 (−0.5 to 0.2) | 0.22 |
| Control | 48.4 ± 8.8 | 48.3 ± 8.9 | 0.1 (−0.1 to 0.2 | 0.19 | |||
| Visceral fat rating | Intervention | 9.5 ± 2.6 | 9.2 ± 2.8 | 0.3 (−0.1 to 0.6) | 0.07 | −0.2 (−0.5 to 0.2) | 0.06 |
| Control | 9.3 ± 3.3 | 9.2 ± 3.1 | 0.1 (−0.1 to 0.3) | 0.08 | |||
| Variable | Groups | Baseline (Mean ± SD) | Post-Intervention (Mean ± SD) | within-Group Differences, Mean (95% CI) | a p-Value | between-Group Differences, Mean (95% CI) | b p-Value |
|---|---|---|---|---|---|---|---|
| Fasting plasma glucose, mmol/L | Intervention | 5.0 ± 0.5 | 4.7 ± 0.3 | 0.3 (0.1 to 0.5) | 0.04 | −0.1 (−0.4 to −0.2) | 0.04 |
| Control | 4.8 ± 0.3 | 4.7 ± 0.4 | 0.1 (−0.1 to 0.3) | 0.11 | |||
| HbA1c, % | Intervention | 5.2 ± 0.3 | 5.0 ± 0.3 | 0.2 (0.1 to 0.5) | 0.03 | −0.1 (−0.1 to 0.1) | 0.07 |
| Control | 5.2 ± 0.6 | 5.1 ± 0.3 | 0.1 (0.2 to 0.4) | 0.04 | |||
| Fasting plasma insulin, pmol/L | Intervention | 12 ± 6.4 | 10.6 ± 6.5 | 1.4 (−1 to 2.8) | 0.22 | −0.3 (−3.1 to 2.7) | 0.52 |
| Control | 9.5 ± 4.4 | 8.4 ± 5.2 | 1.1 (−0.8 to 3.1) | 0.24 | |||
| HOMA-IR | Intervention | 2.5 ± 1.4 | 2.2 ± 1.4 | 0.3 (−0.2 to 0.9) | 0.18 | −0.1 (−0.7 to 0.6) | 0.27 |
| Control | 1.9 ± 0.9 | 1.7 ± 1 | 0.2 (−0.1 to 0.7) | 0.17 | |||
| Total cholesterol, mmol/L | Intervention | 4.9 ± 1.2 | 4.6 ± 1.2 | 0.3 (0.1 to 0.7) | 0.03 | −0.2 (−0.7 to −0.3) | 0.04 |
| Control | 4.7 ± 0.9 | 4.6 ± 0.8 | 0.1 (−0.7 to 1.3) | 0.11 | |||
| HDL cholesterol, mmol/L | Intervention | 1.2 ± 0.3 | 1.5 ± 0.4 | −0.3 (−0.7 to −0.1) | 0.01 | −0.2 (−0.6 to −0.2) | 0.03 |
| Control | 1.1 ± 0.2 | 1.2 ± 0.3 | −0.1 (−0.1 to 0.1) | 0.08 | |||
| LDL cholesterol, mmol/L | Intervention | 3.1 ± 0.7 | 2.8 ± 0.8 | 0.3 (0.1 to 0.5) | 0.01 | −0.1 (−0.1 to 0.1) | 0.28 |
| Control | 2.9 ± 0.8 | 2.8 ± 0.7 | 0.1 (0.4 to 0.6) | 0.03 | |||
| Triglycerides, mmol/L | Intervention | 1.1 ± 0.7 | 0.9 ± 0.7 | 0.2 (−0.1 to 3) | 0.35 | −0.1 (−0.1 to 0.1) | 0.36 |
| Control | 0.9 ± 0.3 | 0.8 ± 0.4 | 0.1 (−0.1 to 0.1) | 0.39 | |||
| Total/HDL ratio | Intervention | 4.9 ± 0.9 | 4.6 ± 0.8 | 0.3 (0.1 to 0.5) | 0.01 | −0.2 (−0.3 to 0.1) | 0.04 |
| Control | 4.7 ± 0.8 | 4.6 ± 0.8 | 0.1 (−0.2 to 0.4) | 0.09 |
Publisher’s Note: MDPI stays neutral with regard to jurisdictional claims in published maps and institutional affiliations. |
© 2022 by the authors. Licensee MDPI, Basel, Switzerland. This article is an open access article distributed under the terms and conditions of the Creative Commons Attribution (CC BY) license (https://creativecommons.org/licenses/by/4.0/).
Share and Cite
Chekima, K.; Noor, M.I.; Ooi, Y.B.H.; Yan, S.W.; Jaweed, M.; Chekima, B. Utilising a Real-Time Continuous Glucose Monitor as Part of a Low Glycaemic Index and Load Diet and Determining Its Effect on Improving Dietary Intake, Body Composition and Metabolic Parameters of Overweight and Obese Young Adults: A Randomised Controlled Trial. Foods 2022, 11, 1754. https://doi.org/10.3390/foods11121754
Chekima K, Noor MI, Ooi YBH, Yan SW, Jaweed M, Chekima B. Utilising a Real-Time Continuous Glucose Monitor as Part of a Low Glycaemic Index and Load Diet and Determining Its Effect on Improving Dietary Intake, Body Composition and Metabolic Parameters of Overweight and Obese Young Adults: A Randomised Controlled Trial. Foods. 2022; 11(12):1754. https://doi.org/10.3390/foods11121754
Chicago/Turabian StyleChekima, Khadidja, Mohd Ismail Noor, Yasmin Beng Houi Ooi, See Wan Yan, Mohammad Jaweed, and Brahim Chekima. 2022. "Utilising a Real-Time Continuous Glucose Monitor as Part of a Low Glycaemic Index and Load Diet and Determining Its Effect on Improving Dietary Intake, Body Composition and Metabolic Parameters of Overweight and Obese Young Adults: A Randomised Controlled Trial" Foods 11, no. 12: 1754. https://doi.org/10.3390/foods11121754
APA StyleChekima, K., Noor, M. I., Ooi, Y. B. H., Yan, S. W., Jaweed, M., & Chekima, B. (2022). Utilising a Real-Time Continuous Glucose Monitor as Part of a Low Glycaemic Index and Load Diet and Determining Its Effect on Improving Dietary Intake, Body Composition and Metabolic Parameters of Overweight and Obese Young Adults: A Randomised Controlled Trial. Foods, 11(12), 1754. https://doi.org/10.3390/foods11121754


