Article

Investigation on the Microbial Diversity of Fresh-Cut Lettuce during Processing and Storage Using High Throughput Sequencing and Their Relationship with Quality

1
Institute of Agri-food Processing and Nutrition, Beijing Key Laboratory of Agricultural Products of Fruits and Vegetables Preservation and Processing, Key Laboratory of Vegetable Postharvest Processing, Ministry of Agriculture and Rural Affairs, Beijing Academy of Agriculture and Forestry Sciences, Beijing 100097, China
2
Institute of Quality Standard and Testing Technology, Beijing Academy of Agriculture and Forestry Sciences, Beijing 100097, China
*
Author to whom correspondence should be addressed.
These authors contributed equally to this work.
Foods 2022, 11(12), 1683; https://doi.org/10.3390/foods11121683
Submission received: 12 May 2022 / Revised: 4 June 2022 / Accepted: 6 June 2022 / Published: 8 June 2022
(This article belongs to the Special Issue New Insight in Microbial Diversity and Genomic in Foods)

Abstract

:
Microbial community distribution in vegetables can affect their quality. This study analyzed the distribution of the microbial community at various stages during processing and storage with the microbial diversity analysis, and evaluated the correlation between the dominant bacteria and sensory quality of lettuce using correspondence analysis with multiple regression analysis. Results showed that the process of washing, cutting, then disinfection and dewatering could change the community distribution and dominant bacteria in lettuce, and maintain better texture, morphology, aroma, color qualities of lettuce. The total number of colonies and relative abundance of Xanthomonas in fresh-cut lettuce decreased, while Afipia and Ralstonia increased during processing and pre-storage (storage for 6 h, 12 h and 1 d). After storage for 3 d, the total number of colonies in lettuce increased (more than 5 log CFU/g), especially the relative abundance of Pseudomonas, which led to the obvious deterioration of the sensory quality of lettuce. Throughout the process, the number of Bacillus cereus, Staphylococcus aureus, and E. coli was less than 100 CFU/g and 3 MPN/g. The number of typical pathogenic bacteria, Salmonella, Listeria monocytogenes and E. coli O157:H7, was below the detection limit. Overall, the prevention and control of psychrotrophic Pseudomonas in lettuce was still necessary. These results will provide useful information for the fresh-cut lettuce industry.

1. Introduction

Fresh-cut lettuce is a leafy vegetable that is widely consumed in the world. It is commonly eaten raw because of its refreshing taste and high nutritional value; therefore, the safety of fresh-cut lettuce has attracted great attentions from people [1]. The process of fresh-cut lettuce includes: removing the damage, cleaning, cutting, disinfection, dewatering, packaging and storing; every step in the processing may affect the microbial community distribution in lettuce [2,3]. Research has shown that the steps of removing the damage and cleaning can reduce the microorganisms on the surface of fresh-cut lettuce, and can also change their community distribution. Holvoet et al. found that the washing step would disperse or introduce microorganisms on fresh-cut produce [4]. Frimpong et al. found that the cutting step may increase the proportion of Bacillus cereus and Cronobacter sakazakii in lettuce [5]. This may be because the pressure difference between the vegetables and the water produced by fresh-cut lettuce under low temperature processing conditions may allow the pathogens in the water to internalize into the tissues of the vegetable [6]. Studies have shown that disinfection, dewatering, packaging and low-temperature treatment can reduce the growth and proliferation of microorganisms and improve the microbial safety of lettuce [7,8,9]. However, the correlation between the distribution and change of the microbiota and the quality of fresh-cut lettuce at various stages during processing and storage has not been reported.
Microbial contamination is one of the main factors leading to the decline in quality of fresh-cut lettuce after processing; moreover, the microbial diversity of fresh-cut lettuce may cause inconsistent quality in the lettuce [10]. For example, the lipopeptide produced by Pseudomonas strains can promote cell-wall-degrading enzymes to the plant surface, leading to the spoilage of leafy vegetables [11]. Spoilage microorganisms secrete lytic enzymes, which cleave the linkages of the plant cellulose–hemicellulose network and pectin, thereby weakening the plant cell wall. Lipase is used to degrade lipid constituents of plants [12,13]. Plant proteins and proteinaceous materials are degraded into polypeptides and amino acids, and starch is broken down into maltose by amylase, which eventually lead to spoilage of vegetables [14]. However, the dominant populations for contamination on lettuce are not known and clarifying which microorganisms infect fresh-cut lettuce at what stage during processing and storage, contributing to the quality decline, will provide useful information for the development of control methods.
Traditional culture approaches are difficult to isolate due to unculturable microorganisms meaning the results do not reflect complete bacterial information. Culture-independent high-throughput sequencing (HTS) technology is used to analyze the microbial diversity in food and provide information about the microbial community structures. This methodology unveiled the microbial community diversity and dominant genera in industrial Zhacai paocai and disinfected lettuce [15,16].
To our best knowledge, there is no report on whether processing and cold storage can positively regulate the community distribution in fresh-cut lettuce and affect the sensory quality of fresh-cut lettuce. The purpose of this study was to understand the dynamics of complex microbial communities, and to identify the corresponding dominant bacteria that may lead to improved hygiene strategies to reduce the risk of microbial contamination during fresh-cut lettuce processing and cold storage. Revealing the relationship between the dominant genera and the decline in the quality of lettuce will make a greater contribution to the safety control of the final processing of lettuce.

2. Materials and Methods

2.1. Lettuce Samples and Processing

Green leaf lettuces (Lactuca sativa Var. Crispa L.) were obtained from Guoxiangsiyi market (Zhanghua Road, Beijing, China) on the day of the experiment and put into a sterile sampling bag (20 × 32 cm in size). Then, they were immediately transported to the laboratory, retained and marked as fresh (F). Lettuces were stored in a cold room at 4 °C for precooling, followed by processing. Lettuces had their outer leaves removed and the inner leaves were rinsed under distilled water for 30 s to remove the soil (W). Stems of the lettuce were cut off and the remaining lettuces were then cut into two halves with a kitchen knife. Lettuces were then disinfected with 100 ppm and 50 ppm sodium hypochlorite (adjusted to pH 6.5 with citric acid) for 2 min, respectively. The lettuces were rinsed again with distilled water and the obtained samples were dewatered using an automatic spinner. Then, they were retained and marked as cut, disinfected and dewatered (CD). Finally, lettuces were placed into polyethylene plastic bags (42.8 cm × 29.1 cm × 4.25 μm) and sealed. The parameters of the polyethylene plastic bag were that they had an oxygen transmission rate of 1113.66 cm3/m2 24 h 0.1 MPa and a carbon dioxide transmission rate of 3669.42 cm3/m2 24 h 0.1 MPa. Samples weighed approximately 200 g per bag. Samples were stored at 4 °C for 8 days, then samples of 6 h, 12 h, 1 d, 2 d, 3 d, 4 d, 6 d and 8 d were used for subsequent sensory and microbiological diversity analyses, as well as colony counts (retained and marked as s6h, s12h, s1d, s2d, s3d, s4d, s6d and s8d, respectively).

2.2. DNA Isolation and Illumina MiSeq Sequencing Analysis

Illumina MiSeq sequencing analyses were detected by Majorbio Bio-Pharm Technology Co., Ltd. (Shanghai, China). Each lettuce sample was mixed and divided into four even parts, samples were frozen into powder with liquid nitrogen and stored in a −80 °C refrigerator (902-ULTS, Thermo Electron Co., Waltham, MA, USA). The powder (1 g) was weighed and the total genomic DNA was extracted using the FastDNA SPIN Kit for soil (MP Biomedicals, Solon, OH, USA) according to the manufacturer’s instructions. The DNA extract was checked on 1% agarose gel, and DNA concentration and purity were performed using a NanoDrop 2000 UV-vis spectrophotometer (Thermo Scientific, Wilmington, NC, USA). The bacterial 16S rRNA genes were amplified with primer pairs 338 F (5′-ACTCCTACGGAGGCAGCAG-3′) and 806 R (5′-GGACTACHVGGGTWTCTAAT-3′) by an ABI GeneAmp® 9700 PCR thermocycler (ABI, Waltham, MA, USA). The expected size of the amplicon is 750 bp. The PCR amplification of 16S rRNA gene was performed as follows: initial denaturation at 95 °C for 3 min, followed by 35 cycles of denaturing at 95 °C for 30 s, annealing at 55 °C for 30 s and extension at 72 °C for 45 s, single extension at 72 °C for 10 min, and end at 10 °C. The PCR mixtures contained 5× FastPfu buffer 4 μL, 2.5 mM dNTPs 2 μL, forward primer (5 μM) 0.8 μL, reverse primer (5 μM) 0.8 μL, FastPfu polymerase 0.4 μL, BSA 0.2 μL, template DNA 10 ng and, finally, ddH2O up to 20 μL. PCR reactions were performed in triplicate. The PCR product was extracted from 2% agarose gel and purified using the AxyPrep DNA Gel Extraction Kit (Axygen Biosciences, Union City, CA, USA) according to the manufacturer’s instructions, and quantified using QuantusTM Fluorometer (Promega, San Diego, CA, USA). Purified amplicons were pooled in equimolar amounts and paired-end sequenced on an Illumina MiSeq PE300 platform/NovaSeq PE250 platform (Illumina, San Diego, CA, USA) according to the standard protocols by Majorbio Bio-Pharm Technology Co., Ltd. (Shanghai, China); the depth of each sample was at least 30,000 sequences.

2.3. Processing of Sequencing Data

The raw 16S rRNA gene sequencing reads were demultiplexed, quality-filtered by fastp version 0.20.0 [17] and merged by FLASH version 1.2.7 [18] with the following criteria: (i) the 300 bp reads were truncated at any site receiving an average quality score of <20 over a 50 bp sliding window, the truncated reads shorter than 50 bp were discarded, and reads containing ambiguous characters were also discarded; (ii) only overlapping sequences longer than 10 bp were assembled according to their overlapped sequence. The maximum mismatch ratio of the overlap region is 0.2. Reads that could not be assembled were discarded; (iii) Samples were distinguished according to the barcode and primers, and the sequence direction was adjusted, requiring exact barcode matching and a 2 nucleotide mismatch in primer matching.
Operational taxonomic units (OTUs) with a 97% similarity cutoff were clustered using UPARSE version 7.1 [19,20], and chimeric sequences were identified and removed. The taxonomy of each OTU representative sequence was analyzed by RDP Classifier version 2.2 [21] against the 16S rRNA database (e.g., Silva v138) using a confidence threshold of 0.7. The microorganism community composition of the samples was mainly based on the results of the OTU, the community structure was classified to the genus level, and the dominant species at the genus level were compared to reflect the differences in species richness.

2.4. Microbiological Analysis

Lettuces (25 g) were put into a sterile bag (S05D, Land Bridge Technology Co., Ltd., Beijing, China) and mixed with 225 mL PBS using a beating homogenizer (BagMixer 400 W, Interscience Lab Inc., Lyon, France) for 5 min. The homogenized solution (1 mL) was serially diluted at a ratio of 1:10 with PBS. Next, 0.1 mL of the diluted suspensions was spread flat on plant count agar and incubated at 37 °C for 48 h for the total number of colonies [22]. MYP (mannitol–egg yolk–polymyxine) agar was used to count Bacillus cereus colonies and inoculated at 35 °C for 24 h [23]. Xylose lysine deoxycholate agar (Difco) and Baird-Parker agar (Difco) were inoculated at 35 °C for 24 h for the enumeration of Salmonella and Staphylococcus aureus, respectively [24]. Palcam agar was inoculated at 30 °C for 48 h for the enumeration of Listeria monocytogenes [25]. MacConkey agar supplemented with 2.5 mg/L potassium tellurite solution and 0.05 mg/L cefixime (Land Bridge Technology Co., Ltd., Beijing, China) and was incubated at 37 °C for 24 h for E. coli O157:H7 colony counting [26]. Eosin methylene blue agar (EMBA) was incubated at 37 °C for 24 h for E. coli colony counting [27]. Sample dilutions were serially diluted in ten-fold increments using a peptone diluent (0.1%). Samples were analyzed to detect the most probable number (MPN) of bacteria according to the method in the bacteriological analytical manual [28].

2.5. Sensory Analysis

A panel of 15 sensory reviewers evaluated the sensory characteristics (appearance, color, texture and smell) of lettuces using the method of Park et al. with slight modifications [29]. Before performing sensory analysis, lettuces were put into sterile plastic boxes for sensory analysis with different treatments. All sensory evaluations were carried out in a room, with a total of 15 independent evaluation rooms. The evaluators were required to evaluate the sensory characteristics of the lettuces as per the following criteria (Table 1):

2.6. Statistical Analyses

Data were statistically analyzed with one-way analysis of variance using a general linear model in SPSS software 20.0 (IBM Corp., Armonk, NY, USA), and a 5% level of significant differences was determined using Duncan’s test. All experiments were replicated three times. The microbial diversity data were analyzed on the Illumina MiSeq PE300 platform/NovaSeq PE250 platform (Illumina, San Diego, CA, USA) and provided by Majorbio Bio-pharm Technology Co., Ltd. (Shanghai, China). Species taxonomy annotation was performed on OTUs, and the corresponding abundance information of each OTU annotation result was counted in each sample. Sobs index was a measure of estimating the microbial alpha diversity in the sample; a higher Sobs index value represents higher microbial diversity [30]. Principal component analysis (PCA) was used to assess microbial beta diversity, and classified at the genus level. The closer the distance between samples in the figure, the more similar the microbial compositions in the samples were. Information on the 50 most abundant species was clustered using OTU and a heatmap chart was created. RDA/CCA combined correspondence analysis with multiple regression analysis, and each step of the calculation was regressed with environmental factors (sensory quality scores and colony count) to reflect the relationship between the bacteria and environmental factors. RDA was based on a linear model and CCA was based on a unimodal model. Analysis can detect the relationship between environmental factors, samples, bacteria, or the relationship between the two.

3. Results

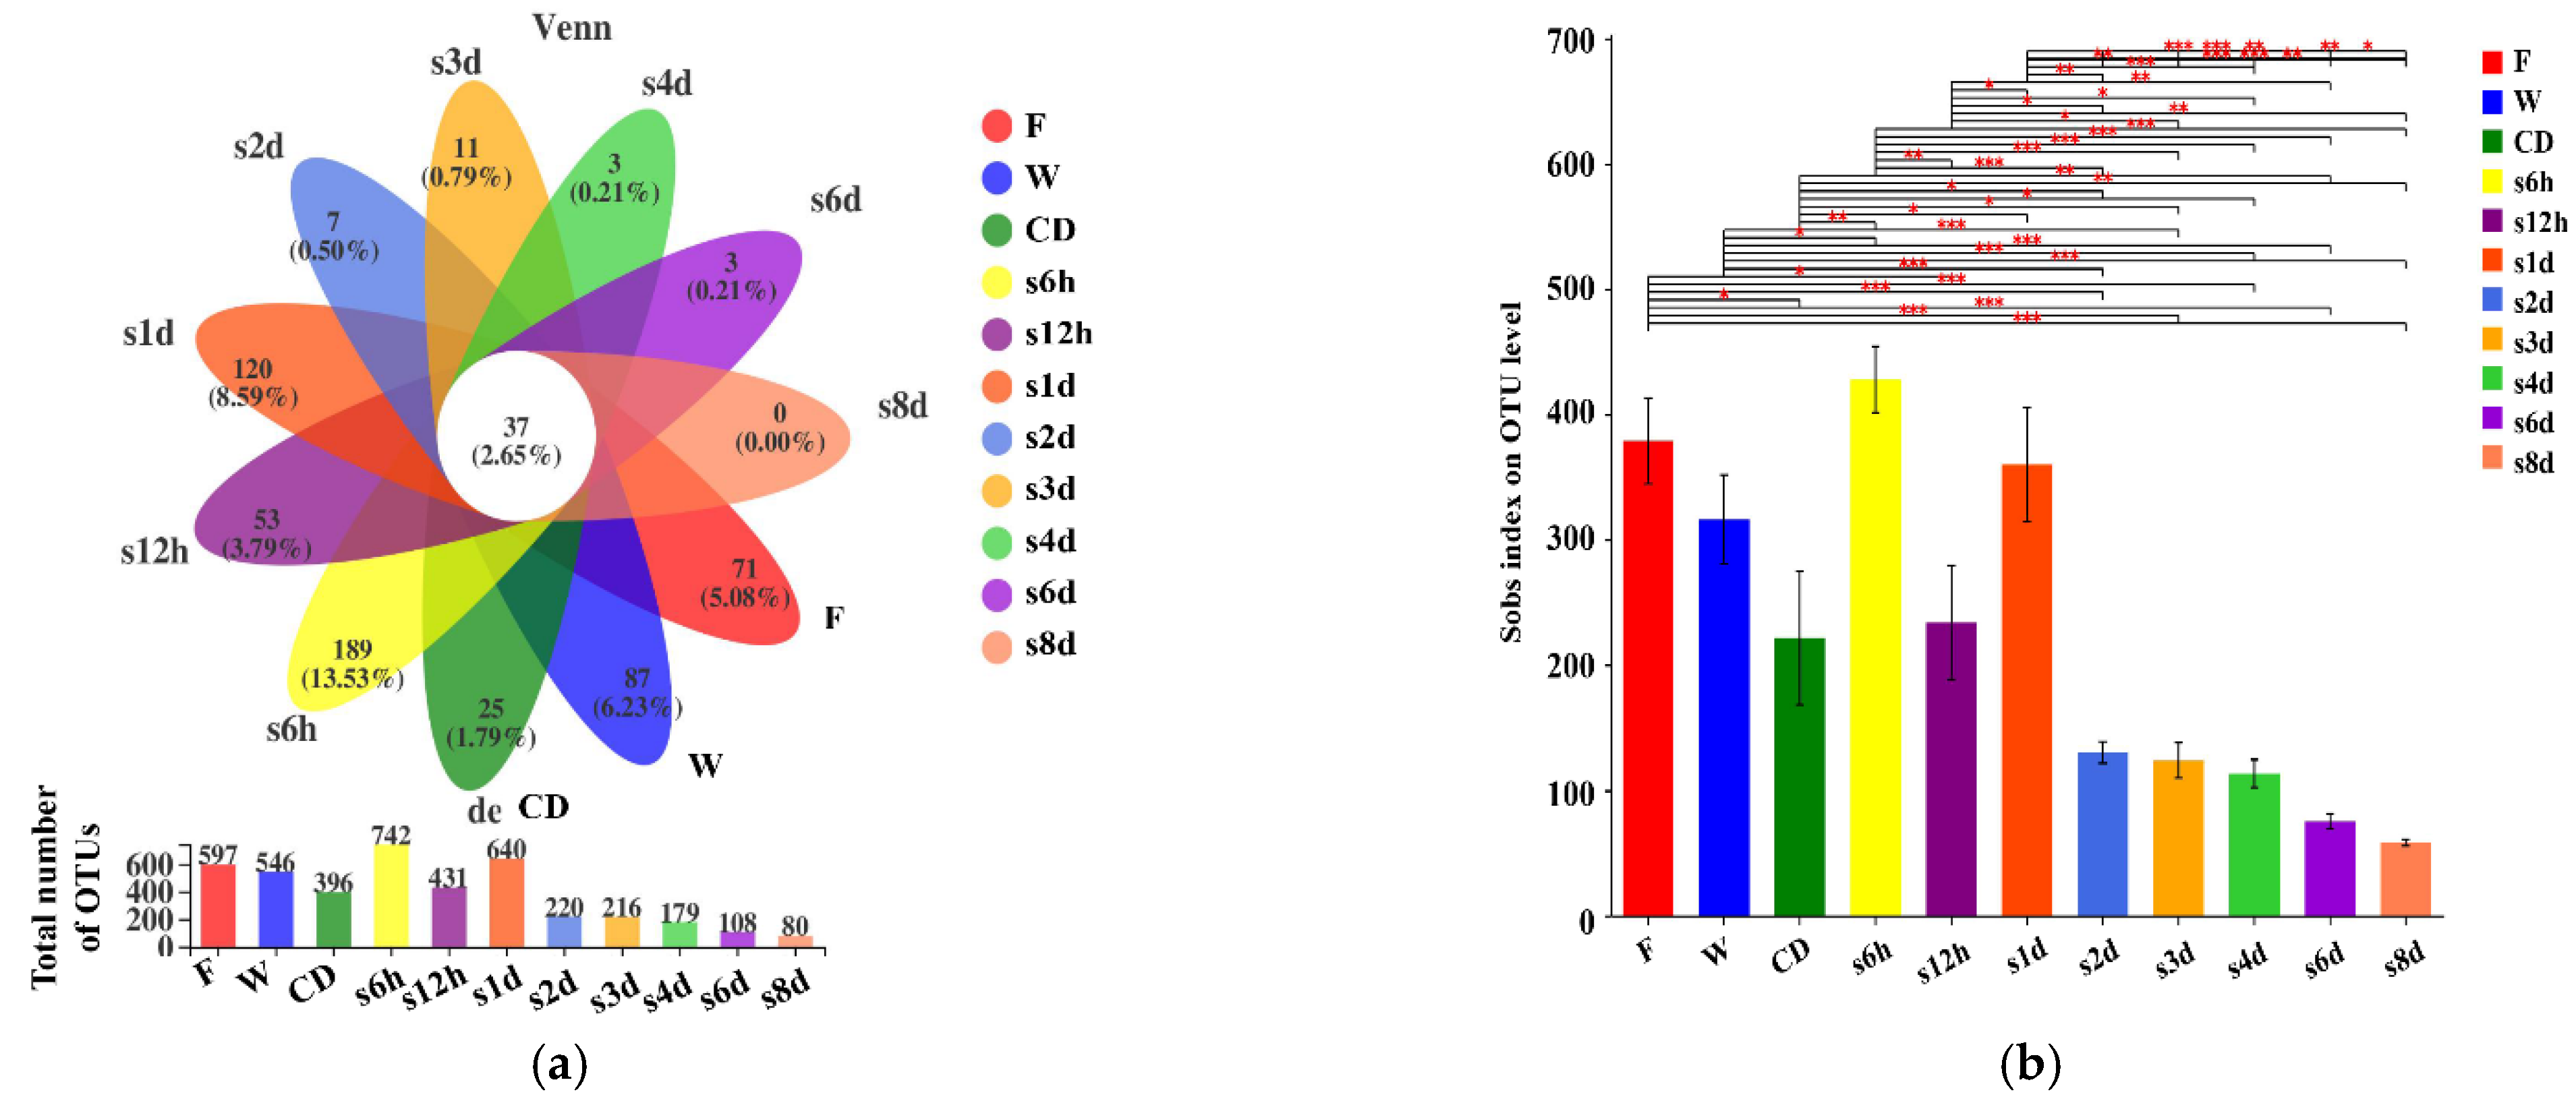
3.1. Sequencing Output

A total of 11 groups (33 samples) of mixed microorganisms in lettuce were collected from various stages of processing and storage. All samples met quality inspection standards. A total of 2,380,519 valid sequences were generated from a total of 33 bacterial DNA samples in lettuce and 1,887,633 high-quality sequences remained for analysis after screening and optimization. From the sequencing samples of the processing (fresh, washed, cut, then disinfected and dewatered) and storage (storage for 6 h, 12 h, 1 d, 2 d, 3 d, 4 d, 6 d and 8 d) groups, 514,809 and 1,372,824 high-quality sequences were obtained, respectively. The average quantity of high-quality sequences from all samples was 171,603 [(514,809 + 1,372,824)/11]. This indicated that the sequencing data was sufficient to reflect the microbial community contained in the sample. Sequence OTU clustering and notation were performed on the quality sequences at a 3% divergence level (Table 2). The taxonomic annotations of the species in the samples and the corresponding abundance information in each sample can be seen from the table. More than 400 OTUs were identified in lettuce samples using 16S rDNA sequencing, which is different from previous results of spinach studies. Researchers identified more OTUs (more than 600 OTUs) in spinach samples than in lettuce [31]. This indicated that there are differences in the abundance of microorganisms in different vegetables.
The OTU distribution of samples was shown in a Venn diagram (Figure 1a). There was a total of 606 types (71 + 0 + 3 + 3 + 11 + 7 + 120 + 53 + 189 + 25 + 87 + 37) of OTU in the 11 groups, with 37 OTUs shared among groups. In general, the total number of OTUs in the lettuce samples of fresh-cut and storage was lower than in fresh lettuce, and gradually decreased with the prolongation of storage time. This suggested that there were similarities in the microbial composition among samples, and processing and storage treatments can reduce the relative abundance of bacteria in the lettuce. The comparison of Sobs index for the 11 groups was shown in Figure 1b. The Sobs indices of the samples from storage groups were significantly lower than that of the raw material and the processing groups, except for the samples of pre-storage (6 h, 12 h and 1 d). This indicated a lower microbial diversity in the storage samples. This may be because the interstitial fluid overflow of lettuce, caused by the cutting treatment (disinfection and dewatering after cutting), as the hydrogen peroxide in the exudate causes temporary damage or inactivation of the microorganisms, and the disinfection process further reduced the number of cells [32]. After a period of storage, the passivated bacteria grow slowly again. The number of dominant bacteria increased, but the relative abundance of bacteria decreased [6,33,34]. After storage for 2 days, the number of microorganisms in the lettuce began to decrease, and gradually decreased with the extension of the storage period. This because some microorganisms are not suitable for low temperature growth [9].

3.2. Bacterial Compositions of Fresh-Cut Lettuce

The samples showed a high abundance at the genus level (Figure 2a). A total of six microorganism phyla and 21 microorganism species were found in 11 groups of samples, the microorganism phyla include: Proteobacteria, Actinobacteriota, Firmicutes, Bacteroidota, Cyanobacteria, and Patescibacteria. The dominant genus of fresh samples belonged to the Xanthomonas (84.55%) of the phylum Bacteroides. Studies have shown that Xanthomonas is a plant pathogen [35], and it could cause bacterial leaf spot of leafy vegetables, which would reduce the quality of lettuce and increase the possibility of loss after harvest, so to wash it away is beneficial [36]. Small amounts of Klebsiella and unclassified_o_Enterobacterales were also found in the lettuce samples, and this is consistent with the results analyzed in endive lettuce. The difference is that Pseudomonas, Pantoea and Afipia were also detected in the lettuce in this paper, while small amounts of Serratia marcescens, Acinetobacter, Morganella and Serratia were found in previous studies in endive lettuce [37]. For processing and pre-storage samples, the dominant genus belonged to the phylum Proteobacteria. The most dominant genus was Afipia (washing: 35.98%, s6h: 57.75%, s12h: 20.57%), Klebsiella (cutting then disinfection and dewatering: 49.44%) and Ralstonia (s1d: 11.61%), respectively. Oie et al. also detected the growth of Pseudomonas fluorescens and Pseudomonas aeruginosa on the vegetables [38]. Previous studies have shown that Pseudomonas is the main bacteria in the processing of endive lettuce. This is consistent with the finding in this research that Pseudomonas is the dominant bacteria in lettuce after dewatering [39]. Different from previous studies, the washing, cutting then disinfection and dewatering process in this paper reduced Xanthomonas in lettuce but did not remove Pseudomonas, and the relative abundance of Pseudomonas increased [40]. This may be because the washing treatment reduced the total number of colonies and more Xanthomonas, which increased the proportion of Pseudomonas. For post-storage samples, the OTU showed a low abundance. The dominant genus in most samples, except the 2 d sample (the dominant genus of 2 d samples was Pantoea), were similar, belonging to the Pseudomonas of the phylum Proteobacteria. However, the proportion of core genera showed a difference; the dominant genus changed from Afipia to Pseudomonas during storage. In general, the most abundant genus during processing and storage belongs to the phylum Proteobacteria, which is consistent with previous observation [41]. Researchers have shown that the relative abundance of bacteria changed along the processing chain and packaging storage time [42]. This study indicated that Pseudomonas was able to proliferate after acclimating to the environment in the later stage of storage. In addition to Pseudomonas, Pantoea and Klebsiella were also found in fresh-cut vegetables, which was consistent with previous findings from Efimochkina [43]. The difference was that the relative abundance of Afipia and Ralstonia was also detected to increase significantly after processing. They lettuce might have been contaminated by washing with water, which researchers reported as a potential source of Afipia and Ralstonia [44].
PCA of 33 samples in 11 groups is shown in Figure 2b. PCA results revealed that more variation was represented by the first principal coordinate axis (PC1) than the second axis (PC2) in samples. In terms of the differences in the distribution of PCA, the samples were distinctly grouped and the difference accounts for 67.73% of the total variation. The first principal component divided all samples into two groups, the fresh, washed and pre-storage (6 h, 12 h, 1 d) samples were divided into one group, and the cut, disinfected, and dewatered, and post-storage samples were divided into another group, indicating that they are relatively close to each other within the group. This result was consistent with the similarity of relative abundance among the samples in Figure 1a. The dominant genus in the washed lettuce was consistent with the samples stored for 6 h and 12 h, and the dominant genus after storage for 3d was consistent with the samples stored for 4 d, 6 d and 8 d.
Clustering results showed that the overall distribution of the dominant genera could be easily divided into group 1 (fresh), group 2 (washed and stored for 6 h, 12 h and 1 d) and group 3 (cut, then disinfected and dewatered, and stored for 2 d, 3 d, 4 d, 6 d and 8 d) (Figure 3). The samples from group 2 were relatively close in the cluster, and the same was true for the samples from group 3. The relative abundance of Burkholderia-Caballeronia-Paraburkholderia, Rhodococcus, Ralstonia, Bacillus and Pelomonas of group 2 were higher than for fresh lettuce. The relative abundance of most species (including Bacillus, Kocuria, Devosia, Brevundimonas, Pseudarthrobacter, Gemmatimonas, Exiguobacterium, Dietzia, Nocardioides, Flavobacterium, Allorhizobium-Neorhizobium, Enterococcus, Xanthomonas and Novibacillus) of group 3 decreased compare to fresh lettuce, but the relative abundance of Pseudomonas was higher than group 1 and group 2. This might be because the low-temperature cold storage environment prevented the survival of some bacteria.

3.3. Enumeration of Microorganisms from Lettuce

The total number of colonies in fresh samples exceeded 5 log CFU/g, reduced to approximately 4 log CFU/g after washing, cutting then disinfecting and dewatering (Table 3). At the beginning of storage, the total number of colonies at 6 h and 12 h was the lowest (about 3 log CFU/g), then it gradually increased after storage for 1 d. The total number of colonies in samples stored for 3 d, 4 d, 6 d and 8 d exceeded 5 log CFU/g. In all samples, the number of Bacillus cereus was less than 100 CFU/g, Staphylococcus aureus was less than 3 MPN/g, the number of E. coli was less than 3 MPN/g and the number of E. coli O157:H7, Salmonella and Listeria monocytogenes was below the detection limit. This may be because these foodborne pathogens, which are considered to have a significant impact on the fresh produce industry, were so low that they could not be detected. It may also be attributed to the bactericidal effect of the sodium hypochlorite disinfectant reducing the number of pathogenic bacteria, which studies have shown are unlikely to be disinfectant-resistant microbiota [45]. Although the relative abundance of Afipia, Burkholderia-Caballeronia-Paraburkholderia, Rhodococcus, Ralstonia, Bacillus and Pelomonas were higher than in fresh lettuce, the total number of colonies in lettuce after processing decreased. This indicated that the processing treatment effectively reduced the total number of colonies in the lettuce. The total number of colonies decreased further during storage, which might have been caused by the low temperature inhibiting the growth of some bacteria. The total number of colonies gradually increased after storage for 2 d, which might be caused by the growth of Pseudomonas.

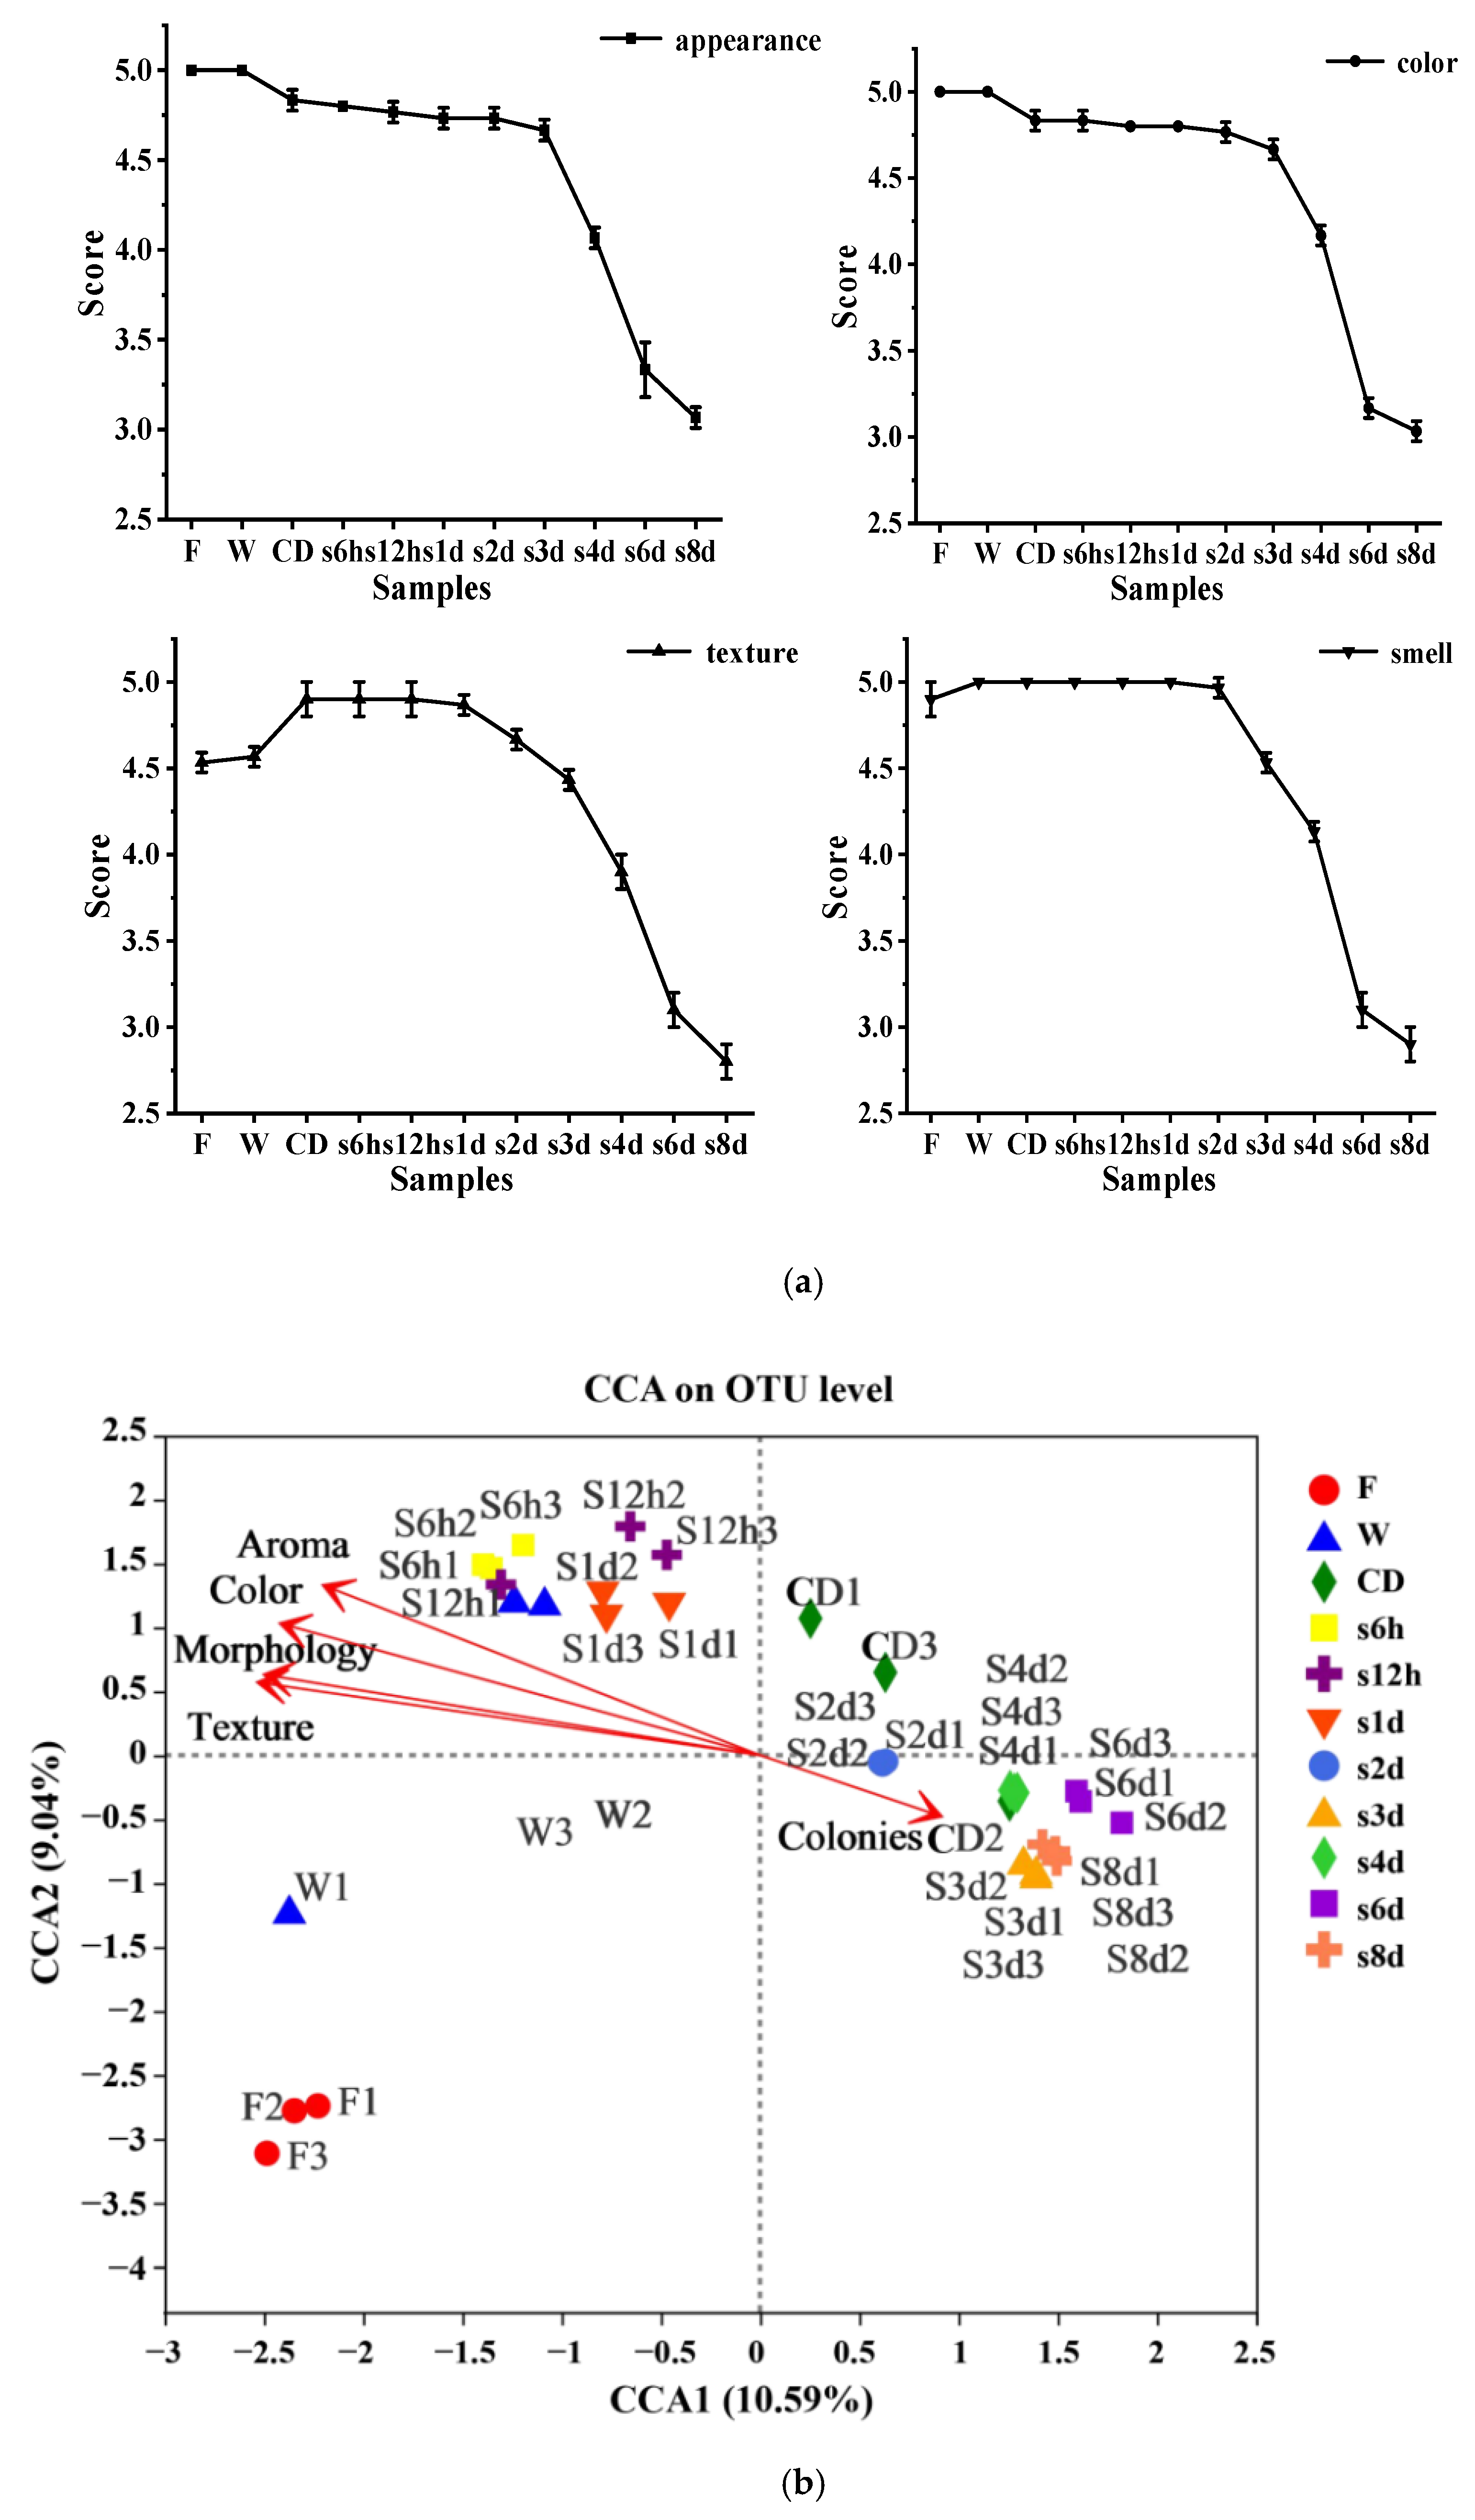
3.4. Sensory Quality Analysis

Fresh-cut lettuce was more likely to lose nutrients and water, causing a shrunken appearance, dimness of color, and smell deterioration during storage. Figure 4a showed the average profile of each sensory index (texture, morphology, aroma, color) of samples from different sampling points. The processed lettuce was the freshest, with the texture, morphology, aroma and color of fresh lettuce. After 3 d storage, the color and aroma of fresh-cut lettuce deteriorated further; the color was brown and there was a peculiar smell. After further storage, the sensory quality of lettuce continued to decline, the color was dim and the smell was unacceptable. The browning of lettuce may be the results of the enzymatic reaction in the vegetable. After cutting, the phenylalanine ammonia lyase (PAL) and peroxidase (POD) in the vegetable undergo dehydration and lignin synthesis, resulting in the color changes on the vegetable surface, off-flavor development and loss of firmness [46].
In order to determine the microbial diversity during processing and storage associated with sensory quality, a redundancy analysis (RDA) was performed for OTUs from the samples (Figure 4b). The total number of colonies and sensory quality were used as environmental variables, and the relative abundance of all OTUs in samples from different sampling points were used as species variables. Results showed that the sensory quality of the samples before storage for 1 day and processing was positively correlated with the predominant microbial bacteria, which might mean that the presence of Afipia and Ralstonia did not cause the sensory quality degradation of lettuce. However, there was a negative correlation between the sensory quality of samples after storage for 2 d and the predominant microbial bacteria, which might mean that the sensory quality of lettuce decreased with the presence of Pseudomonas. The higher the number of Pseudomonas, the worse the sensory quality of lettuce. This may be because the Pseudomonas is the most common psychrophilic species; they can produce enzymes that catalyze proteolysis and lipolysis reactions that contribute to the spoilage of refrigerated fresh produce, as well as pectolytic enzymes to degrade pectic substances of plant cell walls [41]. The presence of Pseudomonas promotes the degradation of the cell wall of lettuce and accelerates the degradation of the quality of lettuce [11]. Not only is it effective and important to take measures to control the total number of colonies, but the control of Pseudomonas is also more important.

4. Conclusions

The abundance and distribution of the bacteria changed during processing and storage. The abundance of bacteria in the processed and pre-storage (6 h, 12 h and 1 d) samples was high, and the relative abundance of bacteria in the post-storage samples was low. Washing could reduce the total colonies and Xanthomonas in the fresh lettuce, but it would also increase the risk of lettuce polluting microorganisms, Afipia and Ralstonia, from the water. With the extension of the low-temperature storage time, the total number of colonies increased and the dominant bacteria changed from Afipia to Pseudomonas. For the post-storage samples, the total number of colonies in the sample exceeded 5 log CFU/g, Bacillus cereus was less than 100 CFU/g, Staphylococcus aureus was less than 3 MPN/g, E. coli was less than 3 MPN/g, and E. coli O157:H7, Salmonella and Listeria monocytogenes were below the detection limit. Therefore, it is necessary to control and select the effective control method to reduce the number of total colonies and Pseudomonas in fresh-cut lettuce before storage for 1 d, and ultimately slow down the spoilage of fresh-cut lettuce. This study will provide guidance for the microbial control of fresh-cut lettuce.

Author Contributions

D.W. performed the conceptualization, funding acquisition and wrote the review editing. Y.S. and X.Z. wrote the original draft preparation and performed the investigation, methodology and statistical analysis. X.Z. provided funding acquisition. Y.M. organized the database. Z.M., Z.H., W.Z., P.W. and S.Z. performed the formal analysis. All authors have read and agreed to the published version of the manuscript.

Funding

This work was supported by the Scientific and Technological Innovation Ability Foundation of Beijing Academy of Agricultural and Forestry Sciences (KJCX20200208), the Collaborative Innovation Center of the Beijing Academy of Agricultural and Forestry Sciences (KJCX201915), the Special Training Program for Outstanding Scientists of the Beijing Academy of Agricultural and Forestry Sciences (JKZX202213), China Agriculture Research System of MOF and MARA (CARS-23).

Institutional Review Board Statement

Not applicable.

Informed Consent Statement

Not applicable.

Data Availability Statement

The data presented in this study are available on request from the corresponding author.

Conflicts of Interest

The authors declare no conflict of interest.

References

  1. Kim, M.J.; Moon, Y.; Tou, J.C.; Mou, B.; Waterland, N.L. Nutritional value, bioactive compounds and health benefits of lettuce (Lactuca sativa L.). J. Food Compos. Anal. 2016, 49, 19–34. [Google Scholar] [CrossRef]
  2. Rodriguez, F.P.; Campos, D.; Ryser, E.T.; Buchholz, A.L.; Posada-Izquierdo, G.D.; Marks, B.P.; Zurera, G.; Todd, E. A mathematical risk model for Escherichia coli O157:H7 cross-contamination of lettuce during processing. Food Microbiol. 2011, 28, 694–701. [Google Scholar] [CrossRef] [PubMed]
  3. Rochele, D.; Loiko, M.R.; Cheila, M.; Hessel, C.T.; Jacxsens, L.; Uyttendaele, M.; Bender, R.J.; ToNDO, E.C. Microbiological contamination linked to implementation of good agricultural practices in the production of organic lettuce in southern brazil. Food Control 2014, 42, 152–164. [Google Scholar]
  4. Holvoet, K.; Jacxsens, L.; Sampers, I.; Uyttendaele, M. Insight into the prevalence and distribution of microbial contamination to evaluate water management in the fresh produce processing industry. J. Food Prot. 2012, 75, 671–681. [Google Scholar] [CrossRef] [PubMed]
  5. Frimpong, G.K.; Kottoh, I.D.; Ofosu, D.O.; Larbi, D. Effect of gamma irradiation on microbial quality of minimally processed carrot and lettuce: A case study in greater accra region of ghana. Radiat. Phys. Chem. 2015, 110, 12–16. [Google Scholar] [CrossRef]
  6. Avila-Queza, G.; Gardea, A.A.; Acedo-Félix, E. Salmonella spp. And Escherichia coli: Survival and growth in plant tissue. N. Z. J. Crop Hortic. Sci. 2010, 38, 47–55. [Google Scholar] [CrossRef]
  7. Akeredolu, A. Microflora of three dehydrated vegetables. Br. Microbiol. Res. J. 2013, 3, 295–308. [Google Scholar] [CrossRef]
  8. Mukhopadhyay, S.; Sokorai, K.; Ukuku, D.O.; Jin, T.; Juneja, V. Effects of direct and in-package pulsed light treatment on inactivation of E. coli O157:H7 and reduction of microbial loads in romaine lettuce. LWT-Food Sci. Technol. 2020, 139, 110710. [Google Scholar] [CrossRef]
  9. Jin, K.K.; Harrison, M.A. Surrogate selection for Escherichia coli O157:H7 based on cryotolerance and attachment to romaine lettuce. J. Food Prot. 2009, 72, 1385–1391. [Google Scholar]
  10. Huang, K.; Wrenn, S.; Tikekar, R.; Nitin, N. Efficacy of decontamination and a reduced risk of cross-contamination during ultrasound-assisted washing of fresh produce. J. Food Eng. 2018, 224, 95–104. [Google Scholar] [CrossRef]
  11. Federico, B.; Pinto, L.; Quintieri, L.; Canto, A.; Calabrese, N.; Caputo, L. Efficacy of lactoferricin B in controlling ready-to-eat vegetable spoilage caused by Pseudomonas spp. Int. J. Food Microbiol. 2015, 215, 179–186. [Google Scholar] [CrossRef] [PubMed]
  12. Lee, D.H.; Kim, J.B.; Kim, M. Microbiota on spoiled vegetables and their characterization. J. Food Prot. 2013, 76, 1350–1358. [Google Scholar] [CrossRef] [PubMed]
  13. Lagaert, S.; Belin, T.; Volckaert, G. Plant cell walls: Protecting the barrier from degradation by microbial enzymes. Semin. Cell Dev. Biol. 2009, 20, 1064–1073. [Google Scholar] [CrossRef] [PubMed]
  14. Tournas, V.H. Spoilage of vegetable crops by bacteria and fungi and related health hazards. Crit. Rev. Microbiol. 2005, 31, 33–44. [Google Scholar] [CrossRef] [PubMed]
  15. Liang, H.; Chen, H.; Zhang, W.; Yu, C.; Ji, C.; Lin, X. Investigation on microbial diversity of industrial zhacai paocai during fermentation using high-throughput sequencing and their functional characterization. LWT-Food Sci. Technol. 2018, 91, 460–466. [Google Scholar] [CrossRef]
  16. Wang, J.; Tao, D.; Wang, S.; Li, C.; Li, Y.; Zheng, F.; Wu, Z. Disinfection of lettuce using organic acids: An ecological analysis using 16s rrna sequencing. RSC Adv. 2019, 9, 17514–17520. [Google Scholar] [CrossRef] [Green Version]
  17. Chen, S.; Zhou, Y.; Chen, Y.; Gu, J. Fastp: An ultra-fast all-in-one FASTQ preprocessor. Bioinformatics 2018, 34, 884–890. [Google Scholar] [CrossRef]
  18. Magoč, T.; Salzberg, S.L. FLASH: Fast length adjustment of short reads to improve genome assemblies. Bioinformatics 2011, 27, 2957–2963. [Google Scholar] [CrossRef]
  19. Edgar, R.C. UPARSE: Highly accurate OTU sequences from microbial amplicon reads. Nat. Methods 2013, 10, 996–998. [Google Scholar] [CrossRef]
  20. Stackebrandt, E.; Goebel, B.M. Taxonomic Note: A Place for DNA-DNA Reassociation and 16S rRNA Sequence Analysis in the Present Species Definition in Bacteriology. Int. J. Syst. Bacteriol. 1994, 44, 846–849. [Google Scholar] [CrossRef] [Green Version]
  21. Wang, Q.; Garrity, G.M.; Tiedje, J.M.; Cole, J.R. Naive Bayesian classifier for rapid assignment of rRNA sequences into the new bacterial taxonomy. Appl. Environ. Microbiol. 2007, 73, 5261–5267. [Google Scholar] [CrossRef] [PubMed] [Green Version]
  22. Fan, K.; Zhang, M.; Bhandari, B.; Jiang, F. A combination treatment of ultrasound and ε-polylysine to improve microorganisms and storage quality of fresh-cut lettuce. LWT-Food Sci. Technol. 2019, 113, 108315–108323. [Google Scholar] [CrossRef]
  23. Elhariry, H.M. Attachment strength and biofilm forming ability of Bacillus cereus on green-leafy vegetables: Cabbage and lettuce. Food Microbiol. 2011, 28, 1266–1274. [Google Scholar] [CrossRef] [PubMed]
  24. Shim, W.B.; Je, G.S.; Kim, K.; Mtenga, A.B.; Lee, W.G.; Song, J.U. Effect of irradiation on kinetic behavior of salmonella typhimurium and staphylococcus aureus in lettuce and damage of bacterial cell envelope. Radiat. Phys. Chem. 2012, 81, 566–571. [Google Scholar] [CrossRef]
  25. Kyere, E.O.; Foong, G.; Palmer, J.; Wargent, J.J.; Fletcher, G.C.; Flint, S. Rapid attachment of listeria monocytogenes to hydroponic and soil grown lettuce leaves. Food Control 2019, 19, 77–80. [Google Scholar] [CrossRef]
  26. Sun, Y.; Zhao, X.; Ma, Y.; Guan, H.; Wang, D. Inhibitory effect of modified atmosphere packaging on Escherichia coli O157:H7 in fresh-cut cucumbers (Cucumis sativus L.) and effectively maintain quality during storage. Food Chem. 2021, 369, 130969–130976. [Google Scholar] [CrossRef]
  27. Hendrayana, M.A.; Pinatih, K.; Yelly, A. Detection of bacteria Esherichia coli serotype O157 on pork from pork trader in denpasar city. Medicina 2013, 43, 3–8. [Google Scholar]
  28. FDA (U.S. Food and Drug Administration). Bacteriological Analytical Manual Online. 2010. Available online: http://www.fda.gov/Food/ScienceResearch/LaboratoryMethods/BacteriologicalAnalyticalManualBAM/default.htm (accessed on 11 July 2012).
  29. Park, S.; Elless, M.P.; Park, J.; Jenkins, A.; Hirschi, K.D. Sensory analysis of calcium-biofortified lettuce. Plant Biotechnol. J. 2008, 7, 106–117. [Google Scholar] [CrossRef] [Green Version]
  30. Li, Y.; Feng, J.; Zheng, L.; Huang, J.; Yang, Y.; Li, X. Intercropping with marigold promotes soil health and microbial structure to assist in mitigating tobacco bacterial wilt. J. Plant Pathol. 2020, 102, 731–742. [Google Scholar] [CrossRef]
  31. Gu, G.; Ottesen, A.; Bolten, S.; Ramachandran, P.; Reed, E.; Rideout, S.; Luo, Y.; Patel, J.; Brown, E.; Nou, X. Shifts in spinach microbial communities after chlorine washing and storage at compliant and abusive temperatures. Food Microbiol. 2018, 73, 73–84. [Google Scholar] [CrossRef]
  32. Wang, S.; Deng, K.; Zaremba, S.; Deng, X.; Lin, C.; Wang, Q.; Tortorello, M.L.; Zhang, W. Transcriptomic response of Escherichia coli O157:H7 to oxidative stress. Appl. Environ. Microbiol. 2009, 75, 6110–6123. [Google Scholar] [CrossRef] [PubMed] [Green Version]
  33. Wei, Q.; Wang, X.; Sun, D.W.; Pu, H. Rapid detection and control of psychrotrophic microorganisms in cold storage foods: A review. Trends Food Sci. Technol. 2019, 86, 453–464. [Google Scholar] [CrossRef]
  34. Taborosi, D.; Jenson, J.W.; Sánchez Collazo, M.; Zega, M. Availability, usage, and threats to freshwater resources on low carbonate islands in micronesia. Geophys. Res. Abstr. 2010, 12, 1–2. [Google Scholar]
  35. Dees, M.W.; Lysøe, E.; Nordskog, B.; Brurberg, M.B. Bacterial communities associated with surfaces of leafy greens: Shift in composition and decrease in richness over time. Appl. Environ. Microbiol. 2015, 81, 1530–1539. [Google Scholar] [CrossRef] [Green Version]
  36. Hayes, R.J.; Trent, M.A.; Mou, B.; Simko, I. Baby leaf lettuce germplasm enhancement: Developing diverse populations with resistance to bacterial leaf spot caused by xanthomonas campestris pv. vitians. Hortscience 2014, 49, 18–24. [Google Scholar] [CrossRef] [Green Version]
  37. Frhling, A.; Rademacher, A.; Rumpold, B.; Klocke, M.; Schlüter, O. Screening of microbial communities associated with endive lettuce during postharvest processing on industrial scale. Heliyon 2018, 4, 671–694. [Google Scholar] [CrossRef] [Green Version]
  38. Oie, S.; Kiyonaga, H.; Matsuzaka, Y.; Maeda, K.; Masuda, Y.; Tasaka, K.; Aritomi, S.; Yamashita, A.; Kamiya, A. Microbial contamination of fruit and vegetables and their disinfection. Biol. Pharm. Bull. 2008, 31, 1902–1905. [Google Scholar] [CrossRef] [Green Version]
  39. Gu, G.; Ottesen, A.; Bolten, S.; Wang, L.; Luo, Y.; Rideout, S.; Lyu, S.; Nou, X. Impact of routine sanitation on the microbiomes in a fresh produce processing facility. Int. J. Food Microbiol. 2019, 294, 31–41. [Google Scholar] [CrossRef] [Green Version]
  40. Randazzo, C.L.; Scifò, G.O.; Tomaselli, F.; Caggia, C. Polyphasic characterization of bacterial community in fresh cut salads. Int. J. Food Microbiol. 2009, 128, 484–490. [Google Scholar] [CrossRef]
  41. Nübling, S.; Schmidt, H.; Weiss, A. Variation of the pseudomonas community structure on oak leaf lettuce during storage detected by culture-dependent and -independent methods. Int. J. Food Microbiol. 2016, 216, 95–103. [Google Scholar] [CrossRef]
  42. Carli, M.D.; Rossi, P.D.; Paganin, P.; Fiore, A.D.; Lecce, F.; Capodicasa, C.; Bianco, L.; Perrotta, G.; Mengoni, A.; Bacci, G.; et al. Bacterial community and proteome analysis of fresh-cut lettuce as affected by packaging. FEMS Microbiol. Lett. 2016, 363, fnv209. [Google Scholar] [CrossRef] [PubMed] [Green Version]
  43. Efimochkina, N.R.; Bykova, I.B.; Batishcheva, S.I.; Minaeva, L.P.; Sheveleva, S.A. Study of microbial contamination of processed fresh vegetables and lettuce. Vopr. Pitan. 2014, 83, 33–42. [Google Scholar] [PubMed]
  44. Falcone-Dias, M.F.; Vaz-Moreira, I.; Manaia, C.M. Bottled mineral water as a potential source of antibiotic resistant bacteria. Water Res. 2012, 46, 3612–3622. [Google Scholar] [CrossRef] [PubMed]
  45. Gu, G.; Ottesen, A.; Bolten, S.; Luo, Y.; Rideout, S.; Nou, X. Microbiome convergence following sanitizer treatment and identification of sanitizer resistant species from spinach and lettuce rinse water-sciencedirect. Int. J. Food Microbiol. 2020, 318, 108458–108466. [Google Scholar] [CrossRef] [PubMed]
  46. Chisari, M.; Todaro, A.; Barbagallo, R.N.; Spagna, G. Salinity effects on enzymatic browning and antioxidant capacity of fresh-cut baby Romaine lettuce (Lactuca sativa L. cv. Duende). Food Chem. 2010, 119, 1502–1506. [Google Scholar] [CrossRef]
Figure 1. Venn diagram of OTU level among 11 groups (a). The petals are the number of species unique to the corresponding group, and the center is the number of species common to all groups. Sobs index of OTU level among 11 groups (b). The abscissa is the group name, and the ordinate is the exponential average of each group. The significant difference between the selected two groups of samples that with significant difference are marked, p ≤ 0.05 is marked as *, p ≤ 0.01 is marked as **, p ≤ 0.001 is marked as ***.
Foods 11 01683 g001
Figure 2. Community bar plot analysis of relative abundance percentage (%) of the bacterial genera in fresh-cut lettuce samples at each stage of processing and storage (a) and PCA analysis (b) on genus level.
Foods 11 01683 g002
Figure 3. Heatmap chart and clustering results of 50 most abundant bacterial genera in different samples.
Foods 11 01683 g003
Figure 4. The average profile of each sensory index in different samples (a) and redundant analysis (RDA/CCA) of the relationship between the 50 most abundant bacterial microbiota and sensory quality of cucumbers in different samples (b). RDA is based on a linear model, and CCA is based on a unimodal model.
Foods 11 01683 g004
Table 1. Sensory evaluation criteria for samples.
Description5 (Excellent)4 (Good)3 (Fair)2 (Poor)1 (Bad)
AppearanceFreshDehydratedSlightly water-soakedWater-soakedRotten
ColorFresh greenGreenSlightly darkDarkDark yellow
TextureCrispSlightly softSoftWilted on the edgesWilted
SmellFreshSlightly freshA little foulA bit foulFoul
Table 2. Results of sequence OTU clustering of quality sequences at a 3% divergence level.
SampleOTUsPhylumClassOrderFamilyGenusSpecies
F1387233899155253301
F2408203894145253317
F3341153185128213258
W1281183379123189227
W2315162772124197251
W3352214090145227282
CD1241203176118173199
CD2262173076119180214
CD316115245782115135
s6h14512346112180289366
s6h23992443110167259327
s6h34332344104168268335
s12h118117236594127146
s12h2260172870114168208
s12h3260183280123182216
s1d1364224194151249308
s1d2312162871117196245
s1d3403213893153256327
s2d11351219406993106
s2d21351218416896107
s2d3120101439618293
s3d1121111841638396
s3d2111121841647887
s3d31391421487799110
s4d110391230517080
s4d2125111538648695
s4d311181337567687
s6d17571022344754
s6d26981124364549
s6d38181124364755
s8d1555717263438
s8d2596919283743
s8d3607919293742
The numbers 1, 2 and 3 after the sample name represent three replicate samples under the same treatment.
Table 3. The number of colonies in different samples.
SampleTotal Colonies (CFU/g)B. cereus (CFU/g)S.aureus
(MPN/g)
E. coli (MPN/g)E. coli O157: H7SalmonellaL. monocytogenes
F5.33 ± 0.20 bc<100<3<3NDNDND
W4.04 ± 0.04 def<100<3<3NDNDND
CD4.00 ± 0.38 def<100<3<3NDNDND
s6h3.26 ± 0.24 ef<100<3<3NDNDND
s12h2.97 ± 0.03 f<100<3<3NDNDND
s1d4.29 ± 0.89 cde<100<3<3NDNDND
s2d4.37 ± 1.30 cd<100<3<3NDNDND
s3d5.15 ± 0.46 bc<100<3<3NDNDND
s4d6.08 ± 0.21 ab<100<3<3NDNDND
s6d6.39 ± 0.48 a<100<3<3NDNDND
s8d7.05 ± 0.80 a<100<3<3NDNDND
ND means not detected. Different letters represent the statistically significant differences between the different treatment groups (p < 0.05). Bacillus cereus is represented by B. cereus, Staphylococcus aureus is represented by S. aureus, Escherichia coli is represented by E. coli, Escherichia coli O157:H7 is represented by E. coli O157:H7, Listeria monocytogenes is represented by L. monocytogenes.
Publisher’s Note: MDPI stays neutral with regard to jurisdictional claims in published maps and institutional affiliations.

