Article

Rapid Determination of β-Glucan Content of Hulled and Naked Oats Using near Infrared Spectroscopy Combined with Chemometrics

1
Food Science and Technology Program, BNU-HKBU United International College, Zhuhai 519087, China
2
School of Chemical Engineering and Physical Sciences, Lovely Professional University, Jalandhar 144411, India
3
Zhangjiakou Academy of Agricultural Sciences, Zhangjiakou 075000, China
4
Statistical Program, BNU-HKBU United International College, Zhuhai 519087, China
*
Author to whom correspondence should be addressed.
These authors contributed equally to this work.
Foods 2022, 11(1), 43; https://doi.org/10.3390/foods11010043
Submission received: 20 November 2021 / Revised: 15 December 2021 / Accepted: 21 December 2021 / Published: 24 December 2021

Abstract

:
The quantification of β-glucan in oats is of immense importance for plant breeders and food scientists to develop plant varieties and food products with a high quantity of β-glucan. However, the chemical analysis of β-glucan is time consuming, destructive, and laborious. In this study, near-infrared (NIR) spectroscopy in conjunction with Chemometrics was employed for rapid and non-destructive prediction of β-glucan content in oats. The interval Partial Least Square (iPLS) along with correlation matrix plots were employed to analyze the NIR spectrum from 700–1300 nm, 1300–1900 nm, and 1900–2500 nm for the selection of important wavelengths for the prediction of β-glucan. The NIR spectral data were pre-treated using Savitzky Golay smoothening and normalization before employing partial least square regression (PLSR) analysis. The PLSR models were established based on the selection of wavelengths from PLS loading plots that present a high correlation with β-glucan content. It was observed that wavelength region 700–1300 nm is sufficient for the satisfactory prediction of β-glucan of hulled and naked oats with R2c of 0.789 and 0.677, respectively, and RMSE < 0.229.

1. Introduction

Oats are produced in various countries around the world. According to the Food and Agriculture Organisation of United Nations, Russia is the top producer of oats (4.72 million metric tons (mmt)) followed by Canada (3.44 mmt), Spain (1.48 mmt), Australia (1.23 mmt), Poland (1.17 mmt), and China (1.00 mmt) [1]. There are about seventy species of oats around the world, while hulled oats (Avena sativa L.) and naked oats (A. nuda L.) are the most cultivated oats species. The latter is hull-free and exhibits a higher energy level compared with hulled oats [2]. Oats are a rich source of soluble fibers, mainly, β-glucan [3]. Primarily, β-glucan is present in the cell walls of the aleurone layer and starchy endosperm of oat grains [4]. It is a homopolysaccharide of long linear chains of glucose units connected by β-(1→3) and β-(1→4) linkages [5,6].
β-glucan is also known as a functional and bioactive food ingredient due to its potential health benefits such as antitumor, anti-inflammatory, antioxidant, hypoglycemic, hypocholesterolemic, and immunomodulatory activities [3,5]. Thus, the demand for food products with a high level of β-glucan has been increased worldwide. Oats are used as human food in the form of cereals, breads, beverages, and infant foods [3]. β-glucans are also employed in the pharmaceutical industry to produce wound dressing material; for the treatment of burn injuries, skin substitute, and bone-substituting material; and in arthritis treatment. Moreover, β-glucans are also used in the cosmetics industry due to their anti-aging, moisturizing, and wound healing effects [5,7]. However, high β-glucan content is undesirable in the case of monogastric animal feed due to the digestion problem and reduced nutritional value of the feed [8].
To develop a new plant variety with a high level of β-glucan, the quantification of β-glucan is also important for plant breeders for the selection of high-quality oat cultivar. The McCleary enzymatic method is the most widely used method for the determination of β-glucan [9]. The primary step of this method involves disintegration and homogenization of oat grains that may induce variations in the β-glucan measurement if they are not properly conducted. Moreover, this chemical method is destructive, requires a long determination time, and is costly. During plant breeding experiments, extensive chemical analysis has to be conducted to explore the target genotype. Thus, there is an immediate requirement to substitute conventional analysis with up-to-date non-destructive, chemical-free, rapid, and easy techniques.
Near-infrared spectroscopy (NIRS) meets the requirements of plant breeders and food scientists to detect the β-glucan of oats without chemicals, in less time, and with minimum sample preparation and cost. NIR spectrum ranges from 700 to 2500 nm consist of broad overtone and combination bands of certain fundamental vibrations of C–H, N–H, and O–H bonds present in organic compounds of grain samples [10]. NIRS in conjunction with chemometrics has been successfully employed in medical science [11], pharmaceuticals [12], and food industries [10,13,14]. In recent decades, NIRS along with modified partial least square regression was used for the accurate prediction (coefficient of determination for calibration (R2C) of 0.80 and coefficient of determination for prediction (R2p) of 0.75) of groat percentage in oats from Italy [13]; neutral detergent fiber, acid detergent fiber, and acid detergent lignin of oats collected from Italy (R2C = 0.92–0.95 and coefficient of determination for cross-validation (R2cv) = 0.83–0.93) [14]; nitrogen (R2c = 0.973, coefficient of determination for validation (R2v) = 0.984) and protein content (R2c = 0.973, 0.965, R2v = 0.984, 0.973) of food products containing oats [15], protein, and lipid contents of oats from Brazil [16]; and the detection of oat flour adulteration with wheat flour [17]. Previously, NIRS in the region 1194–1240 nm was also successfully employed to predict the accumulation of (1→3) (1→4)-β-D-glucan while grain filling in barley [18]. In addition, NIRS was also employed to predict the β-glucan content of different oats genotypes collected from Italy and other European countries [4,19]. Previously, different types of NIR Instruments were explored for their suitability in measuring β-glucan content in naked barley. The Fourier transform near-infrared (FT-NIR) reflection instrument was reported to predict β-glucan with high efficiency (R2c = 0.96–0.98) [20]. Furthermore, the NIR spectrum of 288 seeds of whole oat groats for six varieties grown in the USA was collected and used for the prediction of β-glucan content by employing Partial Least Square regression (PLSR) analysis [21]. Recently, NIR spectroscopy in conjunction with chemometrics was also employed for the efficient prediction of β-glucan content of hulled oats samples collected from diverse geographical regions of the USA [22].
However, to the best of our knowledge, no study has been conducted for the prediction of β-glucan content of hulled and naked oats collected from China. Thus, this study was carried out to predict the β-glucan content of oats from China, by using NIRS in conjunction with PLSR analysis. In this study, we also included certain oat samples collected from the United States and Canada to increase the genetic and geographical variability of the sample pool.

2. Materials and Methods

2.1. Collection of Oat Samples

A total of 179 different varieties of oat samples (100 naked and 79 hulled oats) were procured from Zhangjiakou Agricultural Academy, Hebei Province, China. The samples were cleaned manually to remove unwanted materials and damaged grains and then refrigerated at (2–6 °C) until further analysis. The samples were brought at room temperature before chemical and spectral analysis followed by dehulling and removal of impurities. The final oat groats were finely ground by a regular laboratory mill (400A, Yongkang City Zhanfan Industry and Trade Co., Ltd., Yongkang, Zhejiang, China) and passed through a 60 mesh screen (d = 0.25 mm) to achieve homogeneous particle size that, in turn, reduce the problem of scattering during NIR data acquisition. The resultant oat flours were further used for chemical and spectral analysis.

2.2. Chemicals

The analytical grade sodium dihydrogen orthophosphate dihydrate (NaH2PO4.2H2O), sodium hydroxide (NaOH), and glacial acetic acid were purchased from Tianjin Damao Chemical Reagent Co., Ltd. (Tianjin, China). The β-glucan content of oat samples (reference data) was determined by using the mixed-linkage beta-glucan kit (K-BGLU, Megazyme, Bray, Ireland).

2.3. Determination of β-Glucan Content

The mixed-linkage β-glucan assay procedure (McCleary method) was used to determine the β-glucan content of oat samples [9]. Briefly, the 120 mg of oat sample was suspended in 0.2 mL of 50% ethanol and hydrated in a sodium phosphate-buffered solution (4 mL, 20 mM, pH 6.5). Furthermore, the reaction mixture was incubated with purified lichenase enzyme (0.2 mL) and filtered. An aliquot of the filtrate was then hydrolyzed with purified β-glucosidase (0.1 mL in 50 mM sodium acetate buffer pH 4.0) to release D-glucose followed by the addition of glucose oxidase/peroxidase reagent (3.0 mL) and incubation for 20 min at 50 °C. The absorbance of the solution was measured at 510 nm within 1 h. The β-glucan content of each sample was analyzed in triplicates.

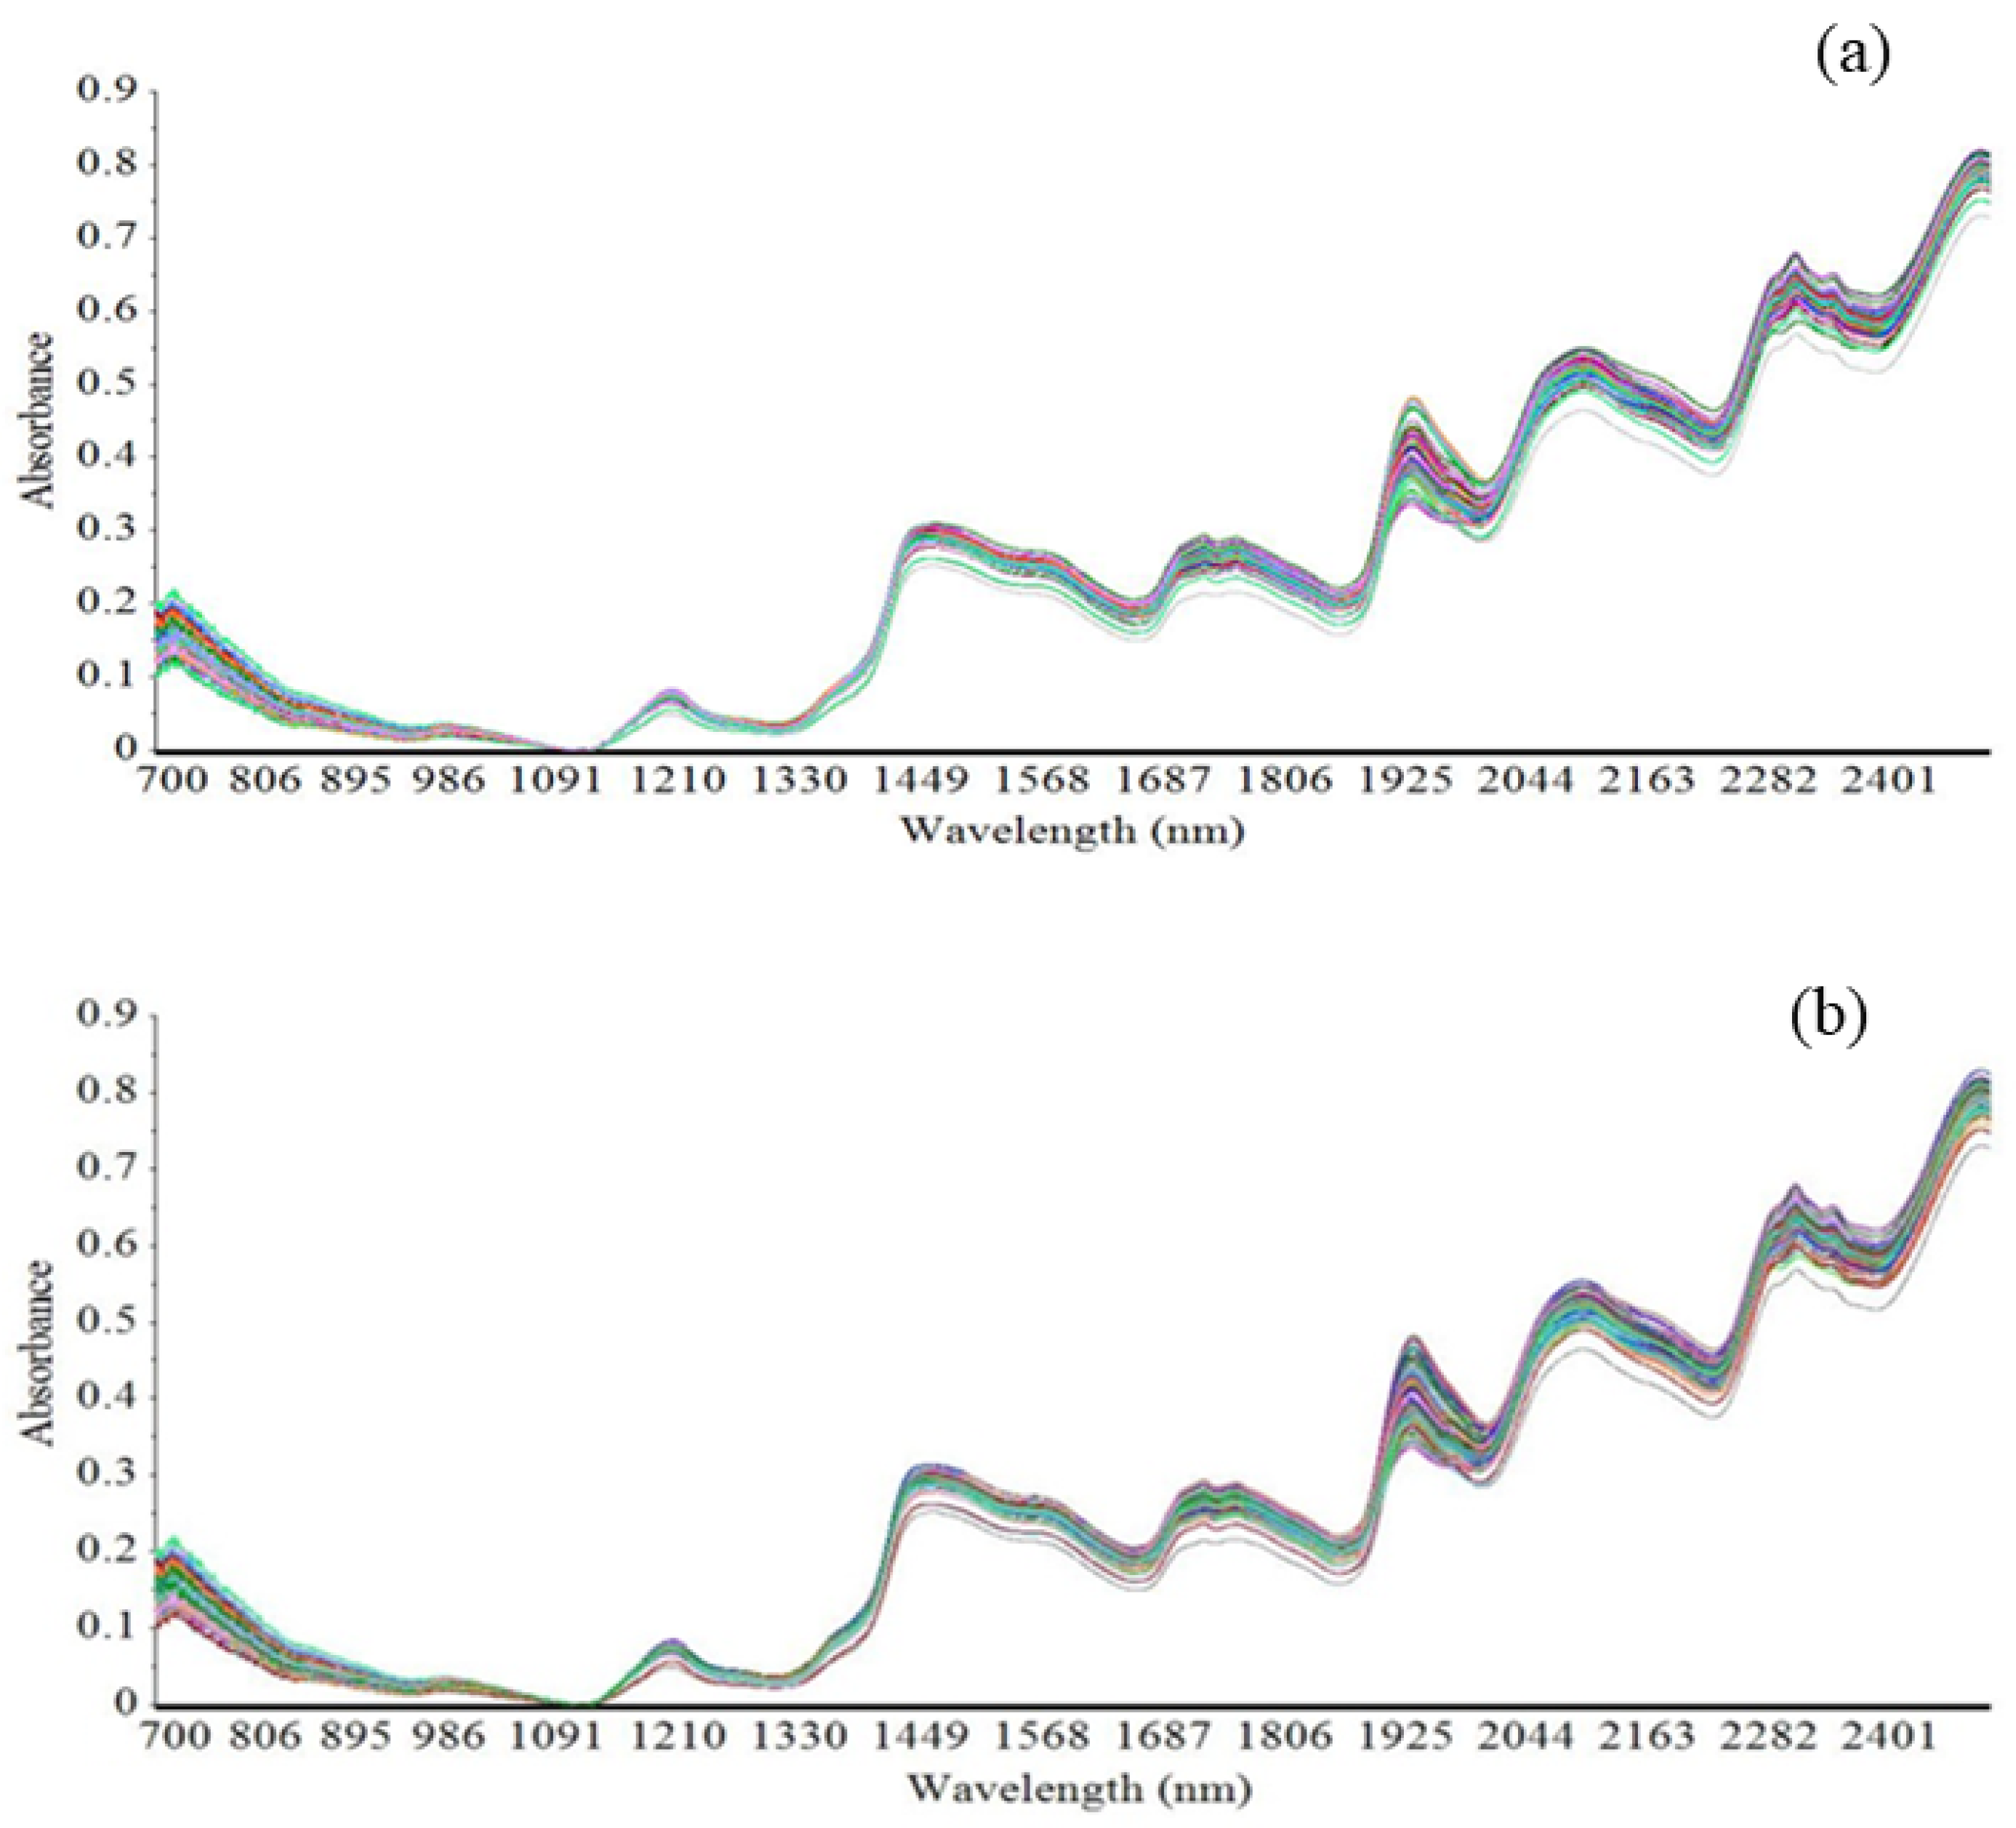
2.4. Acquisition of NIR Spectra

The NIR spectrum of the oat flour sample was measured by using Frontier FT-IR/NIR Spectrometer (PerkinElmer Inc., Waltham, MA, USA) using a NIR infrared reflectance accessory—NIRA (PerkinElmer Inc., Waltham, MA, USA) equipped with a spinning sample module and Spectrum-V.7.3.1.1023 (PerkinElmer Inc., Waltham, MA, USA) software. The spectrum was recorded in diffuse reflectance mode from 700 to 2500 nm using 32 scans at 1 nm intervals. The measurements were performed in duplicate, and the average spectrum was used for further analysis.

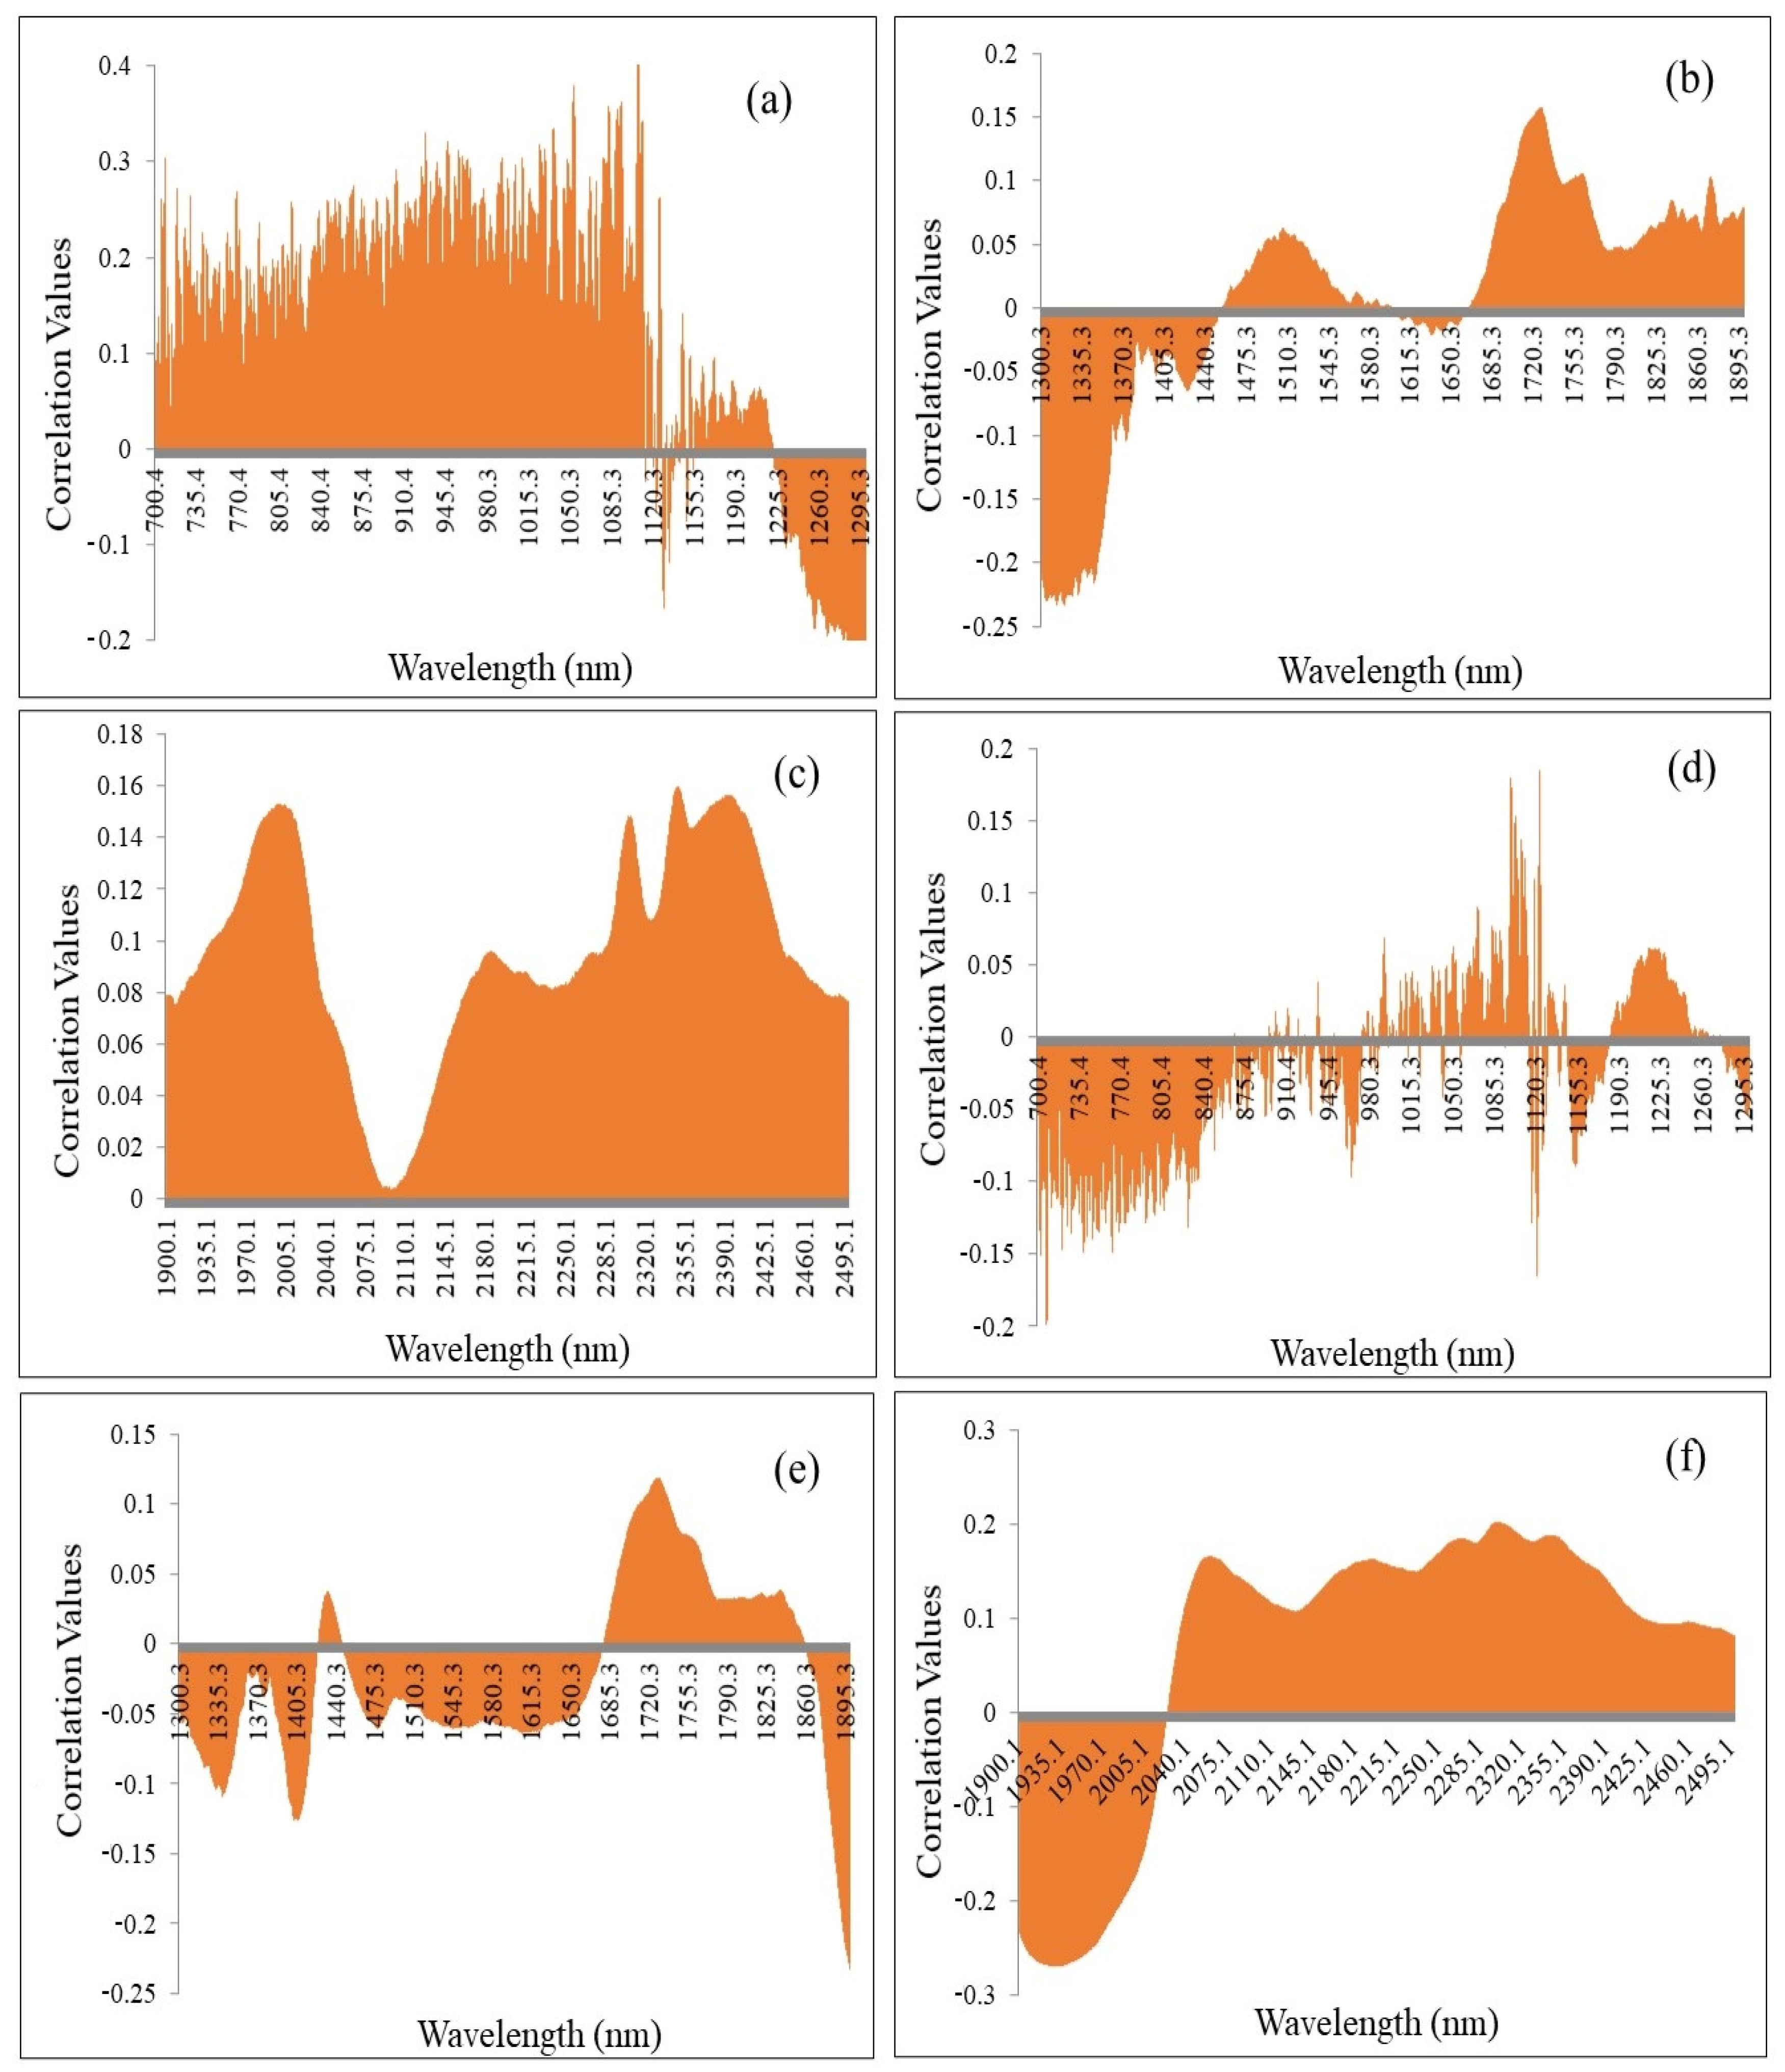
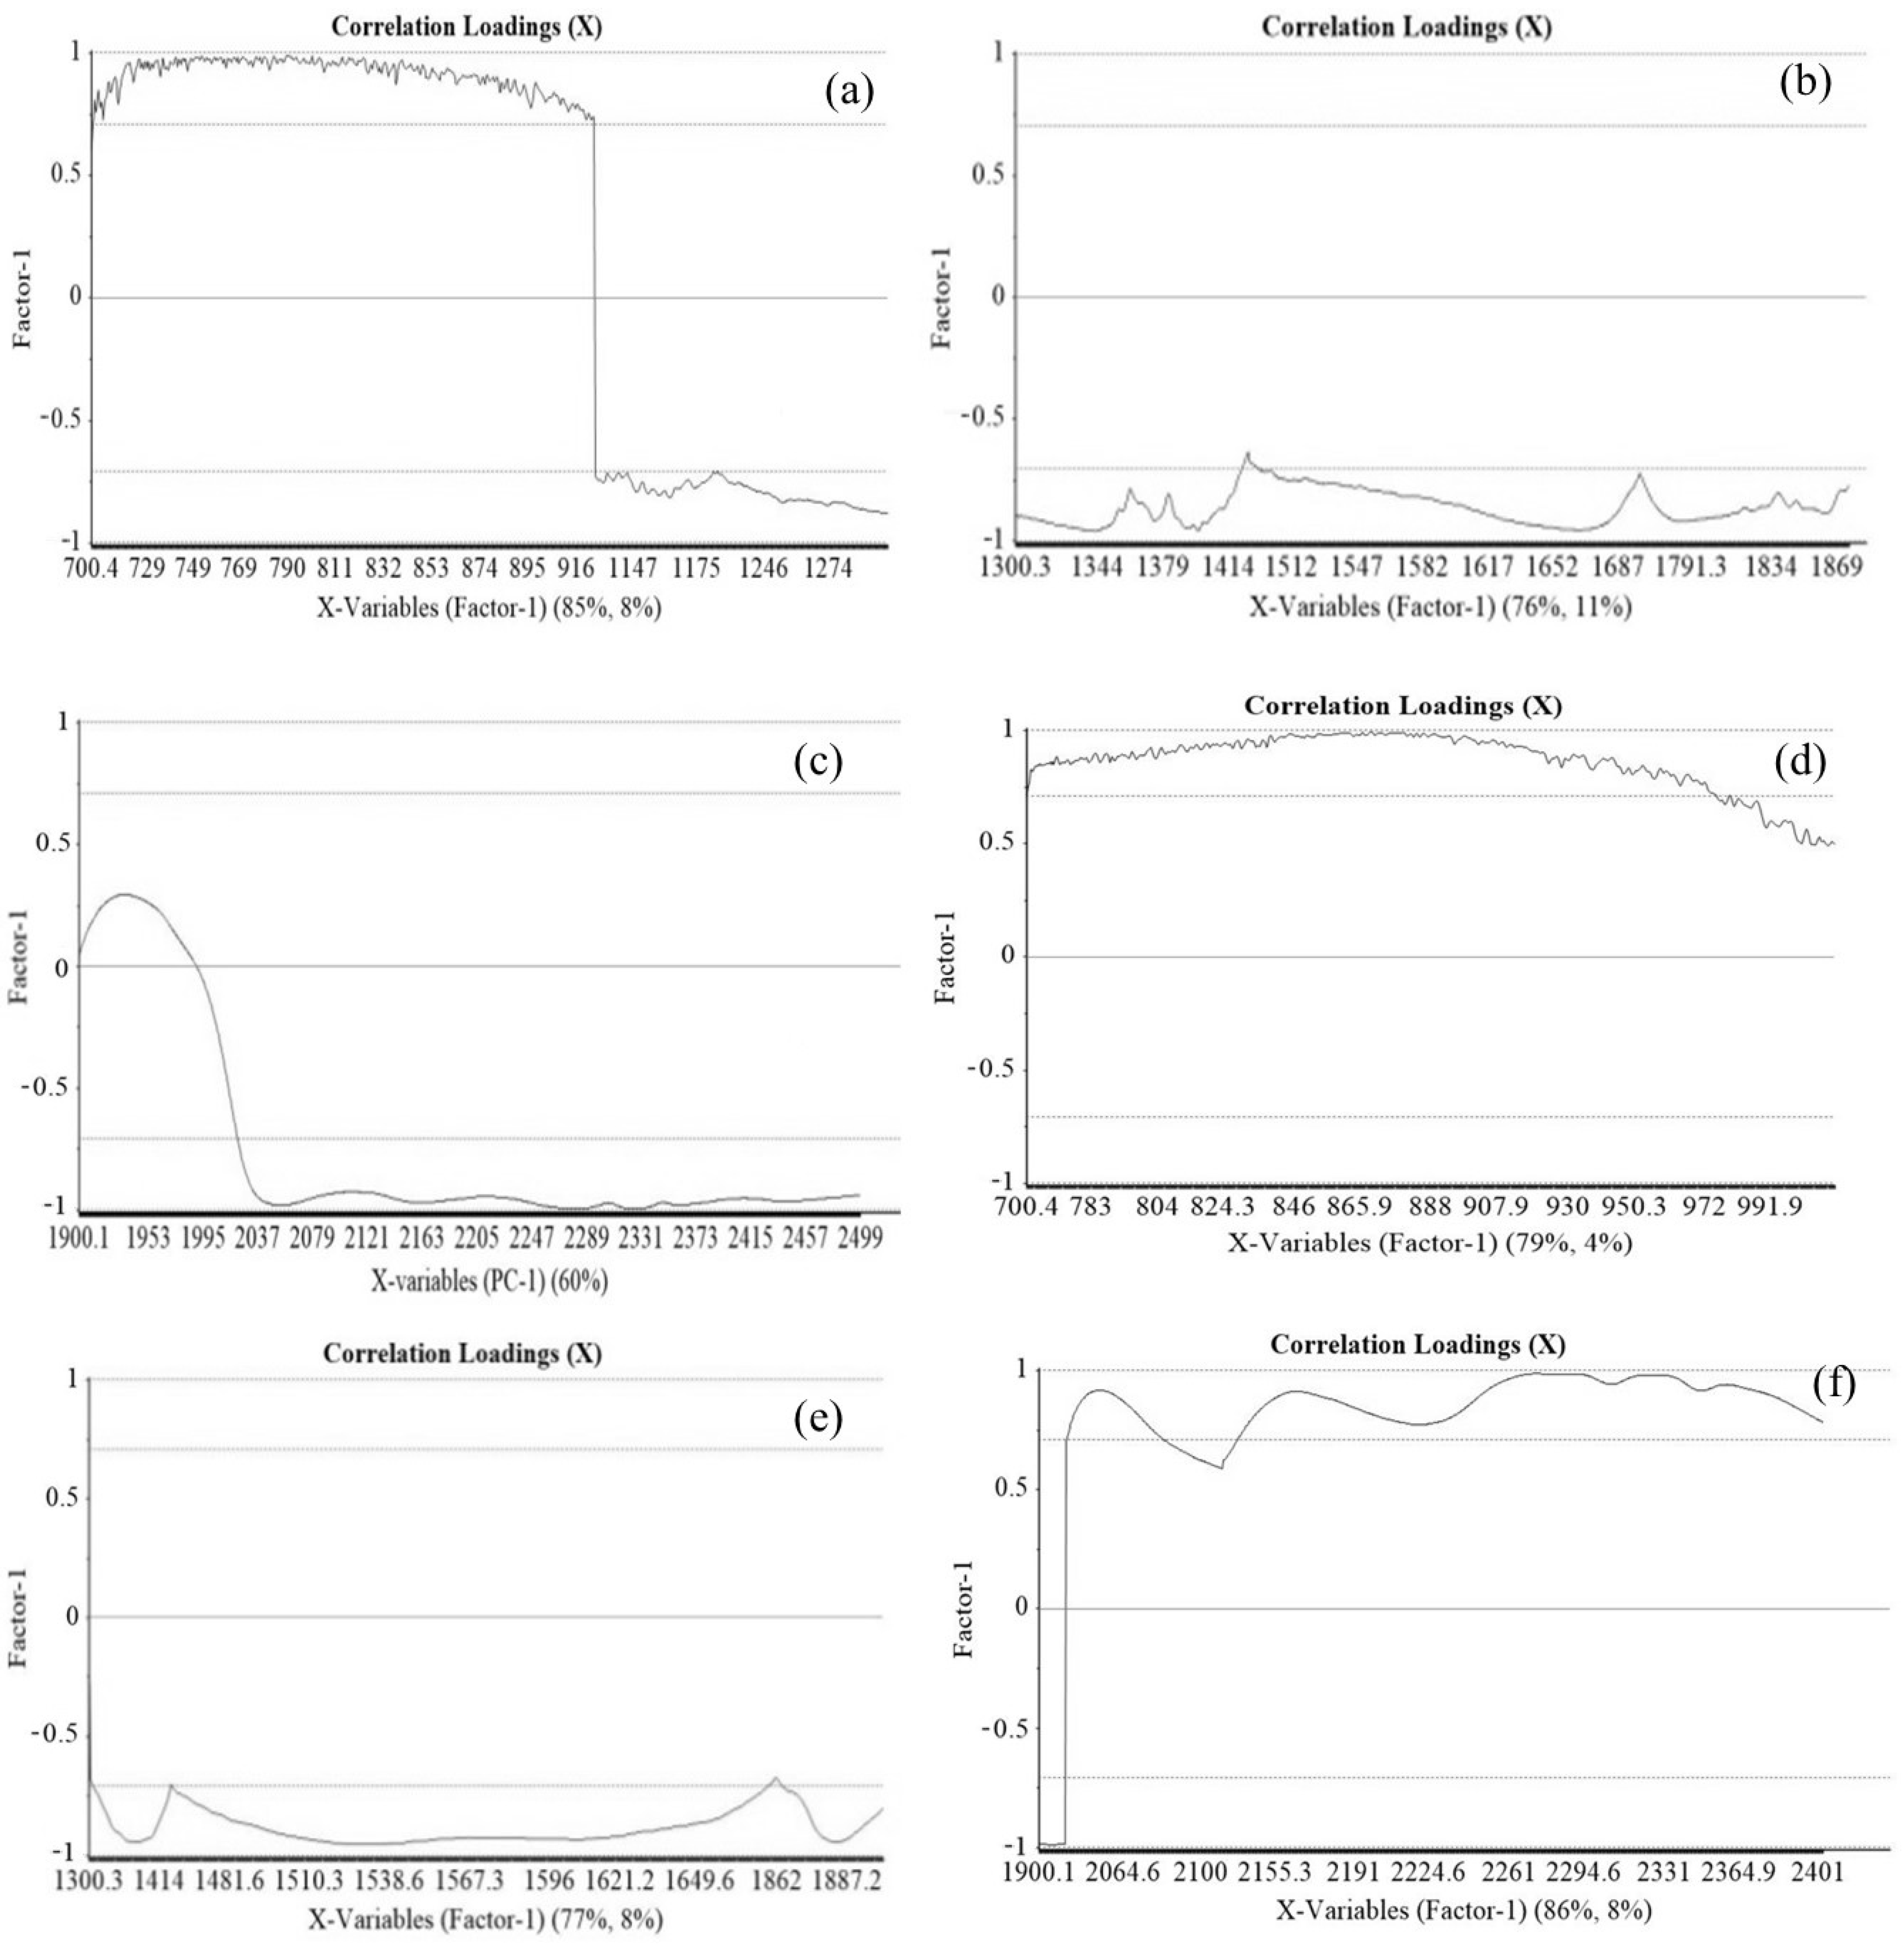
2.5. Statistical Analysis
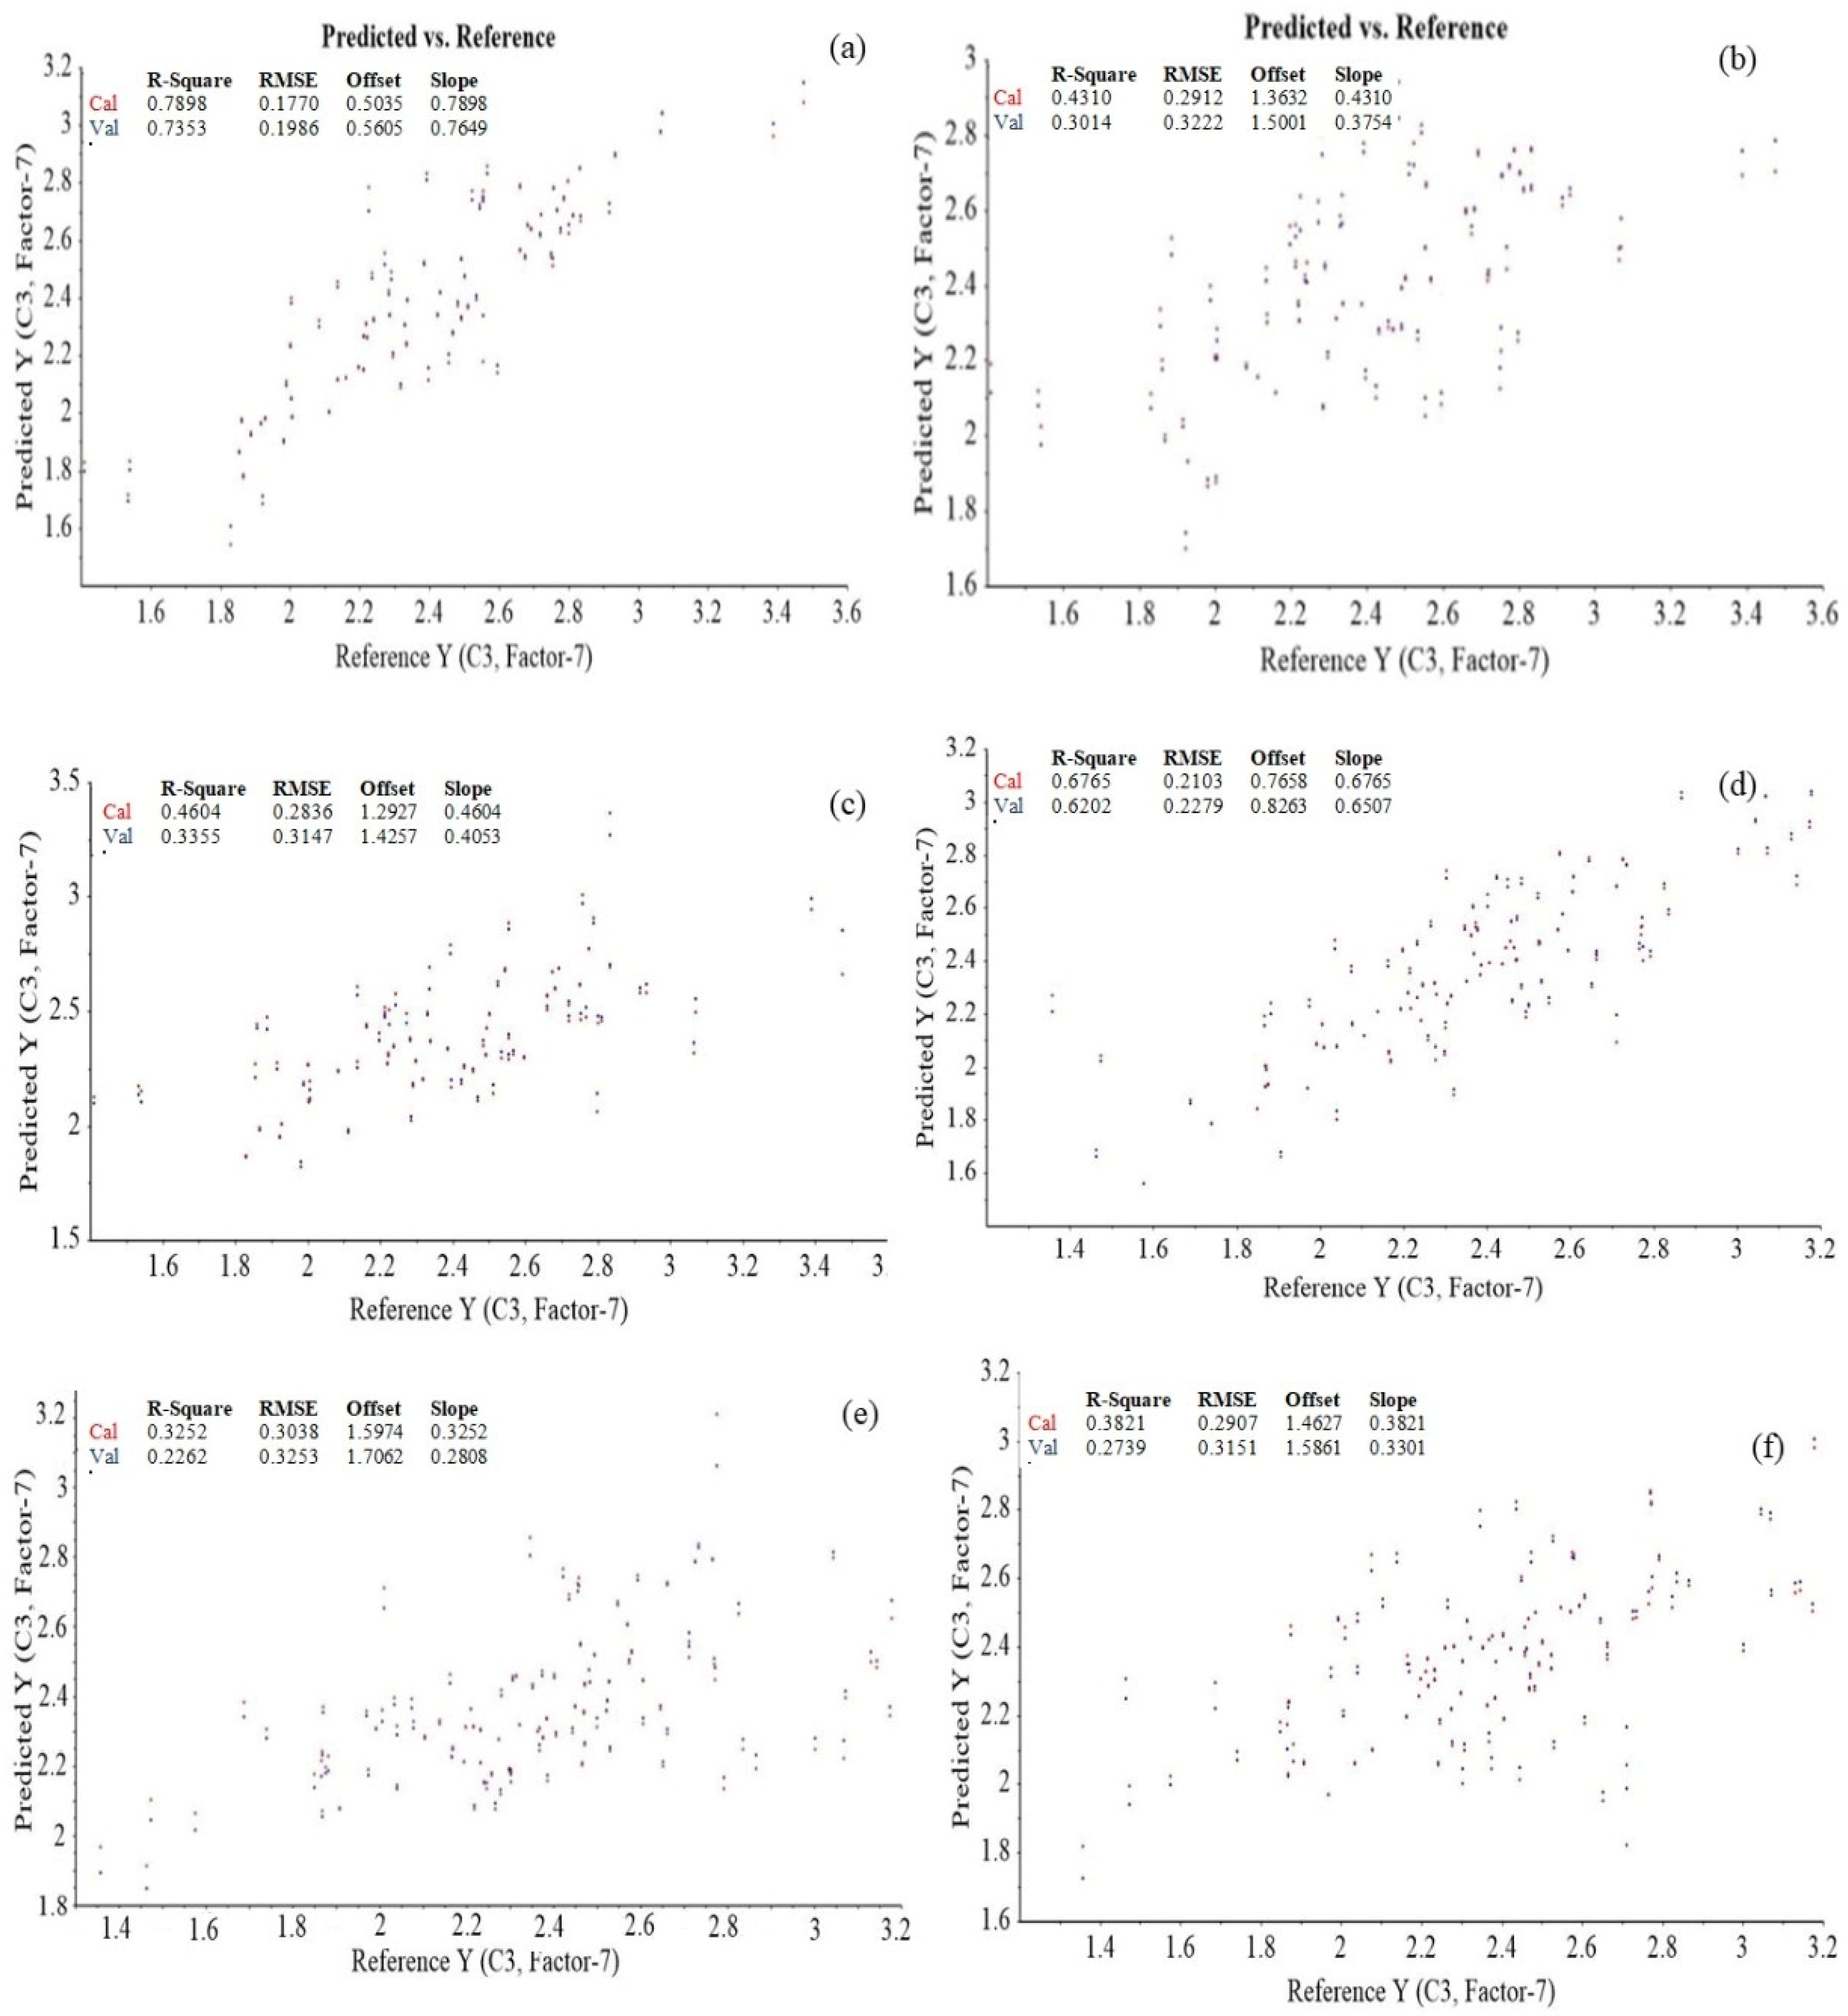
The interaction of NIR radiation with oat samples gives rise to a complex spectrum. This spectrum comprises overtone vibrations and combination bands at particular wavelengths due to the bonds present in organic compounds of oats. Thus, for the extraction of useful information from spectra and quantitative analysis of β-glucan present in samples, multivariate statistical analysis was carried out by employing reference data of β-glucan as primary data and spectral data as secondary data. The multivariate analysis was performed by using chemometric software (The Unscrambler X version 10.3; CAMO Software AS, Oslo, Norway). Random sampling was conducted to divide oats samples into two categories—calibration and prediction set with the ratio of 4:1. In case of hulled oats, 64 samples were included in the calibration set, whereas 15 samples were kept in the prediction set. However, in the case of naked oats, 80 samples were kept in the calibration set and 20 samples were used to develop the prediction model [10]. The spectral data were maximum normalized, and a baseline correction was performed for the obtained spectra. Savitzky–Golay smoothening was applied to the spectral data. The complete NIR wavelength range was divided into three equal parts and equal width (for both naked and hulled oat samples) namely, 700–1300 nm (I), 1300–1900 nm (II), and 1900–2500 nm (III) followed by developing a correlation matrix for each section of wavelength with the β-glucan data of oat samples obtained by using reference analysis. PLSR and interval PLS regression (iPLS) was applied using Nonlinear Iterative Partial Least Squares (NIPALS) algorithm, and PCA analysis was performed on the spectral data as a whole and on the three parts each. Regression models were developed for each part for the determination of the β-glucan content in the samples.

3. Results

The McCleary method was used as a reference method for the determination of β-glucan content in seventy-nine oats varieties. The β-glucan content and moisture content of hulled and naked oat varieties under investigation are mentioned in Table 1 and Table 2. The moisture content of hulled and naked oat samples varied from 4.86% to 6.43%, and 4.17% to 6.19%. In the case of hulled oats, the highest amount of β-glucan (5.5%) was observed in ZNY 258 followed by 5.25% in the case of zyp2 gp 63-56, and 4.94% in the case of zyp2 gp 86-79, whereas oat variety Zhangyan #7 presented the lowest amount of β-glucan (3.1%). In the case of naked oats, the highest amount of β-glucan (5.22%) was found in sample BY 4, followed by 5.21% in Bayan #9 and by 5.17% in BY 34. However, the lowest content (3.12%) was observed in the case of sample BY 37.
Figure 1 presents the NIR spectra of the hulled and naked oat samples. The absorption bands of both hulled and naked oat samples exhibit the least difference. The NIR spectra of samples were complex and present the prominent absorption bands around 1200 nm, 1450 nm, 1750 nm, 1950 nm, 2100 nm, 2300 nm, and 2500 nm, whereas the lowest absorbance was observed in wavelength band 900–1091 nm.
Thus, iPLS was performed for the selection of important wavelengths for the prediction of β-glucan in oats. Furthermore, the correlation matrix plots were employed to determine the correlation between each wavelength range and the β-glucan content. The correlation between wavelength range 700–1300 nm and 1400 to 1700 nm with the β-glucan content of hulled oat samples are shown in Figure 2a or Figure 2b, respectively. It can be observed that the wavelengths ranging from 1091 to 1218 nm present low correlation values (less than 0.2) compared with the other wavelengths (equal to greater than 0.2). The wavelengths from 1400 to 1700 nm also exhibit negligible correlation with β-glucan measurements. Thus, these wavelengths with less correlation were least important and considered as outliers for the determination of β-glucan to reduce the error, whereas the wavelength range 1300–1400 nm presented a strong negative correlation and the wavelength range 1700–1900 nm exhibits a strong positive correlation with β-glucan content. Thus, these wavelength ranges in group II with strong correlation were important for the prediction of β-glucan. Similarly, the important wavelengths (1950–2050 and 2150–2500 nm) were identified from group III (1900–2500 nm) using the correlation matrix, as shown in Figure 2c. The correlation matrix plots between β-glucan and the different wavelength ranges for the naked samples are presented in Figure 2d–f. As shown in Figure 2e or Figure 2f, wavelength ranges 1850–1865 nm and 1900–2000 nm exhibit a negative correlation with β-glucan, respectively. The wavelengths with correlation values of more than 0.1 were used for the development of a model, and the other wavelengths with low correlation values were considered outliers for the development of regression model.
The PLSR analysis was employed to determine the relationship between spectral absorbance and concentration of β-glucan by employing wavelengths extracted from iPLS. The Savitzky–Golay smoothening and normalization were applied to the spectral data before prediction analysis for reducing errors and for smoothening the spectral data. PLS loading plots for the hulled and naked samples are shown in Figure 3a–f, respectively. The loading plot shows the correlation loading coefficients for the regression equation developed to predict the β-glucan content in the oat samples. Each graph is divided into three parts: the upper part for the correlation loading value of 0.7–1 represents the wavelengths with a strong positive correlation coefficient with β-glucan content, the middle part shows wavelengths with moderate or small correlation coefficients, and the lower part shows strong negative correlation coefficients. Wavelengths with strong positive and negative correlations were selected for the prediction model, and the PLSR analysis was applied for the three groups separately.
The correlation loading plot for the naked samples (Figure 3d–f) showed that the wavelengths from 700–972 nm and 2100–2500 nm exhibit a strong positive correlation with the β-glucan of oats, whereas the wavelengths from 900–1300 nm present strong negative correlation coefficients with the β-glucan of naked oats. In the case of hulled oat samples, the correlation loading plots showed that the wavelength range from 700–900 nm exhibits a strong positive correlation and that the wavelength ranges 900–1900 and 2000–2500 nm present strong negative correlations (Figure 3a–c). Furthermore, it was also observed that the wavelength range 1900–2000 nm exhibits minimal to no correlation with β-glucan of hulled oat samples.
The prediction results for the β-glucan content of hulled and naked oats samples are shown in Figure 4 and Table 3. The R2c and R2p for hulled oats was higher, and the root mean square error (RMSE) was also considerably lower in the case of the first interval ranging from 700 to 1300 nm. A similar trend was also observed in the case of the naked samples. It was also observed that the R2c and R2p was slightly higher, and RMSE was comparatively lower in the case of hulled samples compared with naked samples in each wavelength interval. Overall, PLSR analysis in wavelength range 700–1300 nm can be successfully employed for the prediction of β-glucan content of hulled oats with R2c = 0.789, R2p = 0.735, RMSEC= 0.177, and RMSEP = 0.199, whereas in the case of naked oat samples, the best prediction results were also observed in the wavelength range 700–1300 nm with R2c = 0.677, R2p = 0.620, and RMSEC= 0.210, RMSEP = 0.228, but the R2c and R2p values were found to be poor in the second and third intervals ranging from 1300–1900 and 1900–2500 nm in both naked and hulled oats.

4. Discussion

The growing interest in functional foods accelerates research on plant materials rich in β-glucan. The health benefits of β-glucan such as antitumor, antioxidant, immunomodulatory, hypocholesterolemic, hypoglycemic, and anti-inflammatory activities are widely reported in the literature [3,5]. Thus, exploration of rich sources of β-glucan will lead to the development of novel plant material and food products with a high amount of β-glucan that, in turn, will provide various health benefits to consumers. In the present study, the β-glucan content of 100 different varieties of hulled oats and 79 varieties of naked oats were explored by employing the standard McCleary method. In case of hulled oat samples, the highest amount of β-glucan (5.5%) was observed ZNY 258 from Zhangjiakou, Hebei, China, and the lowest amount (3.1%) was found in the case of variety Zhangyan #7, also collected from Zhangjiakou, Hebei, China, whereas in the case of naked oat samples, the highest amount (5.22%) was observed in the case of variety BY 4 and the lowest amount (3.12%) was found in the case of sample BY 37. Both of these oat varieties were also collected from Zhangjiakou, Hebei, China. The β-glucan content of oat samples observed in the present study coincides well with the findings of previous studies [4,8]. In addition, the coefficient of variation among the β-glucan values of hulled and naked oat samples was found to be 10.67% and 10.79%. Thus, the chemometrics model established based on the spectral and this reference data will be able to predict the wide range of β-glucan in different oats varieties. A similar approach was also applied in a previous study while developing prediction models for phenolic compounds based on the NIR spectroscopy [10].
The NIR spectra of hulled and naked oats were collected from 700 to 2500 nm. The NIR spectra of oat samples were complex due to the presence of overtone vibrations and a combination of bands of C–H (aliphatic), C–H (aromatic), C–O (carboxyl), O–H (hydroxyl), and N–H (amine and amide) bonds present in organic compounds present in the oat samples [10,14,21]. The major absorption bands observed around 1200 nm correspond to the C–H 2nd overtone; 1450 nm corresponds to the O–H 1st overtone and the –CH2, –CH3, and –CH=CH– 1st overtone; 1750 nm corresponds to the C=O stretch 2nd overtone; 1950 nm corresponds to a combination of the stretching mode and the deformation mode of H2O; 2100 nm presents a combination of the O–H deformation mode and the C–O stretching mode; 2300 nm presents the –CH3 combination; and 2500 nm corresponds to a combination of C–H and C–C stretching [10,13,22]. The lowest absorbance was observed in the wavelength band 900–1091 nm. Similar absorption bands were also reported previously in the case of NIR spectra of oat groats [13]. Thus, due to the complex nature of the NIR spectra of oat samples, a multivariate statistical analysis needs to be conducted using chemical data as primary data and spectral data as secondary data for a better interpretation of the spectra, for the extraction of useful information, and for a quantitative analysis of the chemical components present in a plant material [23].
It was also mentioned that the wavelengths corresponding to low absorbance bands may be considered unwanted as these wavelengths contribute towards error during the establishment of a statistical model for the prediction of β-glucan in oats [22]. Thus, to extract important wavelengths for the prediction of β-glucan, iPLS was performed. In iPLS, the whole spectral data were subdivided into non-overlapping equal sections that undergo PLSR modelling to retrieve the most useful wavelength range (with high correlation coefficient and low RMSE) for the prediction of a particular biochemical parameter [24]. The resultant correlation matrix plots present the relationship between a particular biochemical parameter and absorption at different wavelengths. The wavelengths with less correlation values are mentioned as least important for the prediction of a biochemical parameter under investigation and can be rejected because they describe noise or other minor components [25]. In present study, the complete wavelength range (700–2500 nm) was divided into three equal parts (700–1300, 1300–1900 and 1900–2500 nm), and iPLS was performed. The resultant correlation matrix plots in Figure 2a revealed the shift in correlation values from high positive correlation to high negative correlation with an increase in the wavelength. The wavelength range from 700–1100 nm showed a positive but inconsistent correlation, 1120–1220 nm exhibited no or minimal correlation, and wavelength range 1225–1300 nm presented a high negative correlation with the β-glucan content of hulled oats. Thus, the wavelengths from 1120 to 1220 nm were not included in the development of the PLSR model for the prediction of β-glucan content. Furthermore, a negative correlation was observed between β-glucan content and wavelength range 1300–1440 nm (Figure 2b), whereas the highest wavelength ranges, 2040–2140 nm, showed a positive and feeble correlation (Figure 2c) and thus was not employed for the establishment of the PLSR models. However, the wavelength ranges 1950–2050 and 2150–2500 exhibited a satisfactory positive correlation with β-glucan content. Thus, they were employed for PLSR model development for the prediction of β-glucan content of hulled oats. In addition, the correlation matrix plots for different wavelength ranges (700–1300, 1300–1900, and 1900–2500 nm) and β-glucan contents of naked oats are presented in Figure 2d–f. The initial wavelengths till around 975 nm (Figure 2d) were negative, followed by an inconsistent and slightly positive correlation from 980 to 1150 nm and slightly positive correlation from around 1190 to 1260 nm followed by a negative correlation from 1290 to 1420 nm and 1442 to 1685 nm and a slightly positive correlation between β-glucan content and wavelength range 1686 to 1860 nm for naked oat samples (Figure 2e), whereas wavelength range 1900–2000 nm exhibits a negative correlation and wavelength range 2040 to 2500 nm exhibits a positive correlation with β-glucan of naked oats, as shown in Figure 2f. The wavelengths with correlation values more than and equal to 0.2 were employed for the establishment of a model, whereas other wavelengths with low correlation values were considered outliers for the development of the regression model. A similar approach was also employed for the selection of important wavelengths for the development of efficient calibration and prediction models for phenolic compounds of mung bean [10].
Furthermore, a PLSR analysis was performed to elucidate the relationship between β-glucan of oat samples and spectral absorbance using wavelengths extracted from iPLS. Before applying PLSR analysis, the spectral data were pretreated by employing Savitzky–Golay smoothening and normalization techniques to effectively remove scattering effects and noises such as tilt, baseline-drift, and reverse [26,27]. PLSR was applied to the data by the NIPALS algorithm and cross-validation technique [28]. In the case of 79 hulled samples, 63 were used to develop the model and 16 samples were employed for validation of the model. However, among the 100 naked samples, 80 samples were employed for calibration and 20 were used for validation of the model. The data was processed using seven principal components. It was observed that 94% of the complete data can be employed for the regression using two orthogonal principal components. Furthermore, the line loading plots of the PLS wavelength ranges (a) 700–1300 nm, (b) 1300–1900 nm, and (c) 1900–2500 nm for hulled and naked oats were also explored to support the finding of correlation matrix plots. The results of loading plots well supported the results of correlation matrix plots. In the PLS loading plots, the wavelengths with correlation values in the range of 0.7 to 1 were regarded as important for the model development and prediction of β-glucan content compared with the wavelength with values from −0.7 to 0 to +0.7. It was also observed that the initial wavelengths in the range of 700 to 1300 nm exhibited a positive correlation above or equal to 0.7 (Figure 3a), whereas the wavelength range 1300 to 1900 nm exhibited a negative correlation value (Figure 3b). In addition, the wavelengths in range 1900–2500 nm were also found to be least important for the prediction of β-glucan content, as their correlation values were below 0.7 to 1 (Figure 3c). In the case of naked oat samples, the wavelength range 700–900 nm was found to be important for the prediction of β-glucan content as their correlation value was between 0.7 to 1 (Figure 3d), whereas wavelengths from 1300 to 1900 nm exhibited negative correlation values below −0.5 and are thus regarded as outliers (Figure 3e) and the wavelength range 2000–2500 nm exhibited a variable but positive correlation between 0.7 to 1 (Figure 3f). Thus, it may also be considered important for the prediction of β-glucan content. Overall, in the case of Figure 3a–c, the wavelengths from 700–916 nm exhibited the highest positive correlation coefficient, whereas the wavelength region 1300–1900 nm (Figure 3) exhibited strong negative correlation coefficients. The wavelengths with high positive and negative correlations have equal importance in the prediction of β-glucan contents. The wavelength region 2000–2500 nm also presented a negative correlation coefficient; thus, wavelengths higher than 2100 nm are important for β-glucan prediction. In the case of both hulled and naked oat samples, the wavelengths less than 900 nm exhibited a strong positive correlation value. The wavelengths showing high correlation values for β-glucan content are more important for its prediction in the samples. Thus, the wavelengths showing a strong correlation with β-glucan from Figure 2 and Figure 3 were chosen for the final PLSR model development.
Table 3 and Figure 4 present the results of the prediction results of β-glucan from the PLSR models. In each wavelength interval, the wavelengths presenting a high correlation with β-glucan content were employed for establishing the PLSR model for the oat samples. In contrast, the wavelengths with minimal or no correlation were considered outliers and not employed for the establishment of calibration models. It can be observed from Table 3 that the PLS prediction model results are in accordance with the results obtained from correlation loading and correlation matrix results. The wavelength interval from 700 to 1300 nm exhibits relatively good R2 values for calibration and prediction compared with the models developed from 1300–2500 nm in both hulled and naked oats. The high values for R2c and R2p and lower values for RMSE present the good performance of the calibration and prediction model [29,30,31]. In wavelength range 1300–1900 nm, the R2c and R2p values were poor for both hulled (0.431 and 0.301) and naked oat samples (0.325 and 0.226). Similar results were also observed in wavelength range 1900–2500 nm with R2c and R2p of 0.460 and 0.336 for hulled and 0.382 and 0.274 for naked oats, respectively, whereas in the spectral range from 700 to 1300 nm, the R2c and R2p for naked oats were 0.677 and 0.620, and the highest values for R2c (0.789) and R2p (0.735) and the minimum values for RMSEC (0.177) and RMSEP (0.199) were observed for the hulled oat samples. Previously, it was mentioned that the calibration models with R2c between 0.66 and 0.81 present satisfactory predictions whereas prediction of chemical properties with R2c < 0.5 are reported as being unreliable [32,33,34]. A study by Seefeldt et al. also reported the best correlation of β-glucan of barley with the wavelengths in these regions [18]. Thus, in the future, the spectral region ranging from 700 to 1300 nm can be efficiently employed for the prediction of β-glucan of hulled oats to save time, whereas this wavelength range can also be employed for the satisfactory prediction of β-glucan of naked oats. In addition, a rapid and low-cost NIR spectrometer can also be designed by employing filters corresponding to 700–1300 nm for this particular application.

5. Conclusions

The rapid and non-destructive prediction of β-glucan content of hulled and naked oats was carried out by employing chemical data of the β-glucan content of oats (primary data) and NIR spectral data of oats (secondary data). The important wavelengths for the prediction of β-glucan of oats were selected using iPLS. The regression analysis was run on parts of the spectral data to check the range of spectra showing high coefficients of correlation with low error, chosen to build the best regression model for the prediction of the β-glucan content. The iPLS prediction and correlation matrix plots revealed the importance of wavelength range 700–1300 nm for the accurate prediction of β-glucan contents in hulled and naked oats samples. Various pre-processing techniques such as Savitzky–Golay smoothening and normalization were applied before prediction analysis. Applied pre-processing techniques helped in smoothening the data, which further helped in the analysis to understand the complex spectra. The results obtained from PLSR analysis indicate that the chemical data of β-glucan in hulled and naked oats along with the NIR spectra can be used for an accurate prediction of the β-glucan content with R2c of 0.789 and 0.677 for hulled and naked samples, respectively, in the wavelength range of 700–1300 nm with RMSEC and RMSEP less than 0.229.

Author Contributions

Conceptualization, B.X. and P.H.; methodology, M.M. and Y.Z.; software, U.K. and P.H.; validation, B.X., P.H. and S.Z.; formal analysis, M.M., Y.Z. and U.K.; investigation, M.M. and Y.Z.; resources, S.Z. and L.C.; data curation, U.K. and P.H.; writing—original draft preparation, M.M. and Y.Z.; writing—review and editing, B.X.; visualization, B.X. and P.H.; supervision, B.X.; project administration, B.X. and S.Z.; funding acquisition, B.X. All authors have read and agreed to the published version of the manuscript.

Funding

This research was jointly funded by two grants R202007 and R202017 from BNU-HKBU United International College, China.

Data Availability Statement

Data are available upon request.

Acknowledgments

Authors are thankful to CSIR-CSIO, Chandigarh (India), for providing access to “The Unscrambler” software.

Conflicts of Interest

The authors declare no conflict of interest.

References

  1. FAO. FAOSTAT, Food and Agriculture Organization of the United Nations (FAO). Available online: http://www.fao.org/faostat/en/#data/QC (accessed on 3 April 2020).
  2. Suttie, J.M.; Reynolds, S.G. Fodder Oats: A World Overview; Food and Agriculture Organization of the United Nations: Rome, Italy, 2004. [Google Scholar]
  3. Yoo, H.U.; Ko, M.J.; Chung, M.S. Hydrolysis of beta-glucan in oat flour during subcritical-water extraction. Food Chem. 2020, 308, 125670. [Google Scholar] [CrossRef]
  4. Redaelli, R.; Del Frate, V.; Bellato, S.; Terracciano, G.; Ciccoritti, R.; Germeier, C.U.; De Stefanis, E.; Sgrulletta, D. Genetic and environmental variability in total and soluble β-glucan in European oat genotypes. J. Cereal Sci. 2013, 57, 193–199. [Google Scholar] [CrossRef]
  5. Du, B.; Meenu, M.; Liu, H.; Xu, B. A concise review on the molecular structure and function relationship of β-glucan. Int. J. Mol. Sci. 2019, 20, 4032. [Google Scholar] [CrossRef] [Green Version]
  6. Du, B.; Meenu, M.; Xu, B. Insights into improvement of physiochemical and biological properties of dietary fibers from different sources via micron technology. Food Rev. Int. 2020, 36, 367–383. [Google Scholar] [CrossRef]
  7. Du, B.; Bian, Z.; Xu, B. Skin health promotion effects of natural beta-glucan derived from cereals and microorganisms: A review. Phyther. Res. 2014, 28, 159–166. [Google Scholar] [CrossRef] [PubMed]
  8. Dotsenko, G.; Andersson, A.A.M.; Andersson, R. Material disintegration affects enzymatic determination of β-glucan in barley and oats. J. Cereal Sci. 2019, 88, 138–144. [Google Scholar] [CrossRef]
  9. McCleary, B.V.; Codd, R. Measurement of (1 → 3),(1 → 4)-β-D-glucan in barley and oats: A streamlined enzymic procedure. J. Sci. Food Agric. 1991, 55, 303–312. [Google Scholar] [CrossRef]
  10. Meenu, M.; Kamboj, U.; Sharma, A.; Guha, P.; Mishra, S. Green method for determination of phenolic compounds in mung bean (Vigna radiata L.) based on near-infrared spectroscopy and chemometrics. Int. J. Food Sci. Technol. 2016, 51, 2520–2527. [Google Scholar] [CrossRef]
  11. Sakudo, A. Near-infrared spectroscopy for medical applications: Current status and future perspectives. Clin. Chim. Acta 2016, 455, 181–188. [Google Scholar] [CrossRef]
  12. Deidda, R.; Sacre, P.; Clavaud, M.; Coïc, L.; Avohou, H.; Hubert, P.; Ziemons, E. Vibrational spectroscopy in analysis of pharmaceuticals: Critical review of innovative portable and handheld NIR and Raman spectrophotometers. Trends Anal. Chem. 2019, 114, 251–259. [Google Scholar] [CrossRef]
  13. Redaelli, R.; Berardo, N. Evaluation of groat percentage in oats (Avena sativa L.) by near infrared spectroscopy. J. Near Infrared Spectrosc. 2002, 109, 103–109. [Google Scholar] [CrossRef]
  14. Redaelli, R.; Berardo, N. Prediction of fibre components in oat hulls by near infrared reflectance spectroscopy. J. Sci. Food Agric. 2007, 585, 580–585. [Google Scholar] [CrossRef]
  15. Kays, S.E.; Barton, F.E.; Windham, W.R. Predicting protein content by near infrared reflectance spectroscopy in diverse cereal food products. J. Near Infrared Spectrosc. 2000, 44, 35–43. [Google Scholar] [CrossRef]
  16. Cristina, S.; Milach, K.; Agriscience, C. Near infrared reflectance spectroscopy (NIRS) to assess protein and lipid Near infrared reflectance spectroscopy (NIRS) to assess protein and lipid contents in Avena sativa L. Crop Breed. Appl. Biotechnol. 2008, 8, 127–133. [Google Scholar] [CrossRef] [Green Version]
  17. Wang, N.; Zhang, X.; Yu, Z.; Li, G.; Zhou, B. Quantitative analysis of adulterations in oat flour by FT-NIR spectroscopy, incomplete unbalanced randomized block design, and partial least squares. J. Anal. Methods Chem. 2014, 2014, 393596. [Google Scholar] [CrossRef]
  18. Seefeldt, H.F.; Blennow, A.; Jespersen, B.M.; Wollenweber, B.; Engelsen, S.B. Accumulation of mixed linkage (1/3) (1/4)-b-D-glucan during grain filling in barley: A vibrational spectroscopy study. J. Cereal Sci. 2009, 49, 24–31. [Google Scholar] [CrossRef]
  19. Bellato, S.; Del Frate, V.; Redaelli, R.; Sgrulletta, D.; Bucci, R.; Magrì, A.D.; Marini, F. Use of near infrared reflectance and transmittance coupled to robust calibration for the evaluation of nutritional value in naked oats. J. Agric. Food Chem. 2011, 59, 4349–4360. [Google Scholar] [CrossRef] [PubMed]
  20. Schmidt, J.; Gergely, S.; Schönlechner, R.; Grausgruber, H.; Tömösközi, S.; Salgó, A.; Berghofer, E. Comparison of different types of NIR instruments in ability to measure β-glucan content in naked barley. Cereal Chem. 2009, 86, 398–404. [Google Scholar] [CrossRef]
  21. Gracia, M.B.; Armstrong, P.R.; Rongkui, H.; Mark, S. Quantification of betaglucans, lipid and protein contents in whole oat groats (Avena sativa L.) using near infrared reflectance spectroscopy. J. Near Infrared Spectrosc. 2017, 25, 172–179. [Google Scholar] [CrossRef]
  22. Paudel, D.; Caffe-Treml, M.; Krishnan, P. A single analytical platform for the rapid and simultaneous measurement of protein, oil, and β-glucan contents of oats using near-infrared reflectance spectroscopy. Cereal Foods World 2018, 63, 17–25. [Google Scholar]
  23. Biancolillo, A.; Marini, F. Chemometrics Applied to Plant Spectral Analysis. In Comprehensive Analytical Chemistry; Lopes, J., Sousa, C., Eds.; Elsevier: Amsterdam, The Netherlands, 2018; Volume 80, pp. 69–104. ISBN 9780444640482. [Google Scholar]
  24. Nørgaard, L.; Saudland, A.; Wagner, J.; Nielsen, J.P.; Munck, L.; Engelsen, S.B. Interval Partial Least-Squares Regression (iPLS): A Comparative Chemometric Study with an Example from Near-Infrared Spectroscopy. Appl. Spectrosopy 2016, 54, 413–419. [Google Scholar] [CrossRef]
  25. Frost, T. Quantitative Analysis. In Encyclopedia of Spectroscopy and Spectrometry; Lindon, J.C., Ed.; Academic Press: Cambridge, MA, USA, 1999; pp. 2325–2330. ISBN 9780123744135. [Google Scholar]
  26. Jiao, Y.; Li, Z.; Chen, X.; Fei, S. Preprocessing methods for near-infrared spectrum calibration. J. Chemom. 2020, 34, e3306. [Google Scholar] [CrossRef]
  27. Savitzky, A.; Golay, M.J.E. Smoothing and differentiation of data by simplified least squares procedures. Anal. Chem. 2002, 36, 1627–1639. [Google Scholar] [CrossRef]
  28. Martens, H.; Næs, T. Multivariate Calibration; John Wiley & Sons: New York, NY, USA, 1989; ISBN 0 471 90979 3. [Google Scholar]
  29. Meenu, M.; Cai, Q.; Xu, B. A critical review on analytical techniques to detect adulteration of extra virgin olive oil. Trends Food Sci. Technol. 2019, 91, 391–408. [Google Scholar] [CrossRef]
  30. Meenu, M.; Decker, E.A.; Xu, B. Application of vibrational spectroscopic techniques for determination of thermal degradation of frying oils and fats: A review. Crit. Rev. Food Sci. Nutr. 2021, 1891520. [Google Scholar] [CrossRef]
  31. Meenu, M.; Xu, B. Application of vibrational spectroscopy for classification, authentication and quality analysis of mushroom: A concise review. Food Chem. 2019, 289, 545–557. [Google Scholar] [CrossRef]
  32. Soriano-Disla, J.M.; Janik, L.J.; Rossel, R.A.V.; MacDonald, L.M.; McLaughlin, M.J. The performance of visible, near-, and mid-infrared reflectance spectroscopy for prediction of soil physical, chemical, and biological properties. Appl. Spectrosc. Rev. 2013, 49, 139–186. [Google Scholar] [CrossRef]
  33. Recha, J.W.; Olale, K.O.; Sila, A.; Ambaw, G.; Radeny, M.; Solomon, D. Ensemble modeling on near-infrared spectra as rapid tool for assessment of soil health indicators for sustainable food production systems. Soil Syst. 2021, 5, 69. [Google Scholar] [CrossRef]
  34. Rodríguez-Pérez, J.R.; Marcelo, V.; Pereira-Obaya, D.; García-Fernández, M.; Sanz-Ablanedo, E. Estimating soil properties and nutrients by visible and infrared diffuse reflectance spectroscopy to characterize vineyards. Agronomy 2021, 11, 1895. [Google Scholar] [CrossRef]
Figure 1. Typical near-infrared spectra of (a) hulled oat samples and (b) naked oat samples.
Foods 11 00043 g001
Figure 2. The correlation matrix plots of β-glucan content and NIR spectra in the wavelength ranges (a) 700–1300 nm, (b) 1300–1900 nm, and (c) 1900–2500 nm of hulled oats and (d) 700–1300 nm, (e) 1300–1900 nm, and (f) 1900–2500 nm of naked oats.
Foods 11 00043 g002
Figure 3. PLS loading plots in wavelength ranges (a) 700–1300 nm, (b) 1300–1900 nm, and (c) 1900–2500 nm for hulled oats and (d) 700–1300 nm, (e) 1300–1900 nm, and (f) 1900–2500 nm for naked oats.
Foods 11 00043 g003
Figure 4. Partial least square model of β-glucan content in the wavelength ranges (a) 700–1300 nm, (b) 1300–1900 nm, and (c) 1900–2500 nm for hulled oats and (d) 700–1300 nm, (e) 1300–1900 nm, and (f) 1900–2500 nm for naked oats.
Foods 11 00043 g004
Table 1. β-glucan content, moisture content, and origin of hulled oat samples.
S. No.Sample NameMoisture Content (%)β-Glucan % w/w (Dry wt. Basis)Origin
1zyp2 gp 016-145.91 ± 0.044.74 ± 0.06Zhangjiakou, Hebei, China
2zyp2 gp 002-15.65 ± 0.044.14 ± 0.04Zhangjiakou, Hebei, China
3zyp2 gp 035-305.64 ± 0.044.65 ± 0.12Zhangjiakou, Hebei, China
4zyp2 gp 129-1195.68 ± 0.044.35 ± 0.19Zhangjiakou, Hebei, China
5zyp2 gp 135-656.41 ± 0.114.77 ± 0.10Zhangjiakou, Hebei, China
6zyp2 gp -745.99 ± 0.674.63 ± 0.03Zhangjiakou, Hebei, China
7zyp2 gp 023-206.30 ± 0.674.77 ± 0.13Zhangjiakou, Hebei, China
8zyp2 gp 78-715.70 ± 0.044.35 ± 0.01Zhangjiakou, Hebei, China
9zyp2 gp 74-675.42 ± 0.044.56 ± 0.03Zhangjiakou, Hebei, China
10zyp2 gp 015-135.66 ± 0.424.59 ± 0.05Zhangjiakou, Hebei, China
11zyp2 gp 107-1005.32 ± 0.624.01 ± 0.11Zhangjiakou, Hebei, China
12zyp2 gp 027-245.33 ± 0.484.33 ± 0.03Zhangjiakou, Hebei, China
13zyp2 gp 137-075.67 ± 0.563.82 ± 0.03Zhangjiakou, Hebei, China
14zyp2 gp 70-635.19 ± 0.164.68 ± 0.04Zhangjiakou, Hebei, China
15zyp2 gp 76-695.18 ± 0.083.59 ± 0.06Zhangjiakou, Hebei, China
16zyp2 gp 017-155.48 ± 0.504.61 ± 0.14Zhangjiakou, Hebei, China
17zyp2 gp 61-545.64 ± 0.094.61 ± 0.12Zhangjiakou, Hebei, China
18zyp2 gp 031-275.47 ± 0.524.71 ± 0.00Zhangjiakou, Hebei, China
19zyp2 gp 104-975.20 ± 0.374.4 ± 0.04Zhangjiakou, Hebei, China
20zyp2 gp 91-845.50 ± 0.574.51 ± 0.03Zhangjiakou, Hebei, China
21zyp2 gp 82-756.14 ± 0.264.34 ± 0.00Zhangjiakou, Hebei, China
22zyp2 gp 63-565.70 ± 0.575.25 ± 0.03Zhangjiakou, Hebei, China
23zyp2 gp 57-516.43 ± 0.434.87 ± 0.05Zhangjiakou, Hebei, China
24zyp2 gp 86-795.04 ± 0.454.94 ± 0.08Zhangjiakou, Hebei, China
25zyp2 gp 20B PSX 17G-265.42 ± 0.423.92 ± 0.04Zhangjiakou, Hebei, China
26zyp2 gp 083-26.18 ± 0.393.97 ± 0.14Zhangjiakou, Hebei, China
27zyp2 gp 024-215.84 ± 0.403.55 ± 0.02Zhangjiakou, Hebei, China
28IYP gp-65.58 ± 0.574.4 ± 0.02Zhangjiakou, Hebei, China
29zyp2 gp 67-605.69 ± 0.214.02 ± 0.11Zhangjiakou, Hebei, China
30Zhangyan #25.76 ± 0.124.1 ± 0.08Zhangjiakou, Hebei, China
31Yibaiyan #15.65 ± 0.474.49 ± 0.04United States
32Qinghai 4445.62 ± 0.064.32 ± 0.01Xining, Qinghai, China
33Qingyin #15.45 ± 0.083.98 ± 0.08Xining, Qinghai, China
34Qingyin #15.51 ± 0.323.6 ± 0.00Xining, Qinghai, China
35Kanyan #15.69 ± 0.403.8 ± 0.04
36Yizhangyan #45.31 ± 0.193.64 ± 0.02Zhangjiakou, Hebei, China
37Dingyan #25.60 ± 0.014.32 ± 0.00Dingxi, Gansu, China
38Jingbaiyan #25.55 ± 0.063.69 ± 0.10
39Anrui5.7 ± 0.134.28 ± 0.07United States
40Qinghai sweet oat5.61 ± 0.084.12 ± 0.03Xining, Qinghai, China
41Kanyan #56.19 ± 0.523.78 ± 0.13
42Zhangyan #75.67 ± 0.083.1 ± 0.06Zhangjiakou, Hebei, China
43Qingyan #15.50 ± 0.114.69 ± 0.00Xining, Qinghai, China
44Baiyan #75.52 ± 0.184.38 ± 0.01
45Linna5.57 ± 0.404.31 ± 0.04Canada
46Kanyan #45.47 ± 0.423.57 ± 0.03
47Baiyan #145.35 ± 0.423.48 ± 0.19
48Kanyan #25.19 ± 0.103.6 ± 0.08
49Zhangyan #35.21 ± 0.124.47 ± 0.06Zhangjiakou, Hebei, China
50Dingyin #15.15 ± 0.223.81 ± 0.02Dingxi, Gansu, China
51Kanyan #35.36 ± 0.084.13 ± 0.01
52Mingcui5.60 ± 0.114.25 ± 0.10United States
53Yibaiyan #34.87 ± 0.594.67 ± 0.10United States
54Zhangyan #15.87 ± 0.524.03 ± 0.01Zhangjiakou, Hebei, China
55Kanyan #65.11 ± 0.404.08 ± 0.03
56Lezhen5.53 ± 0.454.35 ± 0.00United States
57Zhangyan #45.96 ± 0.304.74 ± 0.01Zhangjiakou, Hebei, China
58Beile5.50 ± 0.453.91 ± 0.00Canada
59Jiayan #25.37 ± 0.043.79 ± 0.11Canada
60ZNY 2215.57 ± 0.063.97 ± 0.02Zhangjiakou, Hebei, China
61ZNY 2026.17 ± 0.334.32 ± 0.04Zhangjiakou, Hebei, China
62ZNY 3005.48 ± 0.464.14 ± 0.00Zhangjiakou, Hebei, China
63ZNY 3035.61 ± 0.063.82 ± 0.04Zhangjiakou, Hebei, China
64ZNY 2975.65 ± 0.434.48 ± 0.02Zhangjiakou, Hebei, China
65ZNY 2185.54 ± 0.444.17 ± 0.00Zhangjiakou, Hebei, China
66ZNY 2936.15 ± 0.474.78 ± 0.06Zhangjiakou, Hebei, China
67ZNY 2255.57 ± 0.604.38 ± 0.00Zhangjiakou, Hebei, China
68ZNY 2545.58 ± 0.663.27 ± 0.00Zhangjiakou, Hebei, China
69ZNY 2335.19 ± 0.084.62 ± 0.04Zhangjiakou, Hebei, China
70ZNY 2905.33 ± 0.233.7 ± 0.03Zhangjiakou, Hebei, China
71ZNY 2055.78 ± 0.384.48 ± 0.17Zhangjiakou, Hebei, China
72ZNY 2325.36 ± 0.284.13 ± 0.04Zhangjiakou, Hebei, China
73ZNY 2485.40 ± 0.304.44 ± 0.07Zhangjiakou, Hebei, China
74ZNY 2885.41 ± 0.344.23 ± 0.02Zhangjiakou, Hebei, China
75ZNY 2315.44 ± 0.393.48 ± 0.10Zhangjiakou, Hebei, China
76ZNY 2515.68 ± 0.724.51 ± 0.03Zhangjiakou, Hebei, China
77ZNY 2585.62 ± 0.155.5 ± 0.08Zhangjiakou, Hebei, China
78ZNY 2555.77 ± 0.604.83 ± 0.06Zhangjiakou, Hebei, China
79ZNY2394.84 ± 0.314.01 ± 0.01Zhangjiakou, Hebei, China
Data were expressed as mean ± standard deviation (n = 3), w/w; weight/weight.
Table 2. β-glucan content, moisture content, and origin of naked oat samples.
S. No.Sample NameMoisture Content (%)β-Glucan % w/w (Dry wt. Basis)Origin
1Yanke #25.56 ± 0.313.96 ± 0.06Huhehaote, Inner Mongolia, China
2Baiyan #25.84 ± 0.394.00 ± 0.16Baicheng, Jilin, China
3Kanyou #65.74 ± 0.143.97 ± 0.09
4Dingyou #95.71 ± 0.293.59 ± 0.17Dingxi, Gansu, China
5Baiyan #115.63 ± 0.494.23 ± 0.03Baicheng, Jilin, China
6Kanyou #185.76 ± 0.055.06 ± 0.13
7Jinyan #85.97 ± 0.234.14 ± 0.10Datong, Shanxi, China
8Yuanza #15.14 ± 0.443.74 ± 0.05Zhangjiakou, Hebei, China
9Caoyou #15.91 ± 0.663.75 ± 0.11Huhehaote, Inner Mongolia, China
10Yanxuan 20075.61 ± 0.074.34 ± 0.01Datong, Shanxi, China
11Jinyan #15.64 ± 0.393.82 ± 0.03Datong, Shanxi, China
12Bayan #95.79 ± 0.135.21 ± 0.08
13Yizhangyou #65.60 ± 0.324.28 ± 0.08Zhangjiakou, Hebei, China
14Baiyan #155.55 ± 0.433.63 ± 0.05
15Baiyan #85.49 ± 0.683.82 ± 0.00
16Zhangyou #75.72 ± 0.663.93 ± 0.12
17Yizhangyou #35.82 ± 0.404.44 ± 0.01Zhangjiakou, Hebei, China
18Yizhangyou #125.52 ± 0.384.01 ± 0.04
19Yizhangyou #26.18 ± 0.573.84 ± 0.03Zhangjiakou, Hebei, China
20Jinyinyan #15.45 ± 0.394.54 ± 0.03Datong, Shanxi, China
21w855.44 ± 0.103.59 ± 0.01Baicheng, Jilin, China
22Yizhangyou #55.58 ± 0.424.25 ± 0.01Zhangjiakou, Hebei, China
23Kanyou #85.54 ± 0.434.23 ± 0.04
24Kanyou #135.66 ± 0.133.80 ± 0.02
25Huazao #25.51 ± 0.473.27 ± 0.01Zhangjiakou, Hebei, China
26Baiyan #135.77 ± 0.854.22 ± 0.01
27Kanyou #105.44 ± 0.544.14 ± 0.09
28Kanyou #55.22 ± 0.054.50 ± 0.02
29Neiyan #56.19 ± 0.423.98 ± 0.07
30Jinyan #145.33 ± 0.284.05 ± 0.10Datong, Shanxi, China
31Kanyou #35.43 ± 0.424.33 ± 0.04
32Ningyou #15.94 ± 0.614.18 ± 0.03Guyuan, Ningxia, China
33Yizhangyou #45.58 ± 0.073.73 ± 0.03Zhangjiakou, Hebei, China
34Yan 20095.39 ± 0.084.01 ± 0.01Datong, Shanxi, China
35Jinyan #135.13 ± 0.054.06 ± 0.06Datong, Shanxi, China
36Yizhangyou #55.31 ± 0.113.91 ± 0.03Zhangjiakou, Hebei, China
37Huawan #65.50 ± 0.563.78 ± 0.03Zhangjiakou, Hebei, China
38Yuanza #25.46 ± 0.044.43 ± 0.06Zhangjiakou, Hebei, China
39Ding you #15.46 ± 0.523.82 ± 0.00Dingxi, Gansu, China
40Jinyan #95.70 ± 0.873.13 ± 0.00Datong, Shanxi, China
41ZNY 2425.83 ± 0.833.80 ± 0.06Zhangjiakou, Hebei, China
42ZNY 2835.72 ± 0.723.55 ± 0.00Zhangjiakou, Hebei, China
43ZNY 2735.17 ± 0.524.23 ± 0.04Zhangjiakou, Hebei, China
44ZNY 2665.24 ± 0.084.31 ± 0.02Zhangjiakou, Hebei, China
45ZNY 2725.81 ± 0.743.89 ± 0.02Zhangjiakou, Hebei, China
46ZNY 2096.05 ± 0.573.84 ± 0.10Zhangjiakou, Hebei, China
47BY 15.59 ± 0.324.44 ± 0.09Zhangjiakou, Hebei, China
48BY 25.25 ± 0.394.98 ± 0.17Zhangjiakou, Hebei, China
49BY 35.37 ± 0.664.92 ± 0.07Zhangjiakou, Hebei, China
50BY 45.51 ± 0.495.22 ± 0.03Zhangjiakou, Hebei, China
51BY 55.32 ± 0.794.50 ± 0.04Zhangjiakou, Hebei, China
52BY 65.80 ± 0.494.45 ± 0.03Zhangjiakou, Hebei, China
53BY 75.75 ± 0.514.04 ± 0.10Zhangjiakou, Hebei, China
54BY 85.47 ± 0.494.28 ± 0.09Zhangjiakou, Hebei, China
55BY 96.03 ± 0.283.91 ± 0.11Zhangjiakou, Hebei, China
56BY 105.79 ± 0.424.31 ± 0.02Zhangjiakou, Hebei, China
57BY 115.62 ± 0.624.69 ± 0.05Zhangjiakou, Hebei, China
58BY 125.58 ± 0.584.19 ± 0.05Zhangjiakou, Hebei, China
59BY 135.49 ± 0.424.60 ± 0.09Zhangjiakou, Hebei, China
60BY 145.07 ± 0.194.52 ± 0.09Zhangjiakou, Hebei, China
61BY 155.54 ± 0.494.26 ± 0.04Zhangjiakou, Hebei, China
62BY 165.42 ± 0.794.47 ± 0.00Zhangjiakou, Hebei, China
63BY 175.13 ± 0.495.16 ± 0.00Zhangjiakou, Hebei, China
64BY 184.82 ± 0.514.44 ± 0.02Zhangjiakou, Hebei, China
65BY 195.27 ± 0.494.37 ± 0.03Zhangjiakou, Hebei, China
66BY 205.22 ± 0.284.03 ± 0.02Zhangjiakou, Hebei, China
67BY 215.55 ± 0.424.12 ± 0.01Zhangjiakou, Hebei, China
68BY 224.77 ± 0.624.07 ± 0.13Zhangjiakou, Hebei, China
69BY 235.31 ± 0.584.00 ± 0.05Zhangjiakou, Hebei, China
70BY 245.57 ± 0.424.13 ± 0.04Zhangjiakou, Hebei, China
71BY 254.80 ± 0.195.02 ± 0.12Zhangjiakou, Hebei, China
72BY 264.59 ± 0.254.61 ± 0.08Zhangjiakou, Hebei, China
73BY 275.76 ± 0.714.57 ± 0.06Zhangjiakou, Hebei, China
74BY 285.09 ± 0.554.37 ± 0.00Zhangjiakou, Hebei, China
75BY 295.00 ± 0.504.54 ± 0.00Zhangjiakou, Hebei, China
76BY 305.70 ± 0.473.43 ± 0.02Zhangjiakou, Hebei, China
77BY 315.41 ± 0.834.37 ± 0.02Zhangjiakou, Hebei, China
78BY 325.08 ± 1.074.04 ± 0.07Zhangjiakou, Hebei, China
79BY 334.43 ± 0.474.06 ± 0.12Zhangjiakou, Hebei, China
80BY 344.43 ± 0.275.17 ± 0.00Zhangjiakou, Hebei, China
81BY 355.01 ± 1.034.84 ± 0.00Zhangjiakou, Hebei, China
82BY 365.44 ± 0.104.37 ± 0.01Zhangjiakou, Hebei, China
83BY 375.26 ± 1.033.12 ± 0.00Zhangjiakou, Hebei, China
84BY 385.27 ± 0.393.13 ± 0.01Zhangjiakou, Hebei, China
85BY 394.69 ± 0.784.93 ± 0.01Zhangjiakou, Hebei, China
86BY 404.24 ± 0.373.90 ± 0.02Zhangjiakou, Hebei, China
87BY 414.85 ± 1.054.28 ± 0.02Zhangjiakou, Hebei, China
88BY 424.53 ± 1.314.45 ± 0.01Zhangjiakou, Hebei, China
89BY 434.54 ± 0.423.74 ± 0.04Zhangjiakou, Hebei, China
90BY 444.21 ± 0.114.03 ± 0.07Zhangjiakou, Hebei, China
91BY 455.01 ± 0.714.99 ± 0.08Zhangjiakou, Hebei, China
92BY 465.52 ± 0.664.16 ± 0.07Zhangjiakou, Hebei, China
93BY 475.64 ± 0.494.29 ± 0.06Zhangjiakou, Hebei, China
94BY 485.11 ± 0.424.25 ± 0.00Zhangjiakou, Hebei, China
95BY 494.22 ± 0.743.45 ± 0.04Zhangjiakou, Hebei, China
96BY 504.54 ± 0.163.73 ± 0.00Zhangjiakou, Hebei, China
97BY 514.92 ± 0.354.43 ± 0.00Zhangjiakou, Hebei, China
98BY 524.69 ± 0.794.13 ± 0.01Zhangjiakou, Hebei, China
99BY 535.02 ± 0.523.99 ± 0.02Zhangjiakou, Hebei, China
100ZNY2824.17 ± 0.054.45 ± 0.05Zhangjiakou, Hebei, China
Data were expressed as mean ± standard deviation (n = 3), w/w; weight/weight.
Table 3. Statistical results of partial least square regression models developed to predict the β-glucan content of hulled and naked oat samples.
Wavelength Range (nm)Hulled OatsNaked Oats
R2cR2pRMSECRMSEPR2cR2pRMSECRMSEP
700–13000.7890.7350.1770.1990.6770.6200.2100.228
1300–19000.4310.3010.2910.3230.3250.2260.3040.325
1900–25000.4600.3360.2840.3150.3820.2740.2910.315
Publisher’s Note: MDPI stays neutral with regard to jurisdictional claims in published maps and institutional affiliations.

