
Synbiotic Supplementation Improves Obesity Index and Metabolic Biomarkers in Thai Obese Adults: A Randomized Clinical Trial

 ,
,  ,
,  ,
, 
 ,
, 
Abstract
:1. Introduction
2. Materials and Methods
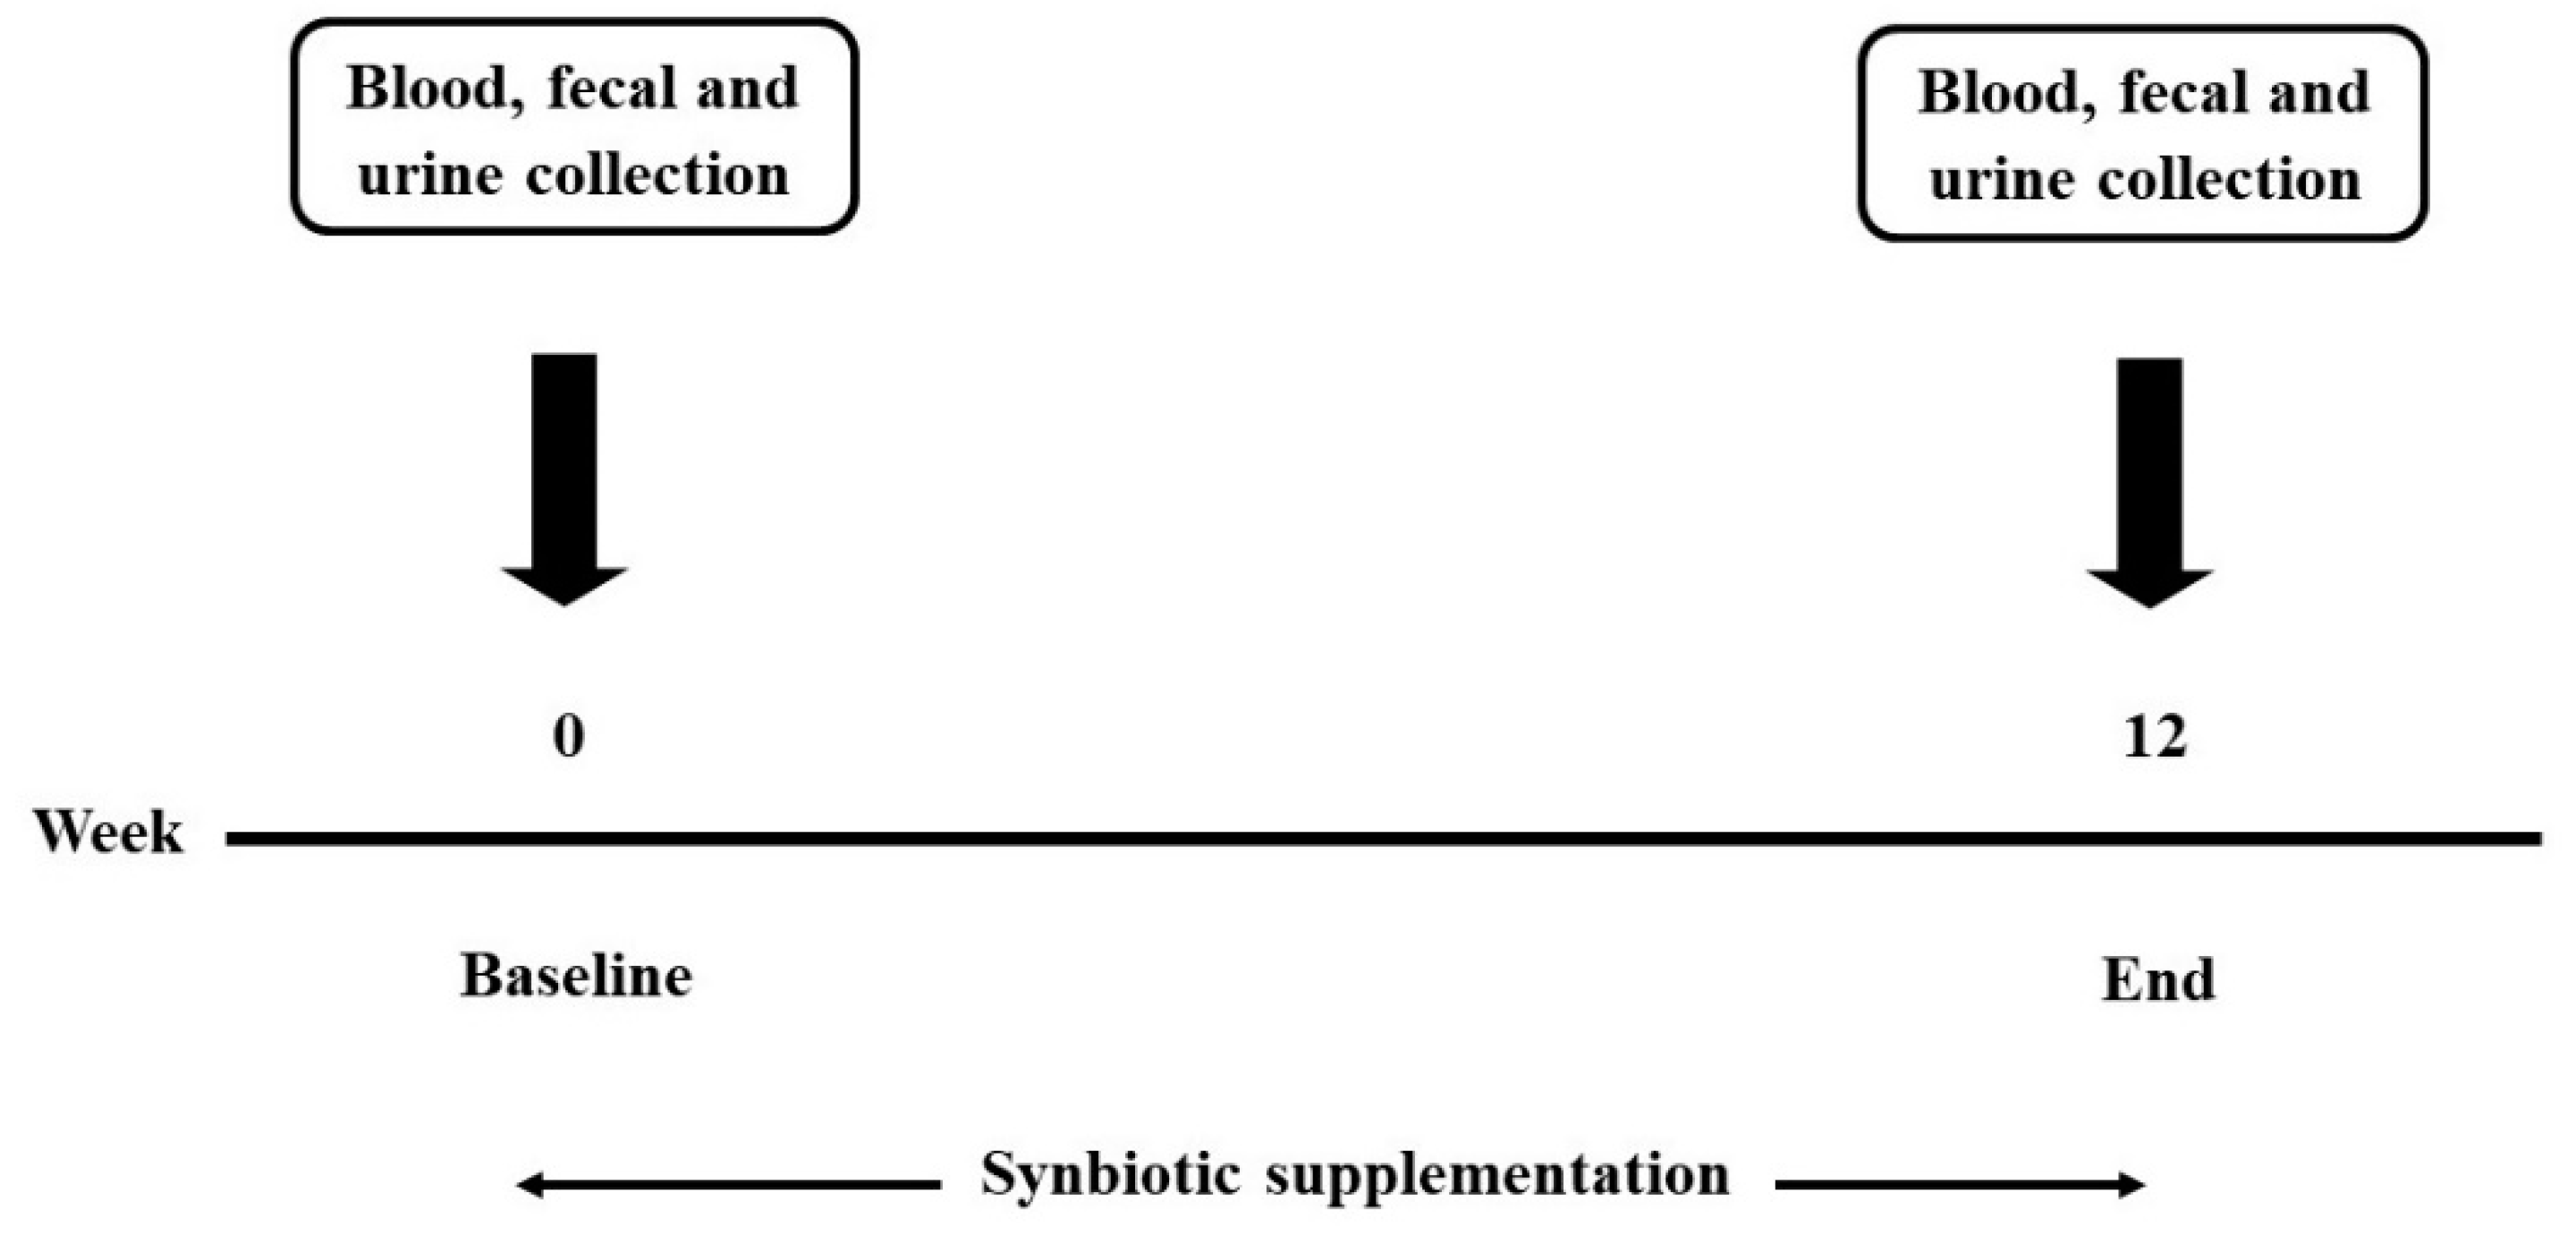
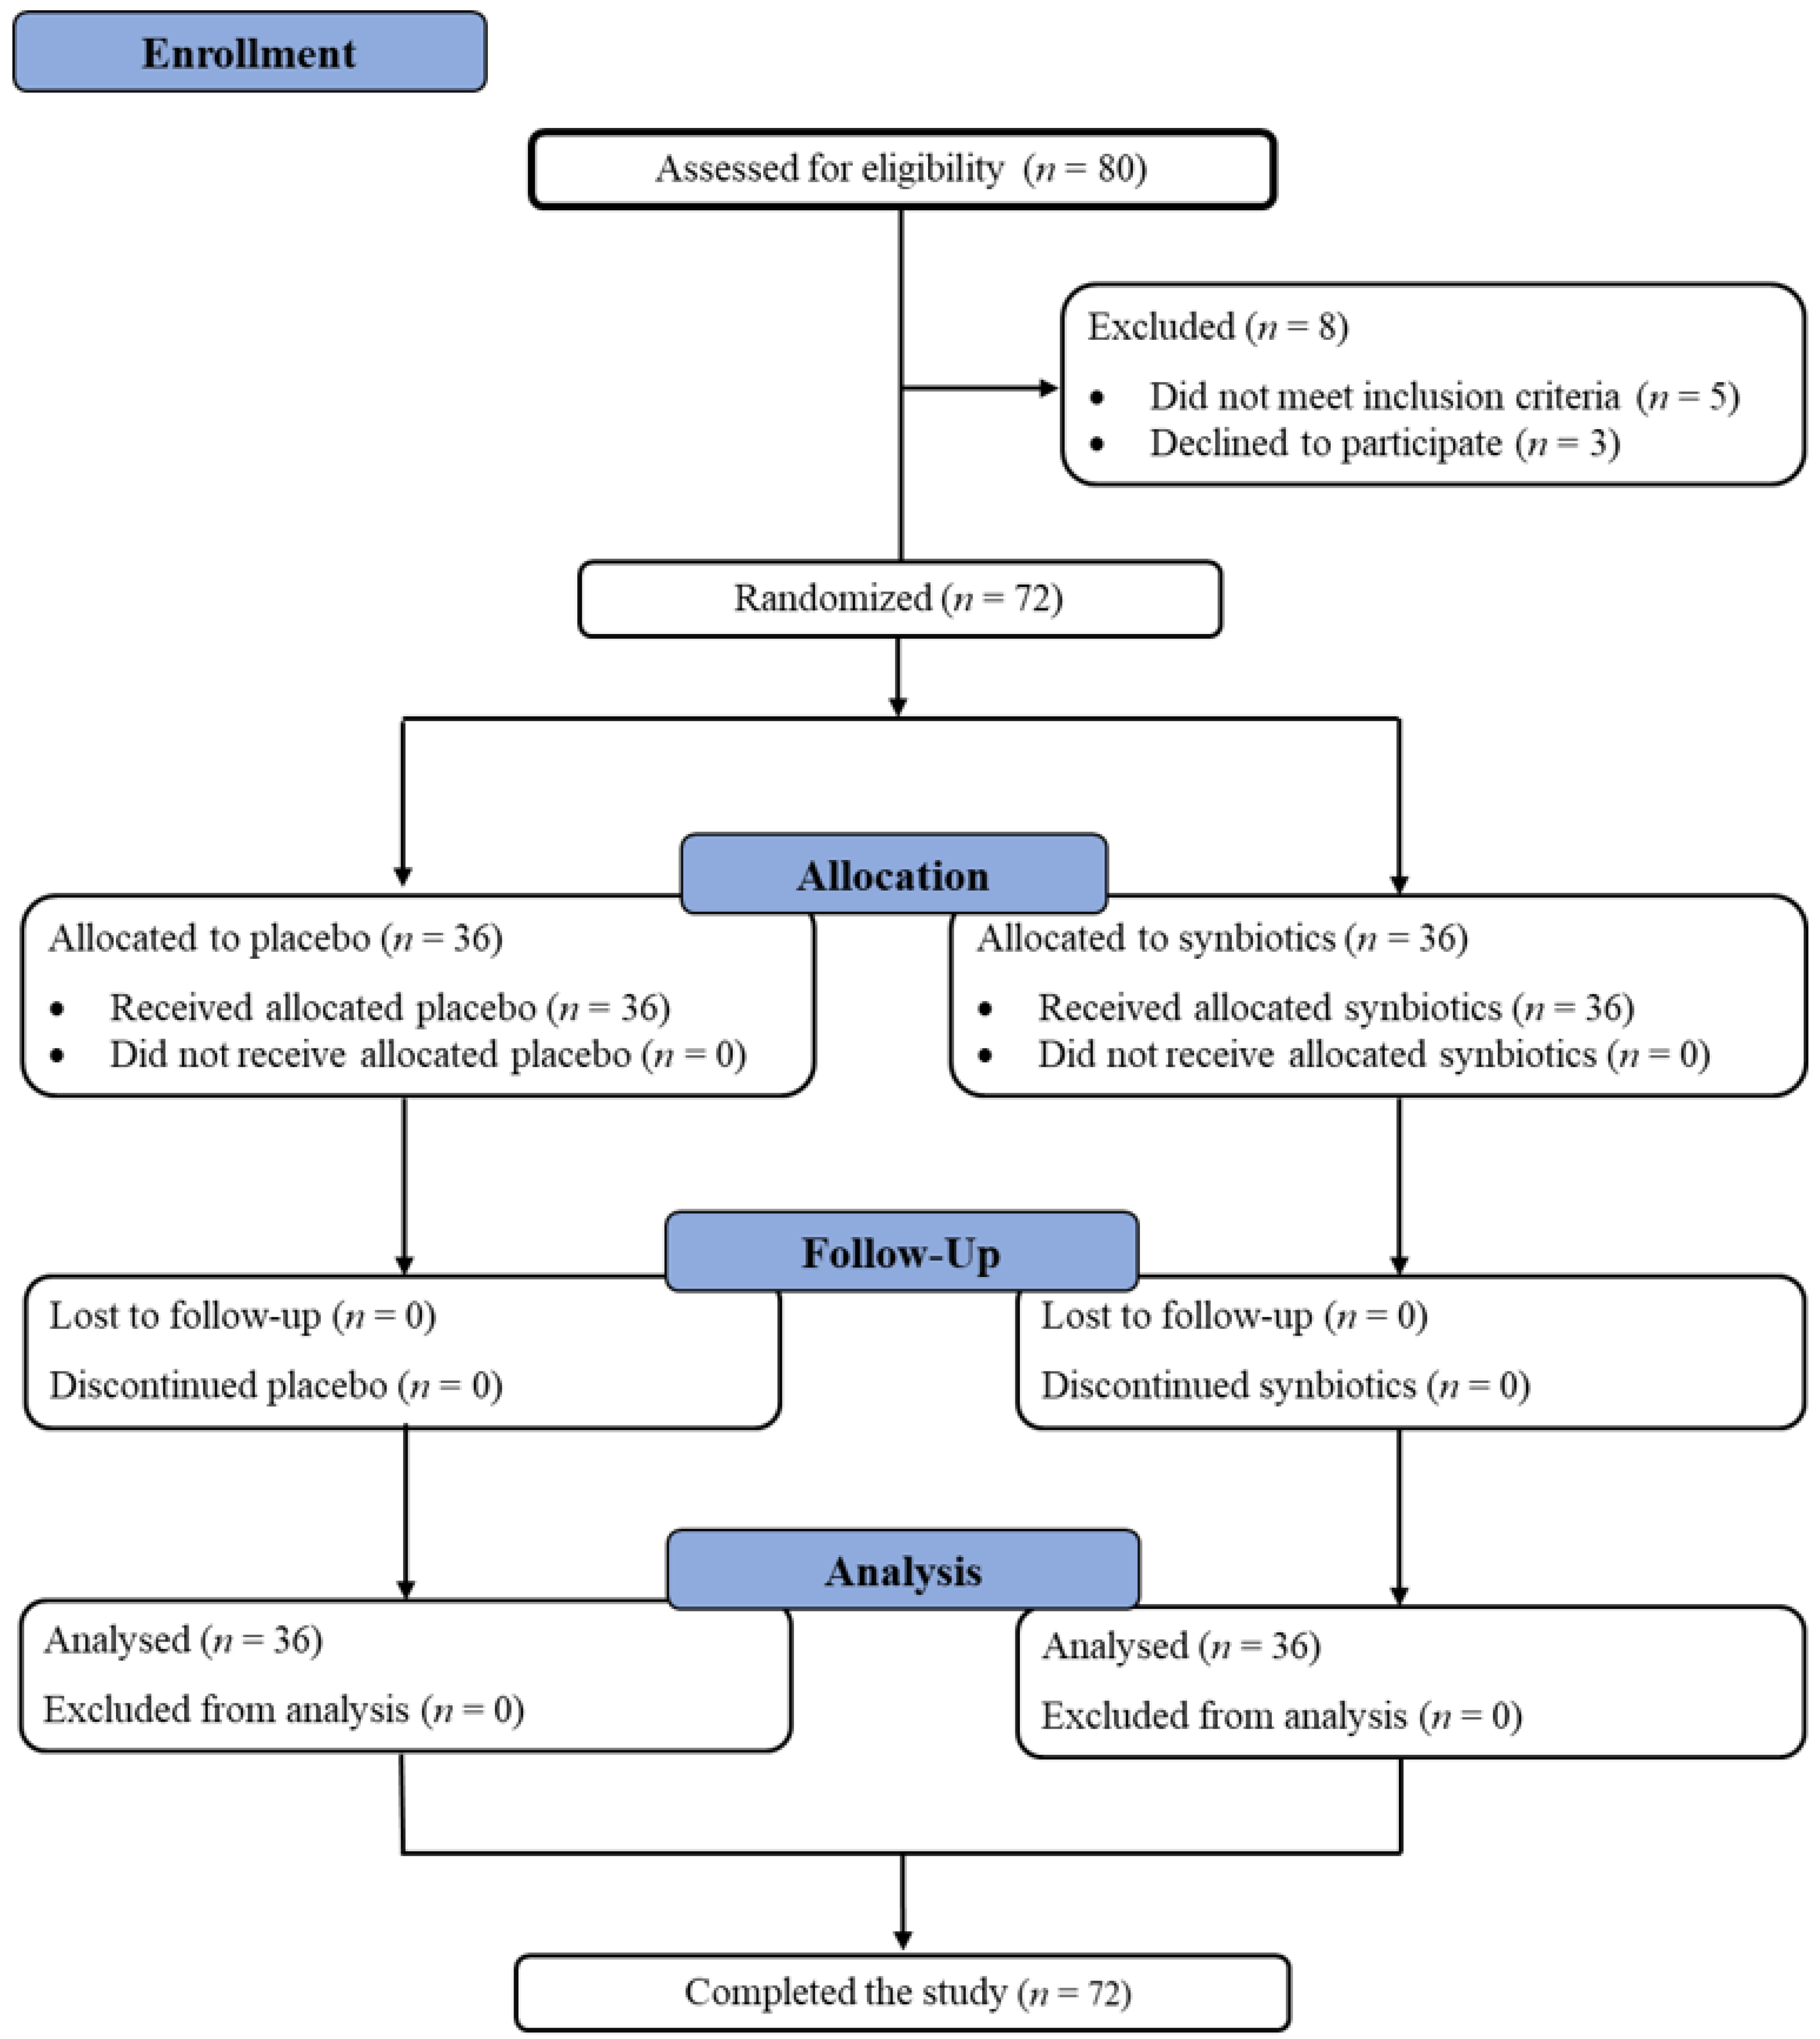
2.1. Study Design and Subjects
2.2. Treatment
2.3. Assessments
2.3.1. Clinical Data
2.3.2. Laboratory Data
2.3.3. Statistical Analyses
3. Results
4. Discussion
5. Conclusions
Author Contributions
Funding
Institutional Review Board Statement
Informed Consent Statement
Data Availability Statement
Acknowledgments
Conflicts of Interest
References
- Sivamaruthi, B.S.; Kesika, P.; Suganthy, N.; Chaiyasut, C. A review on role of microbiome in obesity and antiobesity properties of probiotic supplements. Biomed. Res. Int. 2019, 2019, 3291367. [Google Scholar] [CrossRef] [PubMed]
- Obesity and Overweight. Available online: https://www.who.int/en/news-room/fact-sheets/detail/obesity-and-overweight (accessed on 10 January 2021).
- Ley, R.E.; Turnbaugh, P.J.; Klein, S.; Gordon, J.I. Human gut microbes associated with obesity. Nature 2006, 444, 1022–1023. [Google Scholar] [CrossRef] [PubMed]
- Tremaroli, V.; Bäckhed, F. Functional interactions between the gut microbiota and host metabolism. Nature 2012, 489, 242–249. [Google Scholar] [CrossRef] [PubMed]
- Nagpal, R.; Newman, T.M.; Wang, S.; Jain, S.; Lovato, J.F.; Yadav, H. Obesity-linked gut microbiome dysbiosis associated with derangements in gut permeability and intestinal cellular homeostasis independent of diet. J. Diabetes Res. 2018, 2018, 3462092. [Google Scholar] [CrossRef] [PubMed]
- Boulangé, C.L.; Neves, A.L.; Chilloux, J.; Nicholson, J.K.; Dumas, M.E. Impact of the gut microbiota on inflammation, obesity, and metabolic disease. Genome Med. 2016, 8, 1–42. [Google Scholar] [CrossRef] [PubMed] [Green Version]
- Sivamaruthi, B.S.; Prasanth, M.I.; Kesika, P.; Chaiyasut, C. Probiotics in human mental health and diseases-A mini review. Trop. J. Pharm. Res. 2019, 18, 889–895. [Google Scholar] [CrossRef]
- Sivamaruthi, B.S.; Suganthy, N.; Kesika, P.; Chaiyasut, C. The role of microbiome, dietary supplements, and probiotics in autism spectrum disorder. Int. J. Environ. Res. Public Health 2020, 17, 2647. [Google Scholar] [CrossRef] [Green Version]
- Sivamaruthi, B.S.; Kesika, P.; Chaiyasut, C. The role of probiotics in colorectal cancer management. Evid. Based Complement. Alternat. Med. 2020, 2020, 3535982. [Google Scholar] [CrossRef] [Green Version]
- De Vrese, M.; Schrezenmeir, A.J. Probiotics, prebiotics, and synbiotics. In Food Biotechnology; Springer: Berlin/Heidelberg, Germany, 2008; pp. 1–66. [Google Scholar]
- Saghaei, M. Random allocation software for parallel group randomized trials. BMC Med. Res. Methodol. 2004, 4, 1–6. [Google Scholar] [CrossRef] [Green Version]
- Minami, J.; Iwabuchi, N.; Tanaka, M.; Yamauchi, K.; Xiao, J.Z.; Abe, F.; Sakane, N. Effects of Bifidobacterium breve B-3 on body fat reductions in pre-obese adults: A randomized, double-blind, placebo-controlled trial. Biosci. Microbiota Food Health. 2018, 37, 67–75. [Google Scholar] [CrossRef] [Green Version]
- Sang Gil, L.; Taoran, W.; Terrence, M.V.; Patrice, H.; Dae-Ok, K.; Sung, I.K. Validation of analytical methods for plasma total antioxidant capacity by comparing with urinary 8-isoprostane level. J. Microbiol. Biotechnol. 2017, 27, 388–394. [Google Scholar]
- Kambayashi, Y.; Binh, N.T.; Asakura, H.W.; Hibino, Y.; Hitomi, Y.; Nakamura, H.; Ogino, K. Efficient assay for total antioxidant capacity in human plasma using a 96-well microplate. J. Clin. Biochem. Nutr. 2009, 44, 46–51. [Google Scholar] [CrossRef] [Green Version]
- Zeb, A.; Ullah, F. A Simple Spectrophotometric Method for the Determination of Thiobarbituric Acid Reactive Substances in Fried Fast Foods. J. Anal. Methods Chem. 2016, 2016, 9412767. [Google Scholar] [CrossRef] [PubMed] [Green Version]
- Atasayar, S.; Orhan, H. Malondialdehyde quantification in blood plasma of tobacco smokers and non-smokers. Fabad J. Pharm. Sci. 2004, 29, 15–19. [Google Scholar]
- Joe, M.M.; Irwin, F. Superoxide Dismutase. J. Biol. Chem. 1969, 224, 6049–6065. [Google Scholar]
- Rahman, I.; Kode, A.; Biswas, S.K. Assay for quantitative determination of glutathione and glutathione disulfide levels using enzymatic recycling method. Nat. Protoc. 2006, 1, 3159–3165. [Google Scholar] [CrossRef] [PubMed]
- Kotani, A.; Miyaguchi, Y.; Kohama, M.; Ohtsuka, T.; Shiratori, T.; Kusu, F. Determination of short-chain fatty acids in rat and human feces by high-performance liquid chromatography with electrochemical detection. Anal. Sci. 2009, 25, 1007–1011. [Google Scholar] [CrossRef] [PubMed] [Green Version]
- Torii, T.; Kanemitsu, K.; Wada, T.; Itoh, S.; Kinugawa, K.; Hagiwara, A. Measurement of short-chain fatty acids in human faeces using high-performance liquid chromatography: Specimen stability. Ann. Clin. Biochem. 2010, 47, 447–452. [Google Scholar] [CrossRef]
- Birkett, A.M.; Jones, G.P.; Muir, J.G. Simple high-performance liquid chromatographic analysis of phenol and p-cresol in urine and feces. J. Chromatogr. B Biomed. Sci. Appl. 1995, 674, 187–191. [Google Scholar] [CrossRef]
- Chen, G.; Zamaratskaia, G.; Andersson, H.K.; Lundström, K. Effects of raw potato starch and live weight on fat and plasma skatole, indole and androstenone levels measured by different methods in entire male pigs. Food Chem. 2007, 101, 439–448. [Google Scholar] [CrossRef]
- Nowak, A.; Libudzisz, Z. Ability of intestinal lactic bacteria to bind or/and metabolise phenol and p-cresol. Ann. Microbiol. 2007, 57, 329–335. [Google Scholar] [CrossRef]
- Sequeira, I.R.; Lentle, R.G.; Kruger, M.C.; Hurst, R.D. Standardising the lactulose mannitol test of gut permeability to minimise error and promote comparability. PLoS ONE 2014, 9, e99256. [Google Scholar] [CrossRef] [PubMed] [Green Version]
- Barengolts, E. Gut microbiota, prebiotics, probiotics, and synbiotics in management of obesity and prediabetes: Review of randomized controlled trials. Endocr. Pract. 2016, 22, 1224–1234. [Google Scholar] [CrossRef] [PubMed] [Green Version]
- Raninen, K.; Lappi, J.; Mykkänen, H.; Poutanen, K. Dietary fiber type reflects physiological functionality: Comparison of grain fiber, inulin, and polydextrose. Nutr. Rev. 2011, 69, 9–21. [Google Scholar] [CrossRef] [PubMed]
- Vallianou, N.; Stratigou, T.; Christodoulatos, G.S.; Tsigalou, C.; Dalamaga, M. Probiotics, Prebiotics, Synbiotics, Postbiotics, and Obesity: Current evidence, controversies, and perspectives. Curr. Obes. Rep. 2020, 9, 179–192. [Google Scholar] [CrossRef] [PubMed]
- Park, S.; Bae, J.H. Probiotics for weight loss: A systematic review and meta-analysis. Nutr. Res. 2015, 35, 566–575. [Google Scholar] [CrossRef] [PubMed]
- Ji, Y.; Chung, Y.M.; Park, S.; Jeong, D.; Kim, B.; Holzapfel, W.H. Dose-dependent and strain-dependent anti-obesity effects of Lactobacillus sakei in a diet induced obese murine model. PeerJ 2019, 7, e6651. [Google Scholar] [CrossRef] [Green Version]
- Ji, Y.; Park, S.; Chung, Y.; Kim, B.; Park, H.; Huang, E.; Jeong, D.; Jung, H.; Kim, B.; Hyun, C.; et al. Amelioration of obesity-related biomarkers by Lactobacillus sakei CJLS03 in a high-fat diet-induced obese murine model. Sci. Rep. 2019, 9, 6821. [Google Scholar] [CrossRef] [Green Version]
- Vulevic, J.; Juric, A.; Tzortzis, G.; Gibson, G.R. A mixture of trans-galactooligosaccharide reduces markers of metabolic syndrome and modulates the fecal microbiota and immune function of overweight adults. J. Nutr. 2013, 143, 324–331. [Google Scholar] [CrossRef]
- Canfora, E.E.; van der Beek, C.M.; Hermes, G.; Goossens, G.H.; Jocken, J.; Holst, J.J.; van Eijk, H.M.; Venema, K.; Smidt, H.; Zoetendal, E.G.; et al. Supplementation of diet with galacto-oligosaccharides increases bifidobacteria, but not insulin sensitivity, in obese prediabetic individuals. Gastroenterology 2017, 153, 87–97. [Google Scholar] [CrossRef]
- Azcarate-Peril, M.A.; Butz, N.; Cadenas, M.B.; Koci, M.; Ballou, A.; Mendoza, M.; Ali, R.; Hassan, H. An attenuated Salmonella enterica Serovar Typhimurium strain and galacto-oligosaccharides accelerate clearance of salmonella infections in poultry through modifications to the gut microbiome. Appl. Environ. Microbiol. 2018, 84, e02526-17. [Google Scholar] [CrossRef] [PubMed] [Green Version]
- Sergeev, I.N.; Aljutaily, T.; Walton, G.; Huarte, E. Effects of Synbiotic Supplement on Human Gut Microbiota, Body Composition and Weight Loss in Obesity. Nutrients 2020, 12, 222. [Google Scholar] [CrossRef] [PubMed] [Green Version]
- Kadooka, Y.; Sato, M.; Imaizumi, K.; Ogawa, A.; Ikuyama, K.; Akai, Y.; Okano, M.; Kagoshima, M.; Tsuchida, T. Regulation of abdominal adiposity by probiotics (Lactobacillus gasseri SBT2055) in adults with obese tendencies in a randomized controlled trial. Eur. J. Clin. Nutr. 2010, 64, 636–643. [Google Scholar] [CrossRef] [PubMed] [Green Version]
- Aoun, A.; Darwish, F.; Hamod, N. The influence of the gut microbiome on obesity in adults and the role of probiotics, prebiotics, and synbiotics for weight loss. Prev. Nutr. Food Sci. 2020, 25, 113–123. [Google Scholar] [CrossRef] [PubMed]
- Hadi, A.; Ghaedi, E.; Khalesi, S.; Pourmasoumi, M.; Arab, A. Effects of synbiotic consumption on lipid profile: A systematic review and meta-analysis of randomized controlled clinical trials. Eur. J. Nutr. 2020, 59, 2857–2874. [Google Scholar] [CrossRef]
- Hadi, A.; Mohammadi, H.; Miraghajani, M.; Ghaedi, E. Efficacy of synbiotic supplementation in patients with nonalcoholic fatty liver disease: A systematic review and meta-analysis of clinical trials: Synbiotic supplementation and NAFLD. Crit. Rev. Food Sci. Nutr. 2019, 59, 2494–2505. [Google Scholar] [CrossRef]
- Konstantinov, S.R.; Smidt, H.; de Vos, W.M.; Bruijns, S.C.; Singh, S.K.; Valence, F.; Molle, D.; Lortal, S.; Altermann, E.; Klaenhammer, T.R.; et al. S layer protein A of Lactobacillus acidophilus NCFM regulates immature dendritic cell and T cell functions. Proc. Natl. Acad. Sci. USA 2008, 105, 19474–19479. [Google Scholar] [CrossRef] [Green Version]
- Ouwehand, A.C.; Tiihonen, K.; Saarinen, M.; Putaala, H.; Rautonen, N. Influence of a combination of Lactobacillus acidophilus NCFM and lactitol on healthy elderly: Intestinal and immune parameters. Br. J. Nutr. 2008, 101, 367–375. [Google Scholar] [CrossRef] [Green Version]
- Kimoto, H.; Ohmomo, S.; Okamoto, T. Cholesterol removal from media by Lactococci. J. Dairy Sci. 2002, 85, 3182–3188. [Google Scholar] [CrossRef]
- Lye, H.S.; Rusul, G.; Liong, M.T. Removal of cholesterol by lactobacilli via incorporation and conversion to coprostanol. J. Dairy Sci. 2010, 93, 1383–1392. [Google Scholar] [CrossRef] [Green Version]
- Begley, M.; Hill, C.; Gahan, C.G. Bile salt hydrolase activity in probiotics. Appl. Environ. Microbiol. 2006, 72, 1729–1738. [Google Scholar] [CrossRef] [PubMed] [Green Version]
- Patel, A.K.; Singhania, R.R.; Pandey, A.; Chincholkar, S.B. Probiotic bile salt hydrolase: Current developments and perspectives. Appl. Biochem. Biotechnol. 2010, 162, 166–180. [Google Scholar] [CrossRef]
- Wiciński, M.; Gębalski, J.; Gołębiewski, J.; Malinowski, B. Probiotics for the treatment of overweight and obesity in humans-A review of clinical trials. Microorganisms 2020, 8, 1148. [Google Scholar] [CrossRef] [PubMed]
- Hofmann, D.E.; Fraser, C.M.; Palumbo, F.; Ravel, J.; Rowthorn, V.; Schwartz, J. Probiotics: Achieving a better regulatory ft. Food Drug Law J. 2014, 69, 237–272. [Google Scholar]
- Crovesy, L.; Ostrowski, M.; Ferreira, D.; Rosado, E.L.; Soares-Mota, M. Effect of Lactobacillus on body weight and body fat in overweight subjects: A systematic review of randomized controlled clinical trials. Int. J. Obes. 2017, 41, 1607–1614. [Google Scholar] [CrossRef]
- Krumbeck, J.A.; Rasmussen, H.E.; Hutkins, R.W.; Clarke, J.; Shawron, K.; Keshavarzian, A.; Walter, J. Probiotic Bifidobacterium strains and galacto-oligosaccharides improve intestinal barrier function in obese adults but show no synergism when used together as synbiotics. Microbiome 2018, 6, 121. [Google Scholar] [CrossRef]
- Barathikannan, K.; Chelliah, R.; Rubab, M.; Daliri, E.B.; Elahi, F.; Kim, D.H.; Agastian, P.; Oh, S.Y.; Oh, D.H. Gut microbiome modulation based on probiotic application for anti-obesity: A review on efficacy and validation. Microorganisms 2019, 7, 456. [Google Scholar] [CrossRef] [Green Version]
- Hotamisligil, G.S. Endoplasmic reticulum stress and inflammation in obesity and type 2 diabetes. Novartis Found. Symp. 2007, 286, 86–203. [Google Scholar] [PubMed]
- Hotamisligil, G.S.; Erbay, E. Nutrient sensing and inflammation in metabolic diseases. Nat. Rev. Immunol. 2008, 8, 923–934. [Google Scholar] [CrossRef] [Green Version]
- Scarpellini, E.; Tack, J. Obesity and metabolic syndrome: An inflammatory condition. Dig. Dis. 2012, 30, 148–153. [Google Scholar] [CrossRef]
- Ferrarese, R.; Ceresola, E.R.; Preti, A.; Canducci, F. Probiotics, prebiotics and synbiotics for weight loss and metabolic syndrome in the microbiome era. Eur. Rev. Med. Pharmacol. Sci. 2018, 22, 7588–7605. [Google Scholar]
- Dehghan, P.; Pourghassem Gargari, B.; Asgharijafarabadi, M. Effects of high performance inulin supplementation on glycemic status and lipid profile in women with type 2 diabetes: A randomized, placebo-controlled clinical trial. Health Promot. Perspect. 2013, 3, 55–63. [Google Scholar]
- Genta, S.; Cabrera, W.; Habib, N.; Pons, J.; Carillo, I.M.; Grau, A.; Sánchez, S. Yacon syrup: Beneficial effects on obesity and insulin resistance in humans. Clin. Nutr. 2009, 28, 182–187. [Google Scholar] [CrossRef]
- Pourghassem Gargari, B.; Dehghan, P.; Aliasgharzadeh, A.; Asghari Jafar-Abadi, M. Effects of high performance inulin supplementation on glycemic control and antioxidant status in women with type 2 diabetes. Diabetes Metab. J. 2013, 37, 140–148. [Google Scholar] [CrossRef]
- Dehghan, P.; Pourghassem Gargari, B.; Asghari Jafarabadi, M. Oligofructose-enriched inulin improves some inflammatory markers and metabolic endotoxemia in women with type 2 diabetes mellitus: A randomized controlled clinical trial. Nutrition 2014, 30, 418–423. [Google Scholar] [CrossRef]
- Hotamisligil, G.S.; Arner, P.; Caro, J.F.; Atkinson, R.L.; Spiegelman, B.M. Increased adipose tissue expression of tumor necrosis factor-alpha in human obesity and insulin Resistance. J. Clin. Investig. 1995, 95, 2409–2415. [Google Scholar] [CrossRef]
- Lubberts, E. I/-/H targeting: On the road to prevent chronic destructive arthritis? Cytokine 2008, 41, 84–91. [Google Scholar] [CrossRef] [Green Version]
- Pang, G.; Couch, L.; Batey, R.; Clancy, R.; Cripps, A. GM-CSF, IL-1 alpha, IL-1 beta, IL-6, IL-8, IL-10, ICAM-1 and VCAM-1 gene expression and cytokine production in human duodenal fibroblasts stimulated with lipopolysaccharide, IL-l alpha and TNF- alpha. Clin. Exp. Immunol. 1994, 96, 437–443. [Google Scholar] [CrossRef]
- Afarideh, M.; Behdadnia, A.; Noshad, S.; Mirmiranpour, H.; Mousavizadeh, M.; Khajeh, E.; Rad, M.V.; Mazaheri, T.; Nakhjavani, M.; Esteghamati, A. Association of Peripheral 5-Hydroxyindole-3-Acetic Acid, A serotonin derivative, with metabolic syndrome and low-grade inflammation. Endocr Pract. 2015, 21, 711–718. [Google Scholar] [CrossRef]
- Tecott, L.H.; Sun, L.M.; Akana, S.F.; Strack, A.M.; Lowenstein, D.H.; Dallman, M.F.; Julius, D. Eating disorder and epilepsy in mice lacking 5-HT2c serotonin receptors. Nature 1995, 374, 542–546. [Google Scholar] [CrossRef]
- Jonnakuty, C.; Gragnoli, C. What do we know about serotonin? J. Cell Physiol. 2008, 217, 301–306. [Google Scholar] [CrossRef]
- Kinoshita, M.; Ono, K.; Horie, T.; Nagao, K.; Nishi, H.; Kuwabara, Y.; Takanabe-Mori, R.; Hasegawa, K.; Kita, T.; Kimura, T. Regulation of adipocyte differentiation by activation of serotonin (5-HT) receptors 5-HT2AR and 5-HT2CR and involvement of microRNA-448-mediated repression of KLF5. Mol. Endocrinol. 2010, 24, 1978–1987. [Google Scholar] [CrossRef] [Green Version]
- Kim, H.J.; Kim, J.H.; Noh, S.; Hur, H.J.; Sung, M.J.; Hwang, J.T.; Park, J.H.; Yang, H.J.; Kim, M.S.; Kwon, D.Y.; et al. Metabolomic analysis of livers and serum from high-fat diet induced obese mice. J. Proteome Res. 2011, 10, 722–731. [Google Scholar] [CrossRef] [PubMed]
- Wang, W.; Uzzau, S.; Goldblum, S.E.; Fasano, A. Human zonulin, a potential modulator of intestinal tight junctions. J. Cell Sci. 2000, 113 Pt 24, 4435–4440. [Google Scholar] [CrossRef]
- Sapone, A.; de Magistris, L.; Pietzak, M.; Clemente, M.G.; Tripathi, A.; Cucca, F.; Lampis, R.; Kryszak, D.; Cartenì, M.; Generoso, M.; et al. Zonulin upregulation is associated with increased gut permeability in subjects with type 1 diabetes and their relatives. Diabetes 2006, 55, 1443–1449. [Google Scholar] [CrossRef] [PubMed] [Green Version]
- Tripathi, A.; Lammers, K.M.; Goldblum, S.; Shea-Donohue, T.; Netzel-Arnett, S.; Buzza, M.S.; Antalis, T.M.; Vogel, S.N.; Zhao, A.; Yang, S.; et al. Identification of human zonulin, a physiological modulator of tight junctions, as prehaptoglobin-2. Proc. Natl. Acad. Sci. USA 2009, 106, 16799–16804. [Google Scholar] [CrossRef] [Green Version]
- Aasbrenn, M.; Lydersen, S.; Farup, P.G. Changes in serum zonulin in individuals with morbid obesity after weight-loss interventions: A prospective cohort study. BMC Endocr Disord. 2020, 20, 108. [Google Scholar] [CrossRef]
- Ramezani Ahmadi, A.; Sadeghian, M.; Alipour, M.; Ahmadi Taheri, S.; Rahmani, S.; Abbasnezhad, A. The effects of probiotic/synbiotic on serum level of zonulin as a biomarker of intestinal permeability: A systematic review and meta-analysis. Iran. J. Public Health 2020, 49, 1222–1231. [Google Scholar] [CrossRef]
- Kamari, Y.; Shaish, A.; Vax, E.; Shemesh, S.; Kandel-Kfir, M.; Arbel, Y.; Olteanu, S.; Barshack, I.; Dotan, S.; Voronov, E.; et al. Lack of interleukin-1α or interleukin-1β inhibits transformation of steatosis to steatohepatitis and liver fibrosis in hypercholesterolemic mice. J. Hepatol. 2011, 55, 1086–1094. [Google Scholar] [CrossRef] [Green Version]
- Nov, O.; Shapiro, H.; Ovadia, H.; Tarnovscki, T.; Dvir, I.; Shemesh, E.; Kovsan, J.; Shelef, I.; Carmi, Y.; Voronov, E.; et al. Interleukin-1β regulates fat-liver crosstalk in obesity by auto-paracrine modulation of adipose tissue inflammation and expandability. PLoS ONE 2013, 8, e53626. [Google Scholar]


| Parameters | Synbiotic Group | Placebo Group | p-Value |
|---|---|---|---|
| (N = 36) | (N = 36) | ||
| Age (years) | 54.78 ± 1.92 | 58.94 ± 1.32 | 0.078 |
| Body weight, cm | 69.09 ± 1.90 | 68.17 ± 1.63 | 0.712 |
| Body mass index, kg/m2 | 28.97 ± 0.77 | 30.01 ± 0.47 | 0.248 |
| Body fat, % | 33.09 ± 1.18 | 35.36 ± 0.87 | 0.125 |
| Visceral fat, % | 14.18 ± 0.88 | 15.36 ± 0.43 | 0.223 |
| Muscle, % | 56.48 ± 3.85 | 59.19 ± 1.44 | 0.497 |
| BMR (kcal) | 1409.42 ± 31.93 | 1323.04 ± 23.86 | 0.033 * |
| Arm circumference, cm | 30.71 ± 0.49 | 30.62 ± 0.48 | 0.893 |
| Waist circumference, cm | 94.73 ± 1.92 | 95.79 ± 1.34 | 0.651 |
| Hip circumference, cm | 103.09 ± 1.38 | 104.33 ± 1.10 | 0.486 |
| Waist/hip ratio | 0.92 ± 0.01 | 0.92 ± 0.01 | 0.94 |
| Diabetes, n (%) | 7 (19.44%) | 13 (36.11%) | 0.188 |
| Alcohol drinking, n (%) | 6 (16.67%) | 4 (11.11%) | 0.735 |
| Blood urea nitrogen (mg/dL) | 14.89 ± 0.93 | 16.86 ± 1.84 | 0.699 |
| Creatinine (mg/dL) | 1.09 ± 0.09 | 1.08 ± 0.10 | 0.964 |
| Aspartate aminotransferase (IU/L) | 25.43 ± 4.62 | 24.73 ± 2.32 | 0.744 |
| Alanine aminotransferase (IU/L) | 27.59 ± 6.00 | 23.68 ± 2.97 | 0.925 |
| Parameters | Synbiotic (N = 36) | p-Value | Placebo (N = 36) | p-Value | ||
|---|---|---|---|---|---|---|
| Baseline | 12 Weeks | Baseline | 12 Weeks | |||
| Body weight, cm | 69.09 ± 1.90 | 67.45 ± 1.85 | <0.001 * | 68.17 ± 1.63 | 67.71 ± 1.71 | 0.067 |
| Body mass index, kg/m2 | 28.97 ± 0.77 | 28.58 ± 0.75 | 0.017 * | 30.01 ± 0.47 | 30.13 ± 0.58 | 0.662 |
| Body fat, % | 33.09 ± 1.18 | 31.96 ± 1.20 | 0.043 * | 35.36 ± 0.87 | 36.27 ± 1.22 | 0.310 |
| Visceral fat, % | 14.18 ± 0.88 | 13.85 ± 0.79 | 0.162 | 15.36 ± 0.43 | 15.56 ± 0.52 | 0.445 |
| Muscle, % | 56.48 ± 3.85 | 56.08 ± 3.81 | 0.284 | 59.19 ± 1.44 | 59.01 ± 1.42 | 0.860 |
| BMR (kcal) | 1409.42 ± 31.93 | 1411.27 ± 29.61 | 0.898 | 1323.04 ± 23.86 | 1309.68 ± 24.87 | 0.102 |
| Arm circumference, cm | 30.71 ± 0.49 | 30.59 ± 0.57 | 0.808 | 30.62 ± 0.48 | 30.51 ± 0.53 | 0.795 |
| Waist circumference, cm | 94.73 ± 1.92 | 92.76 ± 1.84 | 0.009 * | 95.79 ± 1.34 | 95.34 ± 1.45 | 0.648 |
| Hip circumference, cm | 103.09 ± 1.38 | 102.50 ± 1.30 | 0.419 | 104.33 ± 1.10 | 103.84 ± 1.31 | 0.705 |
| Waist/hip ratio | 0.92 ± 0.01 | 0.90 ± 0.01 | 0.018 * | 0.92 ± 0.01 | 0.92 ± 0.01 | 0.961 |
| Total cholesterol (mg/dL) | 200.97 ± 8.40 | 195.50 ± 6.48 | 0.171 | 203.30 ± 8.11 | 199.97 ± 7.67 | 0.626 |
| Triglyceride (mg/dL) | 150.24 ± 16.04 | 145.97 ± 14.66 | 0.469 | 148.64 ± 11.04 | 149.88 ± 11.20 | 0.893 |
| HDL-cholesterol (mg/dL) | 50.21 ± 2.42 | 53.10 ± 2.53 | 0.030 * | 50.42 ± 1.47 | 50.91 ± 2.56 | 0.813 |
| LDL-cholesterol (mg/dL) | 123.93 ± 8.61 | 112.66 ± 6.62 | 0.017 * | 123.35 ± 7.35 | 116.48 ± 7.06 | 0.295 |
| FBS (mg/dL) | 111.79 ± 7.44 | 109.00 ± 6.02 | 0.373 | 109.68 ± 6.76 | 118.18 ± 6.89 | 0.084 |
| IL-6 (pg/mL) | 11.65 ± 1.17 | 7.24 ± 1.63 | 0.017 * | 11.84 ± 0.49 | 11.82 ± 1.16 | 0.116 |
| IL-10 (pg/mL) | 1.04 ± 0.19 | 9.91 ± 2.04 | 0.018 * | 1.56 ± 0.13 | 9.20 ± 5.00 | 0.153 |
| IL-1β (pg/mL) | 7.79 ± 0.76 | 5.42 ± 0.80 | 0.008 * | 6.97 ± 0.64 | 6.29 ± 0.39 | 0.117 |
| TNF-α (pg/mL) | 13.75 ± 2.93 | 7.59 ± 1.54 | 0.011 * | 9.25 ± 0.90 | 9.22 ± 0.56 | 0.679 |
| IgA (ng/mL) | 521.02 ± 69.33 | 636.48 ± 79.23 | 0.004 * | 579.40 ± 54.02 | 504.73 ± 60.96 | 0.877 |
| hsCRP (ml/L) | 0.017 ± 0.006 | 0.008 ± 0.002 | 0.086 | 0.012 ± 0.001 | 0.015 ± 0.001 | 0.078 |
| LPS (pg/mL) | 108.99 ± 9.62 | 55.00 ± 6.09 | <0.001 * | 93.92 ± 7.87 | 81.42 ± 6.18 | 0.054 |
| ZO-1 (ng/mL) | 1.37 ± 0.17 | 0.98 ± 0.18 | 0.032 * | 1.42 ± 0.17 | 1.41 ± 0.16 | 0.551 |
| Parameters | Synbiotic (N = 36) | p-Value | Placebo (N = 36) | p-Value | ||
|---|---|---|---|---|---|---|
| Baseline | 12 Weeks | Baseline | 12 Weeks | |||
| Lactulose | 0.16 ± 0.03 | 0.07 ± 0.02 | <0.001 * | 0.12 ± 0.03 | 0.08 ± 0.02 | 0.135 |
| Lactulose/mannitol ratio | 0.20 ± 0.06 | 0.09 ± 0.01 | 0.072 | 0.14 ± 0.02 | 0.12 ± 0.02 | 0.315 |
| QA (ng/mL) | 23.53 ± 2.42 | 13.75 ± 1.71 | <0.001 * | 22.44 ± 1.69 | 24.25 ± 1.46 | 0.375 |
| 5-HIAA (mg/L) | 5.04 ± 1.12 | 9.61 ± 1.95 | 0.051 | 4.00 ± 0.66 | 4.95 ± 0.93 | 0.642 |
| QA/5-HIAA Ratio | 3.14 ± 1.60 | 1.04 ± 0.46 | 0.008 * | 5.76 ± 2.23 | 4.71 ± 1.77 | 0.756 |
| Cresol (umol/g sample) | 0.24 ± 0.03 | 0.09 ± 0.05 | 0.017 * | 0.31 ± 0.16 | 0.14 ± 0.05 | 0.225 |
| Indole (umol/g sample) | 0.06 ± 0.01 | 0.04 ± 0.00 | 0.035 * | 0.11 ± 0.06 | 0.06 ± 0.02 | 0.18 |
| Skatole (umol/g sample) | 0.07 ± 0.03 | 0.04 ± 0.00 | 0.285 | 0.05 ± 0.03 | 0.15 ± 0.07 | 0.285 |
| Butyric acid (mmol/g sample) | 38.01 ± 8.59 | 93.80 ± 18.96 | 0.002 * | 46.40 ± 12.29 | 80.03 ± 32.27 | 0.311 |
| Propionic acid (mmol/g sample) | 259.16 ± 38.67 | 624.12 ± 82.82 | <0.001 * | 209.44 ± 72.32 | 466.52 ± 178.52 | 0.124 |
| Acetic acid (mmol/g sample) | 202.63 ± 37.70 | 425.89 ± 50.86 | <0.001 * | 206.56 ± 61.60 | 400.27 ± 69.40 | 0.161 |
| Lactic acid (mmol/g sample) | 54.42 ± 17.98 | 175.81 ± 36.88 | 0.002 * | 92.11 ± 53.12 | 140.03 ± 57.00 | 0.866 |
| TAC (µmol/mL) | 0.195 ± 0.003 | 0.200 ± 0.011 | 0.664 | 0.180 ± 0.012 | 0.193 ± 0.008 | 0.08 |
| MDA (µmol/mL) | 0.45 ± 0.06 | 0.53 ± 0.09 | 0.301 | 0.52 ± 0.04 | 0.45 ± 0.03 | 0.157 |
| GSH (µg/mL) | 44.99 ± 17.46 | 30.98 ± 10.63 | 0.075 | 24.87 ± 6.86 | 17.29 ± 8.83 | 0.08 |
| Total SOD (Units/mL enzyme) | 56.91 ± 5.52 | 57.30 ± 6.28 | 0.854 | 54.01 ± 11.78 | 59.29 ± 7.24 | 0.492 |
| Cu,Zn-SOD (Units/mL enzyme) | 16.93 ± 3.13 | 44.57 ± 17.96 | 0.345 | 35.28 ± 7.34 | 39.49 ± 19.28 | 0.686 |
| Parameters | Baseline–12 Weeks | p-Value | |
|---|---|---|---|
| Synbiotic (N = 36) | Placebo (N = 36) | ||
| Body weight, cm | −1.64 | −0.46 | 0.002 * |
| Body mass index, kg/m2 | −0.39 | 0.13 | 0.128 |
| Body fat, % | −1.13 | 0.92 | 0.068 |
| Visceral fat, % | −0.32 | 0.19 | 0.242 |
| Muscle, % | −0.40 | −0.18 | 0.448 |
| BMR (kcal) | 1.85 | −13.36 | 0.483 |
| Arm circumference, cm | −0.12 | −0.11 | 0.809 |
| Waist circumference, cm | −1.97 | −0.45 | 0.113 |
| Hip circumference, cm | −0.59 | −0.49 | 0.51 |
| Waist/hip ratio | −0.014 | 0.001 | 0.604 |
| Total cholesterol (mg/dL) | −5.47 | −3.33 | 0.695 |
| Triglyceride (mg/dL) | −4.28 | 1.24 | 0.521 |
| HDL-cholesterol (mg/dL) | 2.9 | 0.48 | 0.066 |
| LDL-cholesterol (mg/dL) | −11.28 | −6.87 | 0.599 |
| FBS (mg/dL) | −2.79 | 8.5 | 0.043 * |
| IL-6 (pg/mL) | −4.41 | −0.02 | 0.010 * |
| IL-10 (pg/mL) | 8.87 | 7.64 | 0.142 |
| IL-1β (pg/mL) | −2.37 | −0.69 | 0.041 * |
| TNF-α (pg/mL) | −6.16 | −0.04 | 0.005 * |
| IgA (ng/mL) | 115.46 | −74.67 | 0.049 * |
| hsCRP (ml/L) | −0.009 | 0.003 | 0.002 * |
| LPS (pg/mL) | −53.99 | −12.50 | 0.002 * |
| ZO-1 (ng/mL) | −0.39 | −0.01 | 0.061 |
| Parameters | Baseline–12 Weeks | p-Value | |
|---|---|---|---|
| Synbiotic (N = 36) | Placebo (N = 36) | ||
| Lactulose | −0.08 | −0.04 | 0.002 * |
| Lactulose/mannitol ratio | −0.11 | −0.02 | 0.508 |
| QA (ng/mL) | −9.78 | 1.8 | <0.001 * |
| 5-HIAA (mg/L) | 4.58 | 0.94 | 0.157 |
| QA/5-HIAA Ratio | −2.10 | −1.05 | 0.095 |
| Cresol (umol/g sample) | −0.15 | −0.16 | 0.661 |
| Indole (umol/g sample) | −0.03 | −0.05 | 0.379 |
| Skatole (umol/g sample) | −0.031 | 0.103 | 0.121 |
| Butyric acid (mmol/g sample) | 55.79 | 33.64 | 0.229 |
| Propionic acid (mmol/g sample) | 364.96 | 257.09 | 0.258 |
| Acetic acid (mmol/g sample) | 223.25 | 193.71 | 0.47 |
| Lactic acid (mmol/g sample) | 121.39 | 47.92 | 0.162 |
| TAC (µmol/mL) | 0.005 | 0.013 | 0.557 |
| MDA (µmol/mL) | 0.08 | −0.07 | 0.117 |
| GSH (µg/mL) | −14.01 | −7.59 | 0.584 |
| Total SOD (Units/mL enzyme) | 0.39 | 5.28 | 0.917 |
| Cu,Zn-SOD (Units/mL enzyme) | 27.64 | 4.21 | 0.251 |
| Parameter | Coefficient | 95% CI | p-Value |
|---|---|---|---|
| Body weight, cm | −1.76 | (−3.17 to −0.34) | 0.018 * |
| Body mass index, kg/m2 | 0.123 | (−0.64 to 0.88) | 0.744 |
| Body fat, % | −2.55 | (−4.74 to −0.37) | 0.023 * |
| Visceral fat, % | −0.17 | (−0.96 to 0.61) | 0.651 |
| Muscle, % | −5.13 | (−8.82 to −1.44) | 0.027 * |
| BMR (kcal) | 57.27 | (2.77 to 111.76) | 0.040 * |
| Arm circumference, cm | −0.14 | (−2.61 to 2.33) | 0.909 |
| Waist circumference, cm | −2.73 | (−5.23 to −0.23) | 0.033 * |
| Hip circumference, cm | −4.54 | (−10.06 to 0.97) | 0.103 |
| Waist/hip ratio | −0.02 | (−0.05 to 0.01) | 0.131 |
| Total cholesterol (mg/dL) | −8.01 | (−26.91 to 10.90) | 0.397 |
| Triglyceride (mg/dL) | −0.02 | (−23.02 to 22.97) | 0.998 |
| HDL-cholesterol (mg/dL) | 3.22 | (−1.84 to 8.27) | 0.207 |
| LDL-cholesterol (mg/dL) | −10.57 | (−26.42 to 5.28) | 0.186 |
| FBS (mg/dL) | −2.24 | (−16.42 to 11.94) | 0.751 |
| IL-6 (pg/mL) | −4.50 | (−8.78 to −0.23) | 0.040 * |
| IL-10 (pg/mL) | 5.18 | (−9.96 to 20.32) | 0.477 |
| IL-1β (pg/mL) | −1.43 | (−2.78 to −0.08) | 0.039 * |
| TNF-α (pg/mL) | −4.26 | (−6.51 to −2.01) | 0.001 * |
| IgA (ng/mL) | 117.99 | (−55.97 to 291.95) | 0.179 |
| hsCRP (ml/L) | −0.003 | (−0.011 to 0.005) | 0.497 |
| LPS (pg/mL) | −32.59 | (−53.68 to −11.49) | 0.004 * |
| ZO-1 (ng/mL) | −0.57 | (−1.08 to −0.06) | 0.032 * |
| Lactulose | −0.02 | (−0.07 to 0.02) | 0.319 |
| Lactulose/mannitol ratio | −0.12 | (−0.20 to −0.04) | 0.008 * |
| QA (ng/mL) | −8.22 | (−16.04 to −0.40) | 0.041 * |
| 5-HIAA (mg/L) | 8.59 | (0.68 to 16.50) | 0.036 * |
| QA/5-HIAA Ratio | −7.15 | (−13.69 to −0.61) | 0.035 * |
| Cresol (umol/g sample) | 0.09 | (−0.30 to 0.48) | 0.583 |
| Indole (umol/g sample) | −0.004 | (−0.054 to 0.046) | 0.865 |
| Skatole (umol/g sample) | −0.47 | (−2.07 to 1.12) | 0.165 |
| Butyric acid (mmol/g sample) | 59.74 | (20.30 to 99.17) | 0.009 * |
| Propionic acid (mmol/g sample) | −171.28 | (−541.06 to 198.51) | 0.335 |
| Acetic acid (mmol/g sample) | −111.03 | (−324.73 to 102.68) | 0.28 |
| Lactic acid (mmol/g sample) | 6.73 | (−135.27 to 148.73) | 0.919 |
| TAC (µmol/mL) | −0.03 | (−0.09 to 0.04) | 0.284 |
| MDA (µmol/mL) | 0.43 | (−0.36 to 1.22) | 0.18 |
| GSH (µg/mL) | 7.48 | (−6.37 to 21.33) | 0.208 |
| Total SOD (Units/mL enzyme) | −32.33 | (−91.18 to 26.52) | 0.179 |
| Cu,Zn-SOD (Units/mL enzyme) | −74.39 | (−203.46 to 54.67) | 0.131 |
Publisher’s Note: MDPI stays neutral with regard to jurisdictional claims in published maps and institutional affiliations. |
© 2021 by the authors. Licensee MDPI, Basel, Switzerland. This article is an open access article distributed under the terms and conditions of the Creative Commons Attribution (CC BY) license (https://creativecommons.org/licenses/by/4.0/).
Share and Cite
Chaiyasut, C.; Sivamaruthi, B.S.; Kesika, P.; Khongtan, S.; Khampithum, N.; Thangaleela, S.; Peerajan, S.; Bumrungpert, A.; Chaiyasut, K.; Sirilun, S.; et al. Synbiotic Supplementation Improves Obesity Index and Metabolic Biomarkers in Thai Obese Adults: A Randomized Clinical Trial. Foods 2021, 10, 1580. https://doi.org/10.3390/foods10071580
Chaiyasut C, Sivamaruthi BS, Kesika P, Khongtan S, Khampithum N, Thangaleela S, Peerajan S, Bumrungpert A, Chaiyasut K, Sirilun S, et al. Synbiotic Supplementation Improves Obesity Index and Metabolic Biomarkers in Thai Obese Adults: A Randomized Clinical Trial. Foods. 2021; 10(7):1580. https://doi.org/10.3390/foods10071580
Chicago/Turabian StyleChaiyasut, Chaiyavat, Bhagavathi Sundaram Sivamaruthi, Periyanaina Kesika, Suchanat Khongtan, Nanticha Khampithum, Subramanian Thangaleela, Sartjin Peerajan, Akkarach Bumrungpert, Khontaros Chaiyasut, Sasithorn Sirilun, and et al. 2021. "Synbiotic Supplementation Improves Obesity Index and Metabolic Biomarkers in Thai Obese Adults: A Randomized Clinical Trial" Foods 10, no. 7: 1580. https://doi.org/10.3390/foods10071580
APA StyleChaiyasut, C., Sivamaruthi, B. S., Kesika, P., Khongtan, S., Khampithum, N., Thangaleela, S., Peerajan, S., Bumrungpert, A., Chaiyasut, K., Sirilun, S., & Sittiprapaporn, P. (2021). Synbiotic Supplementation Improves Obesity Index and Metabolic Biomarkers in Thai Obese Adults: A Randomized Clinical Trial. Foods, 10(7), 1580. https://doi.org/10.3390/foods10071580