
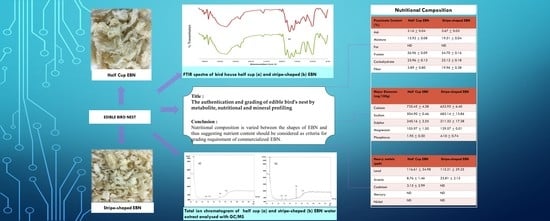
The Authentication and Grading of Edible Bird’s Nest by Metabolite, Nutritional, and Mineral Profiling

 , ,
, ,
Abstract
1. Introduction
2. Materials and Methods
2.1. Samples
2.2. ATR-FTIR Analysis
2.3. Water Extraction
2.4. GC-MS Analysis
2.5. Proximate Analysis
2.5.1. Moisture Content
2.5.2. Ash Content
2.5.3. Crude Fat
2.5.4. Crude Protein
2.5.5. Carbohydrate Content
2.5.6. Total Dietary Fiber
2.5.7. Caloric Value
2.6. Major and Trace Elemental Analysis
2.7. Heavy Metal Analysis
2.8. Statistical Analysis
3. Results and Discussion
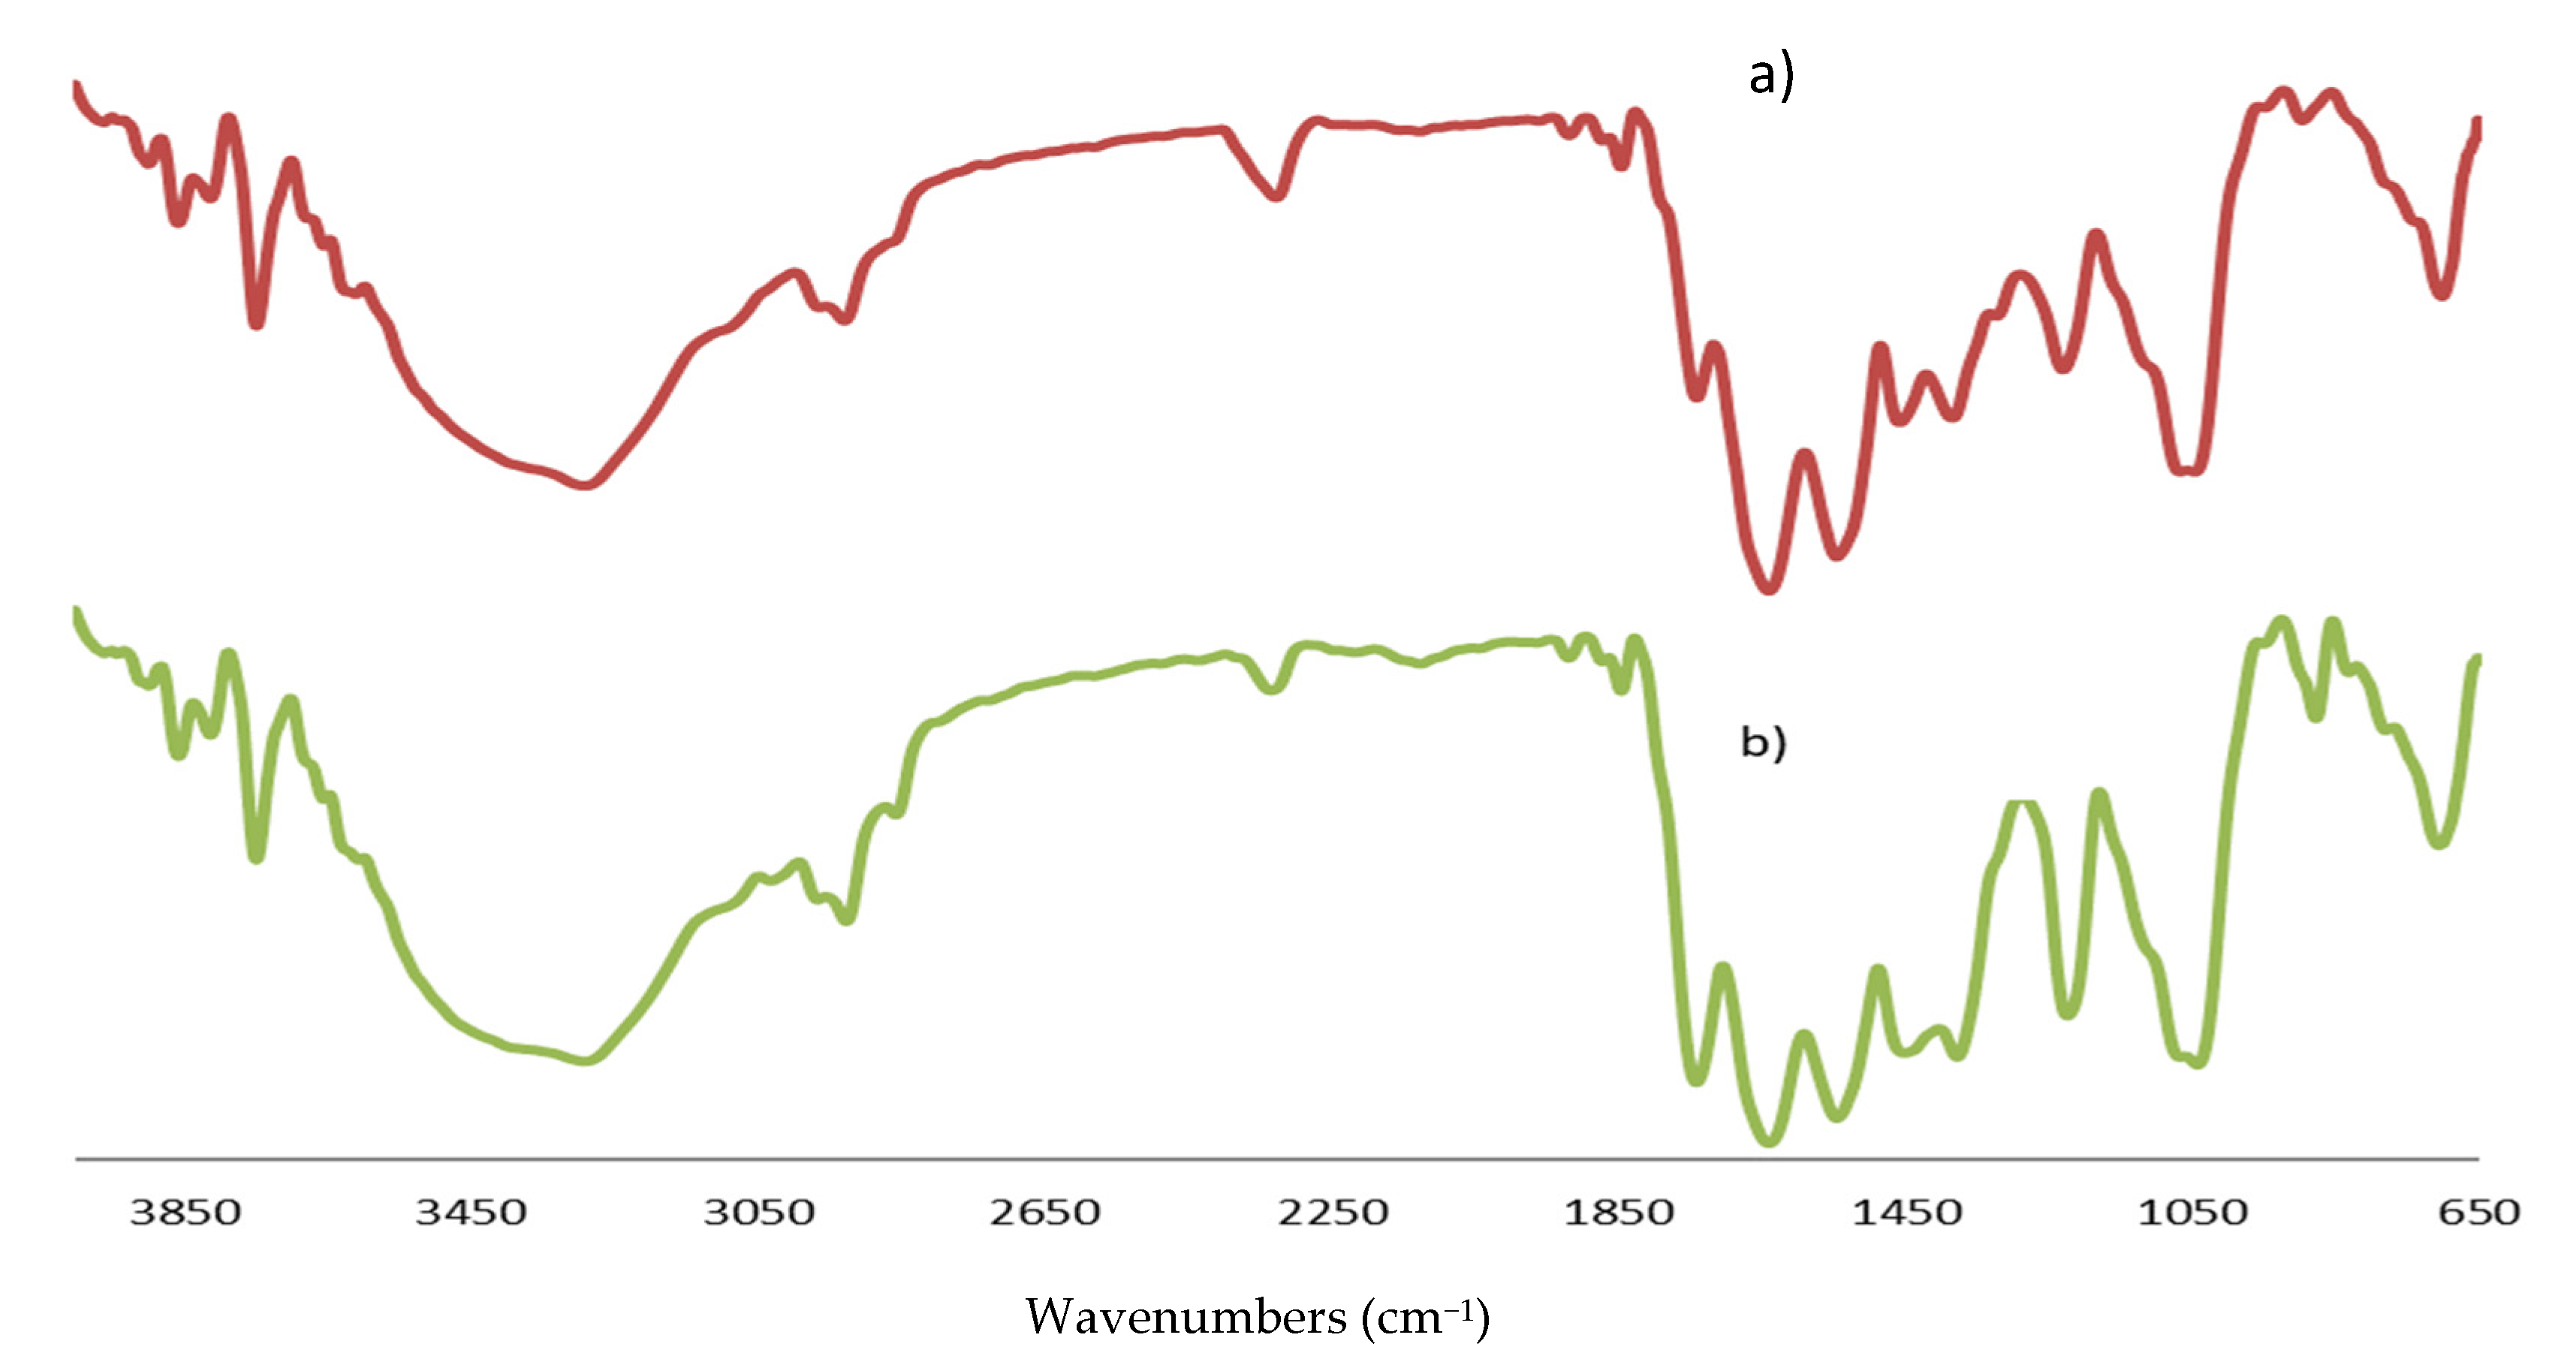
3.1. FTIR Analysis
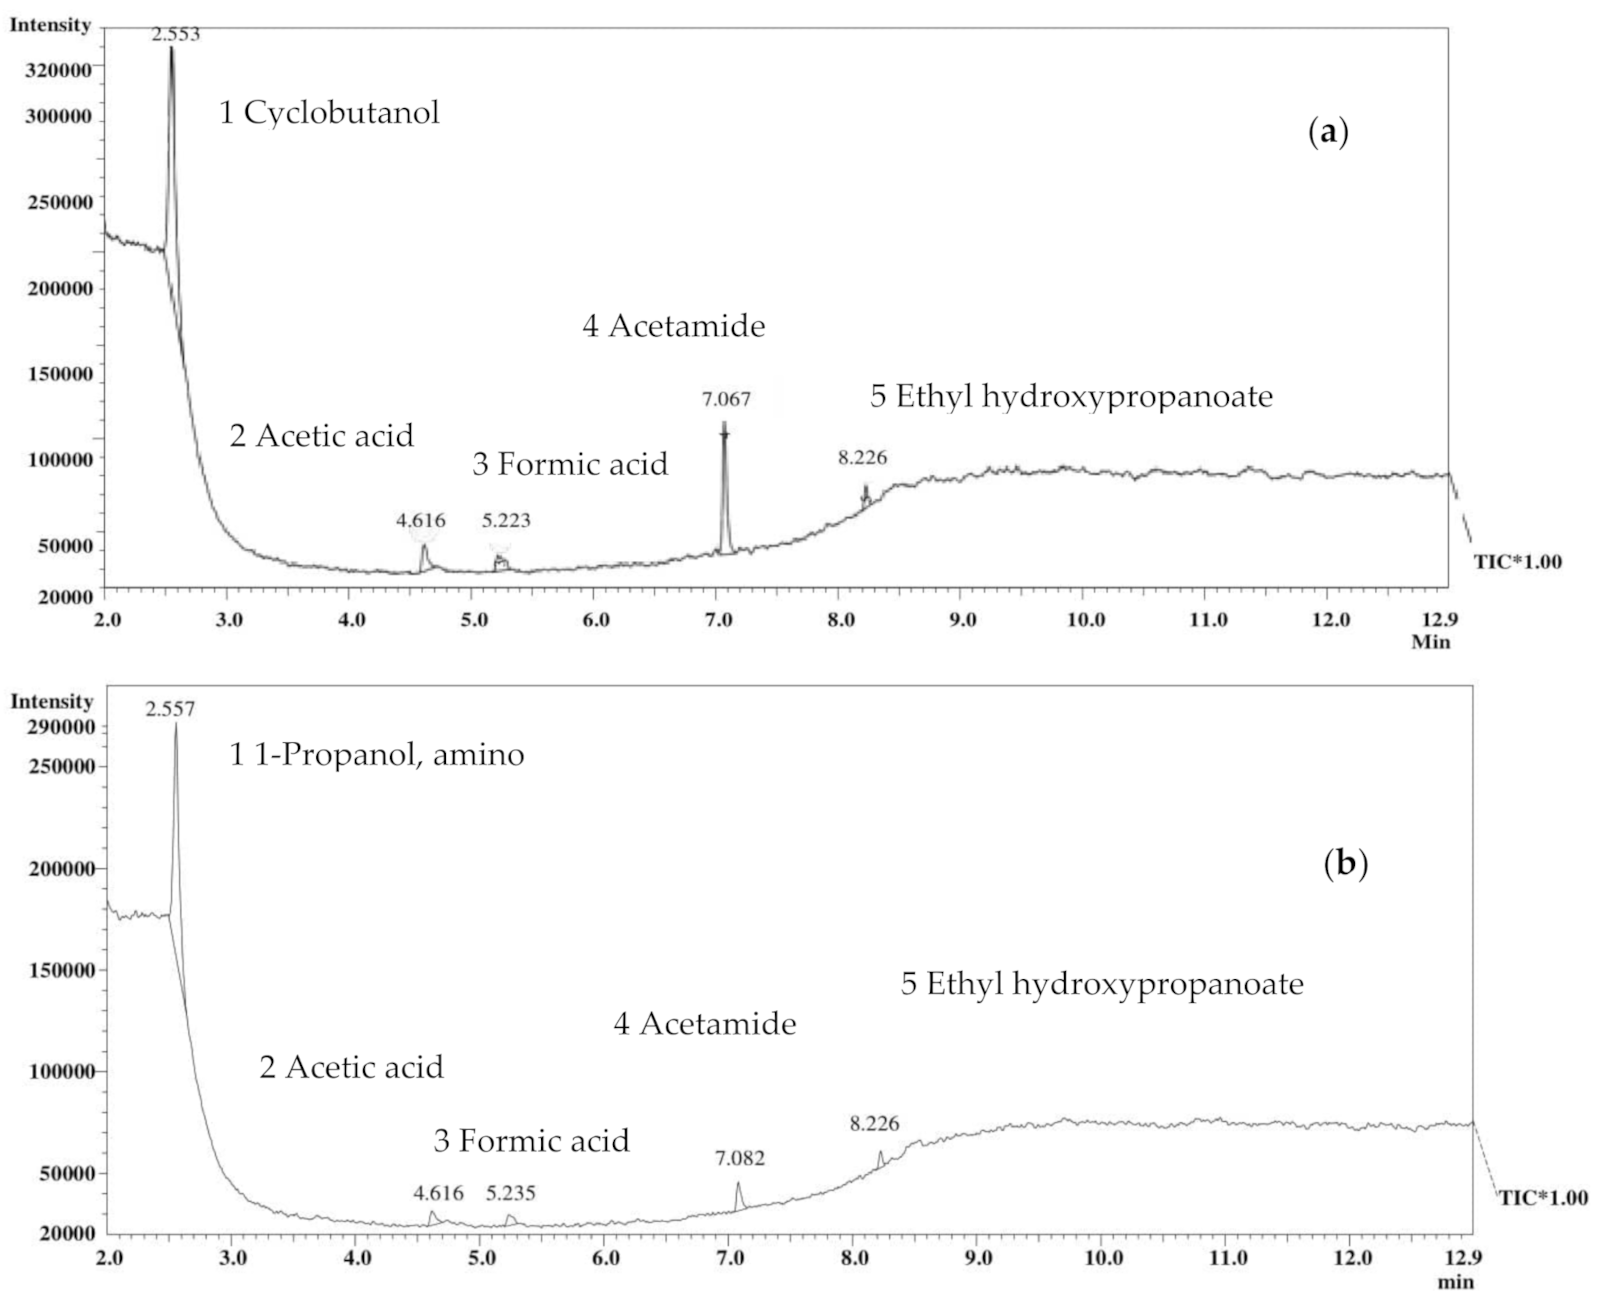
3.2. GC-MS Analysis
3.3. Proximate Analysis
3.4. Major and Trace Elements
3.5. Heavy Metal Content
4. Conclusions
Author Contributions
Funding
Data Availability Statement
Acknowledgments
Conflicts of Interest
References
- Looi, Q.H.; Omar, A.R. Swiftlets and edible bird’s nest industry in Asia. Pertanika J. Sch. Res. Rev. 2016, 2, 32–48. [Google Scholar]
- Guo, C.T.; Takahashi, T.; Bukawa, W.; Takahashi, N.; Yagi, H.; Kato, K.; Hidari, K.I.P.; Miyamoto, D.; Suzuki, T.; Suzuki, Y. Edible bird’s nest extract inhibits influenza virus infection. Antivir. Res. 2006, 70, 140–146. [Google Scholar] [CrossRef]
- Yew, M.Y.; Koh, R.Y.; Chye, S.M.; Othman, I.; Ng, K.Y. Edible bird’s nest ameliorates oxidative stress-induced apoptosis in SH-SY5Y human neuroblastoma cells. BMC Compl. Altern. Med. 2014, 4, 391. [Google Scholar] [CrossRef]
- Hwang, E.; Park, S.W.; Yang, J.E. Anti-aging, anti-inflammatory, and wound-healing activities of edible bird’s nest in human skin keratinocytes and fibroblasts. Pharmacogn. Mag. 2020, 16, 336–342. [Google Scholar]
- Matsukawa, N.; Matsumoto, M.; Bukawa, W.; Chiji, H.; Nakayama, K.; Hara, H. Improvement of bone strength and dermal thickness due to dietary edible bird’s nest extract in ovariectomized rats. Biosci. Biotechnol. Biochem. 2011, 75, 590–592. [Google Scholar] [CrossRef] [PubMed]
- Haghani, A.; Mehrbod, P.; Safi, N.; Kadir, F.A.; Omar, A.R.; Ideris, A. Edible bird’s nest modulate intracellular molecular pathways of influenza A virus infected cells. BMC Compl. Altern. Med. 2017, 17, 22. [Google Scholar] [CrossRef]
- Ismail, M.; Alsalahi, A.; Aljaberi, M.A.; Ibrahim, R.M.; Bakar, F.A.; Ideris, A. Efficacy of Edible bird’s nest on cognitive functions in experimental animal models: A systematic review. Nutrients 2021, 13, 1028. [Google Scholar] [CrossRef] [PubMed]
- Murugan, D.D.; Md Zain, Z.; Choy, K.W.; Zamakshshari, N.H.; Choong, M.J.; Lim, Y.M.; Mustafa, M.R. Edible bird’s nest protects against hyperglycemia-induced oxidative stress and endothelial dysfunction. Front. Pharmacol. 2020, 10, 1624. [Google Scholar] [CrossRef]
- Hou, Z.; Imam, M.U.; Ismail, M.; Azmi, N.H.; Ismail, N.; Ideris, A.; Mahmud, R. Lactoferrin and ovotransferrin contribute toward antioxidative effects of Edible Bird’s Nest against hydrogen peroxide-induced oxidative stress in human SH-SY5Y cells. Biosci. Biotechnol. Biochem. 2015, 79, 1570–1578. [Google Scholar] [CrossRef] [PubMed]
- Hou, Z.; Imam, M.U.; Ismail, M.; Ooi, D.J.; Ideris, A.; Mahmud, R. Nutrigenomic effects of edible bird’s nest on insulin signaling in ovariectomized rats. Drug Des. Devel. Ther. 2015, 9, 4115–4125. [Google Scholar] [CrossRef]
- Yida, Z.; Imam, M.U.; Ismail, M.; Ooi, D.J.; Sarega, N.; Azmi, N.H.; Ismail, N.; Chan, K.W.; Hou, Z.; Yusuf, N.B. Edible bird’s nest prevents high fat diet-induced insulin resistance in rats. J. Diabetes Res. 2015. [Google Scholar] [CrossRef] [PubMed]
- Yuwei, D.; Jie, C.; Yuye, W.; Yuejuan, C.; Lin, J. A comprehensive review of edible bird’s nest. Food Res. Int. 2021, 109875, 1–15. [Google Scholar] [CrossRef]
- Department of Standards Malaysia. Edible-birdnest (EBN)—Specification. In Malaysian Standard MS 2334:2011; Food Safety and Quality Division, Ministry of Health Malaysia: Kuala Lumpur, Malaysia, 2011. [Google Scholar]
- Ching, H.T.; Jyh, Q.P.; Hung, M.C.; Shin, S.C. Authentic determination of bird’s nests by saccharides profile. J. Food Drug Anal. 2008, 16, 86–91. [Google Scholar] [CrossRef]
- Ma, F.; Liu, D. Sketch of the edible bird’s nest and it’s important bioactivities. Int. Food Res. J. 2012, 48, 559–567. [Google Scholar] [CrossRef]
- Chua, L.S.; Zukefli, S.N. A comprehensive review on edible bird nests and swiftlet farming. J. Integr. Med. 2016, 14, 415–428. [Google Scholar] [CrossRef]
- NurulHidayah, J.; NurAzira, T.; Nurrulhidayah, A.F.; Sharihan, F. Overview of edible bird’s nests and their contemporary issues. Food Control 2019, 104, 247–255. [Google Scholar] [CrossRef]
- Careena, S.; Sani, D.; Tan, S.N.; Lim, C.W.; Hassan, S.; Norhafizah, M.; Lim, C.T.S. Effect of edible bird’s nest extract on lipopolysaccharide-induced impairment of learning and memory in wistar rats. Evid. Based Complementary Altern. Med. 2018. [Google Scholar] [CrossRef]
- Wieczorek, M.N.; Majcher, M.; Jeleń, H. Comparison of three extraction techniques for the determination of volatile flavor components in broccoli. Foods 2020, 9, 398. [Google Scholar] [CrossRef]
- Horwitz, W. Methods 930.15, 942.05, 920.39, 954.01, 991.43, 50.1.14, 9.1.09. In Official Methods of Analysis, 17th ed.; Association of Official Analytical Chemists: Gaithersburg, MD, USA, 2000. [Google Scholar]
- Idris, O.A.; Wintola, O.A.; Afolayan, A.J. Comparison of the proximate composition, vitamins (ascorbic acid, α-Tocopherol and retinol), anti-nutrients (phytate and oxalate) and the GC-MS analysis of the essential oil of the root and leaf of Rumexcrispus L. Plants 2019, 8, 51. [Google Scholar] [CrossRef]
- Hamzah, Z.; Jeyaraman, S.; Ibrahim, N.H.; Hashim, O.; Lee, B.B.; Hussin, K. A rapid technique to determine the purity of the edible bird nest. Adv. Environ. Biol. 2013, 7, 3758–3765. [Google Scholar]
- Guo, L.; Wu, Y.; Liu, M.; Wang, B.; Ge, Y.; Chen, Y. Determination of edible bird’s nests by FTIR and SDS-PAGE coupled with multivariate analysis. Food Control 2017, 80, 259–266. [Google Scholar] [CrossRef]
- Atikah, N.S.; Tukiran, N.A.; Azarima, H.G.; Syahirah, S.N.Z. Detection of Edible Bird’s Nest using Fourier Transform Infrared Spectroscopy (FTIR) combined with Principle Component Analysis (PCA). J. Halal Ind. Serv. 2020, 3, 1–14. [Google Scholar] [CrossRef]
- Gan, J.Y.; Chang, L.S.; Mat Nasir, N.A.; Babji, A.S.; Lim, S.J. Evaluation of physicochemical properties, amino acid profile and bioactivities of Edible Bird’s Nest hydrolysate as affected by drying methods. LWT Food Sci. Technol. 2020, 131. [Google Scholar] [CrossRef]
- Eric, K.S.S.; Soo, Y.L. Raman microspectroscopy is a rapid technique to authenticate edible bird’s nest-a a glycoprotein. Spectrosc. Eur. 2017, 29, 10–13. [Google Scholar]
- Lee, T.H.; Wani, W.A.; Koay, Y.N.; Kavita, S.; Tan, E.T.T.; Shreaz, S. Recent advances in the identification and authentication methods of edible bird’s nest. Food Res. Int. 2017, 100, 14–27. [Google Scholar] [CrossRef]
- Zukefli, S.N.; Chua, L.S.; Rahmat, Z. Protein extraction and identification by gel electrophoresis and mass spectrometry from Edible bird’s Nest samples. Food Anal. Methods 2017, 10, 387–398. [Google Scholar] [CrossRef]
- Ara, I.; Bukhari, N.A.; Solaiman, D.; Bakir, M.A. Antimicrobial effect of local medicinal plant extracts in the Kingdom of Saudi Arabia and search for their metabolites by gas chromatography-mass spectrometric (GC-MS) analysis. J. Med. Plants Res. 2012, 6, 5688–5694. [Google Scholar] [CrossRef]
- Ara, I.; Shinwari, M.M.A.; Rashed, S.A.; Bakir, M.A. Evaluation of antimicrobial properties of two different extracts of Juglansregia tree bark and search for their compounds using gas chromatography-mass spectrum. Int. J. Biol. 2013, 5, 92–102. [Google Scholar] [CrossRef]
- Raftari, M.; AziziJalilian, F.; Abdulamir, A.S.; Son, R.; Sekawi, Z.; Fatimah, A.B. Effect of organic acids on Escherichia coli O157:H7 and Staphylococcus aureus contaminated meat. Open Microbiol. J. 2009, 3, 121–127. [Google Scholar] [CrossRef] [PubMed]
- Baaboua, A.E.; Maadoudi, M.E.; Bouyahya, A.; Belmehdi, O.; Kounnoun, A.; Zahli, R.; Abrini, J. Evaluation of the antimicrobial activity of four organic acids used in chicks feeds to control Salmonella typhimurium: Suggestion of amendment in the search standard. Int. J. Microbiol. 2018, 1–9. [Google Scholar] [CrossRef] [PubMed]
- Saengkrajang, W.; Matan, N. Antimicrobial activities of the edible bird’s nest extract against food-borne pathogens. Thai J. Agric. Sci. 2011, 44, 326–330. [Google Scholar] [CrossRef]
- Ramin, V.; Diane, H.; Janette, M.; Chandra, N.; Bryan, B.; Tim, C.; Allen, J.; Farzaneh, T.; Jones, A.D.; Venkataraman, B. Exposure assessment of acetamide in milk, beef, and coffee using xanthydrolderivatization and gas chromatography-mass spectrometry. J. Agric. Food Chem. 2018, 66, 298–305. [Google Scholar] [CrossRef]
- Tan, S.N.; Sani, D.; Lim, C.W.; Ideris, A.; Stanslas, J.; Lim, C.T.S. Proximate analysis and safety profile of farmed edible bird’s nest in Malaysia and its effect on cancer cells. Evid. Based Complementary Altern. Med. 2020, 1–12. [Google Scholar] [CrossRef] [PubMed]
- Norhayati, M.K.; Azman, O.; Wan Nazaimoon, W.M. A preliminary study of the nutritional content of Malaysian edible bird’s nest. Malays. J. Nutr. 2010, 16, 389–396. [Google Scholar]
- Marcone, M.F. Characterization of the edible bird’s nests the “Caviar of the East”. Food Res. Int. 2005, 38, 1125–1134. [Google Scholar] [CrossRef]
- Shim, E.K.S.; Chandra, G.F.; Pedireddy, S.; Lee, S.Y. Characterization of swiftlet edible bird nest, a mucin glycoprotein, and its adulterants by Raman microspectroscopy. J. Food Sci. Technol. 2016, 53, 3602–3608. [Google Scholar] [CrossRef]
- Saengkrajang, W.; Narumol, M.; Nirundorn, M. Nutritional composition of the farmed edible bird’s nest (Collocaliafuciphaga) in Thailand. J. Food Compos.Anal. 2013, 31, 41–45. [Google Scholar] [CrossRef]
- Noor, H.S.M.; Babji, A.S.; Lim, S.J. Nutritional composition of different grades of Edible Bird’s nest and its enzymatic hydrolysis. AIP Conf. Proc. 2018, 1940, 020088. [Google Scholar] [CrossRef]
- Zulkifli, D.A.; Mansor, R.; Md-Ajat, M.M.; Abas, F.; Ideris, A.; Abu, J. Differentiation of Malaysian farmed and commercialized edible bird’s nests through nutritional composition analysis. Pertanika J. Trop. Agric. Sci. 2019, 42, 871–888. [Google Scholar]
- Lee, T.H.; Waseem, A.W.; Eddie, T.T.; NurArdawati, A.; Yong, L.L.; Ramlan, A.A. Investigations into the physicochemical, biochemical, and antibacterial properties of Edible Bird’s Nest. J. Chem. Pharm. Res. 2015, 7, 228–247. [Google Scholar]
- Norakmar, I.; Roosnoor, F.H.; Izwan, I.; Ernah, G.; Nor Azlina, J.; Faridah, I. Composition of minerals and trace elements contents of raw unclean and raw clean edible bird nest (EBN) analyzed using ICP-MS. Proceeding of the 25th Veterinary Association Congress, Kota Tinggi, Johor, Malaysia, September 2013. [Google Scholar]
- Chen, J.X.J.; Lim, P.K.C.; Wong, S.F.; Mak, J.W. Determination of the presence and levels of heavy metals and other elements in raw and commercial EBNs. Malays. J. Nutr. 2014, 20, 377–391. [Google Scholar] [CrossRef]
- Marni, S.; Marzura, M.; Norzela, A.; Khairunnusak, M.; Bing, C.H.; Eddy, A. A preliminary study of the free sialic acid content of EBN from Johor and Kelantan. Malays. J. Vet. Res. 2014, 5, 9–14. [Google Scholar]
- RNI Recommended Nutrient Intakes for Malaysia. A Report of the Technical Working Group on Nutritional Guidelines; National Coordinating Committee on Food and Nutrition, Ministry of Health Malaysia: Putrajaya, Malaysia, 2017. [Google Scholar]
- Law of Malaysia Malaysia Food Regulations 1985 (Act 281). 2012. Available online: http://www.agc.gov.my/agcportal/uploads/files/Publications/LOM/EN/Act%20281%20-%20Food%20Act%201983.pdf (accessed on 13 November 2020).
- Law of Malaysia Food Act 1983. Food (Amendment) (No 4). Regulations 2014. Amendment of Fourteenth Schedule (Regulation 38), Table 1A (Arsenic of EBN), 1B (lead of EBN), and 1D (Mercury of EBN). 2014, pp. 19–20. Available online: https://www.fmm.org.my/images/articles/Draf-pindaan-PPM1985-Bil3-2014_draft%20food%20 (accessed on 13 November 2020).
- FAO/WHO. Evaluation of Certain Food Additives and Contaminants, Sixty-Seventh Report of the Joint FAO/WHO Expert Committee on Food Additives; World Health Organization: Geneva, Switzerland, 2007. [Google Scholar]
- Yeo, B.H.; Tang, T.K.; Wong, S.F.; Chin, P.T.; Wang, Y.; Cheong, L.Z.; Lai, O.M. Potential residual contaminants in Edible Bird’s Nest. Front. Pharmacol. 2021, 12. [Google Scholar] [CrossRef]
- Jan, A.T.; Azam, M.; Siddiqui, K.; Ali, A.; Choi, I.; Haq, Q.M. Heavy metals and human health: Mechanistic insight into toxicity and counter defense system of antioxidants. Int. J. Mol. Sci. 2015, 16, 29592–29630. [Google Scholar] [CrossRef] [PubMed]


| Characteristic Absorptions (cm−1) | Functional Groups | Compound Class | Absorption Ranges (cm−1) | ||
|---|---|---|---|---|---|
| Present Study | [22] | ||||
| Half Cup EBN | Stripe-Shaped EBN | Processed EBN | |||
| 3550–3200 | O-H stretch | Alcohol | 3288.55 | 3288.48 | 3381.70 |
| 3000–2840 | C-H stretch | Alkane | 2927.02 | 2924.37 | 2931.40 |
| 2140–2100 | C≡C stretch | Alkyne | 2125.60 | 2129.68 | 2131.10 |
| 1740–1720 | C=O stretch | Aldehyde | 1738.74 | 1739.50 | ND |
| 1695–1630 | C=O stretch | Amide I | 1638.59 | 1638.38 | 1643.30 |
| 1560–1500 | N-H bend | Amide II | 1544.17 | 1544.09 | 1544.50 |
| 1440–1395 | O-H bend | Carboxylic acid | 1406.56 | 1401.08 | 1443.90 |
| 1390–1380 | C-H bend | Aldehyde | 1382.82 | 1376.19 | 1399.60 |
| 1250–1020 | C-N stretch | Amine | 1228.55 | 1222.20 | 1317.80 |
| 1085–1050 | C-O stretch | Primary alcohol | 1054.80 | 1051.10 | 1034.80 |
| 895–885 | C=C bend | Alkene | 895.29 | 886.06 | ND |
| EBN | Peak | Retention Time (min) | Retention Indices | Compound Name | Similarity Index (%) | Normalized Area (%) | Compound Nature |
|---|---|---|---|---|---|---|---|
| Half cup | 1 | 2.553 | 668 | Cyclobutanol | 84 | 61.64 | Cycloalkanes |
| 2 | 4.616 | 576 | Acetic acid | 98 | 6.66 | Carboxylic acid | |
| 3 | 5.223 | 933 | Formic acid | 98 | 4.87 | Carboxylic acid | |
| 4 | 7.067 | 629 | Acetamide | 99 | 23.68 | Amide | |
| 5 | 8.226 | 848 | Ethyl 2-hydroxypropanoate | 86 | 3.14 | Carboxylic acid | |
| Stripe-shaped | 1 | 2.557 | 741 | 1-Propanol, 2-amino | 91 | 78.58 | Amino alcohol |
| 2 | 4.616 | 576 | Acetic acid | 95 | 5.15 | Carboxylic acid | |
| 3 | 5.235 | 980 | Formic acid | 96 | 4.40 | Carboxylic acid | |
| 4 | 7.082 | 629 | Acetamide | 97 | 8.26 | Amide | |
| 5 | 8.226 | 848 | Ethyl 2-hydroxypropanoate | 89 | 3.60 | Carboxylic acid |
| Nutritional Composition (%) | Present Study | [35] | [15] | |
|---|---|---|---|---|
| EBN Half Cup | EBN Stripe-Shaped | House EBN | House EBN | |
| Crude Protein | 56.96 ± 0.09 a | 54.70 ± 0.16 b | 42.00–63.00 | 53.00–56.40 |
| Carbohydrate | 23.96 ± 0.13 a | 22.12 ± 0.18 b | 10.63–27.26 | 28.00–31.70 |
| Moisture | 15.92 ± 0.08 b | 19.51 ± 0.04 a | 7.50–12.90 | 10.80–14.00 |
| Ash | 3.16 ± 0.04 b | 3.67 ± 0.03 a | 2.10–7.30 | 2.20–3.40 |
| Fiber | 3.89 ± 0.80 b | 19.96 ± 0.38 a | NA | NA |
| Crude Fat | ND | ND | 0.14–1.28 | 0.1 |
| Caloric value | 331.00 ± 1.41 b | 349.50 ± 0.7 a | NA | NA |
| Element Content(mg/100 g) | Present Study | [15,43] | RNI-Tolerable Upper Intake Level (mg/day)[46] | ||
|---|---|---|---|---|---|
| Half Cup EBN | Stripe-Shaped EBN | House EBN | |||
| Major element | Boron | 0.03 ± 0.01 a | 0.04 ± 0.01 a | NA | Not Set |
| Calcium | 735.45 ± 4.38 a | 652.95 ± 6.40 b | 123.10–859.80 | 2500.00 | |
| Magnesium | 105.97 ± 1.50 b | 129.57 ± 0.01 a | 88.30–152.80 | 350.00 | |
| Potassium | 16.72 ± 0.22 a | 22.00 ± 2.48 a | 3.64–35.20 | Not Set | |
| Phosphorus | 1.95 ± 0.30 a | 4.10 ± 0.74 a | 0.03–6.79 | 4000.00 | |
| Sodium | 504.90 ± 0.46 b | 682.14 ± 13.86 a | 263.80–670.80 | 2300.00 | |
| Sulfur | 240.16 ± 2.55 a | 211.32 ± 17.38 a | 624.40–884.00 | Not Set | |
| Trace element | Chromium | 0.03 ± 37.15 a | 0.04 ± 28.87 a | 0.01–0.06 | Not Set |
| Cobalt | 0.001 ± 2.74 a | 0.001 ± 1.91 a | 0.00–0.06 | 0.04 | |
| Copper | 0.88 ± 0.09 b | 2.34 ± 0.17 a | 0.47–11.06 | 10.00 | |
| Iron | 0.68 ± 0.12 b | 1.13 ± 0.03 a | 0.16–1.94 | 45.00 | |
| Molybdenum | 0.002 ± 0.29 a | 0.002 ± 1.56 a | 0.00–0.09 | 2.00 | |
| Selenium | 0.01 ± 3.23 a | 0.01 ± 0.87 a | 0.01–0.04 | 0.40 | |
| Zinc | 0.44 ± 0.05 b | 0.76 ± 0.01 a | 0.05–2.26 | 45.00 | |
| Manganese | 0.14 ± 0.08 a | 0.14 ± 0.02 a | 0.02–0.59 | 9.00 | |
| Heavy Metal Content (pbb) | Present Study | [44] | Maximum Regulatory Limit | |
|---|---|---|---|---|
| Half Cup EBN | Stripe-Shaped EBN | House EBN | ||
| Arsenic | 8.76 ± 1.46 b | 23.81 ± 2.15 a | 0.06–34.35 | 150.00 * |
| Cadmium | 3.15 ± 2.99 | ND | 0.06–1.87 | 1000.00 ** |
| Lead | 116.61 ± 34.98 a | 115.21 ± 29.25 a | 2.24–592.84 | 300.00 * |
| Mercury | ND | ND | 0.06–70.18 | 70.00 * |
| Nickel | ND | ND | 56.14–400.00 | 500.00 *** |
Publisher’s Note: MDPI stays neutral with regard to jurisdictional claims in published maps and institutional affiliations. |
© 2021 by the authors. Licensee MDPI, Basel, Switzerland. This article is an open access article distributed under the terms and conditions of the Creative Commons Attribution (CC BY) license (https://creativecommons.org/licenses/by/4.0/).
Share and Cite
Mohamad Ibrahim, R.; Mohamad Nasir, N.N.; Abu Bakar, M.Z.; Mahmud, R.; Ab Razak, N.A. The Authentication and Grading of Edible Bird’s Nest by Metabolite, Nutritional, and Mineral Profiling. Foods 2021, 10, 1574. https://doi.org/10.3390/foods10071574
Mohamad Ibrahim R, Mohamad Nasir NN, Abu Bakar MZ, Mahmud R, Ab Razak NA. The Authentication and Grading of Edible Bird’s Nest by Metabolite, Nutritional, and Mineral Profiling. Foods. 2021; 10(7):1574. https://doi.org/10.3390/foods10071574
Chicago/Turabian StyleMohamad Ibrahim, Ramlah, Nurul Nadiah Mohamad Nasir, Md Zuki Abu Bakar, Rozi Mahmud, and Nor Asma Ab Razak. 2021. "The Authentication and Grading of Edible Bird’s Nest by Metabolite, Nutritional, and Mineral Profiling" Foods 10, no. 7: 1574. https://doi.org/10.3390/foods10071574
APA StyleMohamad Ibrahim, R., Mohamad Nasir, N. N., Abu Bakar, M. Z., Mahmud, R., & Ab Razak, N. A. (2021). The Authentication and Grading of Edible Bird’s Nest by Metabolite, Nutritional, and Mineral Profiling. Foods, 10(7), 1574. https://doi.org/10.3390/foods10071574