
Aloe vera Gel Drying by Refractance Window®: Drying Kinetics and High-Quality Retention


Abstract
:1. Introduction
2. Materials and Methods
2.1. Raw Material
2.2. Chemicals and Reagents
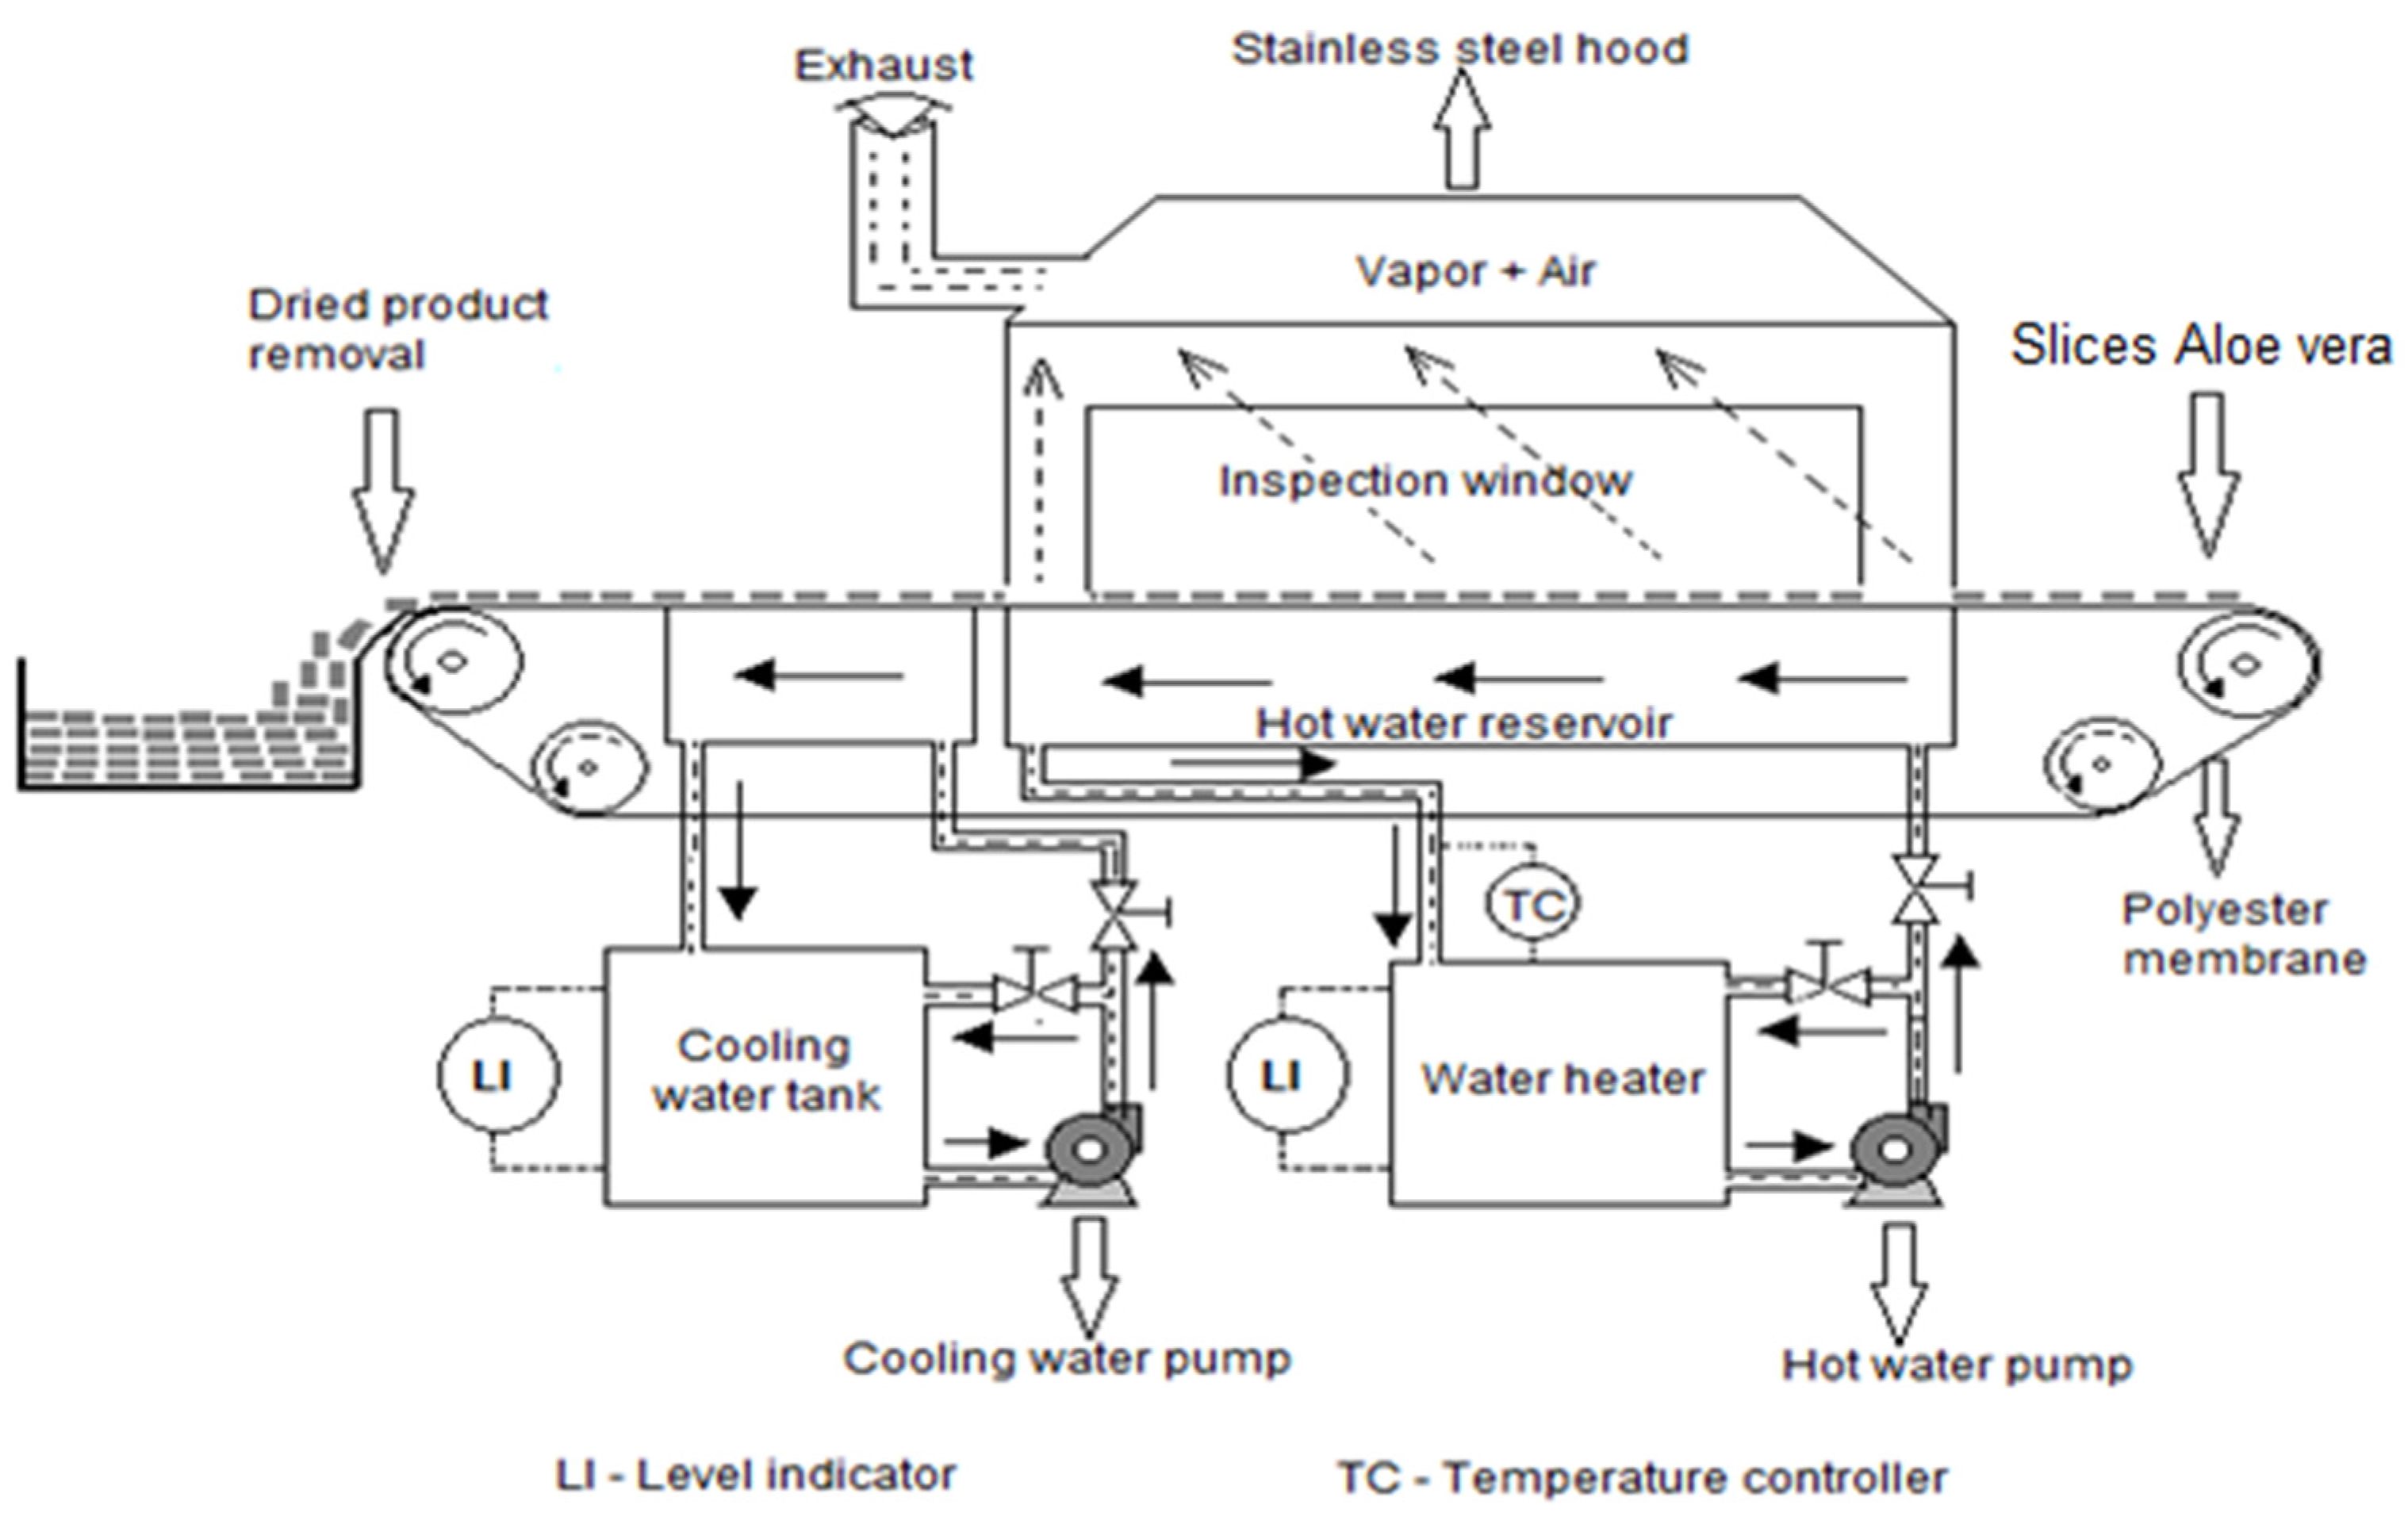
2.3. Refractance Window® Drying
2.4. Mathematical Modeling of Drying Kinetics
2.5. Volume Change
2.6. Color
2.7. Rehydration
2.8. Vitamins
2.8.1. Vitamin C
2.8.2. Vitamin E
2.9. Experimental Design and Statistical Analysis
3. Results and Discussion
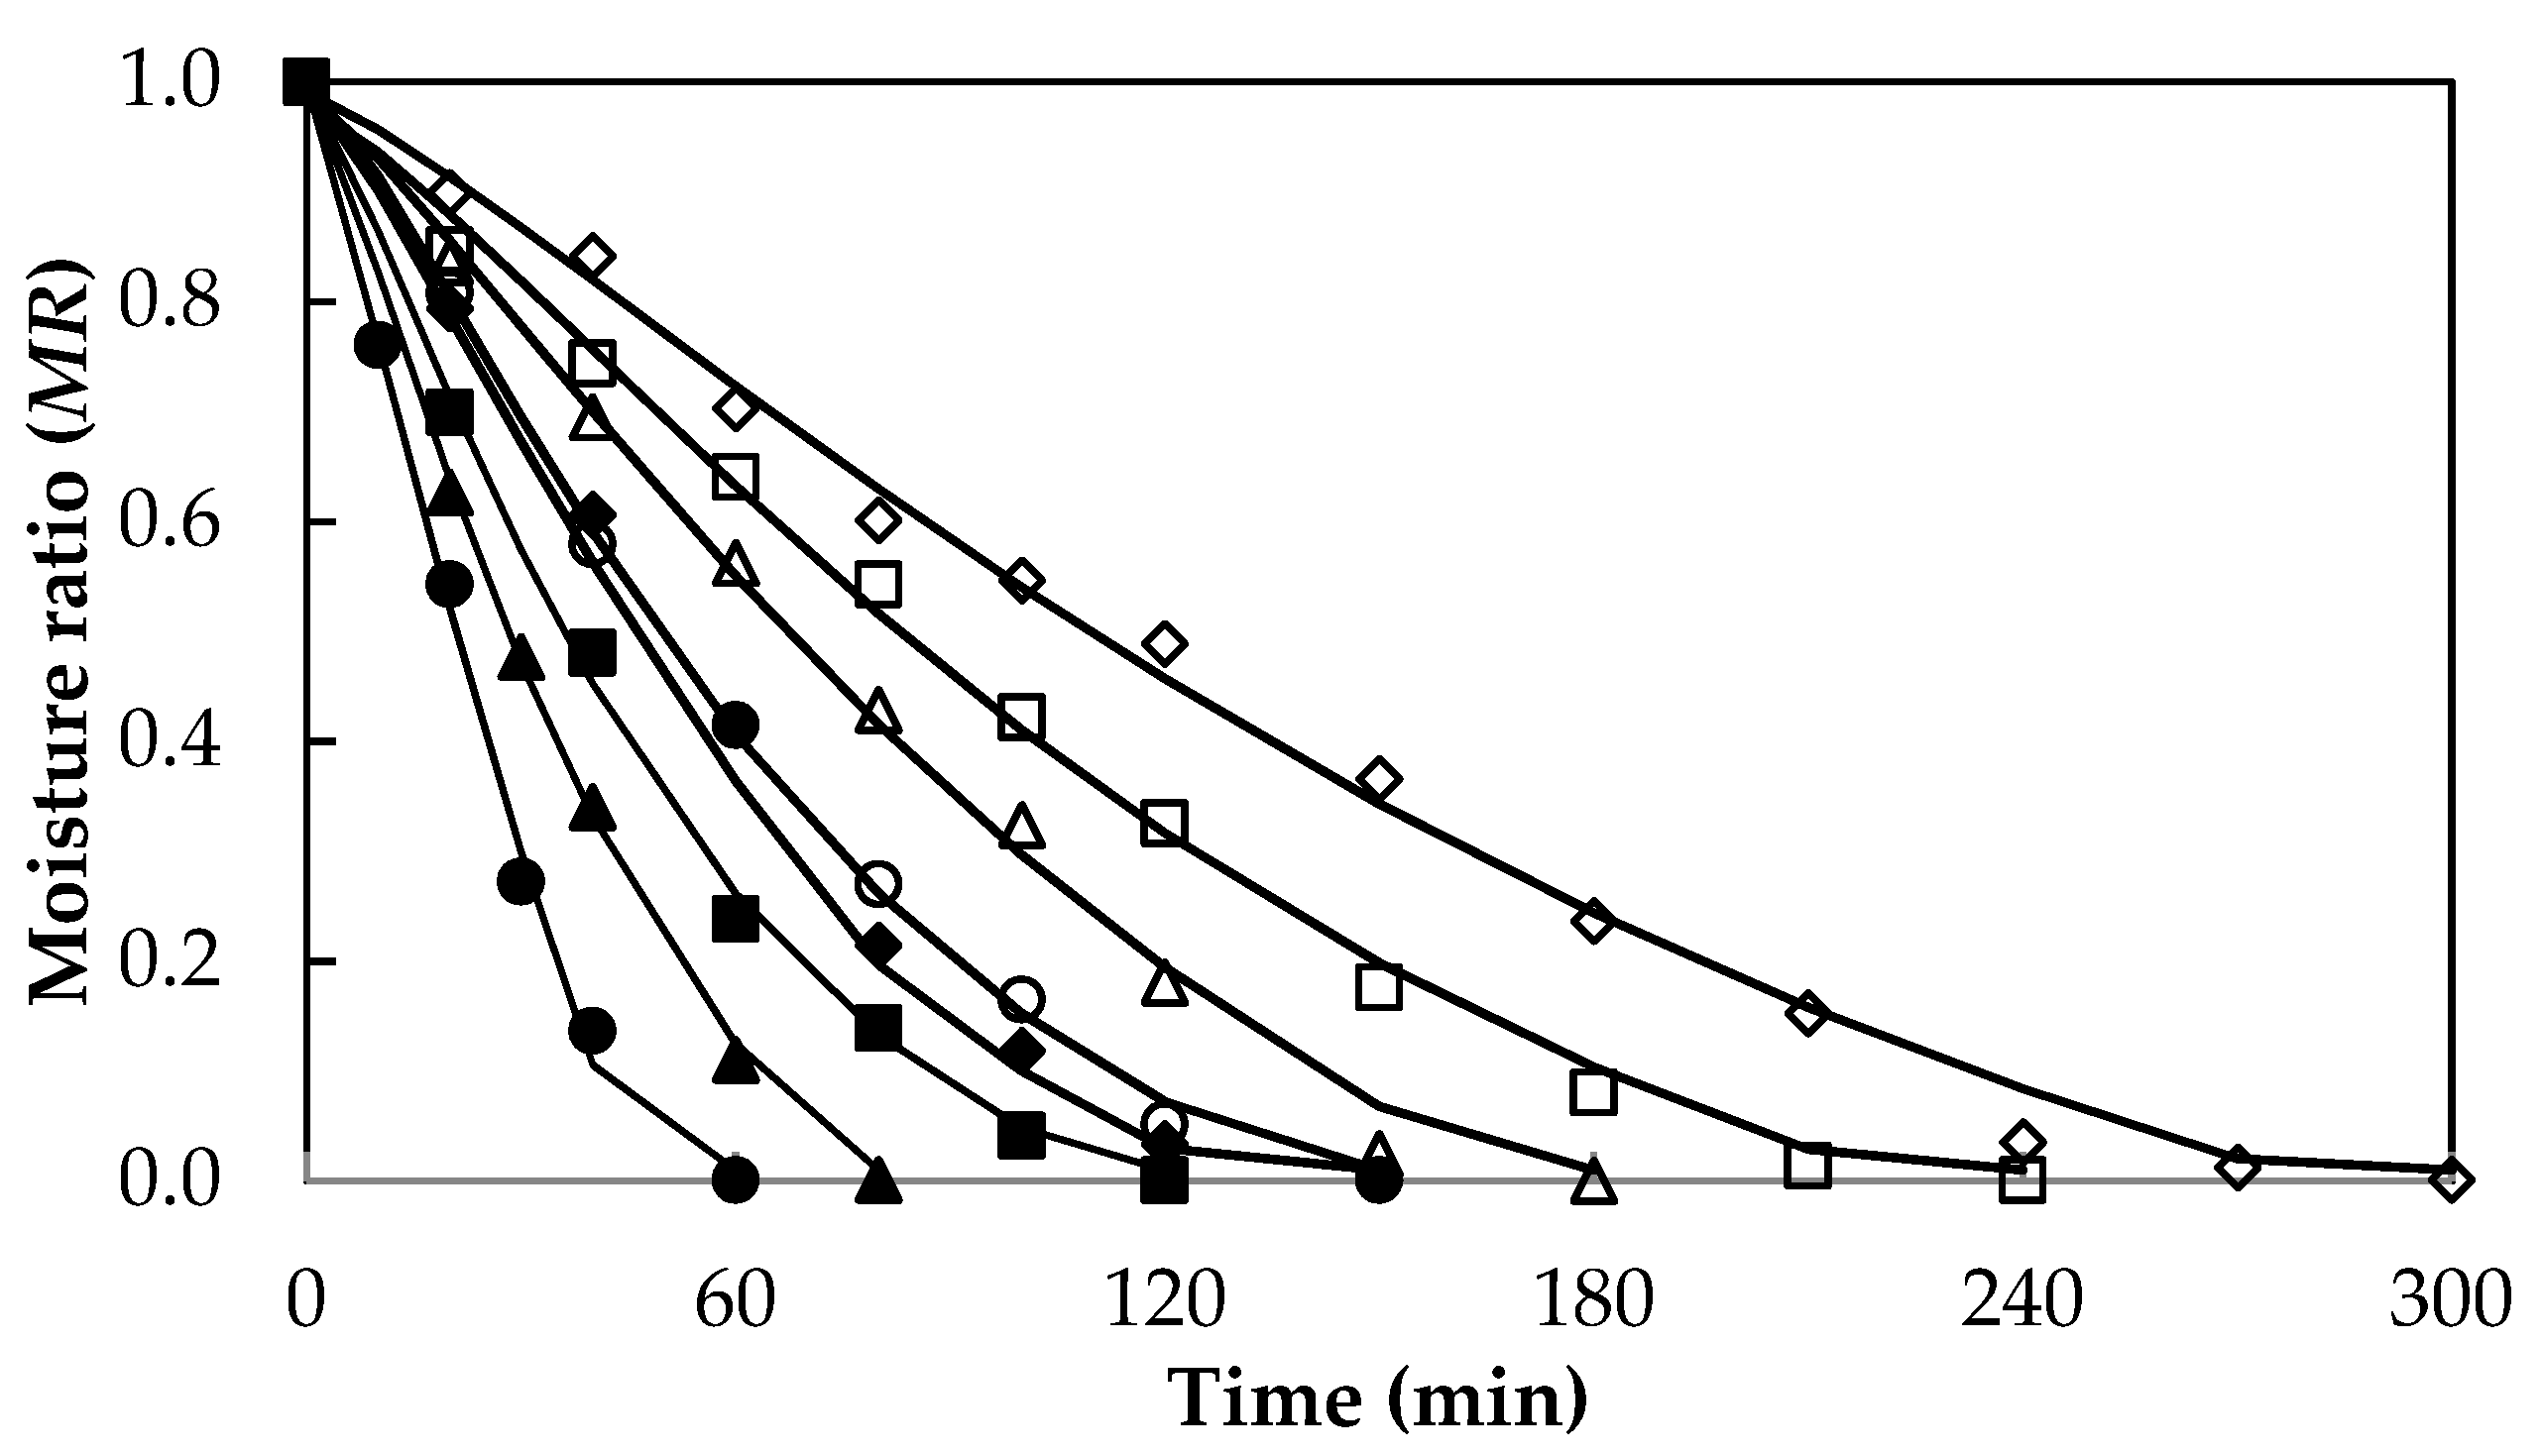
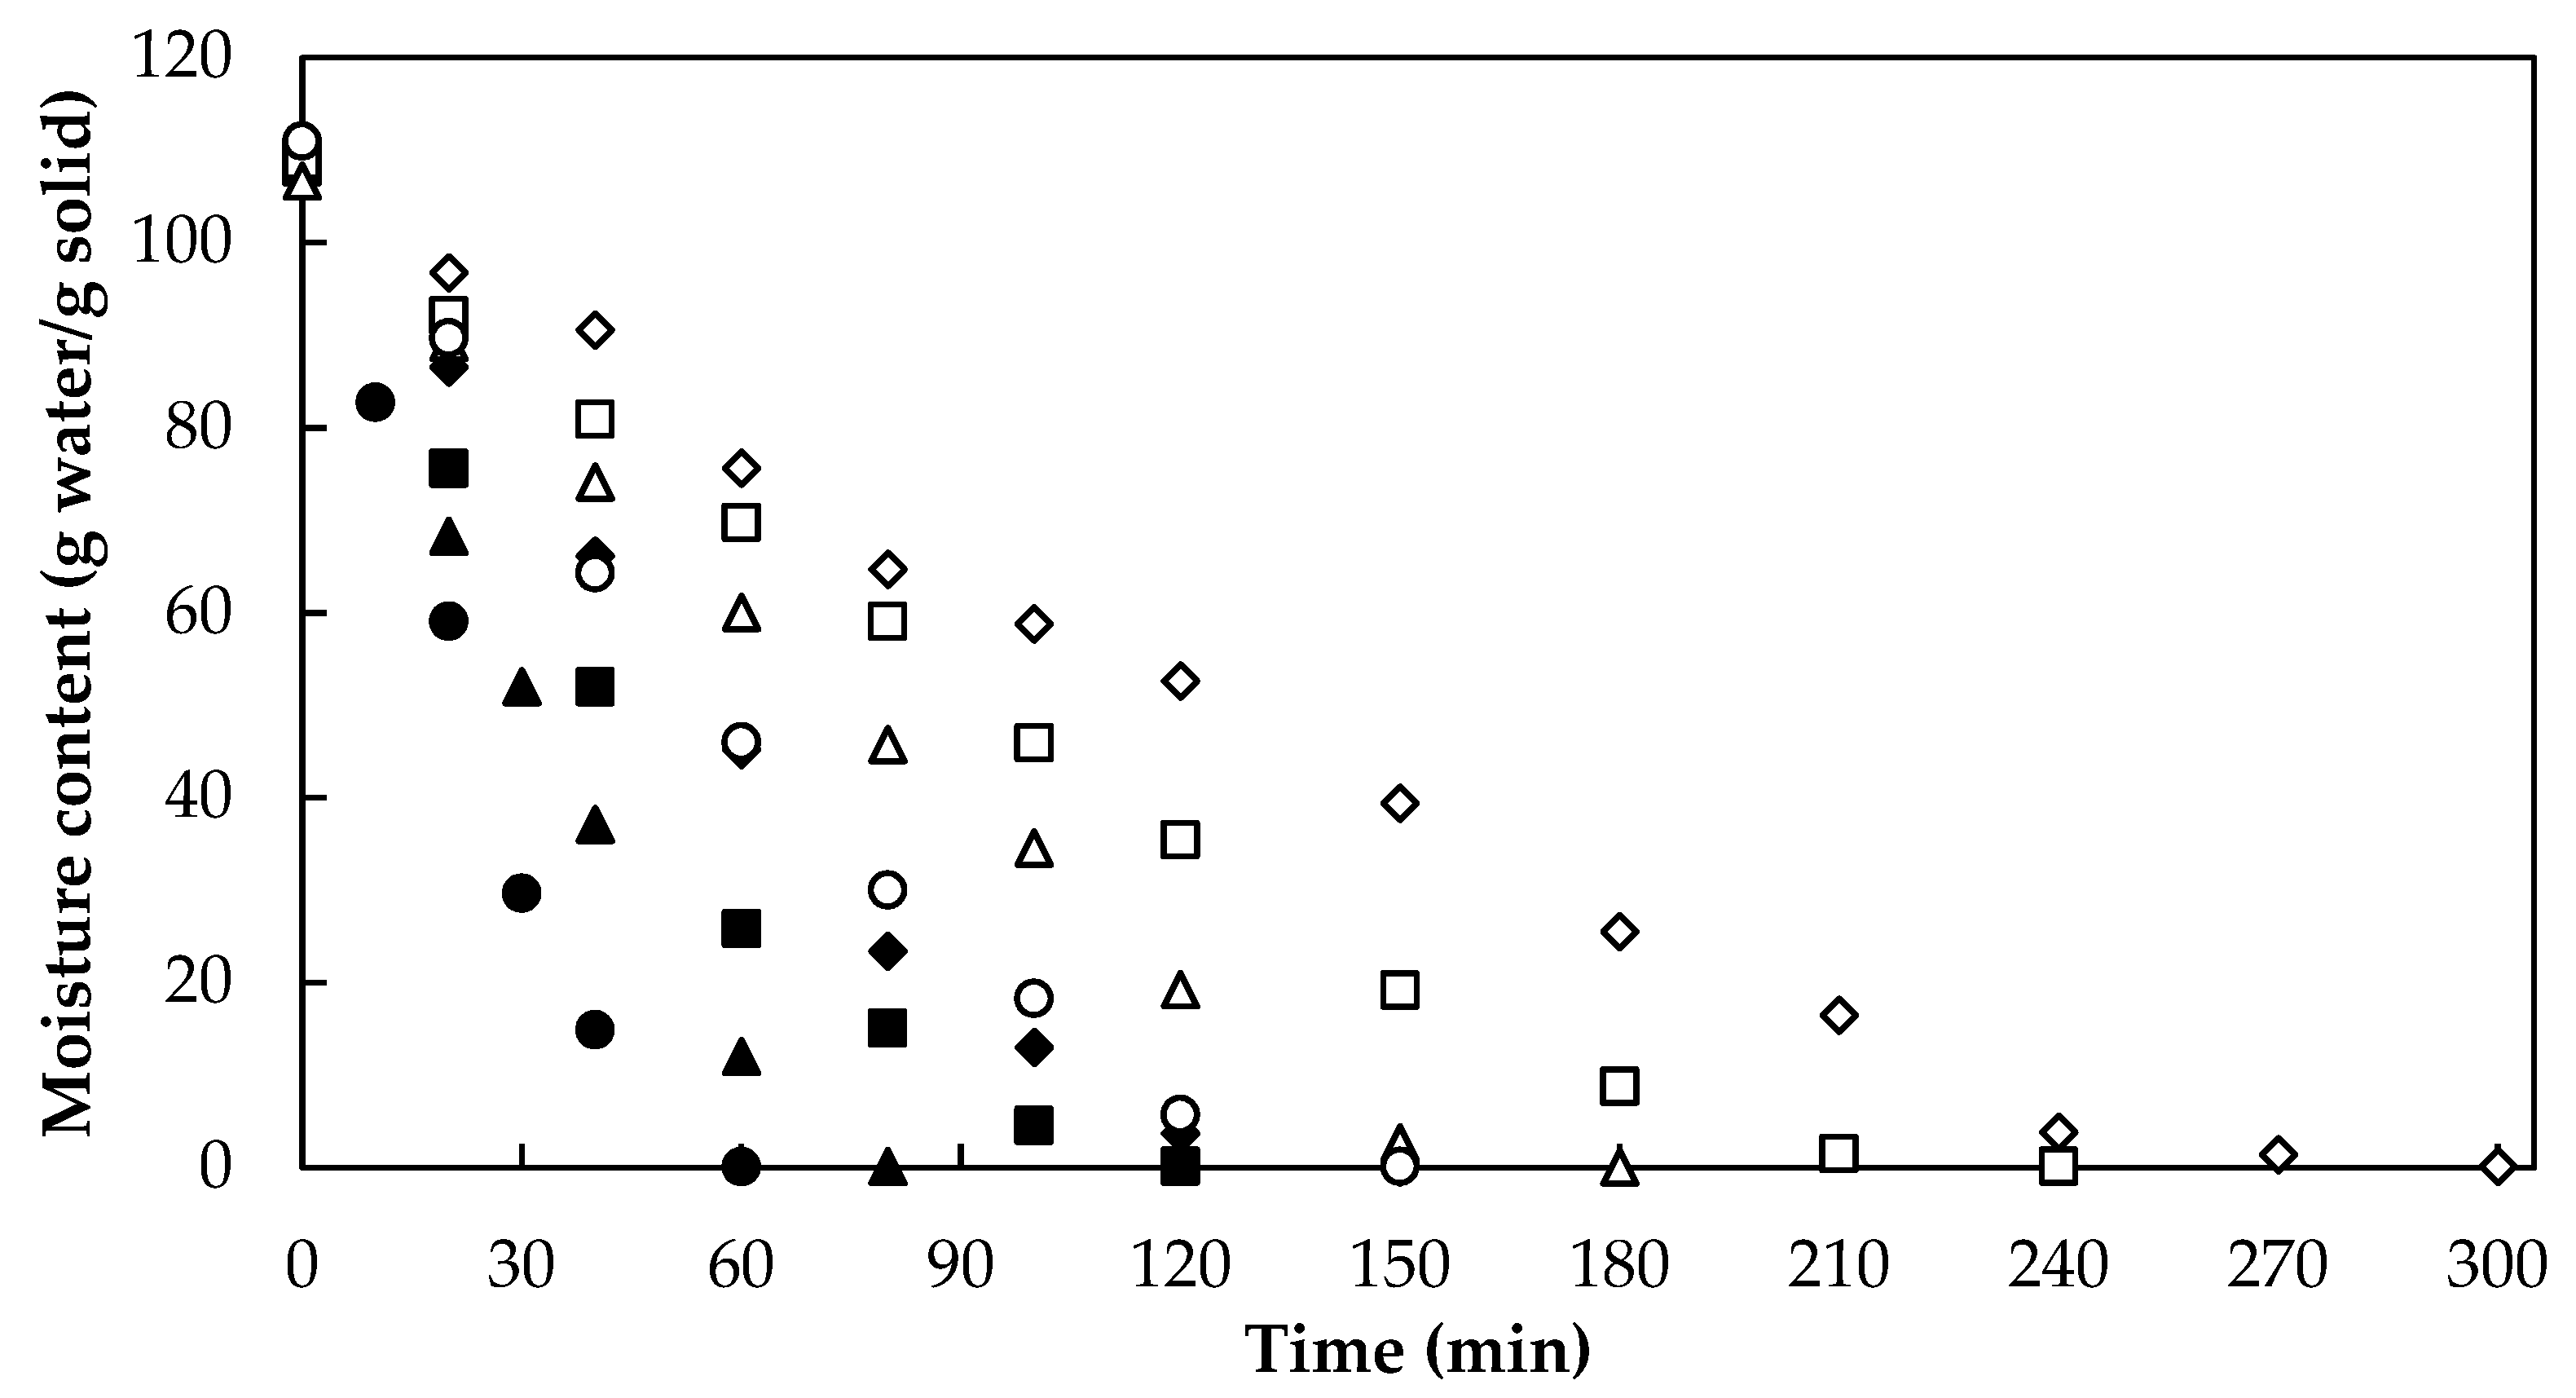
3.1. Drying
3.2. Effective Diffusivity Coefficient and Activation Energy
3.3. Drying Kinetic Models
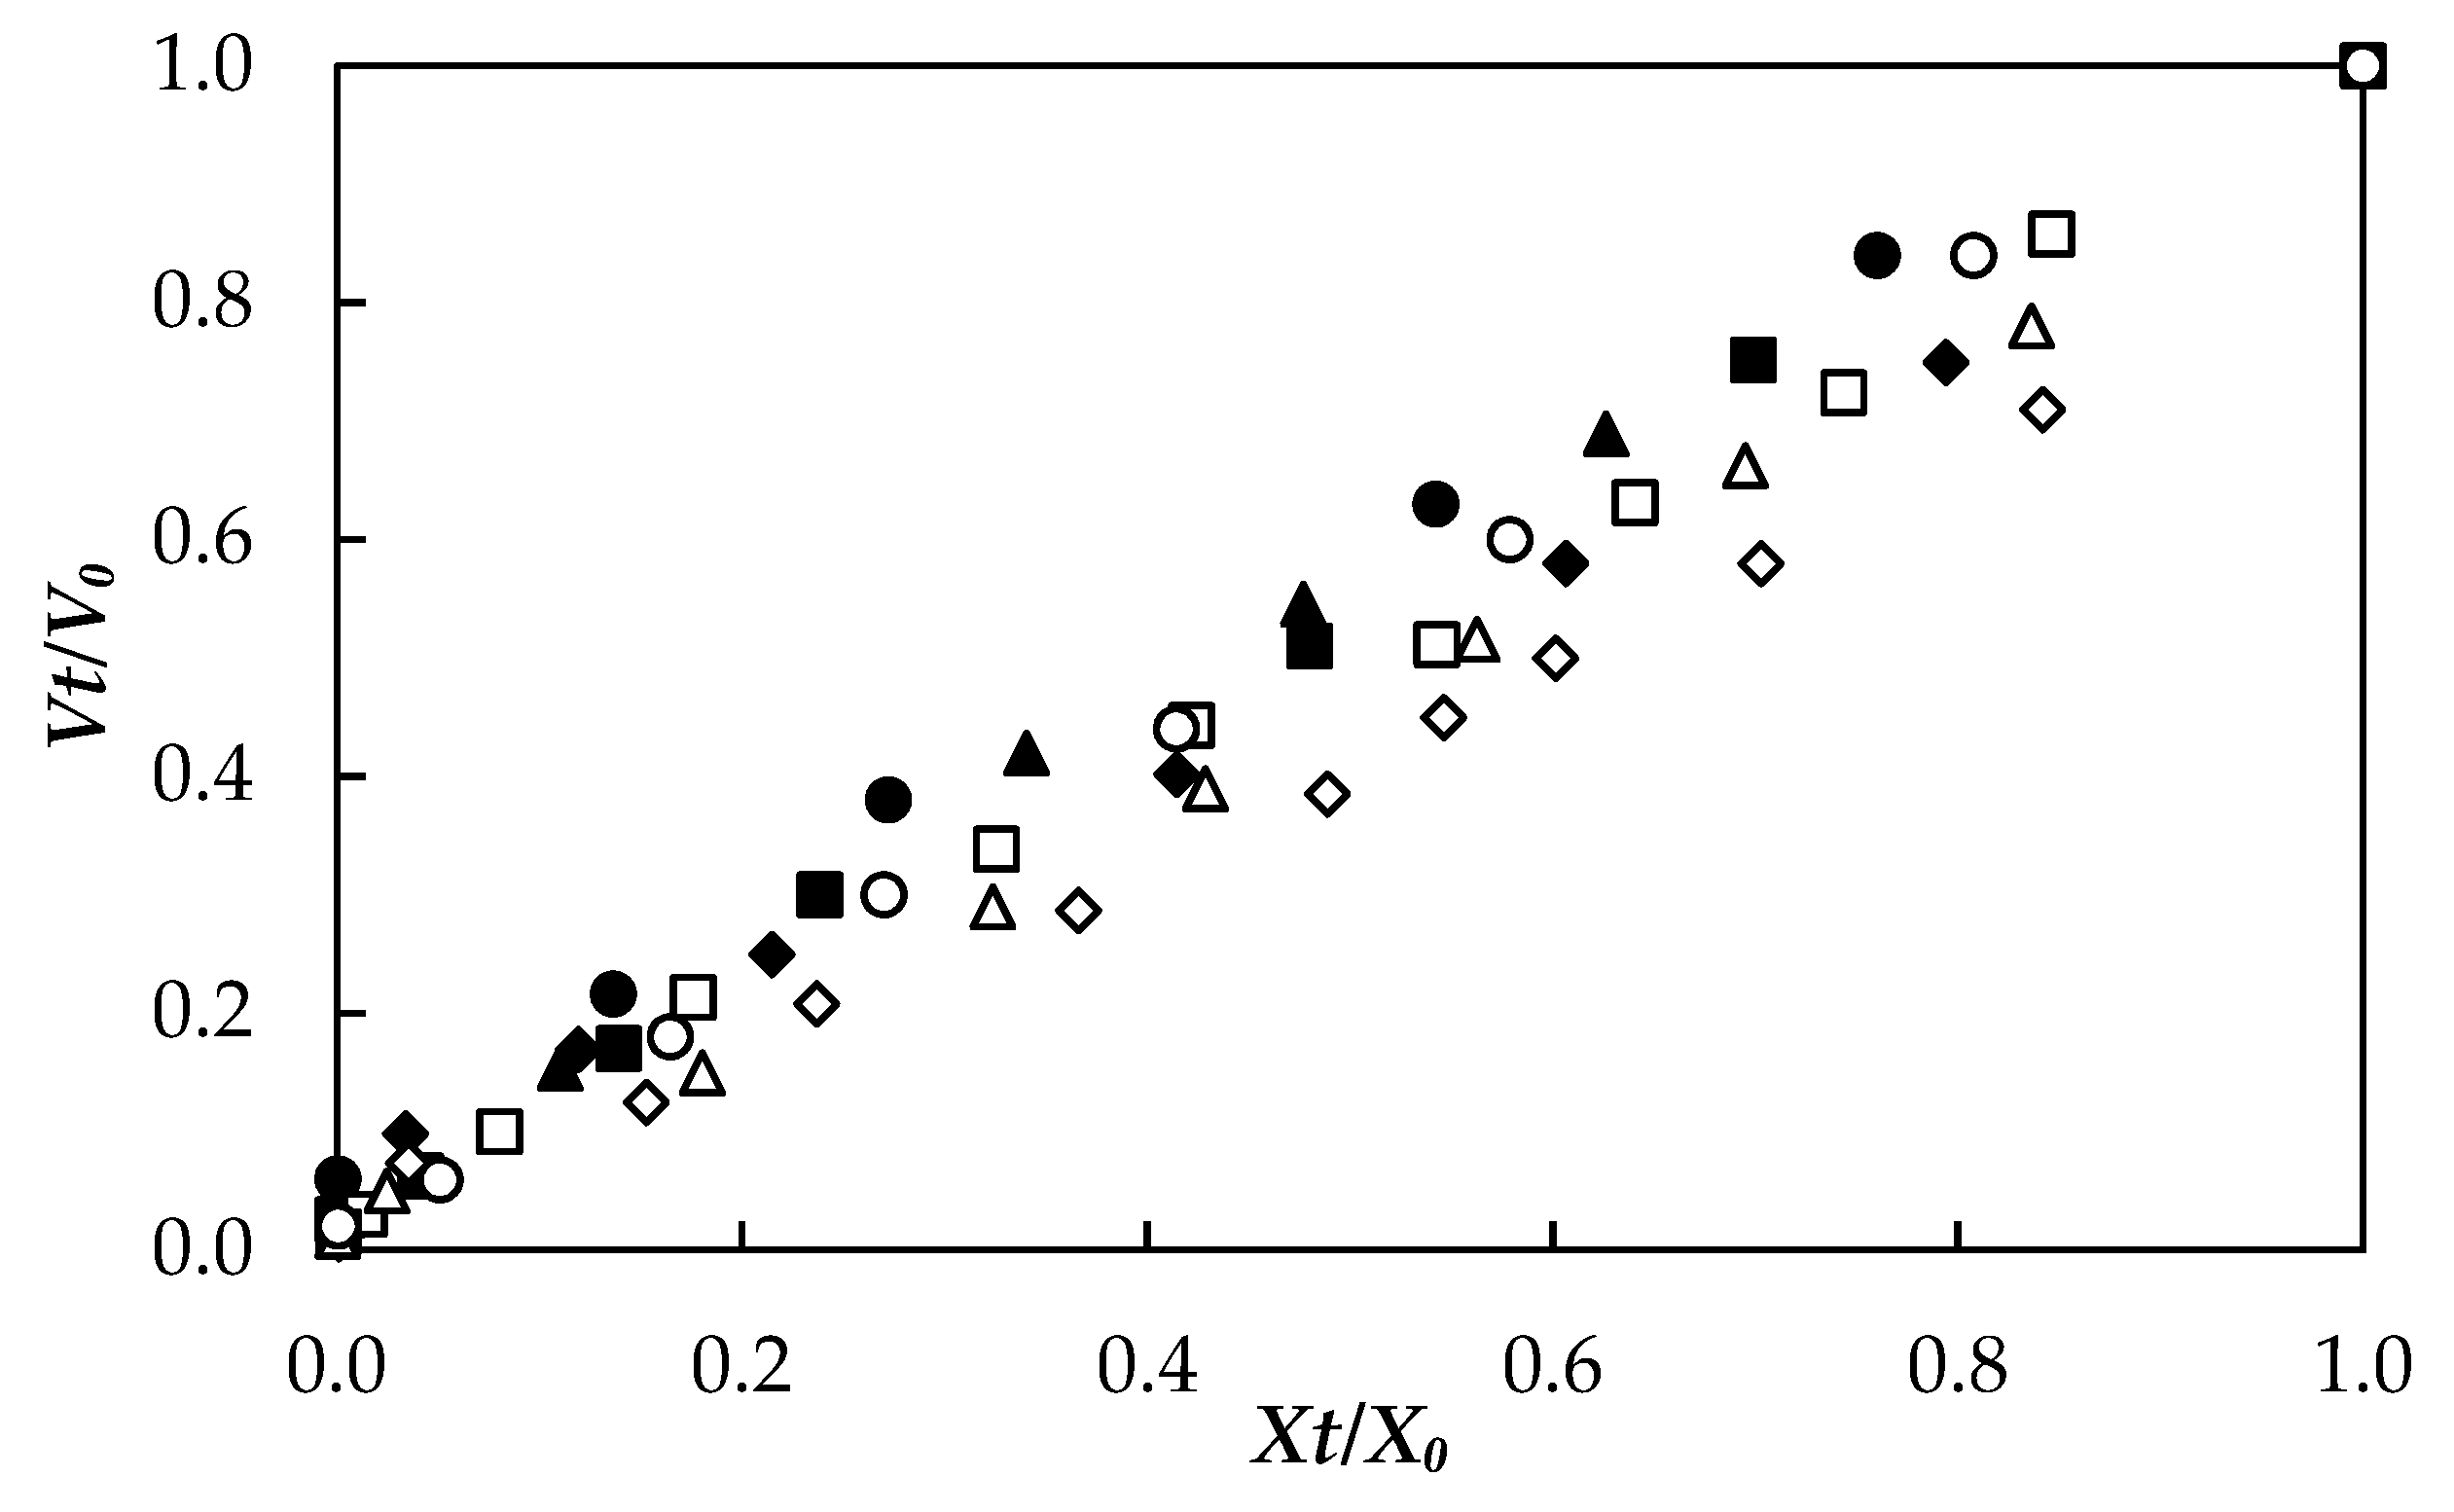
3.4. Volume Change
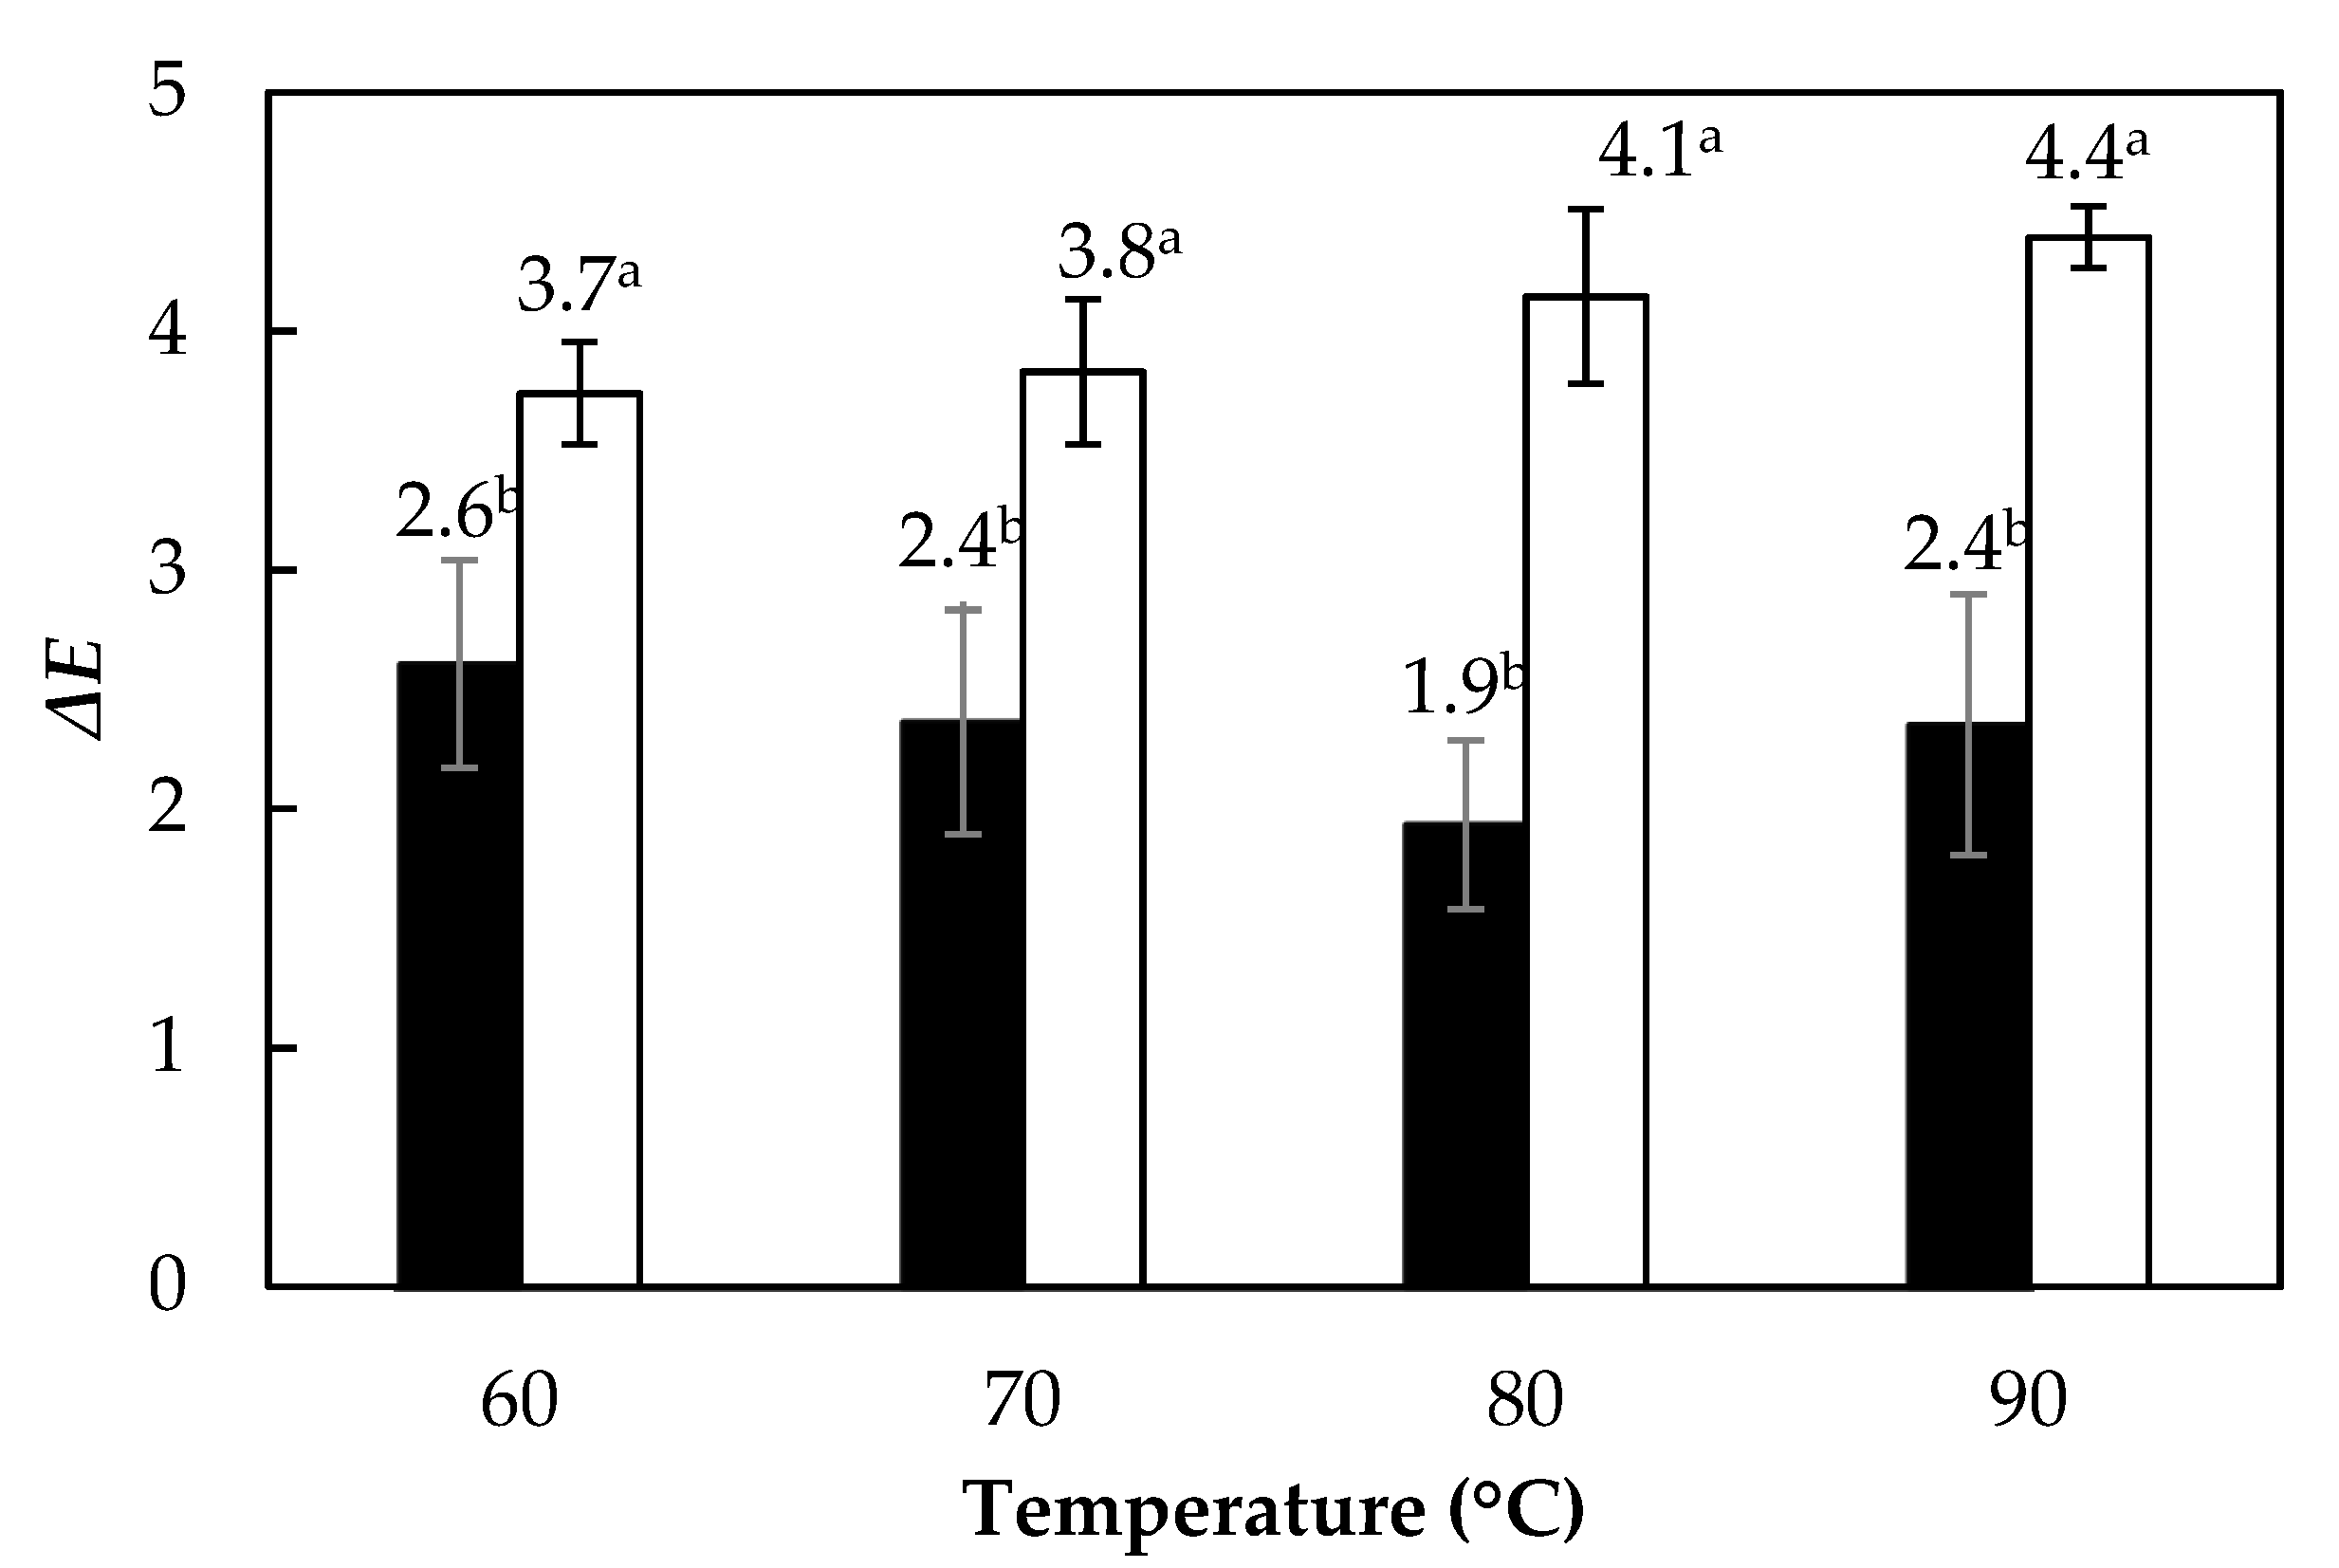
3.5. Color Change
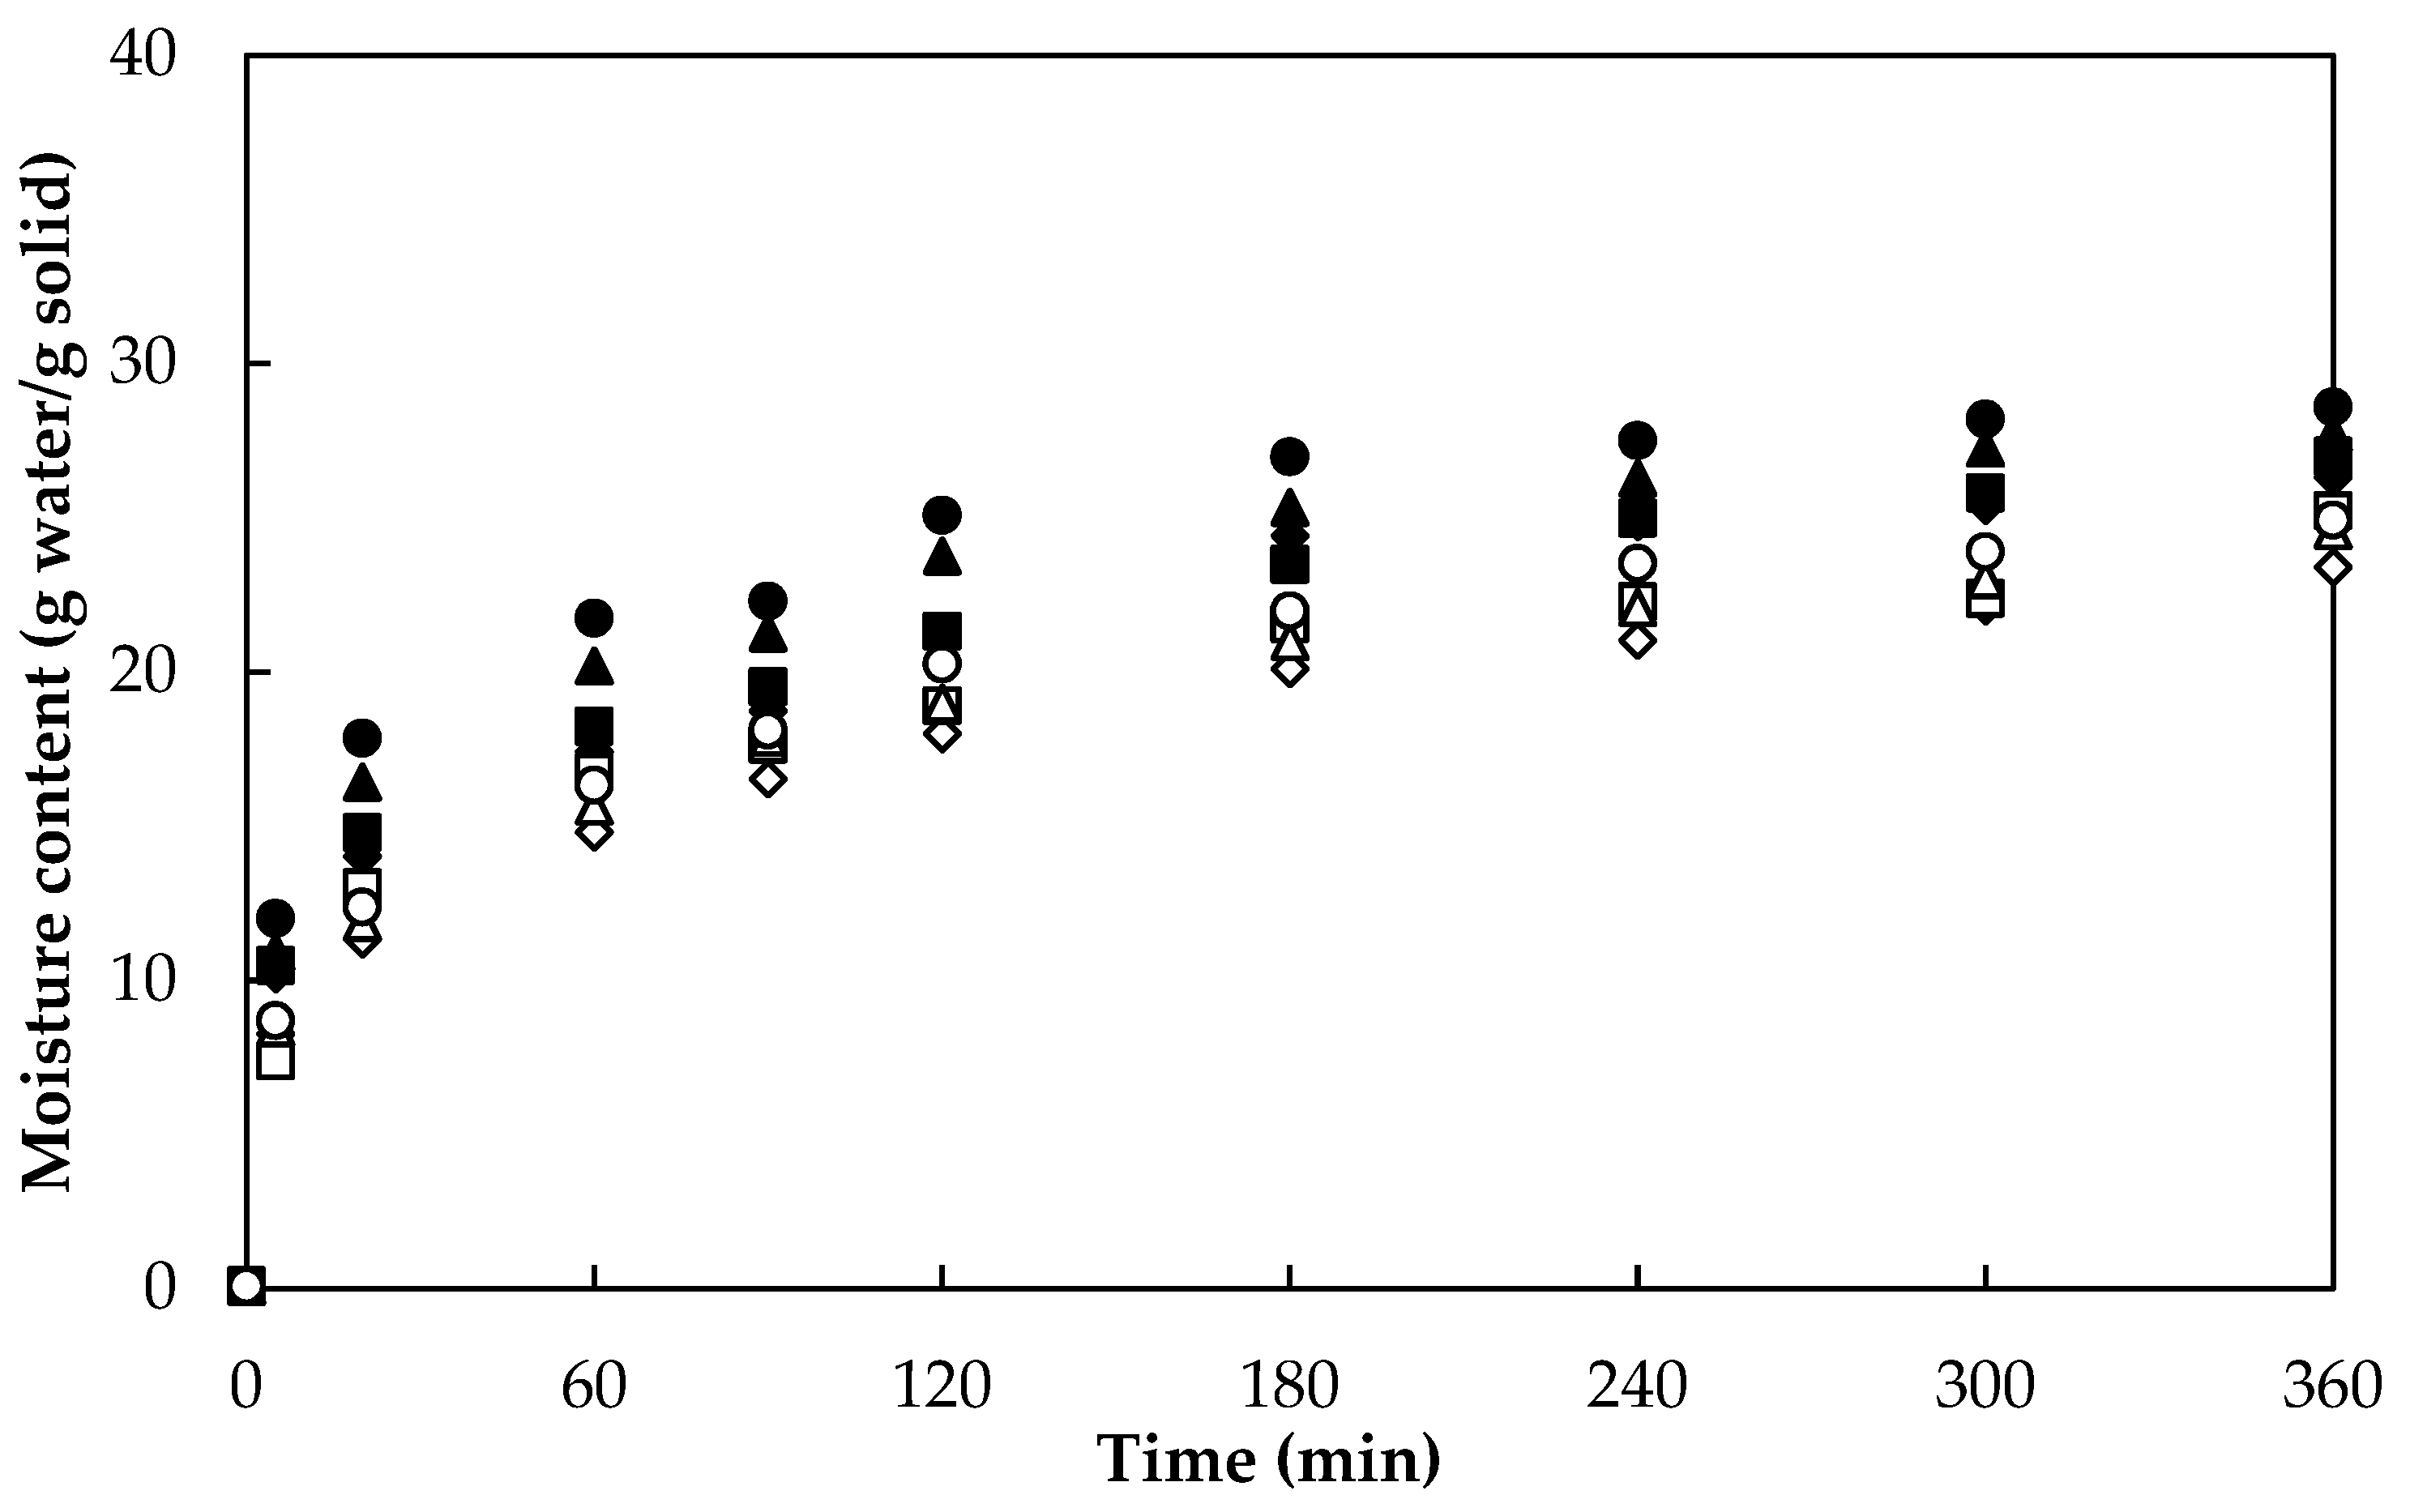
3.6. Rehydration
3.7. Vitamins
4. Conclusions
Author Contributions
Funding
Institutional Review Board Statement
Informed Consent Statement
Data Availability Statement
Conflicts of Interest
References
- Kumar, R.; Singh, A.K.; Gupta, A.; Bishayee, A.; Pandey, A.K. Therapeutic potential of Aloe vera—A miracle gift of nature. Phytomedicine 2019, 60, 152996. [Google Scholar] [CrossRef]
- Hęś, M.; Dziedzic, K.; Górecka, D.; Jędrusek-Golińska, A.; Gujska, E. Aloe vera (L.) Webb: Natural Sources of Antioxidants—A Review. Plant Foods Hum. Nutr. 2019, 74, 255–265. [Google Scholar] [CrossRef] [PubMed] [Green Version]
- Añibarro-Ortega, M.; Pinela, J.; Barros, L.; Ćirić, A.; Silva, S.P.; Coelho, E.; Mocan, A.; Calhelha, R.C.; Soković, M.; Coimbra, M.A.; et al. Compositional Features and Bioactive Properties of Aloe vera Leaf (Fillet, Mucilage, and Rind) and Flower. Antioxidants 2019, 8, 444. [Google Scholar] [CrossRef] [PubMed] [Green Version]
- Maan, A.A.; Nazir, A.; Khan, M.K.I.; Ahmad, T.; Zia, R.; Murid, M.; Abrar, M. The therapeutic properties and applications of Aloe vera: A review. J. Herb. Med. 2018, 12, 1–10. [Google Scholar] [CrossRef]
- Ahlawat, K.S.; Khatkar, B.S. Processing, food applications and safety of aloe vera products: A review. J. Food Sci. Technol. 2011, 48, 525–533. [Google Scholar] [CrossRef] [PubMed] [Green Version]
- Research and Markets Aloe Vera Gel Market: Global Industry Trends, Share, Size, Growth, Opportunity and Forecast 2020–2025; Research and Markets: Dublin, Ireland, 2020.
- Vega-Mercado, H.; Marcela Góngora-Nieto, M.; Barbosa-Cánovas, G.V. Advances in dehydration of foods. J. Food Eng. 2001, 49, 271–289. [Google Scholar] [CrossRef]
- Raghavi, L.M.; Moses, J.A.; Anandharamakrishnan, C. Refractance window drying of foods: A review. J. Food Eng. 2018, 222, 267–275. [Google Scholar] [CrossRef]
- Miranda, M.; Maureira, H.; Rodríguez, K.; Vega-Galvez, A. Influence of temperature on the drying kinetics, physicochemical properties, and antioxidant capacity of Aloe Vera (Aloe Barbadensis Miller) gel. J. Food Eng. 2009, 91, 297–304. [Google Scholar] [CrossRef]
- Vega, A.; Uribe, E.; Lemus, R.; Miranda, M. Hot-air drying characteristics of Aloe vera (Aloe barbadensis Miller) and influence of temperature on kinetic parameters. LWT Food Sci. Technol. 2007, 40, 1698–1707. [Google Scholar] [CrossRef]
- Gulia, A.; Sharma, H.K.; Sarkar, B.C.; Upadhyay, A.; Shitandi, A. Changes in physico-chemical and functional properties during convective drying of aloe vera (Aloe barbadensis) leaves. Food Bioprod. Process. 2010, 88, 161–164. [Google Scholar] [CrossRef]
- Cervantes-Martínez, C.V.; Medina-Torres, L.; González-Laredo, R.F.; Calderas, F.; Sanchez-Olivares, G.; Herrera-Valencia, E.E.; Infante, J.G.A.; Rocha-Guzman, N.E.; Rodríguez-Ramírez, J. Study of spray drying of the Aloe vera mucilage (Aloe vera barbadensis Miller) as a function of its rheological properties. LWT Food Sci. Technol. 2014, 55, 426–435. [Google Scholar] [CrossRef]
- Pisalkar, P.S.; Jain, N.K.; Pathare, P.B.; Murumkar, R.P.; Revaskar, V.A. Osmotic dehydration of aloe vera cubes and selec-tion of suitable drying model. Int. Food Res. J. 2014, 21, 373–378. [Google Scholar]
- Sriariyakul, W.; Swasdisevi, T.; Devahastin, S.; Soponronnarit, S. Drying of aloe vera puree using hot air in combination with far-infrared radiation and high-voltage electric field: Drying kinetics, energy consumption and product quality evaluation. Food Bioprod. Process. 2016, 100, 391–400. [Google Scholar] [CrossRef]
- Bao, H.; Zhou, J.; Yu, J.; Wang, S. Effect of Drying Methods on Properties of Potato Flour and Noodles Made with Potato Flour. Foods 2021, 10, 1115. [Google Scholar] [CrossRef] [PubMed]
- Abbaspour-Gilandeh, Y.; Kaveh, M.; Fatemi, H.; Aziz, M. Combined Hot Air, Microwave, and Infrared Drying of Hawthorn Fruit: Effects of Ultrasonic Pretreatment on Drying Time, Energy, Qualitative, and Bioactive Compounds’ Properties. Foods 2021, 10, 1006. [Google Scholar] [CrossRef] [PubMed]
- Ladha-Sabur, A.; Bakalis, S.; Fryer, P.J.; Lopez-Quiroga, E. Mapping energy consumption in food manufacturing. Trends Food Sci. Technol. 2019, 86, 270–280. [Google Scholar] [CrossRef]
- Nallan Chakravartula, S.; Moscetti, R.; Farinon, B.; Vinciguerra, V.; Merendino, N.; Bedini, G.; Neri, L.; Pittia, P.; Massantini, R. Stinging Nettles as Potential Food Additive: Effect of Drying Processes on Quality Characteristics of Leaf Powders. Foods 2021, 10, 1152. [Google Scholar] [CrossRef]
- Zhang, W.; Chen, C.; Pan, Z.; Zheng, Z. Vacuum and Infrared-Assisted Hot Air Impingement Drying for Improving the Processing Performance and Quality of Poria cocos (Schw.) Wolf Cubes. Foods 2021, 10, 992. [Google Scholar] [CrossRef]
- Xia, J.; Guo, Z.; Fang, S.; Gu, J.; Liang, X. Effect of Drying Methods on Volatile Compounds of Burdock (Arctium lappa L.) Root Tea as Revealed by Gas Chromatography Mass Spectrometry-Based Metabolomics. Foods 2021, 10, 868. [Google Scholar] [CrossRef] [PubMed]
- Ferreira, J.P.D.L.; Queiroz, A.J.D.M.; Figueirêdo, R.M.F.D.; Silva, W.P.D.; Gomes, J.P.; Santos, D.D.C.; Silva, H.A.; Rocha, A.P.T.; Paiva, A.C.C.D.; Chaves, A.D.C.G.; et al. Utilization of Cumbeba (Tacinga inamoena) Residue: Drying Kinetics and Effect of Process Conditions on Antioxidant Bioactive Compounds. Foods 2021, 10, 788. [Google Scholar] [CrossRef]
- Minjares-Fuentes, R.; Femenia, A.; Comas-Serra, F.; Rosselló, C.; Rodríguez-González, V.M.; González-Laredo, R.F.; Gallegos-Infante, J.; Medina-Torres, L. Effect of different drying procedures on physicochemical properties and flow behavior of Aloe vera (Aloe barbadensis Miller) gel. LWT 2016, 74, 378–386. [Google Scholar] [CrossRef]
- Nindo, C.I.; Tang, J. Refractance Window Dehydration Technology: A Novel Contact Drying Method. Dry. Technol. 2007, 25, 37–48. [Google Scholar] [CrossRef]
- Ochoa-Martínez, C.I.; Quintero, P.T.; Ayala, A.A.; Ortiz, M.J. Drying characteristics of mango slices using the Refractance Window™ technique. J. Food Eng. 2012, 109, 69–75. [Google Scholar] [CrossRef]
- Ortiz-Jerez, M.J.; Gulati, T.; Datta, A.K.; Ochoa-Martínez, C.I. Quantitative understanding of Refractance Window™ drying. Food Bioprod. Process. 2015, 95, 237–253. [Google Scholar] [CrossRef]
- AOAC. AOAC International Official Methods of Analysis, 17th ed.; Horwitz, W., Latimer, G., Eds.; AOAC International: Rockville, MD, USA, 2006. [Google Scholar]
- Ocoró-Zamora, M.U.; Ayala-Aponte, A. Influence of thickness on the drying of papaya puree (Carica papaya L.) through Refractance WindowTM technology. Dyna 2013, 80, 147–154. [Google Scholar]
- US Pharmacopeia USP-35/NF-30; The United States Pharmacopeial Convention: Rockville, MD, USA, 2012.
- Sabat, M.; Patel, S.; Kalne, A.A. Influence of Temperature on Drying Kinetics of Aloe vera and Its Mathematical Modeling. Curr. J. Appl. Sci. Technol. 2018, 31, 1–10. [Google Scholar] [CrossRef]
- Jha, R.K.; Prabhakar, P.K.; Srivastav, P.P.; Rao, V.V. Influence of temperature on vacuum drying characteristics, functional properties and micro structure of Aloe vera (Aloe barbadensis Miller) gel. Res. Agric. Eng. 2016, 61, 141–149. [Google Scholar] [CrossRef] [Green Version]
- Azizi, D.; Jafari, S.M.; Mirzaei, H.; Dehnad, D. The Influence of Refractance Window Drying on Qualitative Properties of Kiwifruit Slices. Int. J. Food Eng. 2017, 13. [Google Scholar] [CrossRef]
- Beigi, M. Drying of mint leaves: Influence of the process temperature on dehydration parameters, quality attributes, and energy consumption. J. Agric. Sci. Technol. 2019, 21, 77–88. [Google Scholar]
- Mahanti, N.K.; Chakraborty, S.K.; Sudhakar, A.; Verma, D.K.; Shankar, S.; Thakur, M.; Singh, S.; Tripathy, S.; Gupta, A.K.; Srivastav, P.P. Refractance WindowTM-Drying vs. other drying methods and effect of different process parameters on quality of foods: A comprehensive review of trends and technological developments. Future Foods 2021, 3, 100024. [Google Scholar] [CrossRef]
- Caparino, O.A.; Tang, J.; Nindo, C.I.; Sablani, S.S.; Powers, J.R.; Fellman, J.K. Effect of drying methods on the physical properties and microstructures of mango (Philippine ‘Carabao’ var.) powder. J. Food Eng. 2012, 111, 135–148. [Google Scholar] [CrossRef]
- Artunduaga-Antury, K.L.; Vargas-Rojas, D.A.; Barrera-Bermeo, O.M. Conservation of aloe vera nutraceutical properties (Aloe barbadensis Miller) by drying techniques. Rev. Ing. Región 2021, 25, 6–21. [Google Scholar] [CrossRef]
- Xiao, H.-W.; Pang, C.-L.; Wang, L.-H.; Bai, J.-W.; Yang, W.-X.; Gao, Z.-J. Drying kinetics and quality of Monukka seedless grapes dried in an air-impingement jet dryer. Biosyst. Eng. 2010, 105, 233–240. [Google Scholar] [CrossRef]
- Macedo, L.L.; Vimercati, W.C.; Araújo, C.; Saraiva, S.H.; Teixeira, L.J.Q. Effect of drying air temperature on drying kinetics and physicochemical characteristics of dried banana. J. Food Process. Eng. 2020, 43. [Google Scholar] [CrossRef]
- Macedo, L.L.; Corrêa, J.L.G.; Fonseca, H.C.; Araújo, C.D.S.; Vimercati, W.C.; Gandia, R.M. Convective drying of Butia Capitata pulp: Effect of air temperature on kinetic and quality parameters. Res. Soc. Dev. 2020, 9. [Google Scholar] [CrossRef]
- Nguyen, M.-H.; Price, W.E. Air-drying of banana: Influence of experimental parameters, slab thickness, banana maturity and harvesting season. J. Food Eng. 2007, 79, 200–207. [Google Scholar] [CrossRef] [Green Version]
- Jafari, S.-M.; Azizi, D.; Mirzaei, H.; Dehnad, D. Comparing Quality Characteristics of Oven-Dried and Refractance Window-Dried Kiwifruits. J. Food Process. Preserv. 2016, 40, 362–372. [Google Scholar] [CrossRef]
- Sadin, R.; Chegini, G.-R.; Sadin, H. The effect of temperature and slice thickness on drying kinetics tomato in the infrared dryer. Heat Mass Transf. 2014, 50, 501–507. [Google Scholar] [CrossRef]
- Kumar, P.S.; Nambi, E.; Shiva, K.N.; Vaganan, M.M.; Ravi, I.; Jeyabaskaran, K.J.; Uma, S. Thin layer drying kinetics of Banana var. Monthan (ABB): Influence of convective drying on nutritional quality, microstructure, thermal properties, color, and sensory characteristics. J. Food Process. Eng. 2019, 42. [Google Scholar] [CrossRef]
- Torki-Harchegani, M.; Ghasemi-Varnamkhasti, M.; Ghanbarian, D.; Sadeghi, M.; Tohidi, M. Dehydration characteristics and mathematical modelling of lemon slices drying undergoing oven treatment. Heat Mass Transf. 2016, 52, 281–289. [Google Scholar] [CrossRef]
- Sampaio, R.M.; Neto, J.P.M.; Perez, V.H.; Marcos, S.K.; Boizan, M.A.; Silva, L.R. Mathematical Modeling of Drying Kinetics of Persimmon Fruits (Diospyros kaki cv. Fuyu). J. Food Process. Preserv. 2016, 41, e12789. [Google Scholar] [CrossRef]
- Yadollahinia, A.; Jahangiri, M. Shrinkage of potato slice during drying. J. Food Eng. 2009, 94, 52–58. [Google Scholar] [CrossRef]
- Mayor, L.; Sereno, A.M. Modelling shrinkage during convective drying of food materials: A review. J. Food Eng. 2004, 61, 373–386. [Google Scholar] [CrossRef]
- Ramallo, L.A.; Mascheroni, R.H. Quality evaluation of pineapple fruit during drying process. Food Bioprod. Process. 2012, 90, 275–283. [Google Scholar] [CrossRef]
- Miranda, M.; Vega-Gálvez, A.; García, P.; Di Scala, K.; Shi, J.; Xue, S.; Uribe, E. Effect of temperature on structural properties of Aloe vera (Aloe barbadensis Miller) gel and Weibull distribution for modelling drying process. Food Bioprod. Process. 2010, 88, 138–144. [Google Scholar] [CrossRef]
- Vega-Galvez, A.; Notte-Cuello, E.; Lemus-Mondaca, R.; Zura, L.; Miranda, M. Mathematical modelling of mass transfer during rehydration process of Aloe vera (Aloe barbadensis Miller). Food Bioprod. Process. 2009, 87, 254–260. [Google Scholar] [CrossRef]
- Benseddik, A.; Azzi, A.; Zidoune, M.N.; Khanniche, R.; Besombes, C. Empirical and diffusion models of rehydration process of differently dried pumpkin slices. J. Saudi Soc. Agric. Sci. 2019, 18, 401–410. [Google Scholar] [CrossRef]
- Chenlo, F.; Arufe, S.; Díaz, D.; Torres, M.D.; Sineiro, J.; Moreira, R. Air-drying and rehydration characteristics of the brown seaweeds, Ascophylum nodosum and Undaria pinnatifida. J. Appl. Phycol. 2017, 30, 1259–1270. [Google Scholar] [CrossRef]
- Krokida, M.; Marinos-Kouris, D. Rehydration kinetics of dehydrated products. J. Food Eng. 2003, 57, 1–7. [Google Scholar] [CrossRef]
- Tepe, T.K.; Tepe, B. The comparison of drying and rehydration characteristics of intermittent-microwave and hot-air dried-apple slices. Heat Mass Transf. 2020, 56, 3047–3057. [Google Scholar] [CrossRef]
- Aral, S.; Beşe, A.V. Convective drying of hawthorn fruit (Crataegus spp.): Effect of experimental parameters on drying kinetics, color, shrinkage, and rehydration capacity. Food Chem. 2016, 210, 577–584. [Google Scholar] [CrossRef]
- Xiao, H.-W.; Bai, J.-W.; Xie, L.; Sun, D.-W.; Gao, Z.-J. Thin-layer air impingement drying enhances drying rate of American ginseng (Panax quinquefolium L.) slices with quality attributes considered. Food Bioprod. Process. 2015, 94, 581–591. [Google Scholar] [CrossRef]
- Saberian, H.; Abbasi, S.; Hamidi-Esfahani, Z. Effect of pasteurization and storage on bioactive components of Aloe vera gel. Nutr. Food Sci. 2013, 43, 175–183. [Google Scholar] [CrossRef]
- Nielsen, C.W.; Rustad, T.; Holdt, S.L. Vitamin C from Seaweed: A Review Assessing SeaWeed as Contributor to Daily Intake. Foods 2021, 10, 198. [Google Scholar] [CrossRef] [PubMed]
- Rudolph, A.; El-Mohamad, A.; McHardy, C.; Rauh, C. Concentrating Model Solutions and Fruit Juices Using CO2 Hydrate Technology and Its Quantitative Effect on Phenols, Carotenoids, Vitamin C and Betanin. Foods 2021, 10, 626. [Google Scholar] [CrossRef]
- Nemati, Z.; Alirezalu, K.; Besharati, M.; Amirdahri, S.; Franco, D.; Lorenzo, J.M. Improving the Quality Characteristics and Shelf Life of Meat and Growth Performance in Goose Fed Diets Supplemented with Vitamin E. Foods 2020, 9, 798. [Google Scholar] [CrossRef]
- Gómez-Limia, L.; Sanmartín, N.M.; Carballo, J.M.; Domínguez, R.; Lorenzo, J.; Martínez, S. Oxidative Stability and Antioxidant Activity in Canned Eels: Effect of Processing and Filling Medium. Foods 2021, 10, 790. [Google Scholar] [CrossRef] [PubMed]
- Ouyang, M.; Cao, S.; Huang, Y.; Wang, Y. Phenolics and ascorbic acid in pumpkin (Cucurbita maxima) slices: Effects of hot air drying and degradation kinetics. J. Food Meas. Charact. 2021, 15, 247–255. [Google Scholar] [CrossRef]
- Kurozawa, L.E.; Terng, I.; Hubinger, M.D.; Park, K.J. Ascorbic acid degradation of papaya during drying: Effect of process conditions and glass transition phenomenon. J. Food Eng. 2014, 123, 157–164. [Google Scholar] [CrossRef]
- Jha, A.K.; Sit, N. Drying characteristics and kinetics of colour change and degradation of phytocomponents and antioxidant activity during convective drying of deseeded Terminalia chebula fruit. J. Food Meas. Charact. 2020, 14, 2067–2077. [Google Scholar] [CrossRef]
- Leiton-Ramírez, Y.M.; Ayala-Aponte, A.; Ochoa-Martínez, C.I. Physicochemical Properties of Guava Snacks as Affected by Drying Technology. Processes 2020, 8, 106. [Google Scholar] [CrossRef] [Green Version]
- Kolla, M.C.; Laya, A.; Bayang, J.P.; Koubala, B.B. Effect of different drying methods and storage conditions on physical, nutritional, bioactive compounds and antioxidant properties of doum (Hyphaene thebaica) fruits. Heliyon 2021, 7, e06678. [Google Scholar] [CrossRef] [PubMed]


| Model Name | Model |
|---|---|
| Page | |
| Modified Page | |
| Henderson and Pabis | |
| Logarithmic | |
| Midilli–Kuck |
| Thickness (mm) | Deff × 10−⁹ m2/s | Ea (kJ/mol) | |||
|---|---|---|---|---|---|
| 60 °C | 70 °C | 80 °C | 90 °C | ||
| 5 | 7 ± 0 e | 9 ± 1 e | 13 ± 1 d | 19 ± 1 c | 33 ± 2 a |
| 10 | 13 ± 1 d | 17 ± 1 c | 24 ± 1 b | 27 ± 2 a | 26 ± 2 b |
| Model | Parameters and Statistical Test | 5 mm | 10 mm | ||||||
|---|---|---|---|---|---|---|---|---|---|
| 60 °C | 70 °C | 80 °C | 90 °C | 60 °C | 70 °C | 80 °C | 90 °C | ||
| Page | k × 10−3 | 2.788 | 4.884 | 5.376 | 6.839 | 0.700 | 1.167 | 1.286 | 2.753 |
| n | 1.538 | 1.358 | 1.484 | 1.536 | 1.478 | 1.453 | 1.502 | 1.422 | |
| R2 | 0.946 | 0.995 | 0.994 | 0.997 | 0.992 | 0.993 | 0.993 | 0.998 | |
| χ2 | 0.011 | 0.001 | 0.001 | 0.001 | 0.001 | 0.001 | 0.002 | 0.000 | |
| RMSE | 0.094 | 0.029 | 0.031 | 0.130 | 0.035 | 0.032 | 0.036 | 0.106 | |
| SSE | 0.009 | 0.001 | 0.001 | 0.017 | 0.001 | 0.001 | 0.001 | 0.011 | |
| Modified Page | k × 10−3 | 16.353 | 21.338 | 27.737 | 38.931 | 7.337 | 9.577 | 11.909 | 15.813 |
| n | 1.538 | 1.358 | 1.484 | 1.536 | 1.478 | 1.453 | 1.502 | 1.422 | |
| R2 | 0.998 | 0.998 | 0.997 | 0.997 | 0.992 | 0.993 | 0.993 | 0.998 | |
| χ2 | 0.001 | 0.000 | 0.001 | 0.001 | 0.001 | 0.001 | 0.002 | 0.000 | |
| RMSE | 0.021 | 0.020 | 0.022 | 0.130 | 0.035 | 0.032 | 0.036 | 0.106 | |
| SSE | 0.000 | 0.000 | 0.000 | 0.017 | 0.001 | 0.001 | 0.001 | 0.011 | |
| Henderson and Pabis | k × 10−3 | 18.126 | 23.139 | 29.319 | 41.602 | 8.068 | 10.396 | 12.969 | 17.273 |
| a | 1.064 | 1.038 | 1.036 | 1.052 | 1.083 | 1.064 | 1.066 | 1.059 | |
| R2 | 0.982 | 0.988 | 0.982 | 0.973 | 0.973 | 0.977 | 0.976 | 0.987 | |
| χ2 | 0.004 | 0.002 | 0.004 | 0.007 | 0.005 | 0.004 | 0.005 | 0.003 | |
| RMSE | 0.059 | 0.044 | 0.054 | 0.117 | 0.065 | 0.061 | 0.065 | 0.111 | |
| SSE | 0.003 | 0.002 | 0.003 | 0.014 | 0.004 | 0.004 | 0.004 | 0.012 | |
| Logarithmic | k × 10−3 | 10.541 | 15.254 | 15.558 | 24.307 | 3.401 | 5.012 | 5.272 | 10.056 |
| a | 1.352 | 1.227 | 1.433 | 1.368 | 1.662 | 1.506 | 1.718 | 1.347 | |
| b | −0.324 | −0.216 | −0.428 | −0.345 | −0.645 | −0.497 | −0.707 | −0.325 | |
| R2 | 0.997 | 0.998 | 0.999 | 0.994 | 0.997 | 0.998 | 0.998 | 0.999 | |
| χ2 | 0.001 | 0.001 | 0.000 | 0.003 | 0.001 | 0.001 | 0.001 | 0.000 | |
| RMSE | 0.028 | 0.018 | 0.011 | 0.120 | 0.022 | 0.020 | 0.019 | 0.105 | |
| SSE | 0.001 | 0.000 | 0.000 | 0.014 | 0.000 | 0.000 | 0.000 | 0.011 | |
| Midilli–Kuck | k × 10−3 | 4.707 | 8.143 | 10.111 | 11.291 | 1.652 | 2.030 | 2.911 | 4.455 |
| n | 1.229 | 1.224 | 1.229 | 1.190 | 1.243 | 1.283 | 1.249 | 1.275 | |
| a | 0.997 | 0.997 | 0.999 | 1.000 | 0.991 | 0.979 | 0.990 | 1.000 | |
| b × 105 | −0.002 | −0.001 | −0.001 | −0.007 | −0.001 | −0.001 | −0.001 | −0.001 | |
| R2 | 0.997 | 0.999 | 1.000 | 0.998 | 0.998 | 0.998 | 0.998 | 1.000 | |
| χ2 | 0.002 | 0.000 | 0.000 | 0.002 | 0.001 | 0.000 | 0.001 | 0.000 | |
| RMSE | 0.033 | 0.014 | 0.009 | 0.119 | 0.021 | 0.018 | 0.019 | 0.108 | |
| SSE | 0.001 | 0.000 | 0.000 | 0.009 | 0.000 | 0.000 | 0.000 | 0.012 | |
| T (°C) | Vitamin C Content (mg/100 g Solid) | Vitamin C Loss (%) | Vitamin E Content (mg/100 g Solid) | Vitamin E Loss (%) | ||||
|---|---|---|---|---|---|---|---|---|
| 5 mm | 10 mm | 5 mm | 10 mm | 5 mm | 10 mm | 5 mm | 10 mm | |
| 60 | 68 ± 1 a | 81 ± 2 a | 41 ± 1 a | 29 ±1 a | 0.48 ± 0.03 a | 0.52 ± 0.02 a | 33 ± 0 a | 28 ± 0 a |
| 70 | 63 ± 1 b | 76 ±1 b | 44 ± 1 b | 37 ± 1 b | 0.47 ± 0.04 a | 0.51 ± 0.03 a | 35 ± 0 a | 29 ± 0 a |
| 80 | 53 ± 1 c | 68 ± 1 c | 54 ± 1 c | 41 ±1 c | 0.47 ± 0.02 a | 0.50 ± 0.02 a | 35 ± 0 a | 30 ± 0 a |
| 90 | 47 ± 1 d | 57 ± 1 d | 59 ± 1 d | 50 ±1 d | 0.46 ± 0.03 a | 0.49 ± 0.01 a | 37 ± 0 a | 32 ± 0 a |
Publisher’s Note: MDPI stays neutral with regard to jurisdictional claims in published maps and institutional affiliations. |
© 2021 by the authors. Licensee MDPI, Basel, Switzerland. This article is an open access article distributed under the terms and conditions of the Creative Commons Attribution (CC BY) license (https://creativecommons.org/licenses/by/4.0/).
Share and Cite
Ayala-Aponte, A.A.; Cárdenas-Nieto, J.D.; Tirado, D.F. Aloe vera Gel Drying by Refractance Window®: Drying Kinetics and High-Quality Retention. Foods 2021, 10, 1445. https://doi.org/10.3390/foods10071445
Ayala-Aponte AA, Cárdenas-Nieto JD, Tirado DF. Aloe vera Gel Drying by Refractance Window®: Drying Kinetics and High-Quality Retention. Foods. 2021; 10(7):1445. https://doi.org/10.3390/foods10071445
Chicago/Turabian StyleAyala-Aponte, Alfredo A., José D. Cárdenas-Nieto, and Diego F. Tirado. 2021. "Aloe vera Gel Drying by Refractance Window®: Drying Kinetics and High-Quality Retention" Foods 10, no. 7: 1445. https://doi.org/10.3390/foods10071445
APA StyleAyala-Aponte, A. A., Cárdenas-Nieto, J. D., & Tirado, D. F. (2021). Aloe vera Gel Drying by Refractance Window®: Drying Kinetics and High-Quality Retention. Foods, 10(7), 1445. https://doi.org/10.3390/foods10071445