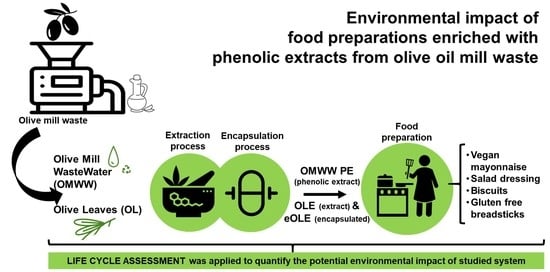
Figure 1.
Simplified system boundaries.
Figure 1.
Simplified system boundaries.
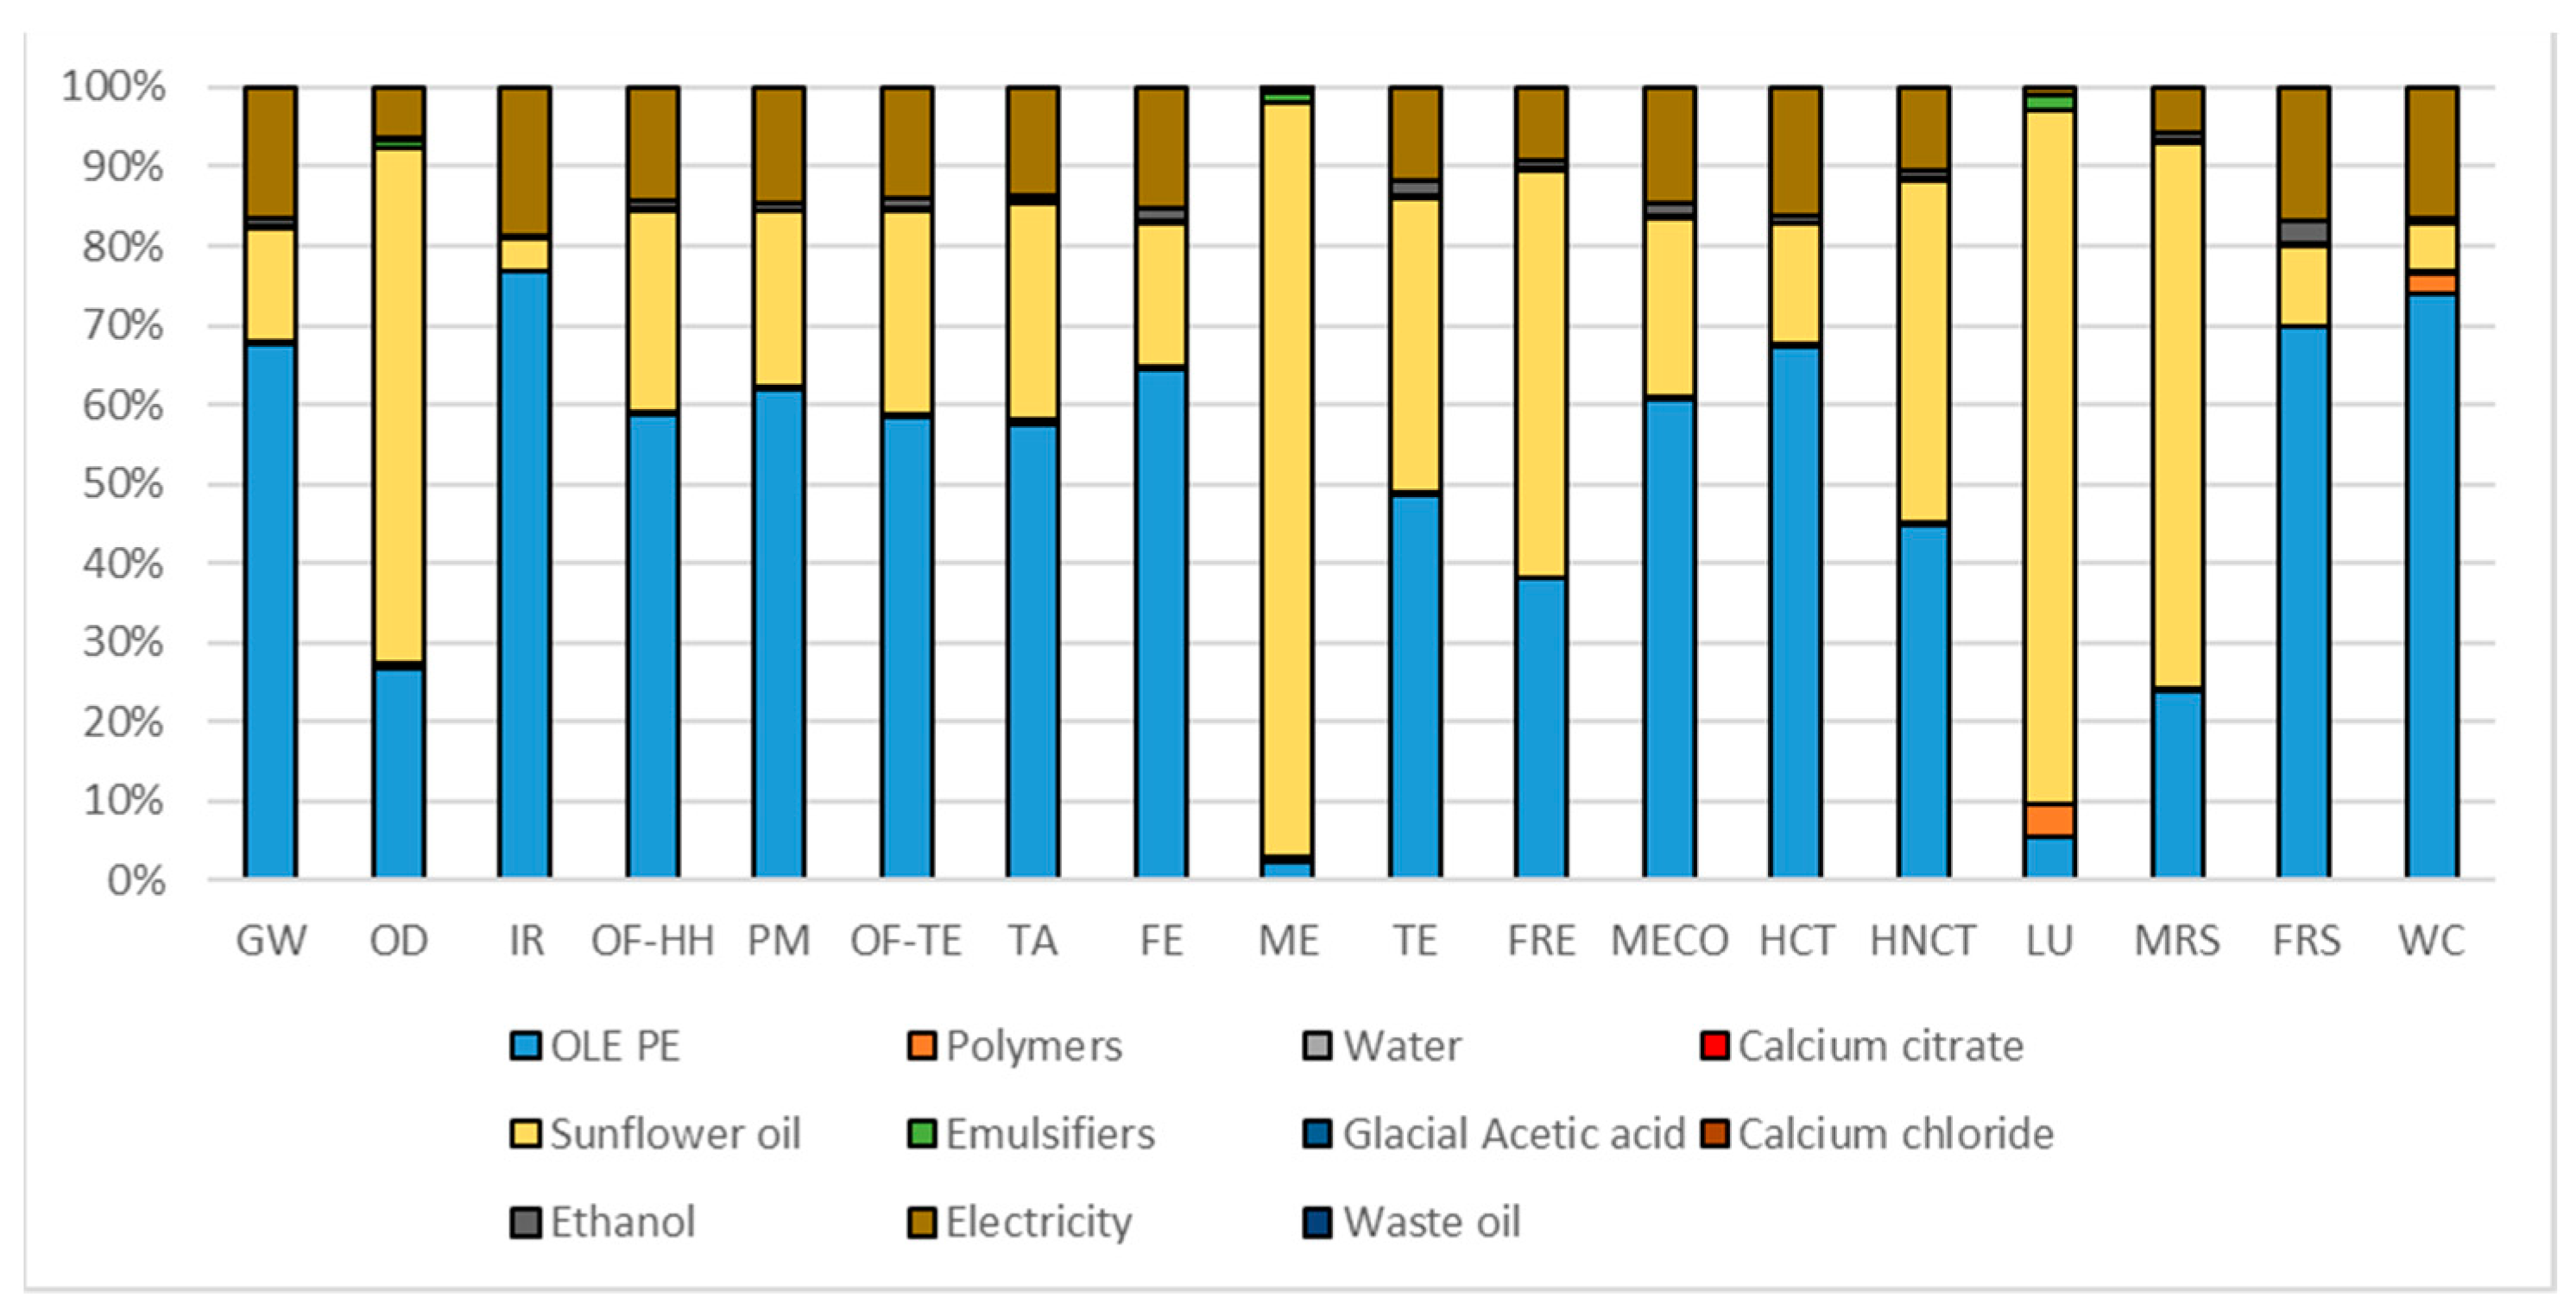
Figure 2.
Hotspot deriving from contribution analysis related to OMWW PE. Global warming (GW), Stratospheric ozone depletion (OD), Ionizing radiation (IR), Ozone formation, human health (OF-HH), Fine particulate matter formation (PM), Ozone formation, terrestrial ecosystems (OF-TE), Terrestrial acidification (TA), Freshwater eutrophication (FE), Marine eutrophication (ME), Terrestrial ecotoxicity (TE), Freshwater ecotoxicity (FRE), Marine ecotoxicity (MECO), Human carcinogenic toxicity (HCT), Human non-carcinogenic toxicity (HNCT), Land use (LU), Mineral resource scarcity (MRS), Fossil resource scarcity (FRS), and Water consumption (WC).
Figure 3.
Hotspot deriving from contribution analysis related to OLE. Global warming (GW), Stratospheric ozone depletion (OD), Ionizing radiation (IR), Ozone formation, human health (OF-HH), Fine particulate matter formation (PM), Ozone formation, terrestrial ecosystems (OF-TE), Terrestrial acidification (TA), Freshwater eutrophication (FE), Marine eutrophication (ME), Terrestrial ecotoxicity (TE), Freshwater ecotoxicity (FRE), Marine ecotoxicity (MECO), Human carcinogenic toxicity (HCT), Human non-carcinogenic toxicity (HNCT), Land use (LU), Mineral resource scarcity (MRS), Fossil resource scarcity (FRS), and Water consumption (WC).
Figure 4.
Hotspot deriving from contribution analysis related to eOLE. Global warming (GW), Stratospheric ozone depletion (OD), Ionizing radiation (IR), Ozone formation, human health (OF-HH), Fine particulate matter formation (PM), Ozone formation, terrestrial ecosystems (OF-TE), Terrestrial acidification (TA), Freshwater eutrophication (FE), Marine eutrophication (ME), Terrestrial ecotoxicity (TE), Freshwater ecotoxicity (FRE), Marine ecotoxicity (MECO), Human carcinogenic toxicity (HCT), Human non-carcinogenic toxicity (HNCT), Land use (LU), Mineral resource scarcity (MRS), Fossil resource scarcity (FRS), and Water consumption (WC).
Figure 5.
Environmental impact comparison of a vegan mayonnaise (350 g) vs. PE enriched product. Global warming (GW), Stratospheric ozone depletion (OD), Ionizing radiation (IR), Ozone formation, human health (OF-HH), Fine particulate matter formation (PM), Ozone formation, terrestrial ecosystems (OF-TE), Terrestrial acidification (TA), Freshwater eutrophication (FE), Marine eutrophication (ME), Terrestrial ecotoxicity (TE), Freshwater ecotoxicity (FRE), Marine ecotoxicity (MECO), Human carcinogenic toxicity (HCT), Human non-carcinogenic toxicity (HNCT), Land use (LU), Mineral resource scarcity (MRS), Fossil resource scarcity (FRS), and Water consumption (WC).
Figure 6.
Environmental impact comparison of a vegan mayonnaise (350 g) vs. PE enriched product normalized to oxidation induction time. Global warming (GW), Stratospheric ozone depletion (OD), Ionizing radiation (IR), Ozone formation, human health (OF-HH), Fine particulate matter formation (PM), Ozone formation, terrestrial ecosystems (OF-TE), Terrestrial acidification (TA), Freshwater eutrophication (FE), Marine eutrophication (ME), Terrestrial ecotoxicity (TE), Freshwater ecotoxicity (FRE), Marine ecotoxicity (MECO), Human carcinogenic toxicity (HCT), Human non-carcinogenic toxicity (HNCT), Land use (LU), Mineral resource scarcity (MRS), Fossil resource scarcity (FRS), and Water consumption (WC).
Figure 7.
Environmental impact comparison of salad dressing (135 g) vs. PE enriched product. Global warming (GW), Stratospheric ozone depletion (OD), Ionizing radiation (IR), Ozone formation, human health (OF-HH), Fine particulate matter formation (PM), Ozone formation, terrestrial ecosystems (OF-TE), Terrestrial acidification (TA), Freshwater eutrophication (FE), Marine eutrophication (ME), Terrestrial ecotoxicity (TE), Freshwater ecotoxicity (FRE), Marine ecotoxicity (MECO), Human carcinogenic toxicity (HCT), Human non-carcinogenic toxicity (HNCT), Land use (LU), Mineral resource scarcity (MRS), Fossil resource scarcity (FRS), and Water consumption (WC).
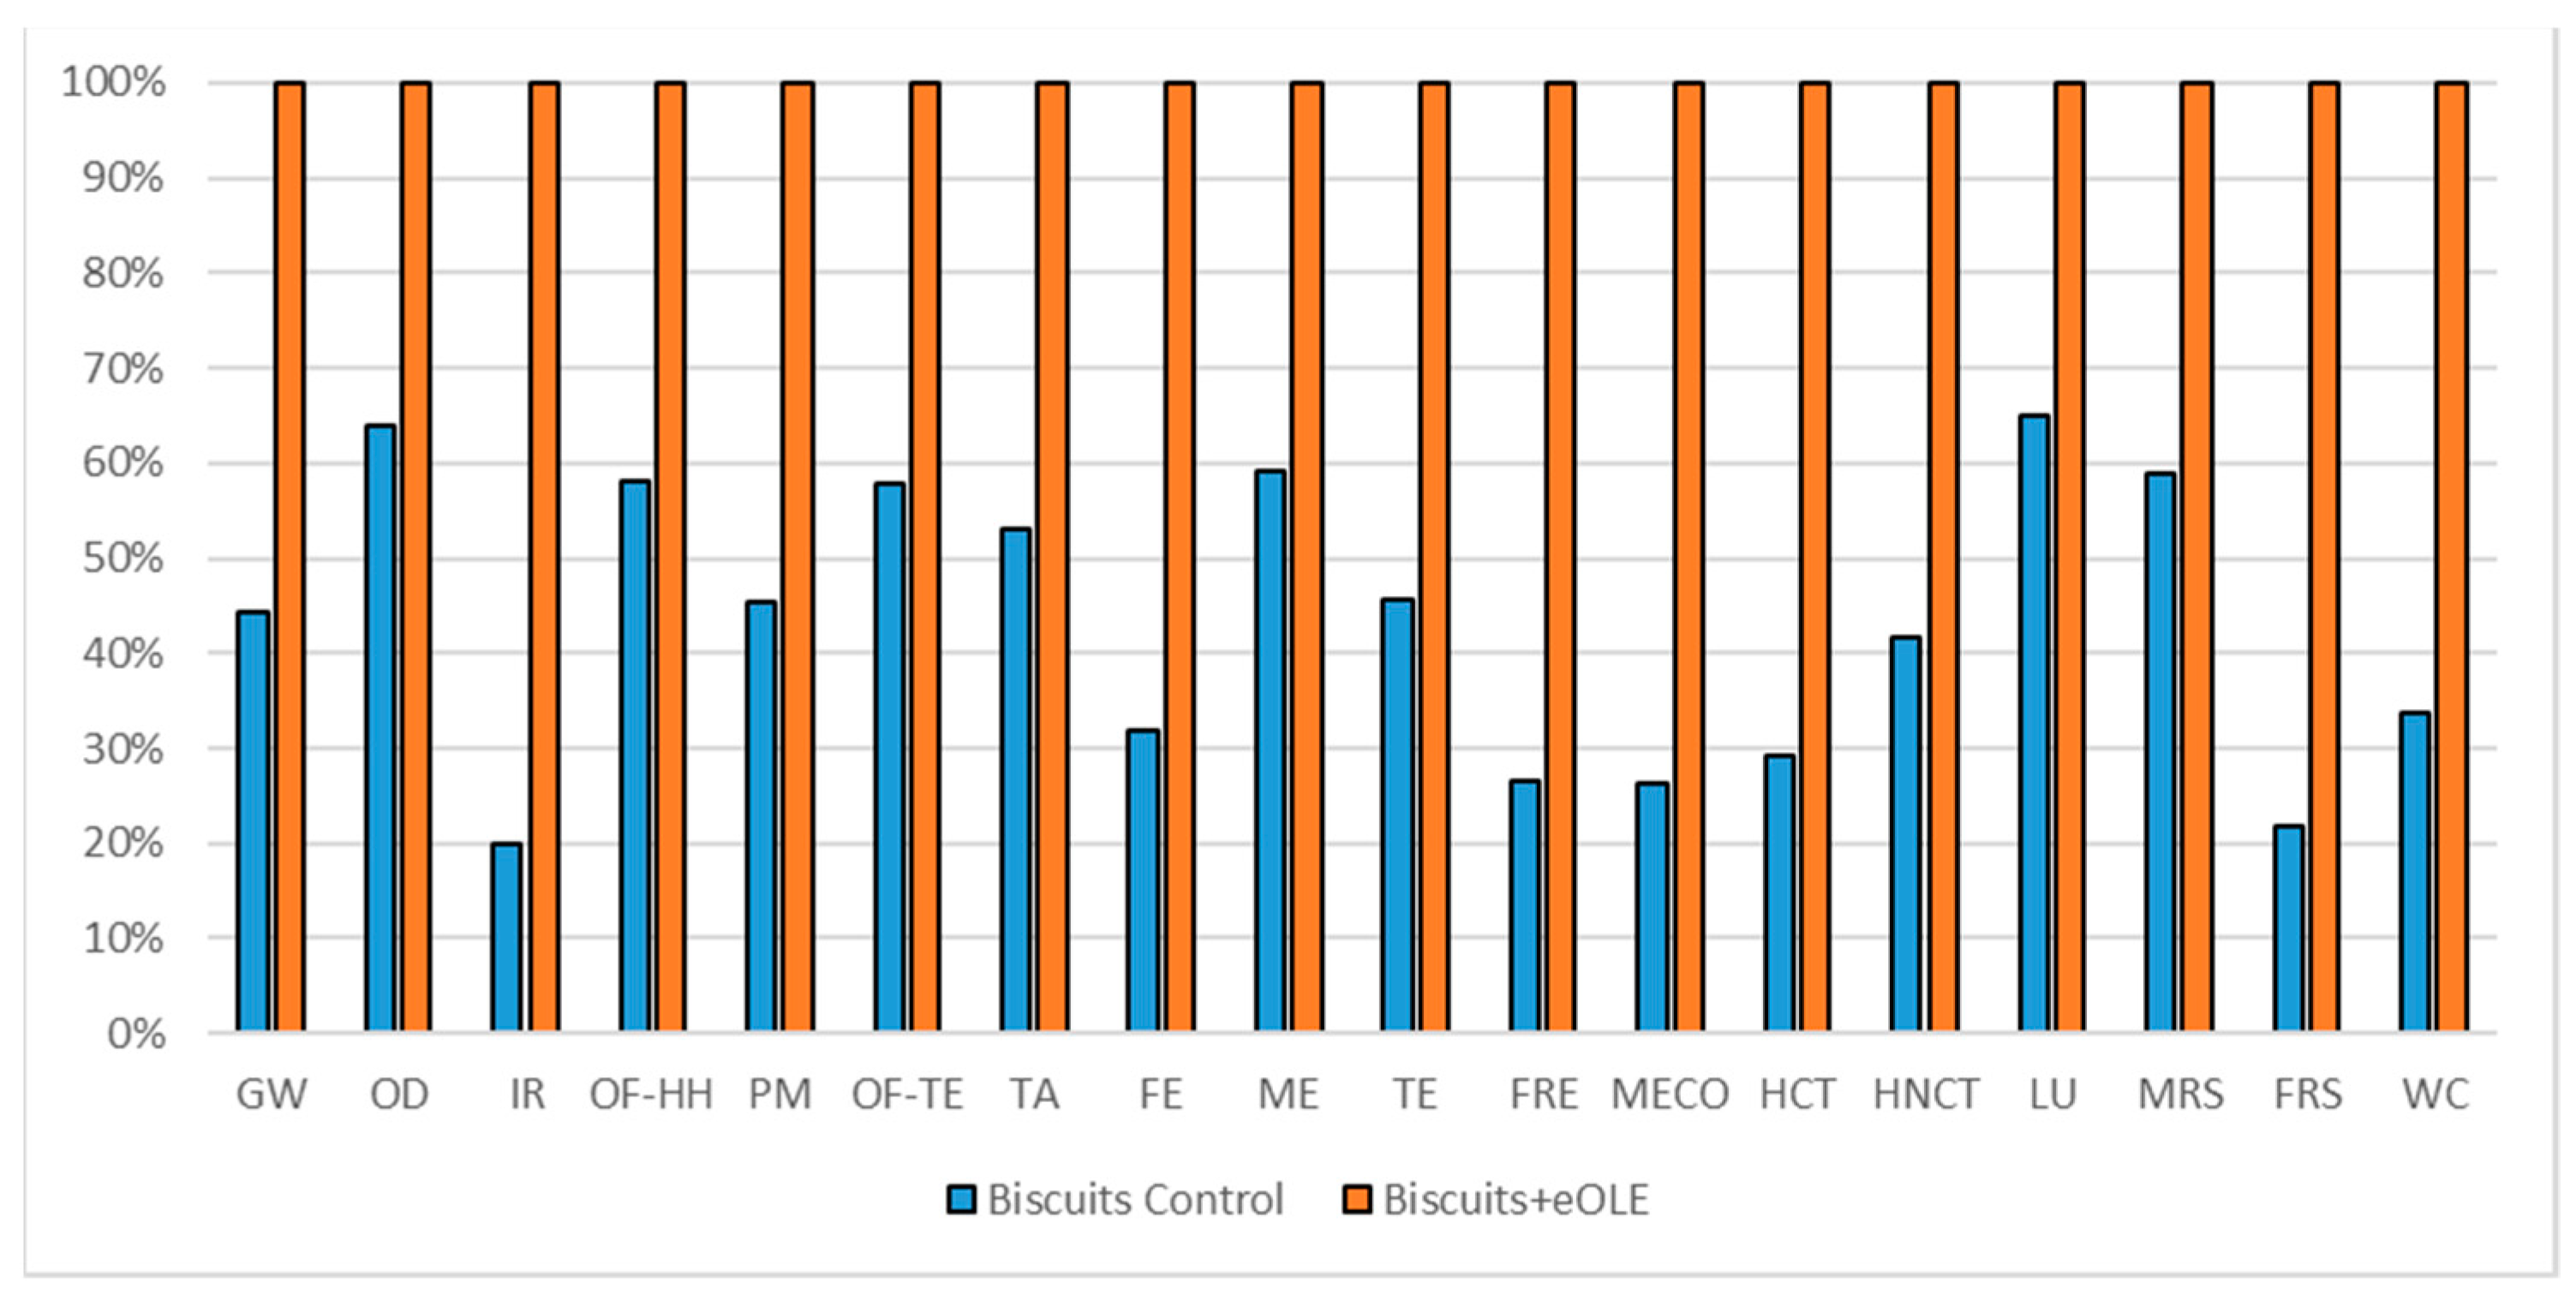
Figure 8.
Environmental impact comparison of biscuits (160 g) vs. PE enriched product. Global warming (GW), Stratospheric ozone depletion (OD), Ionizing radiation (IR), Ozone formation, human health (OF-HH), Fine particulate matter formation (PM), Ozone formation, terrestrial ecosystems (OF-TE), Terrestrial acidification (TA), Freshwater eutrophication (FE), Marine eutrophication (ME), Terrestrial ecotoxicity (TE), Freshwater ecotoxicity (FRE), Marine ecotoxicity (MECO), Human carcinogenic toxicity (HCT), Human non-carcinogenic toxicity (HNCT), Land use (LU), Mineral resource scarcity (MRS), Fossil resource scarcity (FRS), and Water consumption (WC).
Figure 9.
Environmental impact comparison of biscuits vs. PE enriched product normalized to potential shelf-life. Global warming (GW), Stratospheric ozone depletion (OD), Ionizing radiation (IR), Ozone formation, human health (OF-HH), Fine particulate matter formation (PM), Ozone formation, terrestrial ecosystems (OF-TE), Terrestrial acidification (TA), Freshwater eutrophication (FE), Marine eutrophication (ME), Terrestrial ecotoxicity (TE), Freshwater ecotoxicity (FRE), Marine ecotoxicity (MECO), Human carcinogenic toxicity (HCT), Human non-carcinogenic toxicity (HNCT), Land use (LU), Mineral resource scarcity (MRS), Fossil resource scarcity (FRS), and Water consumption (WC).
Figure 10.
Environmental impact comparison of a vegan mayonnaise vs. PE enriched product normalized to TPC. Global warming (GW), Stratospheric ozone depletion (OD), Ionizing radiation (IR), Ozone formation, human health (OF-HH), Fine particulate matter formation (PM), Ozone formation, terrestrial ecosystems (OF-TE), Terrestrial acidification (TA), Freshwater eutrophication (FE), Marine eutrophication (ME), Terrestrial ecotoxicity (TE), Freshwater ecotoxicity (FRE), Marine ecotoxicity (MECO), Human carcinogenic toxicity (HCT), Human non-carcinogenic toxicity (HNCT), Land use (LU), Mineral resource scarcity (MRS), Fossil resource scarcity (FRS), and Water consumption (WC).
Figure 11.
Environmental impact comparison of gluten-free breadsticks (300 g) vs. PE enriched product. Global warming (GW), Stratospheric ozone depletion (OD), Ionizing radiation (IR), Ozone formation, human health (OF-HH), Fine particulate matter formation (PM), Ozone formation, terrestrial ecosystems (OF-TE), Terrestrial acidification (TA), Freshwater eutrophication (FE), Marine eutrophication (ME), Terrestrial ecotoxicity (TE), Freshwater ecotoxicity (FRE), Marine ecotoxicity (MECO), Human carcinogenic toxicity (HCT), Human non-carcinogenic toxicity (HNCT), Land use (LU), Mineral resource scarcity (MRS), Fossil resource scarcity (FRS), and Water consumption (WC).
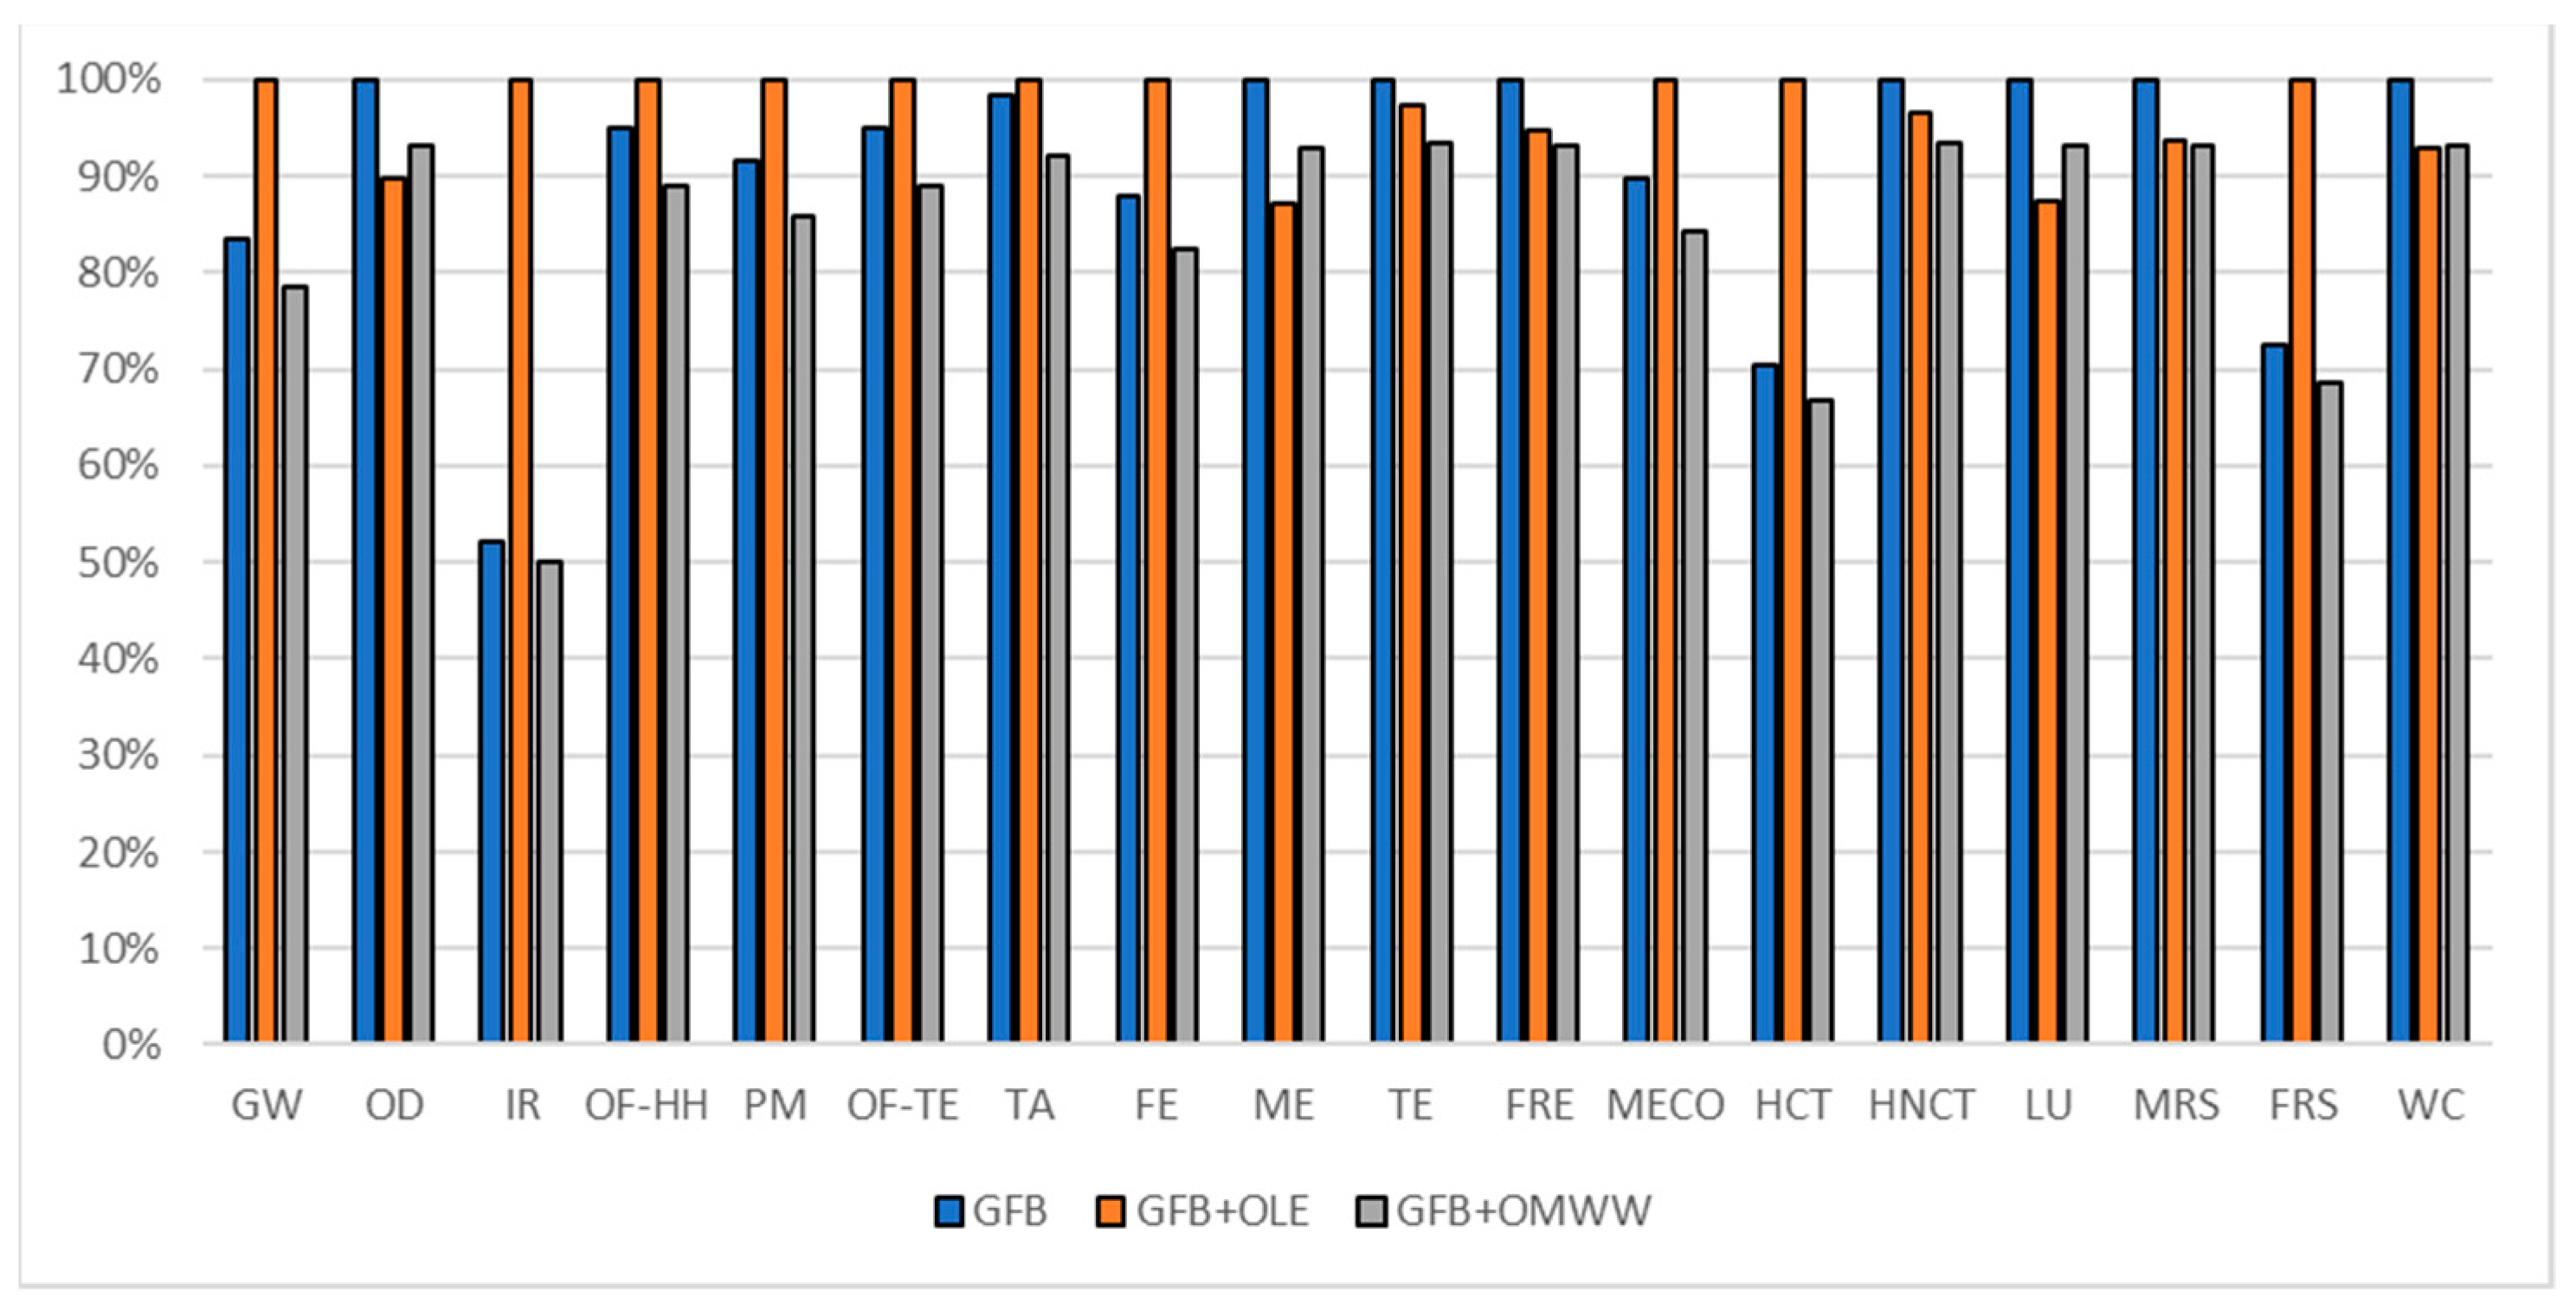
Figure 12.
Environmental impact comparison of gluten-free breadsticks vs. PE-enriched product normalized to potential shelf life. Global warming (GW), Stratospheric ozone depletion (OD), Ionizing radiation (IR), Ozone formation, human health (OF-HH), Fine particulate matter formation (PM), Ozone formation, terrestrial ecosystems (OF-TE), Terrestrial acidification (TA), Freshwater eutrophication (FE), Marine eutrophication (ME), Terrestrial ecotoxicity (TE), Freshwater ecotoxicity (FRE), Marine ecotoxicity (MECO), Human carcinogenic toxicity (HCT), Human non-carcinogenic toxicity (HNCT), Land use (LU), Mineral resource scarcity (MRS), Fossil resource scarcity (FRS), and Water consumption (WC).
Figure 13.
Environmental impact comparison of gluten-free breadsticks vs. PE-enriched product normalized to TPC. Global warming (GW), Stratospheric ozone depletion (OD), Ionizing radiation (IR), Ozone formation, human health (OF-HH), Fine particulate matter formation (PM), Ozone formation, terrestrial ecosystems (OF-TE), Terrestrial acidification (TA), Freshwater eutrophication (FE), Marine eutrophication (ME), Terrestrial ecotoxicity (TE), Freshwater ecotoxicity (FRE), Marine ecotoxicity (MECO), Human carcinogenic toxicity (HCT), Human non-carcinogenic toxicity (HNCT), Land use (LU), Mineral resource scarcity (MRS), Fossil resource scarcity (FRS), and Water consumption (WC).
Table 1.
Technological and nutritional characterization of food preparations.
Table 1.
Technological and nutritional characterization of food preparations.
| Products | Oxidative Stability | Polyphenols Content |
|---|
| | Induction days | mg TPC/g product |
| Mayo control | 0.5 | 0.001 |
| Mayo + OMWW PE | 1 | 0.413 |
| Biscuits control | 4.1 | 1.1 |
| Biscuits + eOLE | 5.5 | 1.6 |
| Salad dressing control | / | 0.001 |
| Salad dressing + eOLE | / | 0.162 |
| GFB control | 84 | 29.39 |
| GFB + OLE | 109 | 34.08 |
| GFB + OMWW PE | 152 | 31.74 |
Table 2.
Economic values and average percentage of mass and economic allocation for the olive oil and by-products of the milling process.
Table 2.
Economic values and average percentage of mass and economic allocation for the olive oil and by-products of the milling process.
| Output | Mass Allocation (%) | Economic Value (€/kg) | Economic Allocation (%) |
|---|
| Olive oil | 18.0 | 3.65 | 98.33 |
| Pomace | 23.0 | 0.015 | 0.52 |
| Wastewater (OMWW) | 50.0 | 0.001 | 0.07 |
| Stone | 8.0 | 0.09 | 1.08 |
| Leaves (OL) and dust | 1.0 | 0.001 | 0.00 |
Table 3.
Input, output data and allocated quantity per FU, related to the OMWW PE process.
Table 3.
Input, output data and allocated quantity per FU, related to the OMWW PE process.
| Input | Description | Quantity | Units | Allocation Factor | Allocated Quantity per FU |
| OMWW | Olive Mill Wastewater | 2 | L | 0.333 | 0.667 |
| HCl | Acid | 1 | mL | 0.333 | 0.333 |
| Hexane | 2 L × 3 times | 6 | L | 0.004 | 0.025 |
| Centrifuge | Power load (0.5 kW); use time (9 min) | 0.075 | kWh | 0.333 | 0.025 |
| Ethyl-acetate | 0.625 mL × 3 times | 1.875 | mL | 0.004 | 0.008 |
| Centrifuge | Power load (0.8 kW); use time (18 min) | 0.24 | kWh | 0.333 | 0.080 |
| Evaporator | Power load (1 kW); use time (2 h) | 2 | kWh | 0.333 | 0.667 |
| Water | | 100 | mL | 0.333 | 33.333 |
| Filter | | 3 | g | 0.333 | 1.000 |
| Waste | Description | Quantity | Units | Allocation Factor | Allocated Quantity per FU |
| Hazardous waste | Hexane | 6 | L | 0.004 | 0.025 |
| Hazardous waste | Ethyl-acetate | 1.875 | mL | 0.004 | 0.008 |
Table 4.
Input, output data, and allocated quantity per FU, related to the OLE process.
Table 4.
Input, output data, and allocated quantity per FU, related to the OLE process.
| Input | Description | Quantity | Units | Allocation Factor | Allocated Quantity per FU |
| Olive leaves | Waste from olive oil production | 400 | g | 0.167 | 66.667 |
| Water | 1 L for the washing activity | 1 | L | 0.167 | 0.167 |
| Oven | Power load (0.530 kW); use time (8 min); Temperature (120 °C); Capacity (400 g) | 0.0707 | kWh | 0.167 | 0.012 |
| Paper | 2–3 pieces | 12.5 | g | 0.167 | 2.083 |
| Mill | Power load (0.175 kW); use time (30 s) | 0.0015 | kWh | 0.667 | 0.001 |
| Water | 6 L for the extraction | 6 | L | 0.667 | 4.002 |
| Ultrasound | Power load (0.200 kW); use time (90 min) | 0.3000 | kWh | 0.667 | 0.200 |
| Filters | 1 filter | 3 | g | 0.667 | 2.001 |
| Freeze dryer | Power load (1.100 kW); use time (8 h) | 8.8 | kWh | 0.667 | 5.870 |
| Waste | Description | Quantity | Units | Allocation Factor | Allocated Quantity per FU |
| Biowaste | Exhausted leaves | 100 | g | 0.667 | 66.700 |
Table 5.
Input, output data, and allocated quantity per FU, related to the eOLE process.
Table 5.
Input, output data, and allocated quantity per FU, related to the eOLE process.
| Input Eole | Description | Quantity | Units | Allocation Factor | Allocated Quantity per FU |
| OLE | Olive Leaf Extract | 4 | g | 3.125 | 12.500 |
| Alginate | Polymer | 0.4 | g | 3.125 | 1.250 |
| Pectin | Polymer | 0.4 | g | 3.125 | 1.250 |
| Water | | 168.92 | mL | 3.125 | 527.875 |
| Calcium citrate | | 1.638 | g | 3.125 | 5.119 |
| Sunflower oil | Oil | 118 | g | 3.125 | 368.750 |
| Span 80 | Emulsifier | 2 | g | 3.125 | 6.250 |
| Stirring plate | Power load (0.4 kW); use time (75 min) | 0.5 | kWh | 3.125 | 1.563 |
| Glacial acetic acid | Acid | 0.5 | g | 3.125 | 1.563 |
| Calcium chloride | Gelling agent | 0.832 | g | 3.125 | 2.600 |
| Tween 20 | Surfactant | 0.75 | g | 3.125 | 2.344 |
| Centrifuge | Power load (0.8 kW); use time (5 min) | 0.07 | kWh | 3.125 | 0.208 |
| Ethanol | | 21.00 | mL | 3.125 | 65.625 |
| Freeze dryer | Power load (1.100 kW); use time (18 min) | 0.33 | kWh | 3.125 | 1.031 |
| Waste | Description | Quantity | Units | Allocation Factor | Allocated Quantity Per FU |
| Hazardous waste | Exhausted oil | 300.5 | mL | 3.125 | 939.063 |
Table 6.
Input, output data, and allocated quantity per FU (350 g), related to the vegan mayonnaise process.
Table 6.
Input, output data, and allocated quantity per FU (350 g), related to the vegan mayonnaise process.
| Product | Input | Description | Quantity | Units | Allocation Factor per 350 g Mayo | Allocated Value per 350 g Mayo |
|---|
| Mayo | | | | | | |
| control | Soy milk | Ingredient | 150 | g | 1 | 150 |
| | Sunflower oil | Ingredient | 199 | g | 1 | 199 |
| | Lemon juice | Ingredient | 1 | g | 1 | 1 |
| | Blending | Power load (1 kW); use time (4 min) | 0.0667 | kWh | 1 | 0.0667 |
| Mayo + OMWW PE | Soy milk | Ingredient | 100 | g | 1 | 100 |
| | OMWW | Ingredient | 50 | g | 1 | 50 |
| | Sunflower oil | Ingredient | 199 | g | 1 | 199 |
| | Lemon juice | Ingredient | 1 | g | 1 | 1 |
| | Blending | Power load (1 kW); use time (4 min) | 0.0667 | kWh | 1 | 0.0667 |
Table 7.
Input, output data, and allocated quantity per FU (135 mL) related to the salad dressing process.
Table 7.
Input, output data, and allocated quantity per FU (135 mL) related to the salad dressing process.
| | Input | Description | Quantity | Units | Allocation Factor per 135 mL Salad Dressing | Allocated Quantity per 135 mL Salad Dressing |
|---|
| Salad dressing control | Water | Ingredient | 99.55 | mL | 1 | 99.55 |
| | Salt | Ingredient | 0.40 | g | 1 | 0.40 |
| | Xanthan Gum | Ingredient | 0.80 | g | 1 | 0.80 |
| | Citric acid | Ingredient | 0.50 | g | 1 | 0.50 |
| | Corn oil | Ingredient | 33.75 | g | 1 | 33.75 |
| | Blending | Power load (0.75 kW); use time (1 min) | 0.0125 | kWh | 1 | 0.0125 |
| Salad dressing + eOLE | Water | Ingredient | 99.25 | mL | 1 | 99.25 |
| | Salt | Ingredient | 0.40 | g | 1 | 0.40 |
| | Xanthan Gum | Ingredient | 0.80 | g | 1 | 0.80 |
| | Citric acid | Ingredient | 0.50 | g | 1 | 0.50 |
| | eOLE | Ingredient | 0.30 | g | 1 | 0.30 |
| | Corn oil | Ingredient | 33.75 | g | 1 | 33.75 |
| | Blending | Power load (0.75 kW); use time (1 min) | 0.0125 | kWh | 1 | 0.0125 |
Table 8.
Input, output data, and allocated quantity per FU (160 g), related to the biscuits process.
Table 8.
Input, output data, and allocated quantity per FU (160 g), related to the biscuits process.
| Product | Input | Description | Quantity | Units | Allocation Factor per 160 g Biscuits | Allocated Quantity per 160 g Biscuits |
|---|
| Biscuits control | Soft wheat flour | Ingredient | 100 | g | 1 | 100 |
| | Water | Ingredient | 17 | g | 1 | 17 |
| | Salt | Ingredient | 1 | g | 1 | 1 |
| | Baking powder | Ingredient | 1 | g | 1 | 1 |
| | Sugar | Ingredient | 50 | g | 1 | 50 |
| | Butter | Ingredient | 30 | g | 1 | 30 |
| | Blending | Power load (0.3 kW); use time (24 min) | 0.12 | kWh | 1 | 0.12 |
| | Chilling | Energy consumption (250 kWh/year); use time (10 min) | 0.0048 | kWh | 0.01 | 4.8 × 10⁻⁵ |
| | Baking | Power load (0.53 kW); use time (20 min) | 0.1767 | | | |
| | kWh | 0.25 | 4.4 × 10⁻² | | | |
| Biscuits + eOLE | Soft wheat flour | Ingredient | 99.45 | g | 1 | 99.45 |
| | eOLE | Ingredient | 0.55 | g | 1 | 0.55 |
| | Water | Ingredient | 17 | g | 1 | 17 |
| | Salt | Ingredient | 1 | g | 1 | 1 |
| | Baking powder | Ingredient | 1 | g | 1 | 1 |
| | Sugar | Ingredient | 50 | g | 1 | 50 |
| | Butter | Ingredient | 30 | g | 1 | 30 |
| | Blending | Power load (0.300 kW); use time (24 min) | 0.12 | kWh | 1 | 0.12 |
| | Chilling | Energy consumption (250 kWh/year); use time (10 min) | 0.005 | kWh | 0.01 | 4.8 × 10⁻⁵ |
| | Baking | Power load (0.530 kW); use time (20 min) | 0.177 | kWh | 0.25 | 4.4 × 10⁻² |
| BiscuitscontrolBiscuits + eOLE | Food waste | Production waste | 15 | g | 1 | 15 |
Table 9.
Input, output data, and allocated quantity per FU (300 g), related to gluten-free breadsticks process.
Table 9.
Input, output data, and allocated quantity per FU (300 g), related to gluten-free breadsticks process.
| Product | Input | Description | Quantity | Units | Allocation Factor per 300 g GFB | Allocated Quantity per 300 g GFB |
| GFB control; GFB + OLE; GFB + OMWW PE | Rice flour | Ingredient | 500 | g | 0.247 | 123.457 |
| | Corn starch | Ingredient | 500 | g | 0.247 | 123.457 |
| | Guar gum | Ingredient | 15 | g | 0.247 | 3.704 |
| | Psyllium fiber | Ingredient | 15 | g | 0.247 | 3.704 |
| | Sugar | Ingredient | 30 | g | 0.247 | 7.407 |
| | Salt | Ingredient | 15 | g | 0.247 | 3.704 |
| | Compressed yeast | Ingredient | 40 | g | 0.247 | 9.877 |
| | Sunflower oil | Ingredient | 100 | g | 0.247 | 24.691 |
| | Water | Ingredient | 550 | mL | 0.247 | 135.802 |
| | Blending | Power load (0.3 kW); use time (15 min) | 0.075 | kWh | 0.247 | 0.019 |
| | Leavening chamber | Power load (1.5 kW); (T 33 °C; RH 90%); use time (60 min) | 1.5 | kWh | 0.012 | 0.019 |
| | Baking | Power load (0.53 kW); use time (35 min) | 0.31 | kWh | 0.062 | 0.019 |
| GFB + OLE | OLE | OLE | 1 | g | 0.247 | 0.247 |
| GFB + OMWW PE | OMWW | OMWW | 1 | g | 0.247 | 0.247 |
| | Waste | Description | Quantity | Units | Allocation Factor per 300 g GFB | Allocated Quantity per 300 g GFB |
| GFB control; GFB + OLE; GFB + OMWW PE | Food waste | Production waste of raw dough | 0.467 | g | 0.247 | 0.115 |
Table 10.
Environmental impacts of PE extractions and encapsulation processes.
Table 10.
Environmental impacts of PE extractions and encapsulation processes.
| Impact Category | Unit | OMWW PE | OLE | eOLE |
|---|
| GW 1 | kg CO2 eq | 4.10 × 10⁻¹ | 2.83 | 7.84 |
| OD 2 | kg CFC11 eq | 3.32 × 10⁻⁷ | 2.34 × 10⁻⁶ | 1.63 × 10⁻⁵ |
| IR 3 | kBq 60Co eq | 4.11 × 10⁻² | 3.17 × 10⁻¹ | 7.73 × 10⁻¹ |
| OF-HH 4 | kg NOx eq | 7.11 × 10⁻⁴ | 4.92 × 10⁻³ | 1.57 × 10⁻² |
| PM 5 | kg PM2.5 eq | 4.52 × 10⁻⁴ | 3.29 × 10⁻³ | 9.97 × 10⁻³ |
| OF-TE 6 | kg NOx eq | 7.40 × 10⁻⁴ | 5.00 × 10⁻³ | 1.60 × 10⁻² |
| TA 7 | kg SO2 eq | 1.38 × 10⁻³ | 1.01 × 10⁻² | 3.29 × 10⁻² |
| FE 8 | kg P eq | 9.98 × 10⁻⁵ | 7.16 × 10⁻⁴ | 2.08 × 10⁻³ |
| ME 9 | kg N eq | 9.38 × 10⁻⁶ | 5.48 × 10⁻⁵ | 4.75 × 10⁻³ |
| TE 10 | kg 1,4-DCB | 4.44 × 10⁻¹ | 2.88 | 11.1 |
| FRE 11 | kg 1,4-DCB | 1.00 × 10⁻² | 6.98 × 10⁻² | 3.43 × 10⁻¹ |
| MECO 12 | kg 1,4-DCB | 1.30 × 10⁻² | 9.05 × 10⁻² | 2.79 × 10⁻¹ |
| HCT 13 | kg 1,4-DCB | 8.38 × 10⁻³ | 6.11 × 10⁻² | 1.71 × 10⁻¹ |
| HNCT 14 | kg 1,4-DCB | 2.02 × 10⁻¹ | 1.43 | 5.98 |
| LU 15 | m2a crop eq | 1.58 × 10⁻² | 1.08 × 10⁻¹ | 3.61 |
| MRS 16 | kg Cu eq | 4.16 × 10⁻⁴ | 2.56 × 10⁻³ | 2.00 × 10⁻² |
| FRS 17 | kg oil eq | 1.29 × 10⁻¹ | 8.37 × 10⁻¹ | 2.25 |
| WC 18 | m3 | 5.80 × 10⁻³ | 4.72 × 10⁻² | 1.20 × 10⁻¹ |
Table 11.
Mean and standard deviation among the impact categories of extraction and encapsulation processes impact on the whole food chain.
Table 11.
Mean and standard deviation among the impact categories of extraction and encapsulation processes impact on the whole food chain.
| Products | Mean | SD |
|---|
| | % | % |
| Mayo + OMWW PE | 30.90 | 20.77 |
| Salad dressing + eOLE | 73.51 | 17.22 |
| Biscuits + eOLE | 56.61 | 14.97 |
| GFB + OLE | 17.72 | 14.29 |
| GFB + OMWW PE | 0.71 | 0.75 |
Table 12.
Strengths, weaknesses, opportunities, and threats related to use of phenolic extract deriving from the olive oil milling process in food chain.
Table 12.
Strengths, weaknesses, opportunities, and threats related to use of phenolic extract deriving from the olive oil milling process in food chain.
| Positive | Internal | Negative |
| Strengths | Weaknesses |
| Reduce waste of olive oil milling process | High environmental impact of extraction/encapsulation processes |
| Transform waste products into a second-life product | Energy-intensive operations to freeze drying operation and encapsulation solvents |
| | Chemicals for extraction |
| Opportunities | Threats |
| Promote circular economy business model | Research efforts in optimizing extraction and encapsulation processes in terms of yield extraction |
| Reduce food waste | |
| Add values to olive oil sector | |
| Design new packaging concept considering the use of bio-compounds to extend shelf-life | |
| External |

 ,
, 


