1. Introduction
1.1. The Cork Oak
The cork oak is a tree that belongs to the
Quercus genus; hence, its name
Quercus suber L. It is a tree with green leaves throughout the year that, for an adult specimen, has an average height of between 10 and 15 m and a diameter between 0.3 and 1 m [
1,
2]
The cork oak is a species associated with the Mediterranean Sea. The climate is dry in summer, with high temperatures and little rainfall, while winters have mild temperatures and abundant rainfall, although they tend to be irregular, alternating periods of great abundance of water with others of drought [
3].
Within the Mediterranean climate zones, the cork oak is more common in those areas with a great oceanic influence that favors a damping of both the effects of drought and temperature. This fact, combined with the great light needs of the cork oak, determine the presence of this arboreal species in very specific areas. Likewise, it is a species that does not proliferate outside the areas and conditions outlined, which makes cork a unique, scarce and valuable product [
4]. In these forests it can be found both as a min tree species and together with other Mediterranean trees [
5].
The bark of the cork oak is very thick, grayish in color, and usually cracked. During the “saca” or extraction of the cork, the trunk without the bark presents a reddish-yellowish color [
6,
7]. The main use of the cork oak is the product known as cork. Cork is the bark of the cork oak and has peculiar characteristics, among which are its lightness, flexibility, high coefficient of friction, impermeability, which, provided that it is natural, recyclable, and renewable, makes it a very interesting material for various applications [
7,
8].
1.2. The Cork Manufacture
Modern cork manufacture dates back to the mid-18th century. Initially, and until the end of the 19th century, it was a business destined to the wine sector and more specifically to the manufacture of cork stoppers for still and sparkling wines.
The stoppers manufactured were in any case natural stoppers made from cork sheet. At the beginning of the 20th century, and faced with the impossibility of meeting the demands for stoppers for closing wines and sparkling wines, new products appeared, among which the agglomerated cork stopper stands out. The main advantage of these stoppers was the possibility of manufacturing them from cork sheets that, due to their thickness and geometry, could not be used to obtain natural stoppers, which allowed increasing the number of stoppers available on the market.
The effect of the appearance of the agglomerate had two immediate consequences in the productive manufacturing structures. In the first place, the great cork transforming powers during the 19th century, Spain and to a lesser extent Portugal, reduced their weight with the entry of new competitors. This led to a reindustrialization of the cork sector in Spain and to a lesser extent in Portugal [
9,
10]. On the other hand, the demand for cork for non-oenological uses, although it primarily used thin cork (also known as branch cork), it also diverted part of the cork traditionally used for the manufacture of natural stoppers, reducing the availability of this type of stoppers [
11]. Currently, Spain and Portugal account for more than 80% of the cork extracted (Portugal exports 62.4% of all the cork in the world, followed by Spain with 18.5% according to 2017 data) and more than 60% of the world’s cork oak area available.
Although in the last 4 years the vineyard area in the world has experienced a decrease, the wine area in 2018 stabilized at around 7.4 million hectares and the volume of exports from all countries reached a volume of 108.0 M hL and a value of EUR 31 300 M. Of these, bottled wines accounted for 53% of the total international wine trade by volume, although these bottled wines represent 70% of all exported wines in terms of total economic value [
11].
Based on the foregoing, it can be deduced how the market is being segmented into wines of increasing quality and usually associated with careful and/or unique aging, while the weight of lower added value wines, usually associated with the bulk sales, decreases.
1.3. The Natural Stopper and the Two-Piece Natural Stopper
Based on the data presented, it is evident that, although the natural stopper is a magnificent closure for the production of aging wines and singular wines, only those stoppers of high quality and usually associated with wines of medium and high categories are accepted by the current market.
There are serious limitations regarding the total annual cork production and its recurrence that, together with the development of new substitute products for both cork (agglomerate, technical stopper, microgranulates, etc.) and other materials (polymeric closures, screw cap, etc.) has made many products migrate to this type of closures.
In any case, and in the face of a growing market for quality and bottled wines, the demand for high-end stoppers is greater, although the supply cannot be increased.
Nor would an adequate forestry policy allow a substantial increase in the amount of cork available in the medium term due to the long maturation period of the cork oak forest before producing its first extraction of cork useful for the wine sector.
Under these circumstances, the opportunity arises to manufacture two-piece stoppers from cork sheets that are less thick and which cannot be used to make one-piece stoppers.
A two-piece stopper is a stopper made up of two semi-cylindrical halves glued together in the middle.
It maintains the main characteristics of the natural one-piece stopper, at a slightly lower cost and with some additional advantages:
Greater use of raw materials in the production of high added value caps.
Less expensive raw materials and the absence of supply problems when competing for their acquisition with other products with lower added value.
Greater availability of raw materials in the market by competing only with low value-added processes (cork rolling and cork crushing to agglomerate/microgranulate).
Branch cork, since it is far from the traditional sources of cork contamination (it is far from humidity, the main cause of the appearance of 2,4,6-Trichloroanisole—TCA—main cause of olfactory defects in wine associated with the use of cork stoppers), which implies lower levels of contamination than conventional cork [
12].
Density and mechanical capacities of the stoppers manufactured with this process, is much higher than those manufactured by conventional processes (“thin” cork has the same number of cell walls for years of growth, but since its thickness is much smaller, the number of cell walls per linear cm is much higher).
When working with base plates of less thickness (22% of the thickness required for the perforation of a conventional stopper), it is much easier to treat said plates in depth using heat treatments and minimize the appearance of TCA.
However, since the manufacturing process is different from that used to produce 1-piece stoppers, the manufacturing impact of this type of two-piece stoppers will also be substantially different.
1.4. Research Context
There exist Life Cycle Assessments associated with the stopper manufacturing phases [
13,
14,
15], which carry out an exhaustive analysis in order to assess the environmental impacts derived from the production of natural cork stoppers in Portugal, in addition to identifying the stages and processes to suggest improvement actions and alternative scenarios, as well as LCA environmental impact analysis for the production of natural cork stoppers [
13,
16], granules [
17], or for champagne bottles [
18]. However, the impact of this (two-piece) type of manufacturing process has not been analyzed, which, as it has been indicated, would allow the market to supply high quality stoppers with excellent properties without the limitations associated with the current availability of cork.
In order to complement the information available regarding the Life Cycle Analysis of two-piece cork stoppers, an environmental study is carried out for the manufacture of two-piece natural cork stoppers in the most common dimensions demanded by the market and independently analyzing the different production methods that exist today: drilling and turning.
All the processes will be analyzed from the reception of the raw cork sheet to the achievement of the finished and personalized cork stoppers, ready to be used in the winery to close the wines.
To obtain the primary data, 10 batches of stoppers were measured on the manufacturing process for each type of cap, analyzing diameter, and length.
In the case of caps of the same diameter, the analysis of the initial phases up to the initial cutting of the plate has been carried out jointly.
1.5. Justification and Object of the Research
Based on the above, it is evident that there is a growing demand for cork stoppers for aging wines at the same time that the production of quality natural stoppers does not grow in quantity and even decreases with the use of large volumes of cork for manufacturing microgranulated or agglomerated stoppers.
The increase in the availability of raw cork results, as explained above, in a very long process that involves silvicolous work for several decades.
On the other hand, a thick cork sheet is necessary to be able to produce cork stoppers, those with insufficient thickness being used for the production of agglomerated or microgranulated stoppers, for the production of washers or for other productive sectors.
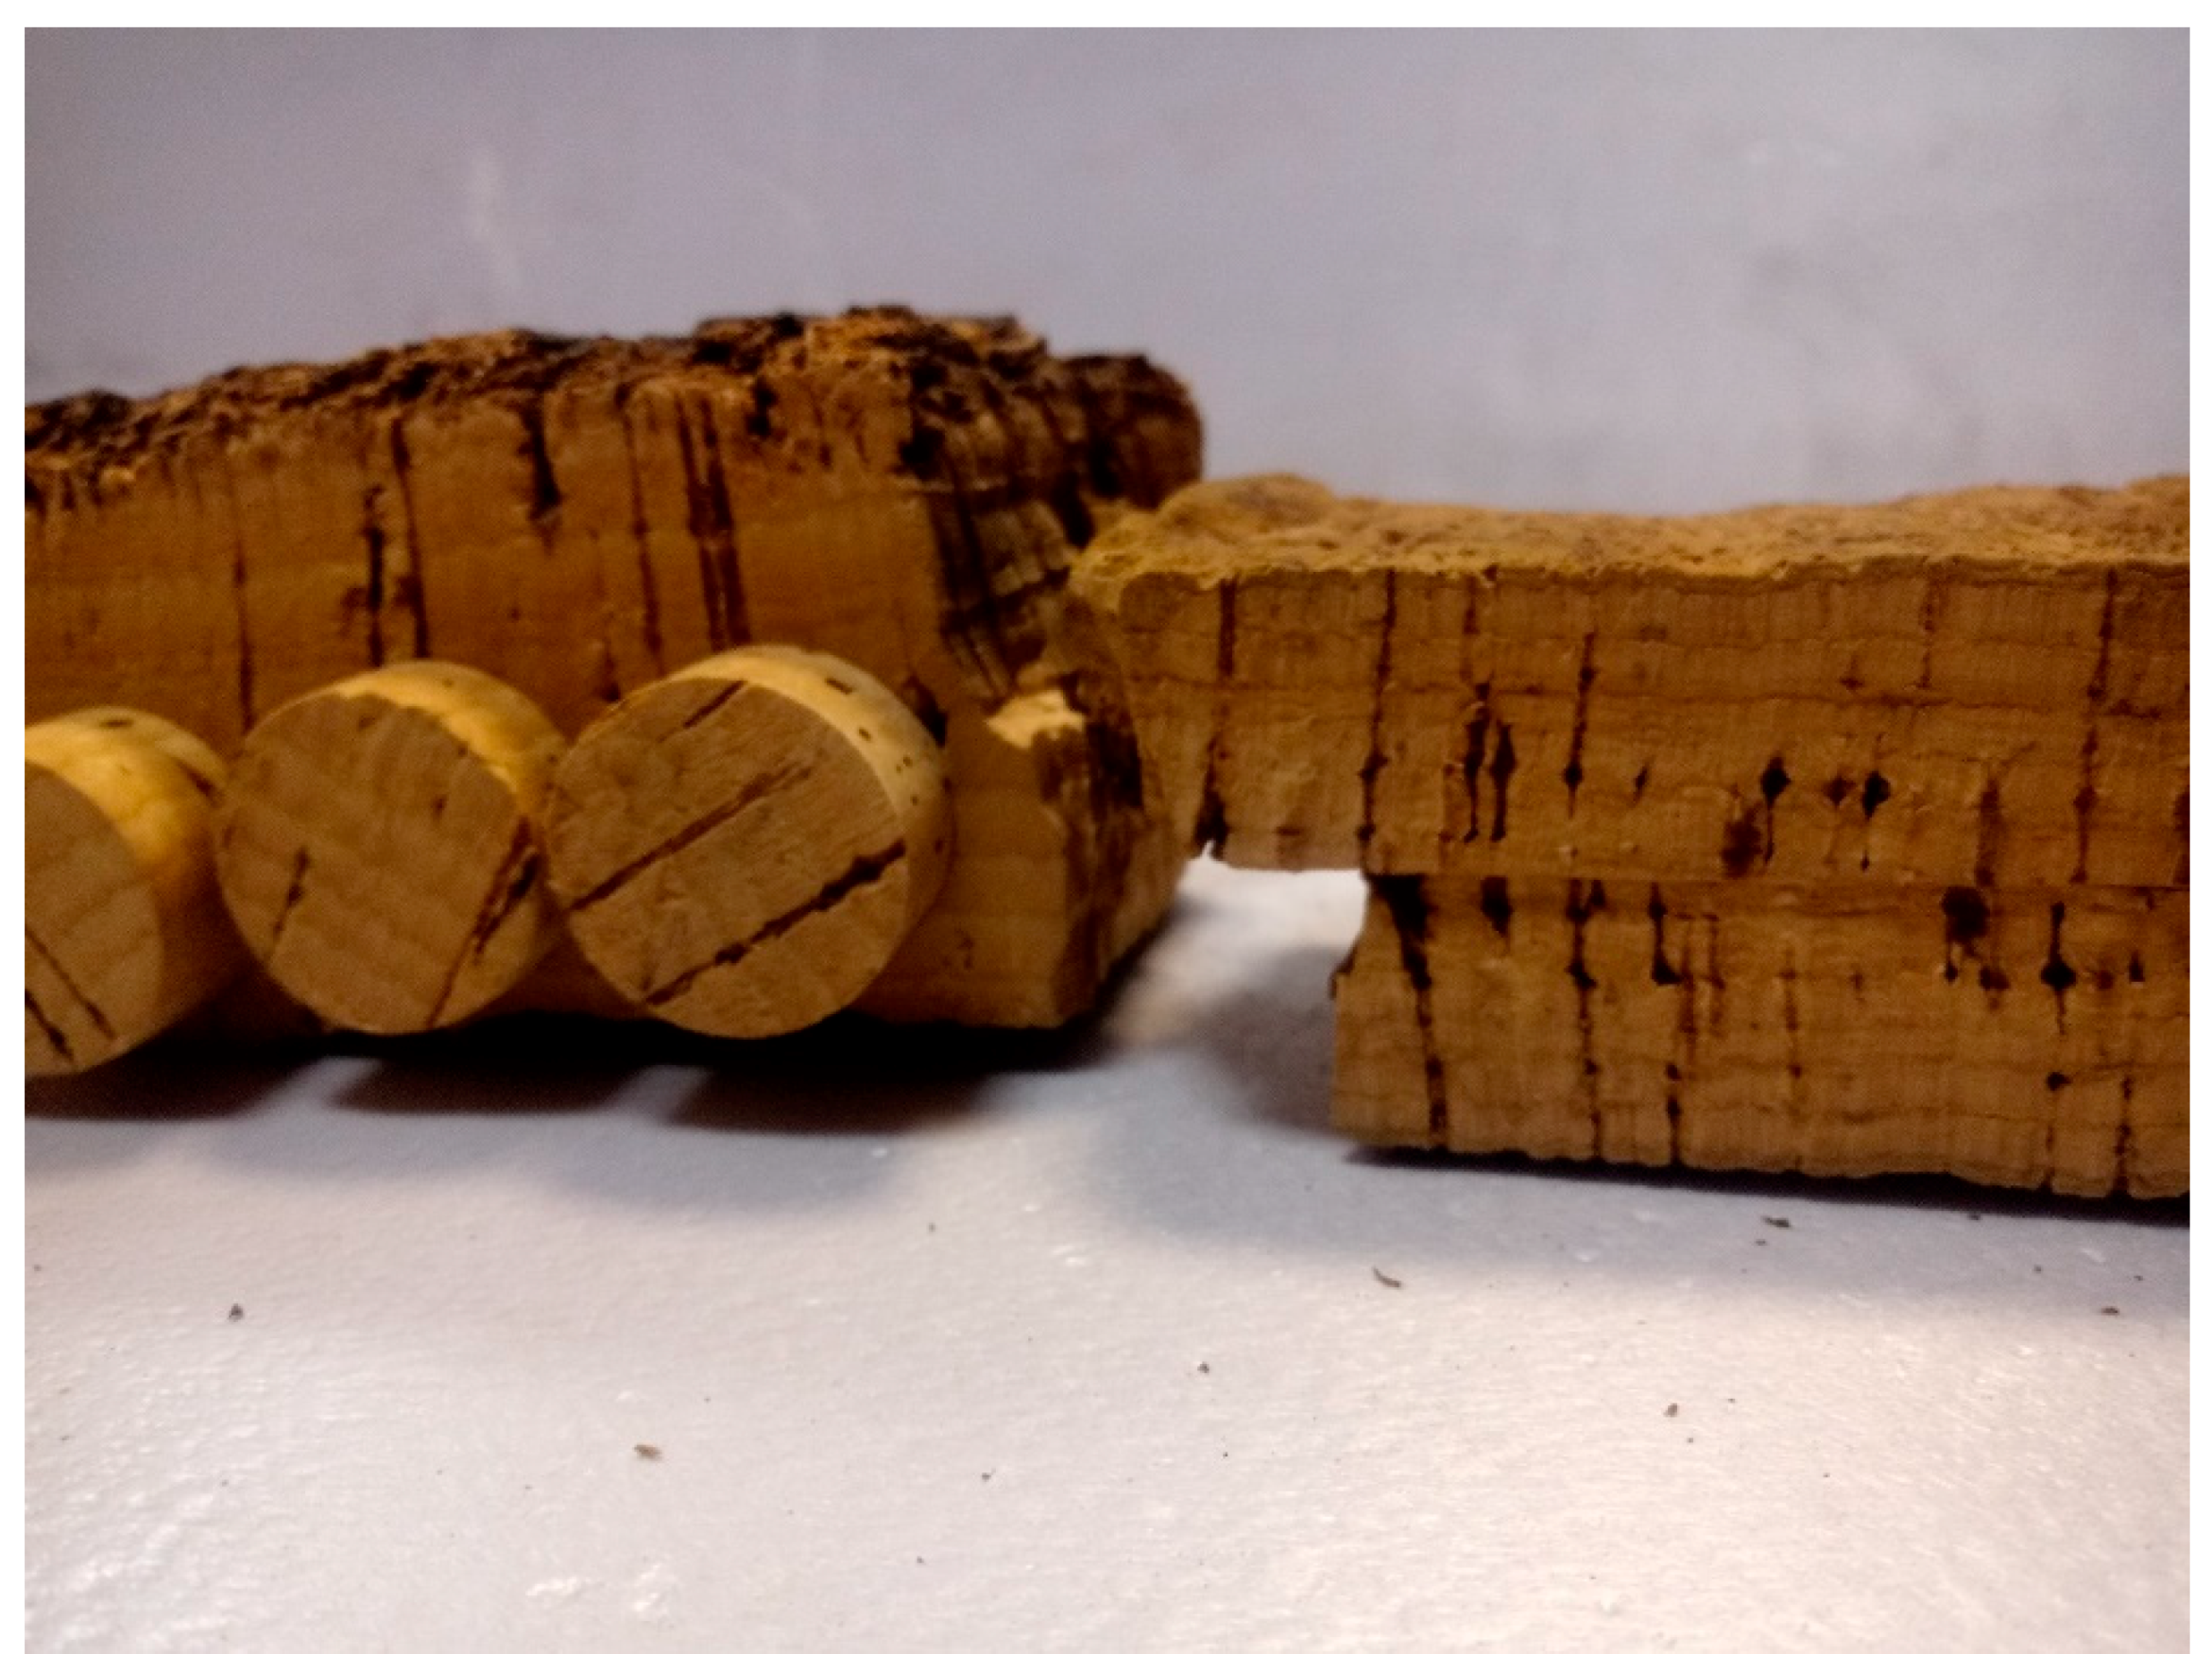
Based on the foregoing, the two-piece stopper is an acceptable alternative given that it makes it possible to take advantage of the cork with less thickness and produce stoppers that are very similar to the one-piece stopper maintaining a large part of its added value. (
Figure 1).
However, the production process is different and includes additional phases, so, consequently, its environmental impact will also be different, being the object of this study to determine the comparative impact of the manufacture of two-piece stoppers for different diameters and lengths, and production system.
2. Materials and Methods
2.1. Objectives and Scope
In this article, a gate to gate analysis has been carried out for 2 different geometries 24 and 26 mm diameter and 44 mm length and for 2 different production processes, turning process and drilling (perforating) process, considering all the production processes.
For each of these production processes, primary data has been obtained for each of the processes, measuring directly on each of the workstations, the consumption of materials and water, the working times, as well as the waste produced, and their destinations and use.
Real measurements have been taken for each of the processes, thus obtaining primary data on material consumption, working hours, electricity and water consumption, as well as all the other data mentioned in the document.
There are two different objectives throughout this research:
- -
to identify differences between different processes and geometries.
- -
to identify the critical activities of the production process.
In this way, this study will allow the detection of the critical stages of the production process and the identification of the evolution of the impact of the activity throughout the production activity.
The production process analysis required the use of Simapro 8.3 software and the CML-IA baseline V3.04/EU25 calculation methodology.
For the analysis of the production process, the Simapro 8.3 software and the CML-IA baseline V3.04/EU25 calculation methodology have been used. The following impact categories have been selected:
Abiotic Deplation (AD);
Global Warming-GWP100 (GW);
Ozone layer depletion (OLD);
Human toxicity (HT);
Fresh water aquatic ecotoxicity (FWAE);
Marine aquatic ecotoxicity (MAE);
Terrestrial ecotoxicity (TE);
Photochemical oxidation (PO);
Acidification (AC);
Eutrophication (EU).
2.2. Functional Unit
After the analysis carried out, a kg of fully processed and marked 2-piece stoppers has been defined as the functional unit for the present study, including the post-treatment and packaging processes.
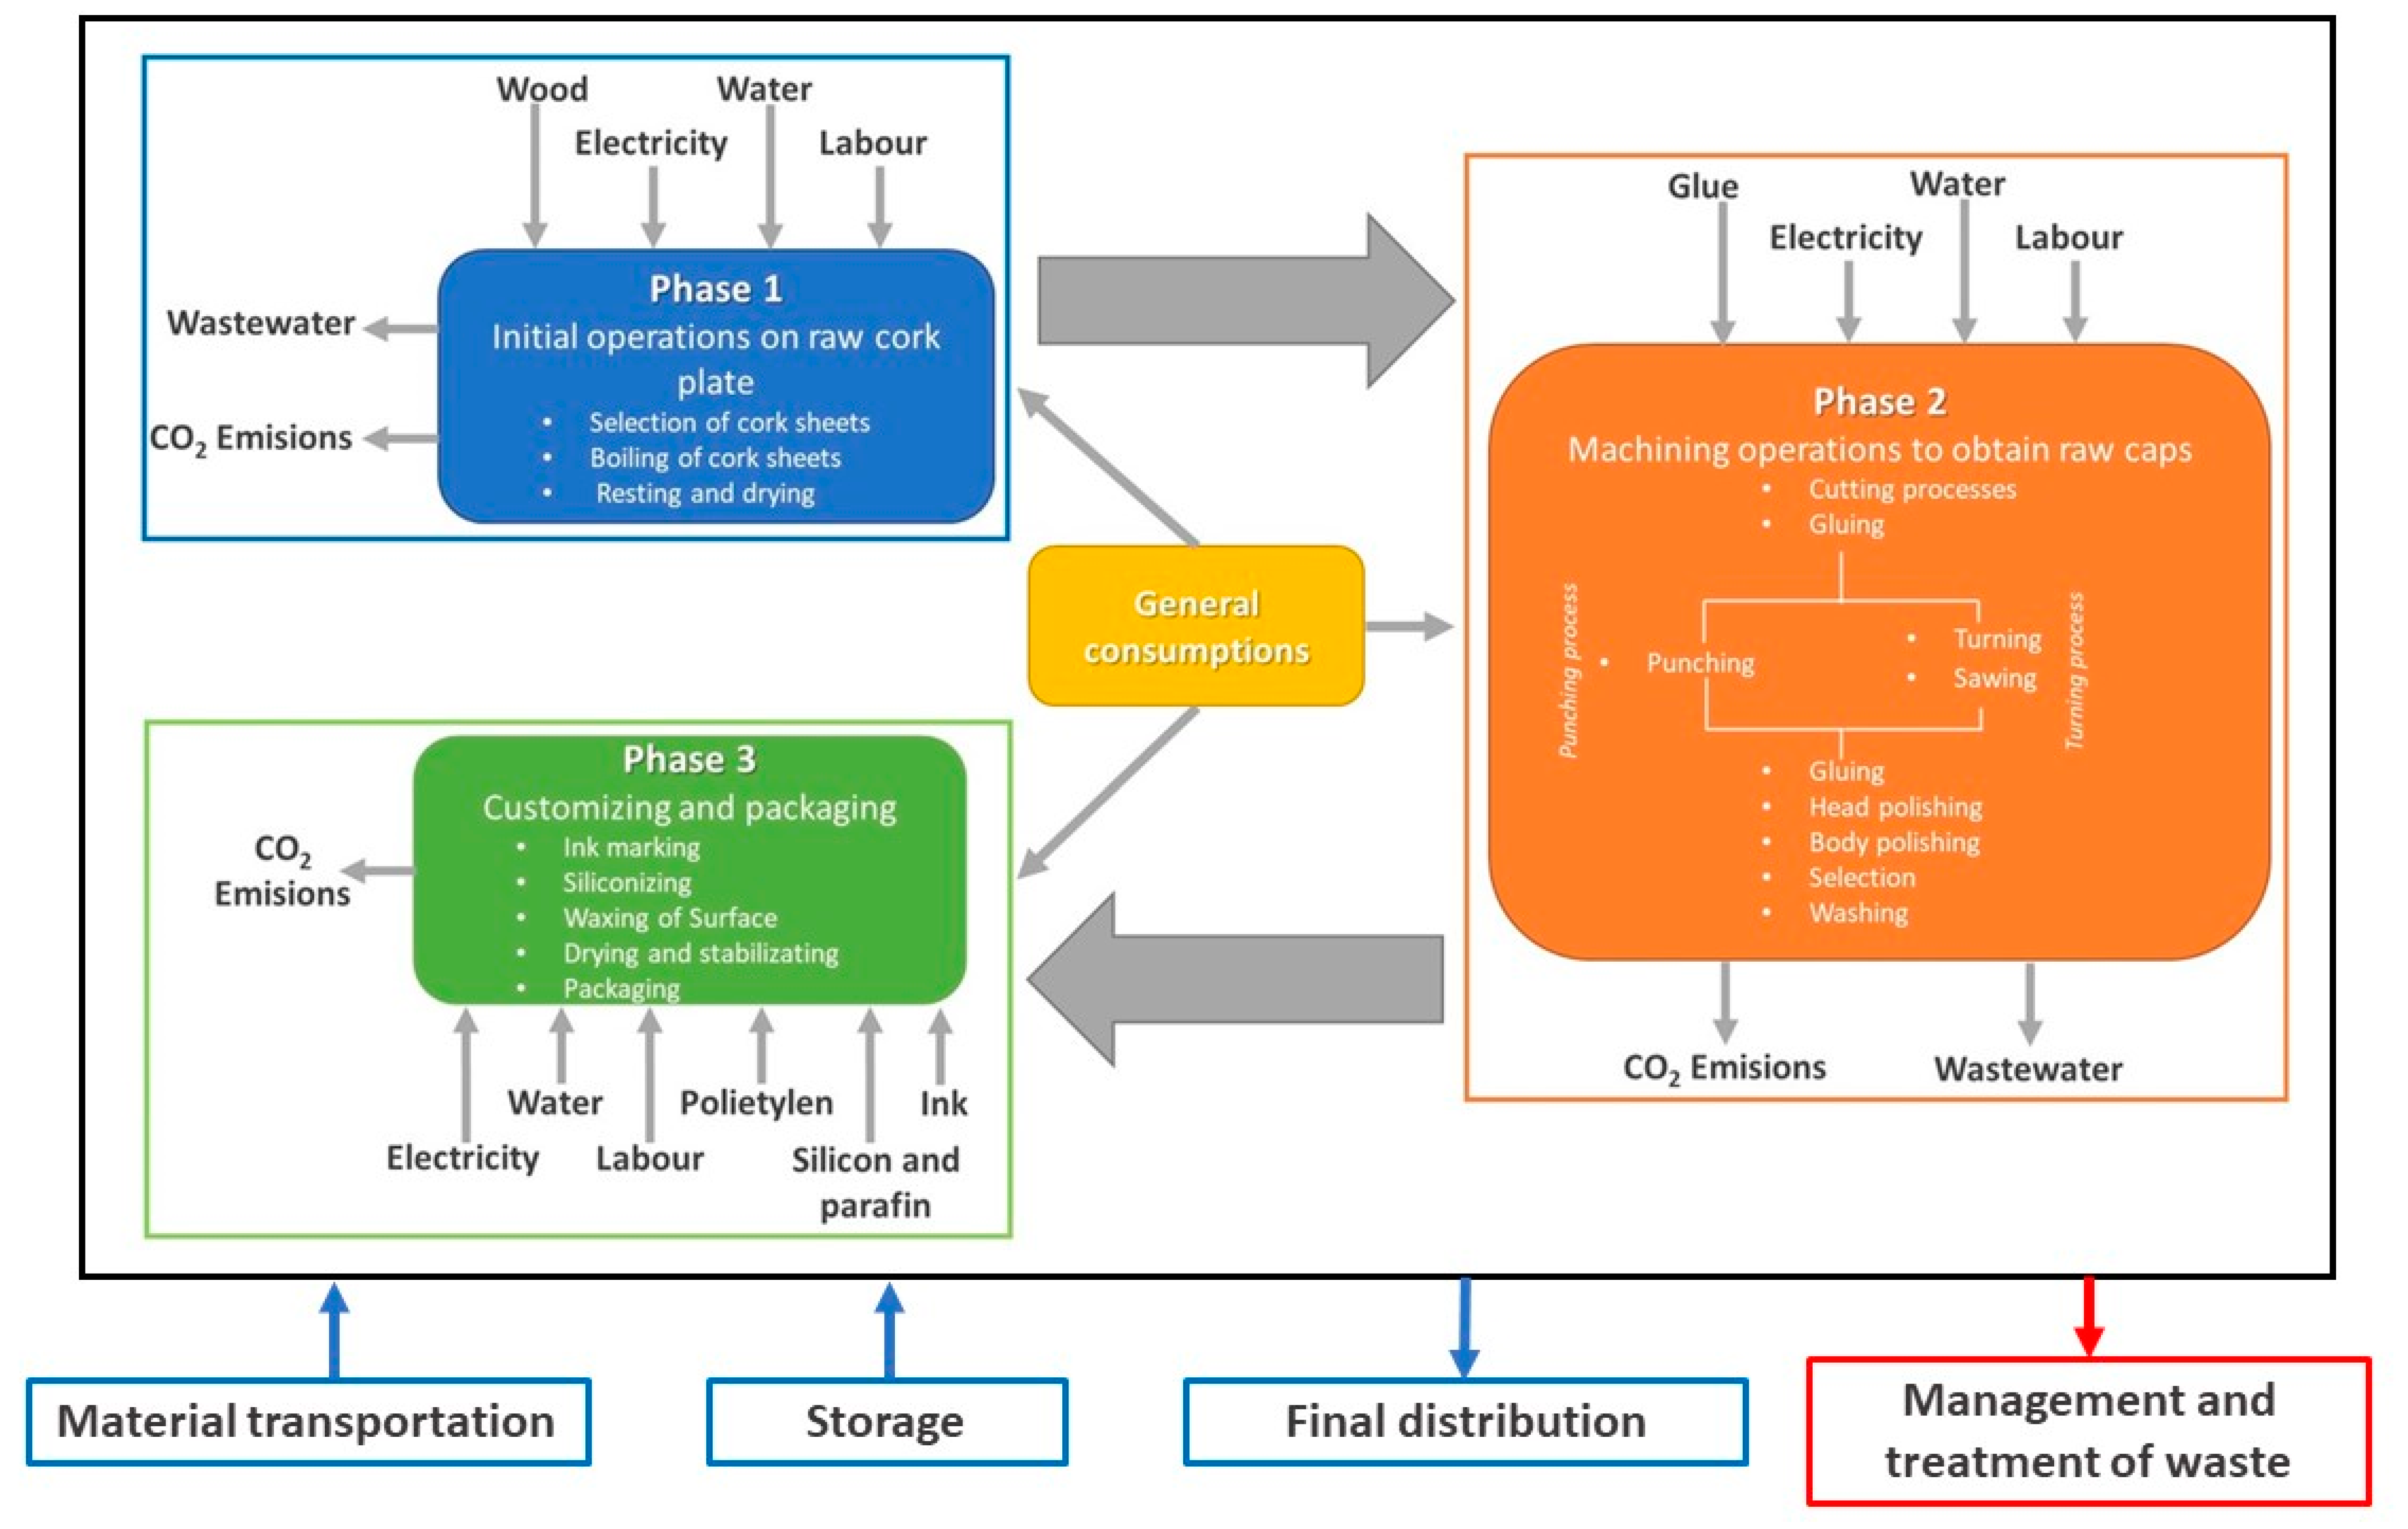
2.3. System Limits
The production processes have been divided into three main blocks:
initial operations to be carried out on raw cork sheet;
machining operations to obtain raw stoppers;
post-treatment and customization and packaging operations.
The limits of the system have been defined so that they include all the activities and processes necessary for the manufacture of finished stoppers and consequently to allow obtaining the functional unit. This includes all the processes necessary for the transformation of unsorted raw plates into packaged finished stoppers (see
Figure 2).
Based on the above, the following activities have been considered within the limits of the system:
Electricity consumption of all equipment and machines used in the production process.
Labor and associated emissions.
Consumption of materials throughout the production process.
Consumption of other resources throughout the production process.
Complete packaging of the functional unit.
Recovery of by-products and cork waste for other applications with economic return.
It is specified that the following activities are specifically excluded from the production process:
The transport of raw materials, whatever their origin, to the production plant.
Installation and dismantling of production plant.
Maintenance of machinery and process facilities.
Management and treatment of waste produced in the process.
Storage and transportation of finished product to customer facilities.
2.4. Assumptions
The following aspects will be taken into account with respect to the analyzed process:
Lot characteristics: Raw cork platform. Average load 365 kg/platform.
Number of batches studied: for each process analyzed and each dimension and diameter, 10 batches were considered, each consisting of a raw cork platform.
Cork density: the average density of the worked cork has been 191.37 kg/m3,
Volume of caps: 1.99051E-05 m3/stopper for diameter 24 mm and length 44 mm. and 2.33609E-05 m3/stopper for diameter 26 mm and length 44 mm.
Production staff: eight-hour production shift per day and five working days per week.
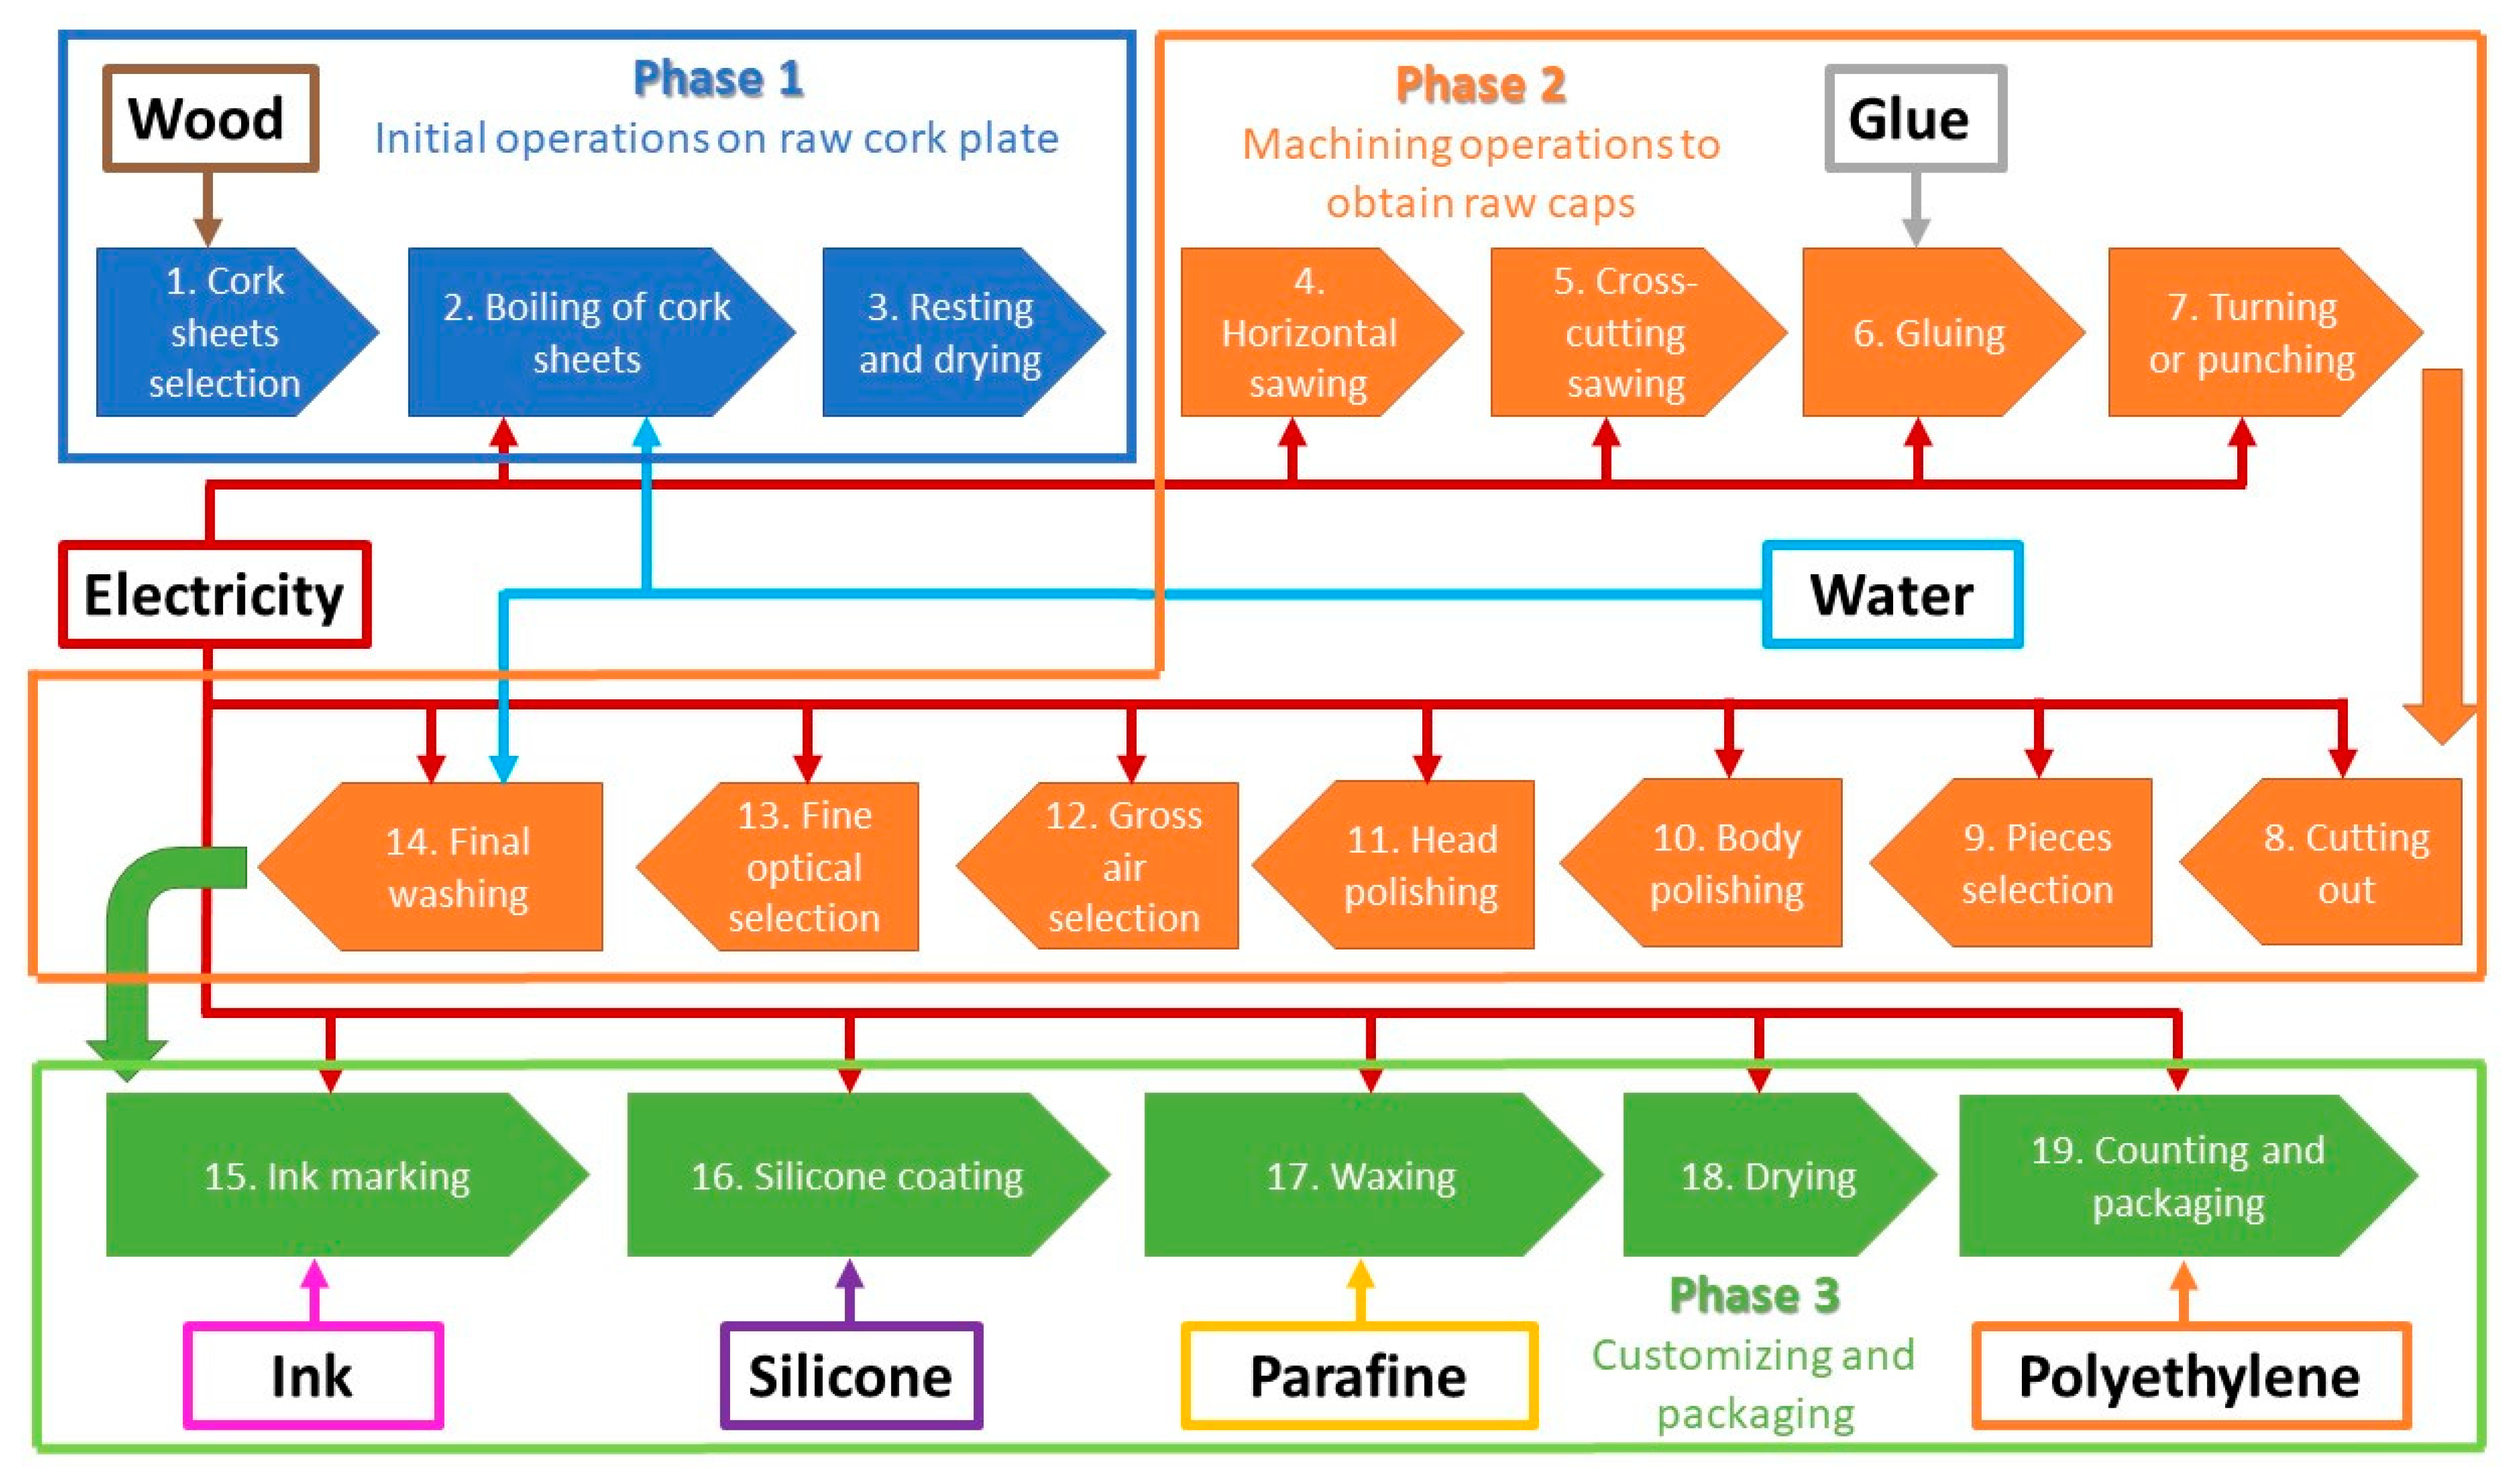
2.5. Inventory
After a detailed analysis of the production process (
Figure 3), it has been segmented into three main blocks of processes:
initial operations to be carried out on raw cork sheet;
machining operations to obtain raw caps;
post-treatment and customization and packaging operations.
Next,
Table 1,
Table 2,
Table 3 and
Table 4 show the summary of the inventory for each of the phases and each of the types of stoppers analyzed.
The consumption in each phase has been considered for a process input of 1000 kg of raw cork. The difference between the entrance of raw cork and the consumptions of each phase will correspond to the net use destined to the manufacture of stoppers. The negative values in phase 3 correspond to the reclassification of stoppers and material initially discarded and that later is reprocessed.
2.5.1. Phase 1: Initial Operations to Be Carried Out on Raw Cork Sheet
Selection of cork sheets: The raw sheets sent after the cork extraction process must be selected. Those plates that present contamination that could significantly affect the stoppers (green, pitted, earth, rot, yellow stain, etc.) will be eliminated.
Those plates that do not meet the appropriate dimensional criteria for the planned production process are also segregated.
Boiling of cork sheets: Selected raw sheets undergo a hot water boiling process with or without the addition of phenolic additives.
Additive: Sometimes they also receive a steam treatment in order to improve their organoleptic conditions.
Through this process it is possible to sanitize the plate minimizing the subsequent appearance of problems and transfers of odors and flavors while achieving a significant improvement in the mechanical properties of the treated plates by homogenizing the presence of water in the microstructure of the cork and with it its mechanical behavior. By hydrating the iron, an increase of close to 20% in its volume is achieved (once the excess supply water has been eliminated), substantially increasing its elasticity and softness.
Resting and drying: Once the plates have been cooked, they must be left to rest in order to eliminate excess moisture until reaching approximately 14% and to stabilize their structure. Although this process has a minimum duration of 15 days, depending on the characteristics of the cork and its specific state, it can take much longer, sometimes reaching several months.
Drying and resting will be carried out under cover but in an open pavilion that allows the air circulation.
Artificial drying processes are not recommended for treating cork.
2.5.2. Phase 2: Machining Operations to Obtain Raw Caps
In this phase, the raw cork sheets are machined to obtain cylindrical stoppers with the required dimensions.
There are two main and different manufacturing processes that have been analyzed throughout this paper:
In the case of the manufacture of perforated stoppers, the cross-cutting of cork sheets is initially carried out.
After that, the “belly” or inner surface of the cork oak bark will be removed, thus achieving a flat and polished surface, suitable for gluing.
Once this cut has been made, two pieces will be glued, keeping them in a press with pressure and temperature for 24 h.
After finishing the gluing process, the glued strips are subjected to a drilling process and subsequent operations (parting, head polishing, body polishing, selection, etc.) in a similar way to the process carried out in the manufacturing process of a 1-piece stopper.
In the case of turned plugs, the main difference is that, after obtaining strips from the raw plate, two cuts are made to each strip, eliminating the “belly” but also the “back” (outer part of the bark of the cork oak) from cork.
After that, the strips obtained are glued by means of a press with pressure and temperature input and, after 24 h of stabilization of the glue, the glued strips are extracted from the press and turned into bars.
The bars are cut into plugs using a multiple cutter, after which cylindrical plugs are obtained that are subjected to the rest of the usual processes mentioned above (head polishing, body polishing, selection, etc.).
2.5.3. Phase 3: Post-Treatment and Customization and Packaging Operations
In this last block, raw stoppers with the desired size are started and they are subjected to the processes aimed at their organoleptic and aesthetic conditioning as well as their personalization.
Ink marking: Although it is possible to mark the caps with fire or ink, given that the market is increasingly inclined towards ink marking of caps, this process has been considered. Through a continuous rotary marker, the stoppers receive the desired impression on the body. The decoration of the heads is not usual since they will be in contact with the wine.
Siliconizing: In this phase, a liquid silicone film will be applied to the surface of the stopper, improving its tightness and ensuring that the stopper does not deteriorate over the years in contact with the wine.
This process is carried out in a perforated rotary drum with temperature control.
Waxing of surface: The stoppers receive a layer of paraffin in order to ensure that the removal of the stopper is adequate and does not involve excessive effort. This process is carried out in a rotating drum with temperature control.
Drying and stabilizing: once the silicone and waxing processes are finished, the caps are dried and stabilized to avoid possible biological contamination.
Packaging: The finished caps are packed in Polyethylene bags with an oxidizing gas (SO2) in order to avoid eventual contamination of the caps until they are used.
3. Results
Throughout this work, a LCA has been carried out in order to identify the main environmental impacts associated with the manufacture of two-piece natural cork stoppers from thin sheet cork.
For this, a gate-to-gate approach has been considered, thus analyzing all the environmental impacts of the production process for stoppers of 24 and 26 mm diameter and 44 mm lengths and through drilling and turning technologies for each of the cases.
To carry out the mentioned LCA, SimaPro 8.3 software was used and the CML-IA baseline V3.04/EU25 methodology was applied to calculate the environmental impact.
For the present case, the proposed functional unit has been 1 kg of fully processed and marked two-piece stoppers, including post-treatment processes and packaging.
The closure manufacturing activities have been divided into three different phases, for which all the impact categories have been determined.
To facilitate the understanding of the results obtained, the global impact of the product is first shown, and subsequently, for each of the proposed plug manufacturing geometries and methodologies, the impacts for each of the phases analyzed are presented.
3.1. Global Analysis of the Environmental Impact
The results obtained for each of the impact categories studied and associated with the different geometries and productive methodologies proposed can be seen in
Table 5.
A detailed analysis of these data drives to affirm that the manufacturing processes of stoppers by turning generate, for all categories, greater impacts than the traditional turning system.
On the other hand, the geometries of stoppers with a diameter of 26 generate slightly lower impacts than those produced by the manufacture of stoppers with a diameter of 24 mm. However, this effect is much lighter than that associated with the different cap manufacturing methodologies.
3.2. Analysis of the Impacts Generated in Stage 1 for Each of the Geometries Studied
Stage 1 is composed of three processes: Cork sheets selection, Boiling of cork sheets, and Resting and Drying.
Table 6 shows the impacts generated by these activities for each of the stopper geometries under study.
Based on the previous data, it is concluded that, since the process so far is similar and the same raw plates are processed, the results obtained at this stage are very similar, yielding very similar results and only differentiated by the suitability of each piece of cork for the process and the geometries chosen.
Subsequently, once the selection of plates based on the geometry as well as their machining begins, those values will change substantially.
3.3. Analysis of the Impacts Generated in Stage 2 for Each of the Geometries Studied
Stage 2 in the case of turned stoppers consists of 11 processes during which the raw plate is converted into machined and finished stoppers, although not yet customized or subjected to the finishing processes.
For the present study, the manufacture of these stoppers has been analyzed using drilling technology and turning technology.
Table 7 and
Table 8 show the impacts generated by this phase, breaking down the impacts of each of the activities for the manufacture of perforated stoppers of 44 mm in length and 24 and 26 mm in diameter respectively.
From the comparison of the impacts generated by the caps of 24 mm and 26 mm in diameter and 44 mm in length, a significant reduction in such impacts in all categories can be seen in this phase in those stoppers with a larger diameter.
This is due because, in the case of the perforated process, since the process analyzed works in excess thicknesses in the case of the manufacture of two-piece stoppers when working with thin plates, the raw plate and therefore the raw material necessary to obtain these stoppers is practically the same.
Despite the fact that the number of viable stoppers of 26 mm will be lower than those obtained for a diameter of 24 mm, the difference in useful volume of the cap and therefore the use of raw material and other inputs will be much greater, thus reducing the impacts generated by each kg of cork obtained.
In the case of perforated caps, stage 2 consists of 11 processes during which the raw plate is converted into machined and finished stoppers, although not yet customized or subjected to the finishing processes.
Table 9 and
Table 10 show the impacts generated by this phase, breaking down the impacts of each of the activities for the manufacture of 44 mm long and 24 and 26 mm diameter perforated stoppers, respectively.
As in the previous case and for similar reasons, from the comparison of the impacts generated by the stoppers of 24 mm and 26 mm in diameter and 44 mm in length, a significant reduction in such impacts is observed at this stage in all the categories in those stoppers with a larger diameter.
However, in this case the comparison shows significantly lower differences than those obtained in the case of perforated stoppers.
The difference mainly lies in the fact that in the case of the turning process, the number of caps obtained from 1 kg of raw material is less than that obtained in the case of perforated stoppers, which dampens the effect associated with the diameter and the use of material depending on it.
3.4. Analysis of the Impacts Generated in Stage 3 for Each of the Geometries Studied
Stage 3, the objective of which is the application of final surface treatments, the customization of the stoppers and its packaging, is made up of 5 different processes: ink marking, silicone coating, waxing, drying, and counting and packaging.
From the above data, it can be deduced that the differences between the impacts generated by stoppers of equal dimensions are very small.
However, there are profound differences between stoppers of different diameters regardless of the manufacturing methodology.
This is because these processes mainly consist of the superficial application of treatments or products, so the perimeter/volume relationship is critical.
Likewise, the analysis of the packaging activity is greatly affected by the difference in the net volume of stoppers within the same container bag, since a fixed number of stoppers is included in one of these bags regardless of their geometry, resulting in an impact smaller to greater diameter or length of the plug.
4. Discussion
Throughout this paper, a door-to-door LCA of the complete two-piece stopper manufacturing process in 24 and 26 mm diameters and 44 mm length is presented, manufactured by both turning or drilling (perforating) techniques.
The LCA has been developed based on real data from a production plant during the manufacturing process of 10 cork platforms weighing 365 kg/platform for each of the defined geometries.
In this way, precise primary data on the environmental impact of each of the individual activities that define the production process have been obtained.
To help accurately identify the influence of each of the manufacturing stages on the impacts generated for each of the geometries and production methodologies proposed,
Table 15,
Table 16,
Table 17 and
Table 18 show the influence of each of these phases on each of the proposed study elements.
From the above results it can be deduced that, for all the manufacturing processes, stage 1, mainly due to the boiling processes with a considerable consumption of water and energy derived from the heating for boiling the cork sheets, is the one that generates greater impacts.
Stages 2 and 3, although have an influence on the impacts generated, they are much lower.
It is also important to note that the impacts of phase 1 are very similar between the different proposed production methodologies and identical between different geometries manufactured with a single production methodology.
From these data, it can be deduced that there is an important relationship between the volume of use of the raw cork sheets and the impacts generated by the activity since, as it is not possible to classify the sheets until the end of their stabilization process, independently of the selected geometry there will be a consumption of resources directly associated with the processing of each unit of raw cork.
On the other hand, the difference in impacts in phase 1 associated with the turning or drilling processes lies in the different input geometries used which, ultimately, imply slight changes in the consumption of water and energy for boiling the cork.
Throughout this research, a kg of fully processed and marked two-piece stoppers has been defined as the functional unit for the present study, including the post-treatment and packaging processes.
Although this presentation of the results allows them to be analyzed in a homogeneous way and allows their application from the point of view of all the actors in the value chain of the product, it makes their interpretation difficult for wine producers, since a transformation is necessary for each of the geometries shown.
5. Conclusions
Throughout the present study, a gate to gate LCA of the complete manufacturing process of two-piece stoppers in diameters 24 and 26 mm and 44 mm in length has been carried out, manufactured by both turning or drilling methodologies.
Through this work and attending to first objective of the research, it has been determined that stage 1, corresponding to the initial processing procedures of the plate, its boiling and stabilization, is the one that generates the greatest impacts, well above stage 2, corresponding to the machining processes of the stopper from the plate, or from phase 3, corresponding to the post-treatment and personalized processes of the stopper and its packaging for delivery to the customer.
The comparative analysis between different production methodologies and stopper geometries and attending to second objective of the research, shows many similarities in phase 1 because the treatment process of the cork sheet is analogous. However, it must be emphasized that the data are not the same because the caliber of the plates necessary for the manufacture of 26 mm stopper is greater than in the case of 24 mm stopper; therefore, for the same initial weight, the number of plates is lower and consequently the consumption is also lower.
As a conclusion to the above, a relationship is established between the volume of use of the raw cork sheets and the impacts generated by the activity.
Considering the impacts generated by the machining and post-treatment processes of the stoppers, it can be concluded that although the impact generated for different methodologies and for different diameters is similar for each kg of net cork produced, the impact of the larger diameter stoppers will in turn also be much greater because the volume of such stoppers is also considerably higher (more precisely 17.36% higher).
Author Contributions
Conceptualization, F.J.F.-M., E.M.C. and J.B.-F.; data curation, F.J.F.-M., J.B.-F., J.L.G.-A. and A.S.-T.L.; formal analysis, A.S.-T.L., J.L.G.-A. and E.J.-M.; investigation, F.J.F.-M., E.M.C. and J.B.-F.; methodology, E.J.-M., E.M.C. and J.B.-F.; resources, J.B.-F. and A.S.-T.L.; validation, F.J.F.-M., E.M.C., J.L.G.-A. and E.J.-M.; visualization, A.S.-T.L.; writing—original draft, F.J.F.-M., J.B.-F. and E.J.-M.; writing—review and editing, A.S.-T.L., E.M.C., J.L.G.-A. and E.J.-M. All authors have read and agreed to the published version of the manuscript.
Funding
This research received no external funding.
Data Availability Statement
The data presented in this study are available on request from the corresponding author. The data are not publicly available due to privacy.
Acknowledgments
The authors appreciate the collaboration from institutions, service users, managers and workers, engineers, technicians, and other people that responded our survey, providing information for this paper.
Conflicts of Interest
The authors declare that there is no conflict of interest. Since there are no funders, they had no role in the design of the study, in the collection, analysis, or interpretation of the data, in the writing of the manuscript, or in the decision to publish the results.
References
- Gil, L.; Varela, M.C. Technical Guidelines for Genetic Conservation of Cork Oak (Quercus Suber); Bioversity International: Rome, Italy, 2008. [Google Scholar]
- Praciak, A. The CABI Encyclopedia of Forest Trees; CABI: Wallingford, UK, 2013. [Google Scholar]
- Cardoso, P.; Gaspar, C.; Pereira, L.C.; Silva, I.; Henriques, S.S.; da Silva, R.R.; Sousa, P. Assessing spider species richness and composition in Mediterranean cork oak forests. Acta Oecol. 2008, 33, 114–127. [Google Scholar] [CrossRef]
- Vessella, F.; López-Tirado, J.; Simeone, M.C.; Schirone, B.; Hidalgo, P.J. A tree species range in the face of climate change: Cork oak as a study case for the Mediterranean biome. Eur. J. For. Res. 2017, 136, 555–569. [Google Scholar] [CrossRef]
- Magri, D.; Fineschi, S.; Bellarosa, R.; Buonamici, A.; Sebastiani, F.; Schirone, B.; Simeone, M.C.; Vendramin, G.G. The distribution of Quercus suber chloroplast haplotypes matches the palaeogeographical history of the western Mediterranean. Mol. Ecol. 2007, 16, 5259–5266. [Google Scholar] [CrossRef] [PubMed]
- Moreira, F.; Duarte, I.; Catry, F.; Acácio, V. Cork extraction as a key factor determining post-fire cork oak survival in a mountain region of southern Portugal. For. Ecol. Manag. 2007, 253, 30–37. [Google Scholar] [CrossRef]
- Paulo, J.A.; Tomé, M. Does debarking intensity during the first cork extraction affect future cork thickness? Ann. For. Sci. 2017, 74, 1–9. [Google Scholar] [CrossRef]
- Gil, L. New cork-based materials and applications. Materials 2015, 8, 625–637. [Google Scholar] [CrossRef] [PubMed]
- Silva, J.S.; Catry, F. Forest fires in cork oak (Quercus suber L.) stands in Portugal. Int. J. Environ. Stud. 2006, 63, 235–257. [Google Scholar] [CrossRef]
- Sierra-Pérez, J.; Boschmonart-Rives, J.; Gabarrell, X. Production and trade analysis in the Iberian cork sector: Economic characterization of a forest industry. Resour. Conserv. Recycl. 2015, 98, 55–66. [Google Scholar] [CrossRef]
- Mendes, A. A Economia do Sector da Cortiça em Portugal: Evolução das Actividades de Produção e de Transformação ao Longo dos Séculos XIX e XX; Universidade Católica Portuguesa: Porto, Portugal, 2002. [Google Scholar]
- Chatonnet, P.; Labadie, D.; Boutou, S. Study of chloroanisoles assay and tca assay validation in wine and cork stoppers soaked in dilute alcohol solution using SIDA-HSSPME-GC-MS/EI-SIM. OENO One 2005, 39, 137–147. [Google Scholar] [CrossRef]
- Demertzi, M.; Dias, A.C.; Matos, A.; Arroja, L.M. Evaluation of different end-of-life management alternatives for used natural cork stoppers through life cycle assessment. Waste Manag. 2015, 46, 668–680. [Google Scholar] [CrossRef] [PubMed]
- Rives, J.; Fernandez-Rodriguez, I.; Rieradevall, J.; Gabarrell, X. Environmental analysis of raw cork extraction in cork oak forests in southern Europe (Catalonia–Spain). J. Environ. Manag. 2012, 110, 236–245. [Google Scholar] [CrossRef] [PubMed]
- Rives, J.; Fernandez-Rodriguez, I.; Rieradevall, J.; Gabarrell, X. Integrated environmental analysis of the main cork products in southern Europe (Catalonia–Spain). J. Clean. Prod. 2013, 51, 289–298. [Google Scholar] [CrossRef]
- Rives, J.; Fernandez-Rodriguez, I.; Rieradevall, J.; Gabarrell, X. Environmental analysis of the production of natural cork stoppers in southern Europe (Catalonia–Spain). J. Clean. Prod. 2011, 19, 259–271. [Google Scholar] [CrossRef]
- Rives, J.; Fernandez-Rodriguez, I.; Gabarrell, X.; Rieradevall, J. Environmental analysis of cork granulate production in Catalonia–Northern Spain. Resour. Conserv. Recycl. 2012, 58, 132–142. [Google Scholar] [CrossRef]
- Rives, J.; Fernández-Rodríguez, I.; Rieradevall, J.; Gabarrell, X. Environmental analysis of the production of champagne cork stoppers. J. Clean. Prod. 2012, 25, 1–13. [Google Scholar] [CrossRef]
- Flor, F.J.; Leiva, F.J.; García, J.; Martínez, E.; Jiménez, E.; Blanco, J. Environmental impact of oak barrels production in Qualified Designation of Origin of Rioja. J. Clean. Prod. 2017, 167, 208–217. [Google Scholar] [CrossRef]
- Flor, F.J.; Leiva, F.J.; García, J.L.; Martínez, E.; Jiménez, E.; Blanco, J. Environmental impact of wine aging process in oak barrels in wineries of La Rioja (Spain). Am. J. Enol. Vitic. 2018, 69. [Google Scholar] [CrossRef]
Figure 1.
Perforated cork sheet to obtain one-piece stoppers on the left and 2 thin cork sheets glued together to achieve the same useful thickness and manufacture two-piece stoppers on the right.
Figure 1.
Perforated cork sheet to obtain one-piece stoppers on the left and 2 thin cork sheets glued together to achieve the same useful thickness and manufacture two-piece stoppers on the right.
Figure 2.
System limits The flowchart displays processes relations and consumption of material, energy, water, and other consumption flows and has been elaborated according to the reality of material, energy, water, and other consumption flows, and these depend on the existing production process [
19,
20].
Table 1.
Consumptions for 1000 kg raw material used to produce 2-piece stoppers with dimensions of 24 × 44—Drilled (Perforated) method.
Table 1.
Consumptions for 1000 kg raw material used to produce 2-piece stoppers with dimensions of 24 × 44—Drilled (Perforated) method.
| | 2-Piece Cork 24 × 44—Perforated |
|---|
| Phase 1 | Phase 2 | Phase 3 |
|---|
| Raw material (kg) | 99.6 | 798.5229723 | −0.642434486 |
| Water (kg) | 2961.150685 | 234.818468 | 0 |
| Energy (kWh) | 394.0489893 | 339.7169957 | 4.757206185 |
| Workforce (h) | 16.47945205 | 54.0239726 | 3.034218613 |
| Glue (kg) | 0 | 6,1983 | 0 |
| Silicone (kg) | 0 | 0 | 0.106978801 |
| Paraffin (kg) | 0 | 0 | 0.535455685 |
Table 2.
Consumption for 1000 kg raw material used to produce 2-piece stoppers with dimensions 26 × 44—Drilled (Perforated) method.
Table 2.
Consumption for 1000 kg raw material used to produce 2-piece stoppers with dimensions 26 × 44—Drilled (Perforated) method.
| | 2-Piece Cork 26 × 44—Perforated |
|---|
| Phase 1 | Phase 2 | Phase 3 |
|---|
| Raw material (kg) | 173.5 | 734.8957104 | −0.492139253 |
| Water (kg) | 2961.150685 | 179.9068018 | 0 |
| Energy (kWh) | 394.0070381 | 297.2638903 | 3.801867111 |
| Workforce (h) | 16.47945205 | 54.0239726 | 2.728139794 |
| Glue (kg) | 0 | 6.1983 | 0 |
| Silicone (kg) | 0 | 0 | 0.081962096 |
| Paraffin (kg) | 0 | 0 | 0.410177157 |
Table 3.
Consumptions for 1000 kg raw material used to produce 2-piece stoppers with dimensions of 24 × 44—Turning method.
Table 3.
Consumptions for 1000 kg raw material used to produce 2-piece stoppers with dimensions of 24 × 44—Turning method.
| | 2-Piece Cork 24 × 44—Turned |
|---|
| Phase 1 | Phase 2 | Phase 3 |
|---|
| Raw material (kg) | 103.3 | 799.1195475 | −4.939009633 |
| Water (kg) | 3281.575342 | 224.9152031 | 0 |
| Energy (kWh) | 419.7903808 | 397.2961628 | 4.556575146 |
| Workforce (h) | 15.21917808 | 23.1369863 | 0.228126727 |
| Glue (kg) | 0 | 6.1983 | 0 |
| Silicone (kg) | 0 | 0 | 0.102467063 |
| Paraffin (kg) | 0 | 0 | 0.512873306 |
Table 4.
Consumptions for 1000 kg raw material used to produce 2-piece stoppers with dimensions of 26 × 44—Turning method.
Table 4.
Consumptions for 1000 kg raw material used to produce 2-piece stoppers with dimensions of 26 × 44—Turning method.
| | 2-Piece Cork 26 × 44—Turned |
|---|
| Phase 1 | Phase 2 | Phase 3 |
|---|
| Raw material (kg) | 157.9 | 743.6385754 | −4.058037613 |
| Water (kg) | 3281.575342 | 193.3739137 | 0 |
| Energy (kWh) | 419.7607708 | 327.4015667 | 4.256729013 |
| Workforce (h) | 15.21917808 | 23.1369863 | 0.230178959 |
| Glue (kg) | 0 | 6.595 | 0 |
| Silicone (kg) | 0 | 0 | 0.088097455 |
| Paraffin (kg) | 0 | 0 | 0.440881397 |
Table 5.
Global impact for each geometry and production methodology, by impact categories.
Table 5.
Global impact for each geometry and production methodology, by impact categories.
| | | 24 × 44 2P Perforated | 26 × 44 2P Perforated | 24 × 44 2P Turned | 26 × 44 2P Turned |
|---|
| Abiotic depletion | kg Sb eq | 0.002735461 | 0.002731983 | 0.003004334 | 0.00299546 |
| Abiotic depletion (fossil fuels) | MJ | 10690.65995 | 10545.34663 | 11749.76879 | 11510.02109 |
| Global warming (GWP100a) | kg CO2 eq | 977.7305994 | 963.2864969 | 1076.812504 | 1052.989073 |
| Ozone layer depletion (ODP) | kg CFC-11 eq | 0.000102725 | 0.000100916 | 0.00011299 | 0.000110023 |
| Human toxicity | kg 1.4-DB eq | 490.8382666 | 485.8388178 | 540.5864976 | 532.2016483 |
| Fresh water aquatic ecotox. | kg 1.4-DB eq | 526.3757405 | 521.1066613 | 580.335491 | 571.7369036 |
| Marine aquatic ecotoxicity | kg 1.4-DB eq | 1534271.083 | 1510568.815 | 1693274.685 | 1654770.983 |
| Terrestrial ecotoxicity | kg 1.4-DB eq | 8.938554382 | 8.890603038 | 9.803742104 | 9.725492703 |
| Photochemical oxidation | kg C2H4 eq | 0.37385754 | 0.369816267 | 0.404236078 | 0.397468484 |
| Acidification | kg SO2 eq | 5.719579397 | 5.605312106 | 6.306237612 | 6.119246576 |
| Eutrophication | kg PO4—eq | 2.247685829 | 2.225486034 | 2.476569152 | 2.440110841 |
Table 6.
Impact of stage 1 broken down by activities for the manufacturing process of 2-piece drilling-perforated stoppers, of 24 mm in diameter and 44 mm in length.
Table 6.
Impact of stage 1 broken down by activities for the manufacturing process of 2-piece drilling-perforated stoppers, of 24 mm in diameter and 44 mm in length.
| | | Cork Sheets Selection | Boiling of Cork Sheets | Resting and Drying | Total |
|---|
| Abiotic depletion | kg Sb eq | 7.659 × 10⁻⁶ | 0.00253652 | 8.9472 × 10⁻⁶ | 0.00255313 |
| Abiotic depletion (fossil fuels) | MJ | 210.954269 | 8703.63077 | 152.098393 | 9066.68343 |
| Global warming (GWP100a) | kg CO2 eq | 15.0859119 | 807.818226 | 14.7224994 | 837.626637 |
| Ozone layer depletion (ODP) | kg CFC-11 eq | 2.6202 × 10⁻⁶ | 8.0286 × 10⁻⁵ | 1.8379 × 10⁻⁶ | 8.4744 × 10⁻⁵ |
| Human toxicity | kg 1.4-DB eq | 2.49657001 | 428.496627 | 5.32512908 | 436.318326 |
| Fresh water aquatic ecotox. | kg 1.4-DB eq | 2.63458208 | 470.790845 | 5.22994656 | 478.655374 |
| Marine aquatic ecotoxicity | kg 1.4-DB eq | 2388.83562 | 1300467.37 | 23257.8208 | 1326114.03 |
| Terrestrial ecotoxicity | kg 1.4-DB eq | 0.50703198 | 7.95327691 | 0.04743803 | 8.50774692 |
| Photochemical oxidation | kg C2H4 eq | 0.07623872 | 0.25029771 | 0.00427678 | 0.33081321 |
| Acidification | kg SO2 eq | 0.08352229 | 4.48663646 | 0.1138804 | 4.68403916 |
| Eutrophication | kg PO4—eq | 0.02217068 | 1.99490029 | 0.0223638 | 2.03943478 |
Table 7.
Impact of stage 1 broken down by activities for the manufacturing process of 2-piece drilling-perforated stoppers, of 26 mm in diameter and 44 mm in length.
Table 7.
Impact of stage 1 broken down by activities for the manufacturing process of 2-piece drilling-perforated stoppers, of 26 mm in diameter and 44 mm in length.
| | | Cork Sheets Selection | Boiling of Cork Sheets | Resting and Drying | Total |
|---|
| Abiotic depletion | kg Sb eq | 7.659 × 10⁻⁶ | 0.00253651 | 8.9472 × 10⁻⁶ | 0.00255312 |
| Abiotic depletion (fossil fuels) | MJ | 210.954269 | 8703.47757 | 152.098393 | 9066.53024 |
| Global warming (GWP100a) | kg CO2 eq | 15.0859119 | 807.803397 | 14.7224994 | 837.611808 |
| Ozone layer depletion (ODP) | kg CFC-11 eq | 2.6202 × 10⁻⁶ | 8.0284 × 10⁻⁵ | 1.8379 × 10⁻⁶ | 8.4742 × 10⁻⁵ |
| Human toxicity | kg 1.4-DB eq | 2.49657001 | 428.491263 | 5.32512908 | 436.312962 |
| Fresh water aquatic ecotox. | kg 1.4-DB eq | 2.63458208 | 470.785577 | 5.22994656 | 478.650106 |
| Marine aquatic ecotoxicity | kg 1.4-DB eq | 2388.83562 | 1300443.95 | 23257.8208 | 1326090.6 |
| Terrestrial ecotoxicity | kg 1.4-DB eq | 0.50703198 | 7.95322913 | 0.04743803 | 8.50769914 |
| Photochemical oxidation | kg C2H4 eq | 0.07623872 | 0.2502934 | 0.00427678 | 0.3308089 |
| Acidification | kg SO2 eq | 0.08352229 | 4.48652176 | 0.1138804 | 4.68392445 |
| Eutrophication | kg PO4—eq | 0.02217068 | 1.99487777 | 0.0223638 | 2.03941225 |
Table 8.
Impact of stage 1 broken down by activities for the manufacturing process of 2-piece turned stoppers, of 24mm in diameter and 44mm in length.
Table 8.
Impact of stage 1 broken down by activities for the manufacturing process of 2-piece turned stoppers, of 24mm in diameter and 44mm in length.
| | | Cork Sheets Selection | Boiling of Cork Sheets | Resting and Drying | Total |
|---|
| Abiotic depletion | kg Sb eq | 7.659 × 10⁻⁶ | 0.00279323 | 8.9472 × 10⁻⁶ | 0.00280984 |
| Abiotic depletion (fossil fuels) | MJ | 210.954269 | 9554.66708 | 152.098393 | 9917.71975 |
| Global warming (GWP100a) | kg CO2 eq | 15.0859119 | 886.657521 | 14.7224994 | 916.465933 |
| Ozone layer depletion (ODP) | kg CFC-11 eq | 2.6202 × 10⁻⁶ | 8.8029 × 10⁻⁵ | 1.8379 × 10⁻⁶ | 9.2488 × 10⁻⁵ |
| Human toxicity | kg 1.4-DB eq | 2.49657001 | 470.925973 | 5.32512908 | 478.747672 |
| Fresh water aquatic ecotox. | kg 1.4-DB eq | 2.63458208 | 517.560579 | 5.22994656 | 525.425108 |
| Marine aquatic ecotoxicity | kg 1.4-DB eq | 2388.83562 | 1427495.77 | 23257.8208 | 1453142.43 |
| Terrestrial ecotoxicity | kg 1.4-DB eq | 0.50703198 | 8.75342614 | 0.04743803 | 9.30789615 |
| Photochemical oxidation | kg C2H4 eq | 0.07623872 | 0.27479557 | 0.00427678 | 0.35531107 |
| Acidification | kg SO2 eq | 0.08352229 | 4.91662543 | 0.1138804 | 5.11402812 |
| Eutrophication | kg PO4—eq | 0.02217068 | 2.19302971 | 0.0223638 | 2.23756419 |
Table 9.
Impact of stage 1 broken down by activities for the manufacturing process of 2-piece turned stoppers, of 26 mm in diameter and 44 mm in length.
Table 9.
Impact of stage 1 broken down by activities for the manufacturing process of 2-piece turned stoppers, of 26 mm in diameter and 44 mm in length.
| | | Cork Sheets Selection | Boiling of Cork Sheets | Resting and Drying | Total |
|---|
| Abiotic depletion | kg Sb eq | 7.659 × 10⁻⁶ | 0.00279322 | 8.9472 × 10⁻⁶ | 0.00280983 |
| Abiotic depletion (fossil fuels) | MJ | 210.954269 | 9554.55895 | 152.098393 | 9917.61162 |
| Global warming (GWP100a) | kg CO2 eq | 15.0859119 | 886.647055 | 14.7224994 | 916.455466 |
| Ozone layer depletion (ODP) | kg CFC-11 eq | 2.6202 × 10⁻⁶ | 8.8028 × 10⁻⁵ | 1.8379 × 10⁻⁶ | 9.2486 × 10⁻⁵ |
| Human toxicity | kg 1.4-DB eq | 2.49657001 | 470.922187 | 5.32512908 | 478.743887 |
| Fresh water aquatic ecotox. | kg 1.4-DB eq | 2.63458208 | 517.556861 | 5.22994656 | 525.42139 |
| Marine aquatic ecotoxicity | kg 1.4-DB eq | 2388.83562 | 1427479.24 | 23257.8208 | 1453125.9 |
| Terrestrial ecotoxicity | kg 1.4-DB eq | 0.50703198 | 8.75339242 | 0.04743803 | 9.30786243 |
| Photochemical oxidation | kg C2H4 eq | 0.07623872 | 0.27479253 | 0.00427678 | 0.35530803 |
| Acidification | kg SO2 eq | 0.08352229 | 4.91654447 | 0.1138804 | 5.11394716 |
| Eutrophication | kg PO4—eq | 0.02217068 | 2.19301381 | 0.0223638 | 2.23754829 |
Table 10.
Impact of stage 2 broken down by activities for the manufacturing process of two-piece perforated caps of 24 mm diameter and 44 mm in length.
Table 10.
Impact of stage 2 broken down by activities for the manufacturing process of two-piece perforated caps of 24 mm diameter and 44 mm in length.
| d | | Horizontal Sawing | Cross-Cutting Sawing | Gluing | Punching | Cutting Out | Pieces Selection |
|---|
| Abiotic depletion | kg Sb eq | 9.79204 × 10⁻⁷ | 1.41377 × 10⁻⁶ | 0.000164796 | 1.09573 × 10⁻⁶ | 2.75878 × 10⁻⁷ | 1.58861 × 10⁻⁶ |
| Abiotic depletion (fossil fuels) | MJ | 16.64600967 | 24.03350876 | 1355.837713 | 18.62693063 | 4.689795459 | 27.00562884 |
| Global warming (GWP100a) | kg CO2 eq | 1.611265337 | 2.326344894 | 116.5679459 | 1.803010346 | 0.45395293 | 2.614033905 |
| Ozone layer depletion (ODP) | kg CFC-11 eq | 2.01144 × 10⁻⁷ | 2.90411 × 10⁻⁷ | 1.49206 × 10⁻⁵ | 2.2508 × 10⁻⁷ | 5.66696 × 10⁻⁸ | 3.26325 × 10⁻⁷ |
| Human toxicity | kg 1.4-DB eq | 0.582794785 | 0.841439111 | 45.93881528 | 0.652148968 | 0.164194806 | 0.945496246 |
| Fresh water aquatic ecotox. | kg 1.4-DB eq | 0.572377785 | 0.826399046 | 39.33888383 | 0.640492317 | 0.161259953 | 0.928596242 |
| Marine aquatic ecotoxicity | kg 1.4-DB eq | 2545.391196 | 3675.035809 | 170901.8665 | 2848.299754 | 717.1306705 | 4129.511593 |
| Terrestrial ecotoxicity | kg 1.4-DB eq | 0.005191731 | 0.007495821 | 0.350752412 | 0.005809561 | 0.001462702 | 0.008422797 |
| Photochemical oxidation | kg C2H4 eq | 0.000468061 | 0.000675786 | 0.036215966 | 0.000523761 | 0.00013187 | 0.000759358 |
| Acidification | kg SO2 eq | 0.012463342 | 0.017994573 | 0.855607705 | 0.013946514 | 0.003511383 | 0.020219884 |
| Eutrophication | kg PO4—eq | 0.002447548 | 0.003533769 | 0.172616166 | 0.002738812 | 0.000689565 | 0.003970775 |
| | | Body polishing | Head polishing | Gross air selection | Fine optical selection | Final washing | Total |
| Abiotic depletion | kg Sb eq | 2.52933 × 10⁻⁷ | 3.23329 × 10⁻⁷ | 2.1573 × 10⁻⁷ | 1.95948 × 10⁻⁷ | 6.68326 × 10⁻⁶ | 0.00017782 |
| Abiotic depletion (fossil fuels) | MJ | 4.29973755 | 5.496440505 | 3.667317676 | 3.331027511 | 109.2488265 | 1572.882936 |
| Global warming (GWP100a) | kg CO2 eq | 0.416196927 | 0.532032856 | 0.354981282 | 0.322429776 | 10.57044332 | 137.5726375 |
| Ozone layer depletion (ODP) | kg CFC-11 eq | 5.19563 × 10⁻⁸ | 6.64167 × 10⁻⁸ | 4.43144 × 10⁻⁸ | 4.02508 × 10⁻⁸ | 1.31696 × 10⁻⁶ | 1.75401 × 10⁻⁵ |
| Human toxicity | kg 1.4-DB eq | 0.150538458 | 0.192436321 | 0.128396754 | 0.116622872 | 3.840612413 | 53.55349602 |
| Fresh water aquatic ecotox. | kg 1.4-DB eq | 0.147847701 | 0.188996673 | 0.126101763 | 0.11453833 | 3.778297956 | 46.82379159 |
| Marine aquatic ecotoxicity | kg 1.4-DB eq | 657.4857473 | 840.4771804 | 560.7805302 | 509.3573937 | 16701.70698 | 204087.0434 |
| Terrestrial ecotoxicity | kg 1.4-DB eq | 0.001341047 | 0.001714287 | 0.001143801 | 0.001038916 | 0.034737868 | 0.419110945 |
| Photochemical oxidation | kg C2H4 eq | 0.000120902 | 0.000154552 | 0.000103119 | 9.36635 × 10⁻⁵ | 0.003072618 | 0.042319658 |
| Acidification | kg SO2 eq | 0.003219336 | 0.004115342 | 0.002745825 | 0.002494035 | 0.081540327 | 1.017858266 |
| Eutrophication | kg PO4—eq | 0.000632212 | 0.00080817 | 0.000539224 | 0.000489778 | 0.016154085 | 0.204620104 |
Table 11.
Impact of stage 2 broken down by activities for the manufacturing process of 2-piece perforated stoppers with a diameter of 26 mm and 44 mm in length.
Table 11.
Impact of stage 2 broken down by activities for the manufacturing process of 2-piece perforated stoppers with a diameter of 26 mm and 44 mm in length.
| | | Horizontal Sawing | Cross-Cutting Sawing | Gluing | Punching | Cutting Out | Pieces Selection |
|---|
| Abiotic depletion | kg Sb eq | 7.98965 × 10⁻⁷ | 1.17416 × 10⁻⁶ | 0.000164991 | 9.77652 × 10⁻⁷ | 2.16819 × 10⁻⁷ | 1.24853 × 10⁻⁶ |
| Abiotic depletion (fossil fuels) | MJ | 13.58203958 | 19.96016537 | 1266.643583 | 16.61963209 | 3.685818907 | 21.22434939 |
| Global warming (GWP100a) | kg CO2 eq | 1.314685622 | 1.93206199 | 106.995319 | 1.608712096 | 0.356772125 | 2.054429809 |
| Ozone layer depletion (ODP) | kg CFC-11 eq | 1.6412 × 10⁻⁷ | 2.4119 × 10⁻⁷ | 1.37492 × 10⁻⁷ | 2.00825 × 10⁻⁷ | 4.45379 × 10⁻⁸ | 2.56466 × 10⁻⁷ |
| Human toxicity | kg 1.4-DB eq | 0.475521881 | 0.698826957 | 42.71807642 | 0.581871277 | 0.129044503 | 0.743087406 |
| Fresh water aquatic ecotox. | kg 1.4-DB eq | 0.4670223 | 0.686335973 | 35.80586103 | 0.571470784 | 0.126737933 | 0.729805301 |
| Marine aquatic ecotoxicity | kg 1.4-DB eq | 2076.870353 | 3052.16867 | 154931.7793 | 2541.357722 | 563.6096087 | 3245.478836 |
| Terrestrial ecotoxicity | kg 1.4-DB eq | 0.004236108 | 0.006225385 | 0.318317808 | 0.005183504 | 0.001149572 | 0.006619672 |
| Photochemical oxidation | kg C2H4 eq | 0.000381907 | 0.00056125 | 0.033585837 | 0.000467319 | 0.00010364 | 0.000596797 |
| Acidification | kg SO2 eq | 0.01016926 | 0.014944745 | 0.778614307 | 0.012443592 | 0.002759678 | 0.015891275 |
| Eutrophication | kg PO4—eq | 0.001997036 | 0.002934845 | 0.157790129 | 0.002443669 | 0.000541945 | 0.003120724 |
| | | Body polishing | Head polishing | Gross air selection | Fine optical selection | Final washing | Total |
| Abiotic depletion | kg Sb eq | 1.98786 × 10⁻⁷ | 2.58946 × 10⁻⁷ | 1.72424 × 10⁻⁷ | 1.56613 × 10⁻⁷ | 5.1232 × 10⁻⁶ | 0.000175317 |
| Abiotic depletion (fossil fuels) | MJ | 3.379263359 | 4.401963622 | 2.9311332 | 2.662350576 | 83.74883637 | 1438.839135 |
| Global warming (GWP100a) | kg CO2 eq | 0.327098808 | 0.426091991 | 0.28372165 | 0.257704596 | 8.103176619 | 123.6597743 |
| Ozone layer depletion (ODP) | kg CFC-11 eq | 4.08336 × 10⁻⁸ | 5.31915 × 10⁻⁸ | 3.54186 × 10⁻⁸ | 3.21708 × 10⁻⁸ | 1.00957 × 10⁻⁶ | 1.58275 × 10⁻⁵ |
| Human toxicity | kg 1.4-DB eq | 0.118311662 | 0.154117503 | 0.10262214 | 0.09321177 | 2.944160451 | 48.75885197 |
| Fresh water aquatic ecotox. | kg 1.4-DB eq | 0.116196933 | 0.151362773 | 0.10078785 | 0.091545683 | 2.896388302 | 41.74351486 |
| Marine aquatic ecotoxicity | kg 1.4-DB eq | 516.7332817 | 673.1174421 | 448.2083569 | 407.1080007 | 12803.32936 | 181259.761 |
| Terrestrial ecotoxicity | kg 1.4-DB eq | 0.00105396 | 0.00137293 | 0.000914192 | 0.000830362 | 0.026629343 | 0.372532835 |
| Photochemical oxidation | kg C2H4 eq | 9.50198 × 10⁻⁵ | 0.000123777 | 8.24191 × 10⁻⁵ | 7.48613 × 10⁻⁵ | 0.002355432 | 0.038428258 |
| Acidification | kg SO2 eq | 0.002530151 | 0.003295876 | 0.002194623 | 0.001993378 | 0.062507946 | 0.90734483 |
| Eutrophication | kg PO4—eq | 0.00049687 | 0.000647243 | 0.000430979 | 0.000391459 | 0.012383488 | 0.183178388 |
Table 12.
Impact of stage 2 broken down by activities for the manufacturing process of 2-piece turned stoppers of 24 mm diameter and 44 mm in length.
Table 12.
Impact of stage 2 broken down by activities for the manufacturing process of 2-piece turned stoppers of 24 mm diameter and 44 mm in length.
| | | Horizontal Sawing | Cross-Cutting Sawing | Gluing | Turning | Cutting Out | Pieces Selection |
|---|
| Abiotic depletion | kg Sb eq | 9.7518 × 10⁻⁷ | 2.00757 × 10⁻⁶ | 0.000176169 | 1.64611 × 10⁻⁶ | 3.02227 × 10⁻⁷ | 1.6872 × 10⁻⁶ |
| Abiotic depletion (fossil fuels) | MJ | 16.57760648 | 34.12776586 | 1549.171728 | 27.98319182 | 5.137714018 | 28.68165549 |
| Global warming (GWP100a) | kg CO2 eq | 1.604644189 | 3.303427504 | 135.2818839 | 2.708657984 | 0.497309606 | 2.776266397 |
| Ozone layer depletion (ODP) | kg CFC-11 eq | 2.00317 × 10⁻⁷ | 4.12386 × 10⁻⁷ | 1.72567 × 10⁻⁵ | 3.38137 × 10⁻⁷ | 6.2082 × 10⁻⁸ | 3.46577 × 10⁻⁷ |
| Human toxicity | kg 1.4-DB eq | 0.580399915 | 1.194849959 | 52.70764798 | 0.979721782 | 0.179876919 | 1.00417575 |
| Fresh water aquatic ecotox. | kg 1.4-DB eq | 0.570025722 | 1.173492952 | 45.98672891 | 0.962210023 | 0.17666176 | 0.986226895 |
| Marine aquatic ecotoxicity | kg 1.4-DB eq | 2534.931459 | 5218.578897 | 200465.1493 | 4278.993676 | 785.623239 | 4385.797847 |
| Terrestrial ecotoxicity | kg 1.4-DB eq | 0.005170397 | 0.010644124 | 0.411051441 | 0.00872769 | 0.001602404 | 0.008945534 |
| Photochemical oxidation | kg C2H4 eq | 0.000466137 | 0.000959622 | 0.041652228 | 0.000786845 | 0.000144465 | 0.000806485 |
| Acidification | kg SO2 eq | 0.012412126 | 0.025552431 | 1.000362389 | 0.020951813 | 0.003846753 | 0.021474773 |
| Eutrophication | kg PO4—eq | 0.00243749 | 0.005017979 | 0.20104305 | 0.004114511 | 0.000755424 | 0.00421721 |
| | | Body polishing | Head polishing | Gross air selection | Fine optical selection | Final washing | Total |
| Abiotic depletion | kg Sb eq | 2.6863 × 10⁻⁷ | 3.22979 × 10⁻⁷ | 2.08448 × 10⁻⁷ | 1.87684 × 10⁻⁷ | 6.4014 × 10⁻⁶ | 0.000190176 |
| Abiotic depletion (fossil fuels) | MJ | 4.566588388 | 5.490500551 | 3.543511261 | 3.190544319 | 104.6413522 | 1783.112158 |
| Global warming (GWP100a) | kg CO2 eq | 0.442026992 | 0.531457893 | 0.34299733 | 0.30883158 | 10.12464405 | 157.9221475 |
| Ozone layer depletion (ODP) | kg CFC-11 eq | 5.51808 × 10⁻⁸ | 6.6345 × 10⁻⁸ | 4.28183 × 10⁻⁸ | 3.85532 × 10⁻⁸ | 1.26142 × 10⁻⁶ | 2.00806 × 10⁻⁵ |
| Human toxicity | kg 1.4-DB eq | 0.159881194 | 0.192228357 | 0.124062158 | 0.111704404 | 3.678637921 | 60.91318634 |
| Fresh water aquatic ecotox. | kg 1.4-DB eq | 0.157023443 | 0.188792426 | 0.121844644 | 0.109707775 | 3.618951522 | 54.05166607 |
| Marine aquatic ecotoxicity | kg 1.4-DB eq | 698.2907082 | 839.5688843 | 541.8489203 | 487.875688 | 15997.32699 | 236233.9856 |
| Terrestrial ecotoxicity | kg 1.4-DB eq | 0.001424275 | 0.001712435 | 0.001105187 | 0.0009951 | 0.033272829 | 0.484651415 |
| Photochemical oxidation | kg C2H4 eq | 0.000128406 | 0.000154385 | 9.96382 × 10⁻⁵ | 8.97133 × 10⁻⁵ | 0.002943033 | 0.048230958 |
| Acidification | kg SO2 eq | 0.003419135 | 0.004110894 | 0.002653128 | 0.002388851 | 0.078101434 | 1.175273728 |
| Eutrophication | kg PO4—eq | 0.000671449 | 0.000807296 | 0.000521021 | 0.000469122 | 0.015472801 | 0.235527353 |
Table 13.
Impact of stage 2 broken down by activities for the manufacturing process of 2-piece turned stoppers of 26 mm diameter and 44 mm in length.
Table 13.
Impact of stage 2 broken down by activities for the manufacturing process of 2-piece turned stoppers of 26 mm diameter and 44 mm in length.
| | | Horizontal Sawing | Cross-Cutting Sawing | Gluing | Turning | Cutting Out | Pieces Selection |
|---|
| Abiotic depletion | kg Sb eq | 8.47964 × 10⁻⁷ | 1.64618 × 10⁻⁶ | 0.000169818 | 1.34947 × 10⁻⁶ | 2.63956 × 10⁻⁷ | 1.48859 × 10⁻⁶ |
| Abiotic depletion (fossil fuels) | MJ | 14.41499739 | 27.98431493 | 1348.693492 | 22.94035787 | 4.487133999 | 25.30529903 |
| Global warming (GWP100a) | kg CO2 eq | 1.395312516 | 2.708766697 | 114.9374131 | 2.220532379 | 0.434336133 | 2.449448966 |
| Ozone layer depletion (ODP) | kg CFC-11 eq | 1.74185 × 10⁻⁷ | 3.38151 × 10⁻⁷ | 1.47406 × 10⁻⁵ | 2.77202 × 10⁻⁷ | 5.42207 × 10⁻⁸ | 3.05779 × 10⁻⁷ |
| Human toxicity | kg 1.4-DB eq | 0.504684634 | 0.979761104 | 45.59073245 | 0.803166717 | 0.15709941 | 0.885965862 |
| Fresh water aquatic ecotox. | kg 1.4-DB eq | 0.495663792 | 0.962248642 | 38.62717059 | 0.788810741 | 0.154291381 | 0.870129917 |
| Marine aquatic ecotoxicity | kg 1.4-DB eq | 2204.240427 | 4279.165415 | 167478.2768 | 3507.878833 | 686.1410996 | 3869.509068 |
| Terrestrial ecotoxicity | kg 1.4-DB eq | 0.0044959 | 0.00872804 | 0.343908389 | 0.007154878 | 0.001399494 | 0.007892481 |
| Photochemical oxidation | kg C2H4 eq | 0.000405328 | 0.000786877 | 0.035892957 | 0.000645048 | 0.000126171 | 0.000711547 |
| Acidification | kg SO2 eq | 0.010792919 | 0.020952654 | 0.840047413 | 0.0171761 | 0.003359645 | 0.018946798 |
| Eutrophication | kg PO4—eq | 0.00211951 | 0.004114676 | 0.169854345 | 0.003373038 | 0.000659766 | 0.003720767 |
| | | Body polishing | Head polishing | Gross air selection | Fine optical selection | Final washing | Total |
| Abiotic depletion | kg Sb eq | 2.37007 × 10⁻⁷ | 2.83878 × 10⁻⁷ | 1.89408 × 10⁻⁷ | 1.75351 × 10⁻⁷ | 5.50972 × 10⁻⁶ | 0.00018181 |
| Abiotic depletion (fossil fuels) | MJ | 4.029017249 | 4.825795701 | 3.219852168 | 2.980878765 | 90.06936077 | 1548.9505 |
| Global warming (GWP100a) | kg CO2 eq | 0.389992314 | 0.467117194 | 0.311668459 | 0.288536816 | 8.714725399 | 134.31785 |
| Ozone layer depletion (ODP) | kg CFC-11 eq | 4.8685 × 10⁻⁸ | 5.83129 × 10⁻⁸ | 3.89074 × 10⁻⁸ | 3.60197 × 10⁻⁸ | 1.08576 × 10⁻⁶ | 1.71579 × 10⁻⁵ |
| Human toxicity | kg 1.4-DB eq | 0.141060247 | 0.168956322 | 0.112730504 | 0.104363786 | 3.166348848 | 52.61486989 |
| Fresh water aquatic ecotox. | kg 1.4-DB eq | 0.138538906 | 0.16593636 | 0.110715534 | 0.102498366 | 3.114968489 | 45.53097272 |
| Marine aquatic ecotoxicity | kg 1.4-DB eq | 616.0890952 | 737.9268748 | 492.357239 | 455.8151002 | 13769.5984 | 198096.9984 |
| Terrestrial ecotoxicity | kg 1.4-DB eq | 0.001256612 | 0.00150512 | 0.001004241 | 0.000929708 | 0.028638747 | 0.406913609 |
| Photochemical oxidation | kg C2H4 eq | 0.00011329 | 0.000135694 | 9.05374 × 10⁻⁵ | 8.38178 × 10⁻⁵ | 0.002533196 | 0.041524464 |
| Acidification | kg SO2 eq | 0.00301664 | 0.003613211 | 0.002410795 | 0.002231869 | 0.067225541 | 0.989773585 |
| Eutrophication | kg PO4—eq | 0.000592407 | 0.000709561 | 0.000473431 | 0.000438294 | 0.013318027 | 0.199373823 |
Table 14.
Impact of stage 3 broken down by activities for the manufacturing process of perforated stoppers of 2-pieces of 24 mm in diameter and 44 mm in length.
Table 14.
Impact of stage 3 broken down by activities for the manufacturing process of perforated stoppers of 2-pieces of 24 mm in diameter and 44 mm in length.
| | | Ink Marking | Silicone Coating | Waxing | Drying | Counting and Packaging | Total |
|---|
| Abiotic depletion | kg Sb eq | 3.99196 × 10⁻⁷ | 1.0427 × 10⁻⁶ | 2.83187 × 10⁻⁶ | 9.31642 × 10⁻⁸ | 1.45415 × 10⁻⁷ | 4.51234 × 10⁻⁶ |
| Abiotic depletion (fossil fuels) | MJ | 3.879728885 | 8.746627243 | 34.41152473 | 1.583747734 | 2.471987204 | 51.09361579 |
| Global warming (GWP100a) | kg CO2 eq | 0.353097735 | 0.718555749 | 1.067095298 | 0.153300273 | 0.239278204 | 2.531327259 |
| Ozone layer depletion (ODP) | kg CFC-11 eq | 4.15944 × 10⁻⁸ | 2.53403 × 10⁻⁷ | 9.6526 × 10⁻⁸ | 1.91374 × 10⁻⁸ | 2.98705 × 10⁻⁸ | 4.40532 × 10⁻⁷ |
| Human toxicity | kg 1.4-DB eq | 0.124486862 | 0.267216194 | 0.432748548 | 0.05544872 | 0.086546943 | 0.966447267 |
| Fresh water aquatic ecotox. | kg 1.4-DB eq | 0.122416704 | 0.262765725 | 0.371938444 | 0.054457617 | 0.084999984 | 0.896578474 |
| Marine aquatic ecotoxicity | kg 1.4-DB eq | 476.0119299 | 1337.515368 | 1636.314337 | 242.1756096 | 377.9989673 | 4070.016211 |
| Terrestrial ecotoxicity | kg 1.4-DB eq | 0.006125014 | 0.001765573 | 0.002541001 | 0.000493956 | 0.000770989 | 0.011696533 |
| Photochemical oxidation | kg C2H4 eq | 0.000110929 | 0.000201278 | 0.000298421 | 4.45326 × 10⁻⁵ | 6.95086 × 10⁻⁵ | 0.00072467 |
| Acidification | kg SO2 eq | 0.002352501 | 0.004387312 | 0.007905528 | 0.001185797 | 0.001850847 | 0.017681985 |
| Eutrophication | kg PO4—eq | 0.000531177 | 0.001008274 | 0.001495183 | 0.000232866 | 0.000363469 | 0.00363097 |
Table 15.
Impact of stage 3 broken down by activities for the manufacturing process of perforated stoppers of 2-pieces of 26 mm in diameter and 44 mm in length.
Table 15.
Impact of stage 3 broken down by activities for the manufacturing process of perforated stoppers of 2-pieces of 26 mm in diameter and 44 mm in length.
| | | Ink Marking | Silicone Coating | Waxing | Drying | Counting and Packaging | Total |
|---|
| Abiotic depletion | kg Sb eq | 3.66576 × 10⁻⁷ | 8.06203 × 10⁻⁷ | 2.18252 × 10⁻⁶ | 7.44507 × 10⁻⁸ | 1.16206 × 10⁻⁷ | 3.54596 × 10⁻⁶ |
| Abiotic depletion (fossil fuels) | MJ | 3.32520477 | 6.825955703 | 26.58505866 | 1.265626713 | 1.975449103 | 39.97729495 |
| Global warming (GWP100a) | kg CO2 eq | 0.29942208 | 0.562594226 | 0.839177953 | 0.122507465 | 0.191215356 | 2.014917081 |
| Ozone layer depletion (ODP) | kg CFC-11 eq | 3.48937 × 10⁻⁸ | 1.95653 × 10⁻⁷ | 7.6657 × 10⁻⁸ | 1.52933 × 10⁻⁸ | 2.38705 × 10⁻⁸ | 3.46367 × 10⁻⁸ |
| Human toxicity | kg 1.4-DB eq | 0.105072373 | 0.209094418 | 0.339365866 | 0.044310959 | 0.069162608 | 0.767006223 |
| Fresh water aquatic ecotox. | kg 1.4-DB eq | 0.103349234 | 0.20560664 | 0.292642674 | 0.043518935 | 0.06792638 | 0.713043863 |
| Marine aquatic ecotoxicity | kg 1.4-DB eq | 391.2179863 | 1043.809816 | 1287.826663 | 193.5307715 | 302.0718391 | 3218.457075 |
| Terrestrial ecotoxicity | kg 1.4-DB eq | 0.005952063 | 0.001391593 | 0.002016564 | 0.000394737 | 0.000616124 | 0.01037108 |
| Photochemical oxidation | kg C2H4 eq | 9.53368 × 10⁻⁵ | 0.000157716 | 0.000234918 | 3.55875 × 10⁻⁵ | 5.55467 × 10⁻⁵ | 0.000579106 |
| Acidification | kg SO2 eq | 0.001937313 | 0.00345472 | 0.006224117 | 0.000947611 | 0.001479075 | 0.014042836 |
| Eutrophication | kg PO4—eq | 0.000449642 | 0.000790828 | 0.001178395 | 0.000186092 | 0.00029046 | 0.002895417 |
Table 16.
Impact of stage 3 broken down by activities for the manufacturing process of 2-piece turning stoppers of 24 mm in diameter and 44 mm in length.
Table 16.
Impact of stage 3 broken down by activities for the manufacturing process of 2-piece turning stoppers of 24 mm in diameter and 44 mm in length.
| | | Ink Marking | Silicone Coating | Waxing | Drying | Counting and Packaging | Total |
|---|
| Abiotic depletion | kg Sb eq | 3.8197 × 10⁻⁷ | 9.98725 × 10⁻⁶ | 2.71244 × 10⁻⁶ | 8.9235 × 10⁻⁸ | 1.39282 × 10⁻⁷ | 4.32165 × 10⁻⁶ |
| Abiotic depletion (fossil fuels) | MJ | 3.714262026 | 8.377745836 | 32.96024856 | 1.516954549 | 2.367733291 | 48.93694427 |
| Global warming (GWP100a) | kg CO2 eq | 0.338064796 | 0.688251284 | 1.02209148 | 0.146834967 | 0.229186853 | 2.424429382 |
| Ozone layer depletion (ODP) | kg CFC-11 eq | 3.98266 × 10⁻⁸ | 2.42716 × 10⁻⁷ | 9.24551 × 10⁻⁸ | 1.83303 × 10⁻⁸ | 2.86107 × 10⁻⁸ | 4.21939 × 10⁻⁷ |
| Human toxicity | kg 1.4-DB eq | 0.119190935 | 0.255946583 | 0.414497754 | 0.053110218 | 0.082896901 | 0.925642391 |
| Fresh water aquatic ecotox. | kg 1.4-DB eq | 0.117208647 | 0.251683809 | 0.356252263 | 0.052160914 | 0.081415184 | 0.858720818 |
| Marine aquatic ecotoxicity | kg 1.4-DB eq | 455.8481318 | 1281.106819 | 1567.304201 | 231.9620636 | 362.0571892 | 3898.278405 |
| Terrestrial ecotoxicity | kg 1.4-DB eq | 0.005858016 | 0.001691112 | 0.002433836 | 0.000473124 | 0.000738473 | 0.011194562 |
| Photochemical oxidation | kg C2H4 eq | 0.000106196 | 0.00019279 | 0.000285836 | 4.26545 × 10⁻⁵ | 6.65771 × 10⁻⁵ | 0.000694053 |
| Acidification | kg SO2 eq | 0.002252817 | 0.004202281 | 0.007572119 | 0.001135787 | 0.001772789 | 0.016935794 |
| Eutrophication | kg PO4—eq | 0.000508569 | 0.000965751 | 0.001432125 | 0.000223046 | 0.00034814 | 0.00347763 |
Table 17.
Impact of stage 3 broken down by activities for the manufacturing process of turning stoppers of 2-pieces of 26 mm in diameter and 44 mm in length.
Table 17.
Impact of stage 3 broken down by activities for the manufacturing process of turning stoppers of 2-pieces of 26 mm in diameter and 44 mm in length.
| | | Ink Marking | Silicone Coating | Waxing | Drying | Counting and Packaging | Total |
|---|
| Abiotic depletion | kg Sb eq | 3.71742 × 10⁻⁷ | 8.74484 × 10⁻⁷ | 2.36019 × 10⁻⁶ | 8.33581 × 10⁻⁸ | 1.30109 × 10⁻⁷ | 3.81988 × 10⁻⁶ |
| Abiotic depletion (fossil fuels) | MJ | 3.540389412 | 7.471756116 | 28.81803365 | 1.417048464 | 2.211795222 | 43.45902287 |
| Global warming (GWP100a) | kg CO2 eq | 0.321234641 | 0.617759411 | 0.925509406 | 0.137164469 | 0.214092689 | 2.215760616 |
| Ozone layer depletion (ODP) | kg CFC-11 eq | 3.77256 × 10⁻⁸ | 2.11928 × 10⁻⁷ | 8.53306 × 10⁻⁸ | 1.7123 × 10⁻⁸ | 2.67264 × 10⁻⁸ | 3.78833 × 10⁻⁷ |
| Human toxicity | kg 1.4-DB eq | 0.113103466 | 0.229467166 | 0.373274436 | 0.049612398 | 0.077437341 | 0.842894806 |
| Fresh water aquatic ecotox. | kg 1.4-DB eq | 0.111229987 | 0.225633927 | 0.322901711 | 0.048725615 | 0.076053209 | 0.784544449 |
| Marine aquatic ecotoxicity | kg 1.4-DB eq | 429.2607484 | 1142.563523 | 1421.374297 | 216.685125 | 338.2122321 | 3548.095925 |
| Terrestrial ecotoxicity | kg 1.4-DB eq | 0.005803787 | 0.001537816 | 0.002243281 | 0.000441964 | 0.000689838 | 0.010716686 |
| Photochemical oxidation | kg C2H4 eq | 0.000101307 | 0.000173314 | 0.000259334 | 3.98453 × 10⁻⁵ | 6.21924 × 10⁻⁵ | 0.000635992 |
| Acidification | kg SO2 eq | 0.002122634 | 0.003814283 | 0.006871913 | 0.001060985 | 0.001656034 | 0.015525848 |
| Eutrophication | kg PO4—eq | 0.000483003 | 0.000869852 | 0.001302323 | 0.000208356 | 0.000325212 | 0.003188745 |
Table 18.
Impacts generated by each stage of the activity of manufacturing 2-piece stoppers with dimensions of 24 × 44 by drilling.
Table 18.
Impacts generated by each stage of the activity of manufacturing 2-piece stoppers with dimensions of 24 × 44 by drilling.
| Impact Category | Unit | Stage 1 | Stage 2 | Stage 3 | Total |
|---|
| Abiotic depletion | kg Sb eq | 0.0026 | 0.0002 | 5.00 × 10⁻⁶ | 0.002805 |
| Abiotic depletion (fossil fuels) | MJ | 9066.7 | 1572.9 | 51.094 | 10690.694 |
| Global warming (GWP100a) | kg CO2 eq | 837.63 | 137.57 | 2.5313 | 977.7313 |
| Ozone layer depletion (ODP) | kg CFC-11 eq | 8.00 × 10⁻⁶ | 2.00 × 10⁻⁵ | 4.00 × 10⁻⁷ | 0.0001004 |
| Human toxicity | kg 1.4-DB eq | 436.32 | 53.553 | 0.9664 | 490.8394 |
| Fresh water aquatic ecotox. | kg 1.4-DB eq | 478.66 | 46.824 | 0.8966 | 526.3806 |
| Marine aquatic ecotoxicity | kg 1.4-DB eq | 1.00 × 10⁶ | 204087 | 4070 | 1208157 |
| Terrestrial ecotoxicity | kg 1.4-DB eq | 8.5077 | 0.4191 | 0.0117 | 8.9385 |
| Photochemical oxidation | kg C2H4 eq | 0.3308 | 0.0423 | 0.0007 | 0.3738 |
| Acidification | kg SO2 eq | 4.684 | 1.0179 | 0.0177 | 5.7196 |
| Eutrophication | kg PO4—eq | 2.0394 | 0.2046 | 0.0036 | 2.2476 |
Table 19.
Impacts generated by each stage of the 2-piece stopper manufacturing activity with dimensions of 26 × 44 by drilling.
Table 19.
Impacts generated by each stage of the 2-piece stopper manufacturing activity with dimensions of 26 × 44 by drilling.
| Impact Category | Unit | Stage 1 | Stage 2 | Stage 3 | Total |
|---|
| Abiotic depletion | kg Sb eq | 0.0027 | 0.0026 | 0.0002 | 0.0055 |
| Abiotic depletion (fossil fuels) | MJ | 10545 | 9066.5 | 1438.8 | 21050.3 |
| Global warming (GWP100a) | kg CO2 eq | 963.29 | 837.61 | 123.66 | 1924.56 |
| Ozone layer depletion (ODP) | kg CFC-11 eq | 0.0001 | 8.00 × 10⁻⁵ | 2.00 × 10⁻⁵ | 0.0002 |
| Human toxicity | kg 1.4-DB eq | 485.84 | 436.31 | 48.759 | 970.909 |
| Fresh water aquatic ecotox. | kg 1.4-DB eq | 521.11 | 478.65 | 41.744 | 1041.504 |
| Marine aquatic ecotoxicity | kg 1.4-DB eq | 2.00 × 10⁶ | 1.00 × 10⁶ | 181260 | 3181260 |
| Terrestrial ecotoxicity | kg 1.4-DB eq | 8.8906 | 8.5077 | 0.3725 | 17.7708 |
| Photochemical oxidation | kg C2H4 eq | 0.3698 | 0.3308 | 0.0384 | 0.739 |
| Acidification | kg SO2 eq | 5.6053 | 4.6839 | 0.9073 | 11.1965 |
| Eutrophication | kg PO4—eq | 2.2255 | 2.0394 | 0.1832 | 4.4481 |
Table 20.
Impacts generated by each stage of the activity of manufacturing 2-piece stopper with dimensions of 24 × 44 by turning.
Table 20.
Impacts generated by each stage of the activity of manufacturing 2-piece stopper with dimensions of 24 × 44 by turning.
| Impact Category | Unit | Stage 1 | Stage 2 | Stage 3 | Total |
|---|
| Abiotic depletion | kg Sb eq | 0.003 | 0.0028 | 0.0002 | 0.006 |
| Abiotic depletion (fossil fuels) | MJ | 11750 | 9917.7 | 1783.1 | 23450.8 |
| Global warming (GWP100a) | kg CO2 eq | 1076.8 | 916.47 | 157.92 | 2151.19 |
| Ozone layer depletion (ODP) | kg CFC-11 eq | 0.0001 | 9.00 × 10⁻⁵ | 2.00 × 10⁻⁵ | 0.00021 |
| Human toxicity | kg 1.4-DB eq | 540.59 | 478.75 | 60.913 | 1080.253 |
| Fresh water aquatic ecotox. | kg 1.4-DB eq | 580.34 | 525.43 | 54.052 | 1159.822 |
| Marine aquatic ecotoxicity | kg 1.4-DB eq | 2.00 × 10⁶ | 1.00 × 10⁶ | 236234 | 3236234 |
| Terrestrial ecotoxicity | kg 1.4-DB eq | 9.8037 | 9.3079 | 0.4847 | 19.5963 |
| Photochemical oxidation | kg C2H4 eq | 0.4042 | 0.3553 | 0.0482 | 0.8077 |
| Acidification | kg SO2 eq | 6.3062 | 5.114 | 1.1753 | 12.5955 |
| Eutrophication | kg PO4—eq | 2.4766 | 2.2376 | 0.2355 | 4.9497 |
Table 21.
Impacts generated by each stage of the 2-piece stopper manufacturing activity with dimensions of 26 × 44 by turning.
Table 21.
Impacts generated by each stage of the 2-piece stopper manufacturing activity with dimensions of 26 × 44 by turning.
| Impact Category | Unit | Stage 1 | Stage 2 | Stage 3 | Total |
|---|
| Abiotic depletion | kg Sb eq | 0.003 | 0.0028 | 0.0002 | 0.006 |
| Abiotic depletion (fossil fuels) | MJ | 11510 | 9917.6 | 1549 | 22976.6 |
| Global warming (GWP100a) | kg CO2 eq | 1053 | 916.46 | 134.32 | 2103.78 |
| Ozone layer depletion (ODP) | kg CFC-11 eq | 0.0001 | 9.00 × 10⁻⁵ | 2.00 × 10⁻⁵ | 0.00021 |
| Human toxicity | kg 1.4-DB eq | 532.2 | 478.74 | 52.615 | 1063.555 |
| Fresh water aquatic ecotox. | kg 1.4-DB eq | 571.74 | 525.42 | 45.531 | 1142.691 |
| Marine aquatic ecotoxicity | kg 1.4-DB eq | 2.00 × 10⁶ | 1.00 × 10⁶ | 198097 | 3198097 |
| Terrestrial ecotoxicity | kg 1.4-DB eq | 9.7255 | 9.3079 | 0.4069 | 19.4403 |
| Photochemical oxidation | kg C2H4 eq | 0.3975 | 0.3553 | 0.0415 | 0.7943 |
| Acidification | kg SO2 eq | 6.1192 | 5.1139 | 0.9898 | 12.2229 |
| Eutrophication | kg PO4—eq | 2.4401 | 2.2375 | 0.1994 | 4.877 |
Table 22.
Global impact of each geometry and production methodology, by impact category and for one cork stopper unit.
Table 22.
Global impact of each geometry and production methodology, by impact category and for one cork stopper unit.
| | | 24 × 44 2P Perforated | 26 × 44 2P Perforated | 24 × 44 2P Turned | 26 × 44 2P Turned |
|---|
| Abiotic depletion | kg Sb eq | 1.042 × 10⁻⁵ | 1.22135 × 10⁻⁵ | 1.14442 × 10⁻⁵ | 1.33914 × 10⁻⁵ |
| Abiotic depletion (fossil fuels) | MJ | 40.72334221 | 47.14373321 | 44.75774719 | 51.45638001 |
| Global warming (GWP100a) | kg CO2 eq | 3.724415328 | 4.306441809 | 4.101842571 | 4.70746365 |
| Ozone layer depletion (ODP) | kg CFC-11 eq | 3.91305 × 10⁻⁷ | 4.51152 × 10⁻⁷ | 4.30407 × 10⁻⁷ | 4.91866 × 10⁻⁷ |
| Human toxicity | kg 1.4-DB eq | 1.869723178 | 2.1719775 | 2.059226375 | 2.37924588 |
| Fresh water aquatic ecotox. | kg 1.4-DB eq | 2.005094121 | 2.32964494 | 2.210640027 | 2.555991092 |
| Marine aquatic ecotoxicity | kg 1.4-DB eq | 5844.414344 | 6753.106912 | 6450.098008 | 7397.773112 |
| Terrestrial ecotoxicity | kg 1.4-DB eq | 0.034049143 | 0.039746083 | 0.037344855 | 0.043478517 |
| Photochemical oxidation | kg C2H4 eq | 0.001424115 | 0.00165329 | 0.001539834 | 0.001776912 |
| Acidification | kg SO2 eq | 0.021787279 | 0.025058952 | 0.024022004 | 0.027356533 |
| Eutrophication | kg PO4—eq | 0.008561986 | 0.009949196 | 0.009433858 | 0.010908692 |
| Publisher’s Note: MDPI stays neutral with regard to jurisdictional claims in published maps and institutional affiliations. |
© 2021 by the authors. Licensee MDPI, Basel, Switzerland. This article is an open access article distributed under the terms and conditions of the Creative Commons Attribution (CC BY) license (https://creativecommons.org/licenses/by/4.0/).


 ,
, 


