
Trends in the Use of Low and No-Calorie Sweeteners in Non-Alcoholic Beverages in Slovenia

 ,
,  , ,
, ,  ,
, 

Abstract
1. Introduction
2. Materials and Methods
2.1. Data Collection and Categorization
2.2. Data Processing and Statistical Analyses
3. Results
4. Discussion
5. Conclusions
Author Contributions
Funding
Institutional Review Board Statement
Informed Consent Statement
Data Availability Statement
Acknowledgments
Conflicts of Interest
References
- Tahmassebi, J.F.; BaniHani, A. Impact of soft drinks to health and economy: A critical review. Eur. Arch. Paediatr. Dent. 2020, 21, 109–117. [Google Scholar] [CrossRef] [PubMed]
- Zupanič, N.; Hristov, H.; Gregorič, M.; Blaznik, U.; Delfar, N.; Koroušić Seljak, B.; Ding, E.L.; Fidler Mis, N.; Pravst, I. Total and Free Sugars Consumption in a Slovenian Population Representative Sample. Nutrients 2020, 12, 1729. [Google Scholar] [CrossRef] [PubMed]
- Mela, D.J.; Woolner, E.M. Perspective: Total, Added, or Free? What Kind of Sugars Should We Be Talking About? Adv. Nutr. 2018, 9, 63–69. [Google Scholar] [CrossRef]
- World Health Organization. Diet, Nutrition and the Prevention of Chronic Diseases—Report of the Joint WHO/FAO Expert Consultation; World Health Organization: Geneva, Switzerland, 2003. [Google Scholar]
- World Health Organization. Guideline: Sugars Intake for Adults and Children; World Health Organization: Geneva, Switzerland, 2015. [Google Scholar]
- Flegal, K.M.; Carroll, M.D.; Ogden, C.L.; Johnson, C.L. Prevalence and trends in obesity among US adults, 1999–2000. JAMA 2002, 288, 1723–1727. [Google Scholar] [CrossRef]
- Zupanic, N.; Miklavec, K.; Kusar, A.; Zmitek, K.; Fidler Mis, N.; Pravst, I. Total and Free Sugar Content of Pre-Packaged Foods and Non-Alcoholic Beverages in Slovenia. Nutrients 2018, 10, 151. [Google Scholar] [CrossRef] [PubMed]
- Popkin, B.M.; Hawkes, C. Sweetening of the global diet, particularly beverages: Patterns, trends, and policy responses. Lancet Diabetes Endocrinol. 2016, 4, 174–186. [Google Scholar] [CrossRef]
- Fujimaru, T.; Park, J.H.; Lim, J. Sensory characteristics and relative sweetness of tagatose and other sweeteners. J. Food Sci. 2012, 77, 1750–3841. [Google Scholar] [CrossRef] [PubMed]
- Samaniego-Vaesken, M.D.L.; Ruiz, E.; Partearroyo, T.; Aranceta-Bartrina, J.; Gil, Á.; González-Gross, M.; Ortega, R.M.; Serra-Majem, L.; Varela-Moreiras, G. Added Sugars and Low- and No-Calorie Sweeteners in a Representative Sample of Food Products Consumed by the Spanish ANIBES Study Population. Nutrients 2018, 10, 1265. [Google Scholar] [CrossRef]
- Antenucci, R.G.; Hayes, J.E. Nonnutritive sweeteners are not supernormal stimuli. Int. J. Obes. 2015, 39, 254–259. [Google Scholar] [CrossRef]
- Johnston, C.A.; Stevens, B.; Foreyt, J.P. The Role of Low-calorie Sweeteners in Diabetes. Eur. Endocrinol. 2013, 9, 96–98. [Google Scholar] [CrossRef]
- National Institute of Public Health. Zdravstveni Statistični Letopis 2018. Available online: https://www.nijz.si/sl/publikacije/zdravstveni-statisticni-letopis-2018 (accessed on 27 October 2020).
- National Institute of Public Health. Različni Vidiki Prehranjevanja Prebivalcev Slovenije. Available online: https://www.nijz.si/sites/www.nijz.si/files/publikacije-datoteke/razlicni_vidiki_prehranjevanja_prebivalcev_slovenije.pdf (accessed on 2 December 2020).
- Sambra, V.; Lopez-Arana, S.; Caceres, P.; Abrigo, K.; Collinao, J.; Espinoza, A.; Valenzuela, S.; Carvajal, B.; Prado, G.; Peralta, R.; et al. Overuse of Non-caloric Sweeteners in Foods and Beverages in Chile: A Threat to Consumers’ Free Choice? Front. Nutr. 2020, 7, 68. [Google Scholar] [CrossRef] [PubMed]
- International Sweeteners Association. Low Calorie Sweeteners: Role and Benefits—A Guide to the Science of Low Calorie Sweeteners. Available online: https://www.sweeteners.org/category/14/article/12/isa-booklet (accessed on 2 November 2020).
- Dewinter, L.; Casteels, K.; Corthouts, K.; Van de Kerckhove, K.; Van der Vaerent, K.; Vanmeerbeeck, K.; Matthys, C. Dietary intake of non-nutritive sweeteners in type 1 diabetes mellitus children. Food Addit. Contam Part A Chem. Anal. Control. Expo. Risk Assess. 2016, 33, 19–26. [Google Scholar] [CrossRef]
- Garavaglia, M.B.; Rodríguez García, V.; Zapata, M.E.; Rovirosa, A.; González, V.; Flax Marcó, F.; Carmuega, E. Non-nutritive sweeteners: Children and adolescent consumption and food sources. Arch. Argent. Pediatr. 2018, 116, 186–191. [Google Scholar] [PubMed]
- Dusemund, B.; Gilbert, J.; Gott, D.; Kenigswald, H.; König, J.; Lambré, C.; Leblanc, J.C.; Mortensen, A.; Tobback, P. Food additives and nutrient sources added to food: Developments since the creation of EFSA. EFSA J. 2012, 10, 7. [Google Scholar] [CrossRef]
- Serra-Majem, L.; Raposo, A.; Aranceta-Bartrina, J.; Varela-Moreiras, G.; Logue, C.; Laviada, H.; Socolovsky, S.; Pérez-Rodrigo, C.; Aldrete-Velasco, J.A.; Meneses Sierra, E.; et al. Ibero-American consensus on low- and no-calorie sweeteners: Safety, nutritional aspects and benefits in food and beverages. Nutrients 2018, 10, 818. [Google Scholar] [CrossRef] [PubMed]
- Ruiz-Ojeda, F.J.; Plaza-Díaz, J.; Sáez-Lara, M.J.; Gil, A. Effects of Sweeteners on the Gut Microbiota: A Review of Experimental Studies and Clinical Trials. Adv. Nutr. 2019, 10, S31–S48. [Google Scholar] [CrossRef] [PubMed]
- De Koning, L.; Malik, V.S.; Rimm, E.B.; Willett, W.C.; Hu, F.B. Sugar-sweetened and artificially sweetened beverage consumption and risk of type 2 diabetes in men. Am. J. Clin. Nutr. 2011, 93, 1321–1327. [Google Scholar] [CrossRef]
- Zupanic, N.; Hribar, M.; Fidler Mis, N.; Pravst, I. Free Sugar Content in Pre-Packaged Products: Does Voluntary Product Reformulation Work in Practice? Nutrients 2019, 11, 2577. [Google Scholar] [CrossRef]
- The European Union. Directive 2000/13/EC Of the European Parliament and of The Council of 20 March 2000 on the approximation of the laws of the Member States relating to the labelling, presentation and advertising of foodstuffs. Off. J. Eur. Communities 2000, 109, 29–42. [Google Scholar]
- Dunford, E.; Webster, J.; Metzler, A.B.; Czernichow, S.; Ni Mhurchu, C.; Wolmarans, P.; Snowdon, W.; L’Abbe, M.; Li, N.; Maulik, P.K.; et al. International collaborative project to compare and monitor the nutritional composition of processed foods. Eur. J. Prev. Cardiol. 2012, 19, 1326–1332. [Google Scholar] [CrossRef]
- Dunford, E.K.; Taillie, L.S.; Miles, D.R.; Eyles, H.; Tolentino-Mayo, L.; Ng, S.W. Non-Nutritive Sweeteners in the Packaged Food Supply—An Assessment across 4 Countries. Nutrients 2018, 10, 257. [Google Scholar] [CrossRef] [PubMed]
- Nutrition Institute. Composition and Labelling Information System as a Tool for Monitoring of the Food Supply. Available online: https://www.nutris.org/en/composition-and-labelling-information-system (accessed on 12 December 2020).
- Pivk Kupirovič, U.; Miklavec, K.; Hribar, M.; Kušar, A.; Žmitek, K.; Pravst, I. Nutrient Profiling is Needed to Improve the Nutritional Quality of the Foods Labelled with Health-Related Claims. Nutrients 2019, 11, 287. [Google Scholar] [CrossRef]
- Republic of Slovenia. Rules on Fruit Juices and Certain Similar Products Intended for Human Consumption; Official Gazette of the Republic of Slovenia: Ljubljana, Slovenia, 2013; pp. 9653–9656.
- Agresti, A.; Brent, A.C. Approximate is better than “Exact” for interval estimation of binomial proportions. Am. Stat. 1998, 52, 119–126. [Google Scholar]
- Ishak, W.W.; Ugochukwu, C.; Bagot, K.; Khalili, D.; Zaky, C. Energy drinks: Psychological effects and impact on well-being and quality of life-a literature review. Innov. Clin. Neurosci. 2012, 9, 25–34. [Google Scholar] [PubMed]
- Styburski, D.; Dec, K.; Baranowska-Bosiacka, I.; Goschorska, M.; Hołowko, J.; Żwierełło, W.; Skórka-Majewicz, M.; Janda, K.; Rosengardt, A.; Gutowska, I. Can Functional Beverages Serve as a Substantial Source of Macroelements and Microelements in Human Nutrition?—Analysis of Selected Minerals in Energy and Isotonic Drinks. Biol Trace Elem. Res. 2020, 197, 341–348. [Google Scholar] [CrossRef]
- O’Brien-Nabors, L. Alternative Sweeteners, 3rd ed.; Marcel Dekker: New York, NY, USA, 2001; 541p. [Google Scholar]
- Buffini, M.; Goscinny, S.; Van Loco, J.; Nugent, A.P.; Walton, J.; Flynn, A.; Gibney, M.J.; McNulty, B.A. Dietary intakes of six intense sweeteners by Irish adults. Food Addit. Contam. Part A Chem. Anal. Control Expo. Risk Assess. 2018, 35, 425–438. [Google Scholar] [CrossRef] [PubMed]
- Le Donne, C.; Mistura, L.; Goscinny, S.; Janvier, S.; Cuypers, K.; D’Addezio, L.; Sette, S.; Catasta, G.; Ferrari, M.; Piccinelli, R.; et al. Assessment of dietary intake of 10 intense sweeteners by the Italian population. Food Chem. Toxicol. 2017, 102, 186–197. [Google Scholar] [CrossRef] [PubMed]
- Ng, S.W.; Slining, M.M.; Popkin, B.M. Use of caloric and noncaloric sweeteners in US consumer packaged foods, 2005–2009. J. Acad. Nutr. Diet. 2012, 112, 1828–1834. [Google Scholar] [CrossRef]
- Husøy, T.; Mangschou, B.; Fotland, T.; Kolset, S.O.; Nøtvik Jakobsen, H.; Tømmerberg, I.; Bergsten, C.; Alexander, J.; Frost Andersen, L. Reducing added sugar intake in Norway by replacing sugar sweetened beverages with beverages containing intense sweeteners—A risk benefit assessment. Food Chem. Toxicol. 2008, 46, 3099–3105. [Google Scholar] [CrossRef] [PubMed]
- Borges, M.C.; Louzada, M.L.; de Sá, T.H.; Laverty, A.A.; Parra, D.C.; Garzillo, J.M.F.; Monteiro, C.A.; Millett, C. Artificially Sweetened Beverages and the Response to the Global Obesity Crisis. PLoS Med. 2017, 14, e1002195. [Google Scholar] [CrossRef] [PubMed]
- Piernas, C.; Ng, S.W.; Popkin, B. Trends in purchases and intake of foods and beverages containing caloric and low-calorie sweeteners over the last decade in the United States. Pediatr. Obes. 2013, 8, 294–306. [Google Scholar] [CrossRef] [PubMed]
- Auerbach, B.J.; Dibey, S.; Vallila-Buchman, P.; Kratz, M.; Krieger, J. Review of 100% Fruit Juice and Chronic Health Conditions: Implications for Sugar-Sweetened Beverage Policy. Adv. Nutr. 2018, 9, 78–85. [Google Scholar] [CrossRef] [PubMed]
- Durán Agüero, S.; Angarita Dávila, L.; Escobar Contreras, M.C.; Rojas Gómez, D.; de Assis Costa, J. Noncaloric Sweeteners in Children: A Controversial Theme. BioMed Res. Int. 2018, 2018, 4806534. [Google Scholar] [CrossRef]
- Foreyt, J.; Kleinman, R.; Brown, R.J.; Lindstrom, R. The use of low-calorie sweeteners by children: Implications for weight management. J. Nutr. 2012, 142, S1155–S1162. [Google Scholar] [CrossRef]
- Gupta, P.; Gupta, N.; Pawar, A.P.; Birajdar, S.S.; Natt, A.S.; Singh, H.P. Role of sugar and sugar substitutes in dental caries: A review. ISRN Dentistry 2013, 2013, 519421. [Google Scholar] [CrossRef]
- Fisberg, M.; Kovalskys, I.; Gómez, G.; Rigotti, A.; Sanabria, L.Y.C.; García, M.C.Y.; Torres, R.G.P.; Herrera-Cuenca, M.; Zimberg, I.Z.; Koletzko, B.; et al. Total and Added Sugar Intake: Assessment in Eight Latin American Countries. Nutrients 2018, 10, 389. [Google Scholar] [CrossRef] [PubMed]
- Bandy, L.K.; Scarborough, P.; Harrington, R.A.; Rayner, M.; Jebb, S.A. Reductions in sugar sales from soft drinks in the UK from 2015 to 2018. BMC Med. 2020, 18, 20. [Google Scholar] [CrossRef] [PubMed]
- Ministry of Health of Republic of Slovenia. Resolution on the National Programme on Nutrition and Physical Activity 2015–2025; Ministry of Health: Ljubljana, Slovenia, 2015.

| 2017 | 2019 | Z–Test Statistics | ||||
|---|---|---|---|---|---|---|
| Total | Added LNCS | Total | Added LNCS | Added LNCS | ||
| N (%) | N (%) | N (%) | N (%) | % Change | p-Value | |
| Total | 1043 (100) | 138 (13.2) | 1221 (100) | 189 (15.5) | 17.1 | ns |
| Soft drinks | 555 (53.2) | 93 (16.8) | 601 (49.2) | 118 (19.6) | 17 | ns |
| Juices | 267 (25.6) | 330 (27.0) | ||||
| Nectars | 135 (12.9) | 16 (11.9) | 158 (12.9) | 11 (7.0) | −40.9 | ns |
| Energy Drinks | 65 (6.2) | 11 (16.9) | 110 (9.0) | 46 (41.8) | 147 | <0.01 |
| Sports Drinks | 21 (2.0) | 18 (85.7) | 22 (1.8) | 14 (63.6) | −25.8 | ns |
| 2017 (N = 138) | 2019 (N = 189) | Z–Test Statistics | |||
|---|---|---|---|---|---|
| N (%) | 95% CI | N (%) | 95% CI | p-Value | |
| Sole LNCS | 40 (29) | 22.1–37.0 | 73 (38.6) | 32.0–45.7 | ns |
| Mix of LNCS | 98 (71) | 63.0–77.9 | 116 (61.4) | 54.3–68.0 | ns |
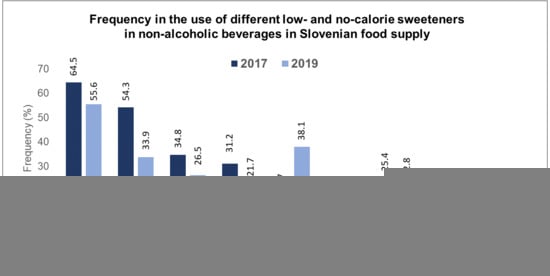
| Acesulfame K | 89 (64.5) | 56.2–72.0 | 105 (55.6) | 48.4–62.5 | ns |
| Aspartame | 75 (54.3) | 46.0–62.4 | 64 (33.9) | 27.5–40.9 | <0.01 |
| Cyclamates | 48 (34.8) | 27.3–43.0 | 50 (26.5) | 20.7–33.2 | ns |
| Saccharin | 43 (31.2) | 24.0–39.3 | 41 (21.7) | 16.4–28.1 | 0.05 |
| Sucralose | 23 (16.7) | 11.4–23.8 | 72 (38.1) | 31.5–45.2 | <0.01 |
| Neohesperidin DC | 5 (2.6) | 1.1–6.0 | |||
| Steviol glycosides | 35 (25.4) | 18.8–33.2 | 43 (22.8) | 17.4–29.2 | ns |
| Xylitol | 1 (0.5) | 0.1–2.9 | |||
| Erythritol | 1 (0.7) | 0.1–4.0 | 3 (1.6) | 0.5–4.6 | ns |
| Added Sugar | Added LNCS | 2017 | 2019 | Energy Value (kJ/100 mL) | Sugar Content (g/100 mL) | |||||
|---|---|---|---|---|---|---|---|---|---|---|
| 2017 | 2019 | p-Value | 2017 | 2019 | p-Value | |||||
| N (%) | N (%) | Mean (SD) | Mean (SD) | Mean (SD) | Mean (SD) | |||||
| Total | 1043 (100) | 1221 (100) | 152 (66.5) | 147.9 (70.9) | ns | 8.0 (3.6) | 7.6 (3.8) | 0.03 | ||
| All | ✖ | ✖ | 300 (28.7%) | 398 (32.6%) | 174.8 (69.1) | 174.9 (67.6) | ns | 8.3 (3.8) | 8.2 (3.8) | ns |
| ✔ | ✖ | 605 (58.0%) | 634 (52.9%) | 161.8 (50.8) | 159.0 (52.7) | ns | 8.9 (2.7) | 8.7 (2.8) | ns | |
| ✖ | ✔ | 59 (5.7%) | 97 (7.9%) | 22.3 (37.9) | 14.3 (27.9) | ns | 1.0 (2.1) | 0.4 (1.4) | ns | |
| ✔ | ✔ | 79 (7.6%) | 92 (7.5%) | 92.8 (28.1) | 96.2 (40.0) | ns | 4.8 (1.5) | 5.1 (2.3) | ns | |
| Soft drinks | ✖ | ✖ | 26 | 43 | 60.2 (2.5) | 70 (55.4) | ns | 2.5 (3.5) | 2.4 (2.5) | ns |
| ✔ | ✖ | 436 | 440 | 146.3 (8.2) | 142.5 (50.9) | ns | 8.2 (2.7) | 7.9 (2.7) | ns | |
| ✖ | ✔ | 39 | 50 | 4.4 (4.8) | 5.8 (8.0) | ns | 0.1 (0.2) | 0.2 (0.8) | ns | |
| ✔ | ✔ | 54 | 68 | 90.4 (29.7) | 87.5 (35.1) | ns | 4.9 (1.6) | 4.7 (2.0) | ns | |
| Juices | ✖ | ✖ | 267 | 330 | 186.7 (57.0) | 190.5 (54.8) | ns | 8.8 (3.3) | 9.1 (3.1) | ns |
| ✔ | ✖ | |||||||||
| ✖ | ✔ | |||||||||
| ✔ | ✔ | |||||||||
| Nectars | ✖ | ✖ | 5 | 23 | 135 (108) | 141.8 (75.0) | 7.8 (6.6) | 6.8 (4.3) | ||
| ✔ | ✖ | 114 | 124 | 203.3 (29.1) | 198.8 (28.6) | ns | 10.6 (1.6) | 10.4 (1.8) | ns | |
| ✖ | ✔ | 10 | 6 | 104.7 (5.4) | 116.5 (23.1) | 5.6 (0.4) | 5.2 (0.7) | |||
| ✔ | ✔ | 6 | 5 | 125.5 (29.1) | 117.2 (16.0) | 6.5 (1.6) | 6.0 (0.6) | |||
| Energy drinks | ✖ | ✖ | 2 | 2 | 240.0 | 203 (52.3) | 13.0 | 11.4 (2.3) | ||
| ✔ | ✖ | 52 | 62 | 203.8 (28.7) | 203.1 (31.4) | ns | 11.4 (1.6) | 11.3 (1.8) | ns | |
| ✖ | ✔ | 8 | 36 | 11.5 (4.7) | 10.6 (7.2) | ns | ns | |||
| ✔ | ✔ | 3 | 10 | 72.7 (7.2) | 153.9 (45.6) | 3.7 (0.4) | 8.3 (2.7) | |||
| Sports drinks | ✖ | ✖ | ||||||||
| ✔ | ✖ | 3 | 8 | 102.7 (26.5) | 104.5 (16.3) | 5.1 (1.2) | 5.3 (0.7) | |||
| ✖ | ✔ | 2 | 5 | 2.5 (3.5) | 4.6 (2.6) | |||||
| ✔ | ✔ | 16 | 9 | 92.1 (12.3) | 86 13.7) | ns | 4.2 (0.4) | 3.9 (0.2) | ns | |
Publisher’s Note: MDPI stays neutral with regard to jurisdictional claims in published maps and institutional affiliations. |
© 2021 by the authors. Licensee MDPI, Basel, Switzerland. This article is an open access article distributed under the terms and conditions of the Creative Commons Attribution (CC BY) license (http://creativecommons.org/licenses/by/4.0/).
Share and Cite
Hafner, E.; Hribar, M.; Hristov, H.; Kušar, A.; Žmitek, K.; Roe, M.; Pravst, I. Trends in the Use of Low and No-Calorie Sweeteners in Non-Alcoholic Beverages in Slovenia. Foods 2021, 10, 387. https://doi.org/10.3390/foods10020387
Hafner E, Hribar M, Hristov H, Kušar A, Žmitek K, Roe M, Pravst I. Trends in the Use of Low and No-Calorie Sweeteners in Non-Alcoholic Beverages in Slovenia. Foods. 2021; 10(2):387. https://doi.org/10.3390/foods10020387
Chicago/Turabian StyleHafner, Edvina, Maša Hribar, Hristo Hristov, Anita Kušar, Katja Žmitek, Mark Roe, and Igor Pravst. 2021. "Trends in the Use of Low and No-Calorie Sweeteners in Non-Alcoholic Beverages in Slovenia" Foods 10, no. 2: 387. https://doi.org/10.3390/foods10020387
APA StyleHafner, E., Hribar, M., Hristov, H., Kušar, A., Žmitek, K., Roe, M., & Pravst, I. (2021). Trends in the Use of Low and No-Calorie Sweeteners in Non-Alcoholic Beverages in Slovenia. Foods, 10(2), 387. https://doi.org/10.3390/foods10020387