
Influence of Different Types of Polysaccharide-Based Coatings on the Storage Stability of Fresh-Cut Kiwi Fruit: Assessing the Physicochemical, Antioxidant and Phytochemical Properties

 ,
,
Abstract
:1. Introduction
2. Materials and Methods
2.1. Materials
2.1.1. Preparation of Coatings
2.1.2. Preparation of Fruit
2.1.3. Coating of Fresh-cut Kiwi Slices
2.1.4. Storage of Coated Fresh-Cut Kiwi Slices
2.2. Physicochemical Properties
2.3. Total Phenolic Content
2.4. Antioxidant Properties
2.4.1. 2,2-Azino-bis-3-ethylbenzothiazoline-6-sulfonic Acid (ABTS) Scavenging Activity
2.4.2. 2,2-Diphenyl-1-picrylhydrazyl (DPPH) Radical Scavenging Activity
2.5. Lipid Peroxidation Assay
2.6. Quantification of Phenolic and Flavonoid Compounds by HPLC
2.6.1. Extraction
2.6.2. Analysis by HPLC
2.7. Statistical Analysis
3. Results
3.1. Weight Loss, TSS, Titratable Acidity, and Ascorbic Acid
3.2. Total Phenolic Content
3.3. Antioxidant Activity
3.4. Lipid Peroxidation Assay—Melondialdehyde Content
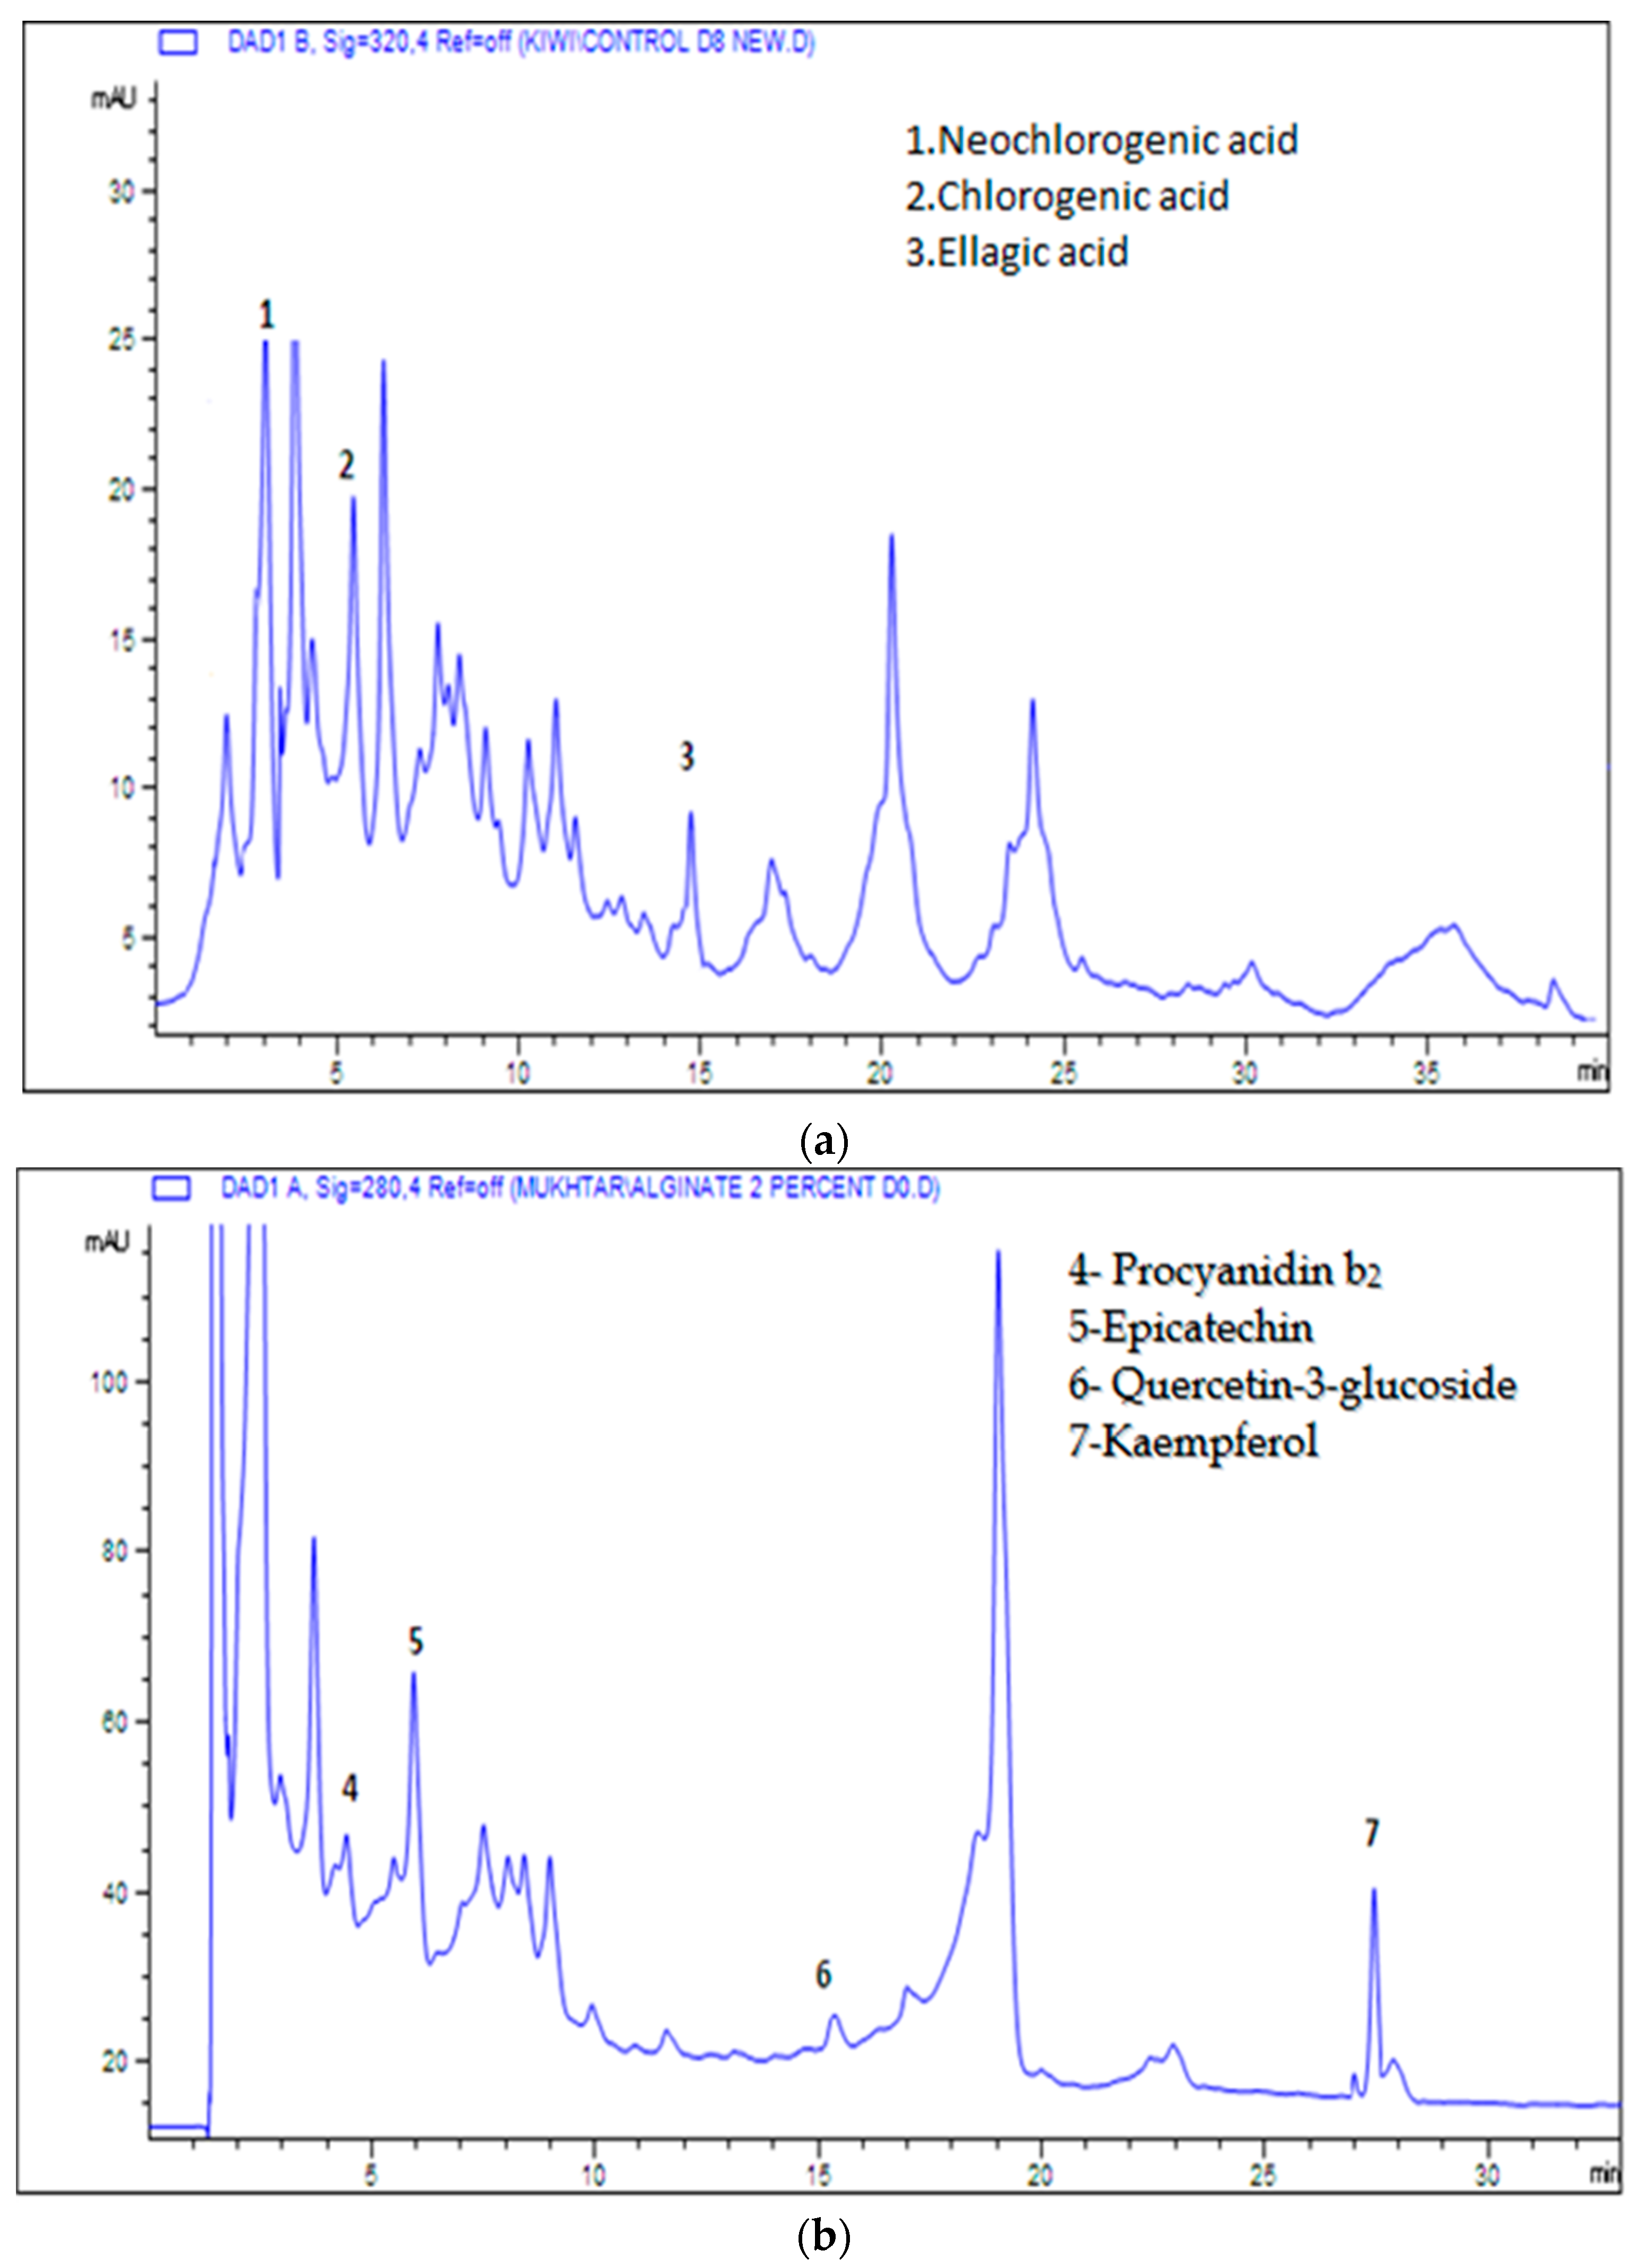
3.5. Analysis of Phenolic and Flavonoid Compounds
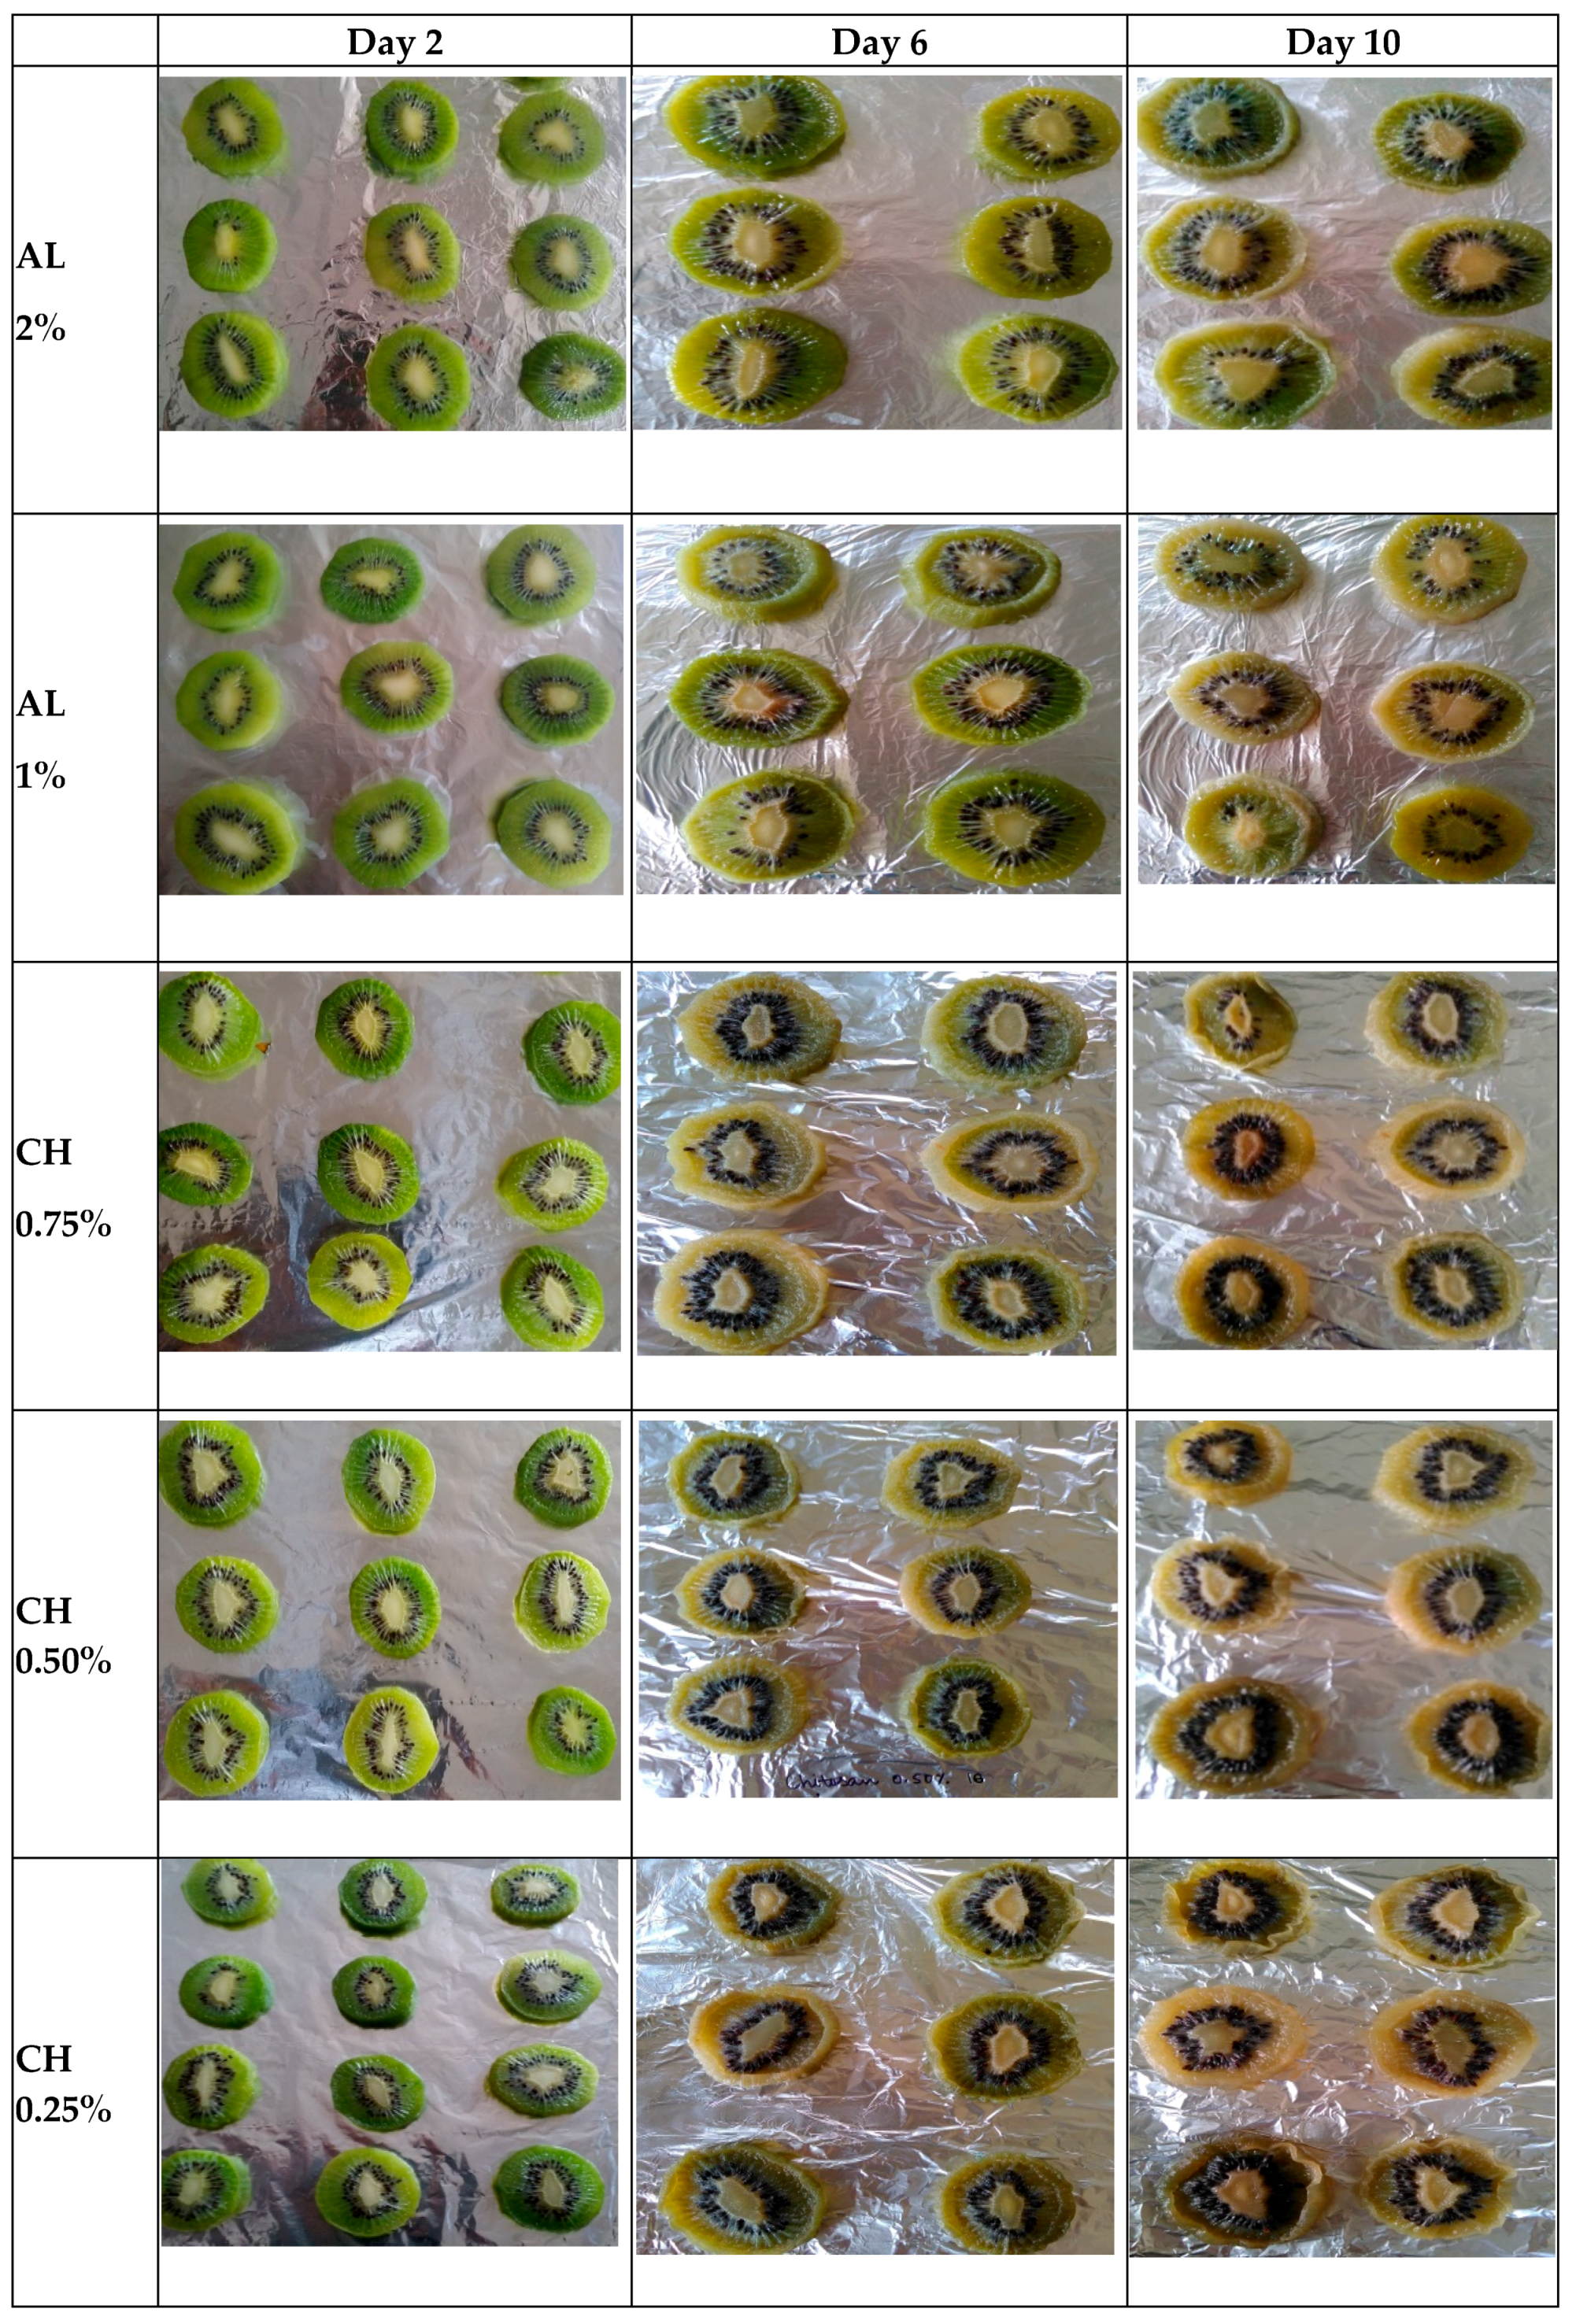
3.6. Appearance Changes during Storage
4. Conclusions
Author Contributions
Funding
Institutional Review Board Statement
Informed Consent Statement
Data Availability Statement
Acknowledgments
Conflicts of Interest
References
- Rico, D.; Martín-Diana, A.B.; Barat, J.M.; Barry-Ryan, C. Extending and measuring the quality of fresh-cut fruit and vegetables: A review. Trends Food Sci. Technol. 2007, 18, 373–386. [Google Scholar] [CrossRef] [Green Version]
- Benitez, S.; Achaerandio, I.; Pujola, M.; Sepulcre, F. Aloe veraas an alternative to traditional edible coatings used in fresh-cut fruits: A case of study with kiwifruit slices. Food Sci. Technol. 2015, 61, 184–193. [Google Scholar]
- Xu, S.; Chen, X.; Sun, D. Preservation of kiwifruit coated with an edible film at ambient temperature. J. Food Eng. 2001, 50, 211–216. [Google Scholar] [CrossRef]
- Jideani, A.I.O.; Anyasi, T.A.; Mchau, G.R.A.; Udoro, E.O.; Onipe, O.O. Processing and Preservation of Fresh-Cut Fruit and Vegetable Products; InTech Open: London, UK, 2017. [Google Scholar] [CrossRef]
- Dávila-Aviña, J.E.; Villa-Rodríguez, J.A.; Villegas-Ochoa, M.A.; Tortoledo-Ortiz, O.; Olivas, G.I.; Ayala-Zavala, J.F.; González-Aguilar, G.A. Effect of edible coatings on bioactive compounds and antioxidant capacity of tomatoes at different maturity stages. J. Food Sci. Technol. 2012, 51, 2706–2712. [Google Scholar] [CrossRef] [Green Version]
- Pagliarulo, C.; Sansone, F.; Moccia, S. Preservation of strawberries with an antifungal edible coating using peony extracts in chitosan. Food Biop. Technol. 2016, 9, 1951–1960. [Google Scholar] [CrossRef]
- Campos, C.A.; Gerschenson, L.N.; Flores, S.K. Development of edible films and coatings with antimicrobial activity. Food Bioprocess Technol. 2011, 4, 849–875. [Google Scholar] [CrossRef]
- Freitas, I.R.; Cortez-Vega, W.R.; Pizato, S.; Prentice-Hernandez, C.; Borges, C.D. Xantham gum as a carrier of preservative agents and calcium chloride applied on fresh cut apple. J. Food Saf. 2013, 33, 229–238. [Google Scholar] [CrossRef]
- Diaz-Mula, H.D.; Serrano, M.; Valero, D. Alginate coatings preserve fruit quality and bioactive compounds during storage of sweet cherry fruit. Food Bioprocess Technol. 2012, 5, 2990–2997. [Google Scholar] [CrossRef]
- Mastromatteo, M.; Mastromatteo, M.; Conte, A.; Del Nobile, M.A. Combined effect of active coating and MAP to prolong the shelf life of minimally processed kiwifruit (Actinidia deliciosa cv. Hayward). Food Res. Int. 2011, 44, 1224–1230. [Google Scholar] [CrossRef]
- Munoz, P.H.; Almenar, E.; Valle, V.D.; Velez, D.; Gavvara, R. Effect of chitosan coating combined with postharvest calcium treatment on strawberry (Fragaria ananassa) quality during refrigerated storage. Food Chem. 2008, 110, 428–435. [Google Scholar] [CrossRef] [PubMed]
- Ribeiro, C.; Vicente, A.A.; Teixeira, J.A.; Miranda, C. Optimization of edible coating composition to retard strawberry fruit senescence. Postharvest Biol. Technol. 2007, 44, 63–70. [Google Scholar] [CrossRef] [Green Version]
- Zhang, X.; Geng, X.D.; Jiang, H.J.; Li, J.R.; Huang, J.Y. Synthesis and characteristics of chitin and chitosan with the (2-hydroxy-3-trimethylammonium) propyl) functionality, and evaluation of their antioxidant activity in vitro. Carbohydr. Polym. 2012, 89, 486–491. [Google Scholar] [CrossRef]
- Ranganna, S. Manual of Analysis and Quality Control for Fruit and Vegetable Products; Tata McGraw-Hill Publishing Company Limited: New Delhi, India, 1997. [Google Scholar]
- Brandwilliams, W.; Cuvelier, M.E.; Berset, C. Use of a free-radical method to evaluate antioxidant activity. LWT-Food Sci. Technol. 1995, 28, 25–30. [Google Scholar] [CrossRef]
- Wright, J.R.; Colby, H.D.; Miles, P.R. Cytosolic factors which affect microsomal lipid peroxidation in lung and liver. Arch. Biochem. Biophys. 1981, 206, 294–304. [Google Scholar] [CrossRef]
- Wani, S.M.; Hussain, P.P.; Masoodi, F.A.; Ahmad, M.; Wani, T.A.; Gani, A.; Rather, S.A.; Suradkar, P. Evaluation of the composition of bioactive compounds and antioxidant activity in fourteen apricot varieties of north India. J. Agr. Sci. 2017, 9, 66–82. [Google Scholar] [CrossRef]
- Vivek, K.; Subbarao, K.V. Effect of edible chitosan coating on combined ultrasound and NaOCl treated kiwi fruits during refrigerated storage. Int. Food Res. J. 2018, 25, 101–108. [Google Scholar]
- Valero, D.; Diaz-Mula, H.M.; Zapata, P.J.; Guillen, F.; Romero, D.M.; Castillo, S.; Serrano, M. Effects of alginate edible coating on preserving fruit quality in four plum cultivars during postharvest storage. Postharvest Biol. Technol. 2013, 77, 1–6. [Google Scholar] [CrossRef]
- Yaman, O.; Bayoindirli, L. Effects of an edible coating and cold storage on shelf-life and quality of cherries. Lwt-Food Sci. Technol. 2002, 35, 146–150. [Google Scholar] [CrossRef]
- Vieira, J.M.; Flores-López, M.L.; Vicente, A.A.; Martins, J.T. Effect of chitosan-Aloe vera coating on postharvest quality of blueberry (Vaccinium corymbosum) fruit. Post. Biol. Technol. 2016, 116, 88–97. [Google Scholar] [CrossRef] [Green Version]
- Tokatli, K.; Demirdöven, A. Effects of chitosan edible film coatings on the physicochemical and microbiological qualities of sweet cherry (Prunus avium L.). Sci. Hortic. 2020, 259, 108656. [Google Scholar] [CrossRef]
- Malmiri, H.J.; Osman, A.; Tan, C.P.; Rahman, A.R. Evaluation of effectiveness of three cellulose derivative-based edible coatings on changes of physico-chemical characteristics of ‘Berangan’ banana (Musa sapientum cv. Berangan) during storage at ambient conditions. Int. Food Res. J. 2011, 18, 1381–1386. [Google Scholar]
- Robledo, N.; Lopez, L.; Bunger, A.; Tapia, C.; Abugoch, L. Effects of antimicrobial edible coating of thymol nanoemulsion/quinoa protein/chitosan on the safety, sensorial properties and quality of refrigerated strawberries (Fragaria × Ananassa) under commercial storage environment. Food Bioprocess Technol. 2018, 11, 1566–1574. [Google Scholar] [CrossRef]
- Robles-Flores, G.D.C.; Abud-Archila, M.; Ventura-Canseco, L.M.C.; Meza-Gordillo, R.; Grajales-Lagunes, A.; Ruiz-Cabrera, M.A.; Gutierrez-Miceli, F.A. Development and evaluation of a film and edible coating obtained from the Cajanus cajan seed applied to fresh strawberry fruit. Food Bioprocess Technol. 2018, 11, 2172–2181. [Google Scholar] [CrossRef]
- Ali, A.; Muhammad, M.T.M.; Sijam, K.; Siddiqui, Y. Effect of chitosan coatings on the physicochemical characteristics of Eksotika II papaya (Carica papaya L.) fruit during cold storage. Food Chem. 2011, 124, 620–626. [Google Scholar] [CrossRef]
- Atress, A.S.H.; El-Mogy, M.M.; Aboul Anean, H.E.; Alsanius, B.W. Improving strawberry fruit storability by edible coating as a carrier of thymol or calcium chloride. J. Hortic. Sci. Ornam. Plants. 2010, 2, 88–97. [Google Scholar]
- Kaya, M.; Cesoniene, L.; Daubaras, R.; Leskauskaite, D.; Zabulione, D. Chitosan coating of red kiwifruit (Actinidia melanandra) for extending of the shelf life. Int. J. Biol. Macromol. 2016, 85, 355–360. [Google Scholar] [CrossRef]
- Eltoum, Y.A.I.; Babiker, E.E. Changes in antioxidant content, rehydration ratio and browning index during storage of edible surface coated and dehydrated tomato slices. J. Food Process. Preserv. 2014, 38, 1135–1144. [Google Scholar] [CrossRef]
- Silva, K.S.; Garcia, C.C.; Amado, L.R.; Mauro, M.A. Effects of edible coatings on convective drying and characteristics of the dried pineapple. Food Bioprocess Technol. 2015, 8, 1465–1475. [Google Scholar] [CrossRef]
- Ghasemnezhad, M.; Shiri, M.A.; Sanavi, M. Effect of chitosan coatings on some quality indices of apricot (Prunus armeniaca L.) during cold storage. Casp. J. Env. Sci. 2010, 9, 25–33. [Google Scholar]
- Ghasemnezhad, M.; Nezhad, M.A.; Gerailoo, S. Changes in postharvest quality of loquat (Eriobotrya japonica) fruits influenced by chitosan. Hortic. Environ. Biotechnol. 2011, 52, 40–45. [Google Scholar] [CrossRef]
- Khaliq, G.; Mohamed, M.T.M.; Ghazali, H.M.; Ding, P.; Ali, A. Influence of gum Arabic coating enriched with calcium chloride on physiological, biochemical and quality responses of mango (Mangifera indica L.) fruit stored under low temperature stress. Postharvest Biol. Technol. 2016, 111, 362–369. [Google Scholar] [CrossRef]
- Addai, Z.R.; Abdullah, A.; Mutalib, S.A.; Musa, K.H. Effect of gum Arabic on quality and antioxidant properties of papaya fruit during cold storage. Int. J. ChemTech Res. 2013, 5, 2854–2862. [Google Scholar]
- Gonzalez-Aguilar, G.A.; Villa-Rodriguez, J.A.; Ayala-Zavala, J.F.; Yahia, E.M. Improvement of the antioxidant status of tropical fruits as a secondary response to some postharvest treatments. Trends Food Sci. Technol. 2010, 21, 475–482. [Google Scholar] [CrossRef]
- Hong, K.; Xie, J.; Zhang, L.; Sun, D.; Gong, D. Effects of chitosan coating on postharvest life and quality of guava (Psidium guajava L.) fruit during cold storage. Sci. Hortic. 2012, 144, 172–178. [Google Scholar] [CrossRef]
- Frusciante, L.; Carli, P.; Ercolano, M.R.; Pernice, R.; Di Matteo, A.; Fogliano, V.; Pellegrini, N. Antioxidant nutritional quality of tomato. Mol. Nutr. Food Res. 2007, 51, 609–617. [Google Scholar] [CrossRef] [PubMed]


| Treatment | Days of Storage | ||||
|---|---|---|---|---|---|
| 2 | 4 | 6 | 8 | 10 | |
| (A) Weight loss (%) | |||||
| CL | 10.03 ± 0.03 aE | 12.18 ± 0.02 aD | 15.12 ± 0.04 aC | 18.42 ± 0.03 aB | 19.95 ± 0.03 aA |
| AL 1% | 9.55 ± 0.04 bE | 10.72 ± 0.03 bD | 12.88 ± 0.04 cC | 15.51 ± 0.05 bB | 17.58 ± 0.04 bA |
| AL 2% | 7.23 ± 0.05 dE | 8.29 ± 0.05 dD | 9.25 ± 0.02 fC | 10.39 ± 0.01 hB | 12.52 ± 0.04 fA |
| AL 3% | 6.22 ± 0.03 eE | 7.46 ± 0.08 eD | 8.61 ± 0.05 gC | 9.71 ± 0.06 iB | 10.75 ± 0.04 hA |
| CH 0.25% | 9.43 ± 0.07 bE | 10.77 ± 0.05 bD | 13.24 ± 0.04 bC | 14.96 ± 0.05 cB | 16.68 ± 0.03 cA |
| CH 0.50% | 8.29 ± 0.02 cE | 9.43 ± 0.01 cD | 11.39 ± 0.03 dC | 12.76 ± 0.03 eB | 13.74 ± 0.05 eA |
| CH 0.75% | 7.32 ± 0.08 dE | 8.82 ± 0.05 dD | 10.53 ±0.07 eC | 11.01 ± 0.04 gB | 11.73 ± 0.05 gA |
| XG 0.1% | 7.44 ± 0.09 dE | 8.65 ± 0.05 dD | 11.62 ± 0.03 dC | 13.08 ± 0.07 dB | 14.18 ± 0.08 dA |
| XG 0.2% | 6.28 ± 0.07 eE | 7.62 ± 0.05 eD | 9.98 ± 0.04 fC | 11.35 ± 0.02 fB | 12.38 ± 0.04 fA |
| XG 0.3% | 5.47 ± 0.02 fE | 6.84 ± 0.09 fD | 8.46 ± 0.03 gC | 9.53 ± 0.05 iB | 10.34 ± 0.02 hA |
| (B) Total soluble solids (°Brix) | |||||
| CL | 26.13 ± 0.09 aE | 27.2 ± 0.02 aD | 28.13 ± 0.25 aC | 29.86 ± 0.19 aA | 28.13 ± 0.09 aB |
| AL 1% | 25.06 ± 0.09 bE | 25.46 ± 0.09 bD | 26.27 ± 0.25 bC | 26.93 ± 0.09 bA | 26.06 ± 0.07 bB |
| AL 2% | 24.06 ± 0.07 cE | 24.33 ± 0.08 cD | 25.13 ± 0.19 dB | 25.33 ± 0.09 cA | 24.46 ± 0.38 dC |
| AL 3% | 23.13 ± 0.18 dE | 23.4 ± 0.12 dD | 23.93 ± 0.09 fB | 24.80 ± 0.32 dA | 23.73 ± 0.18 eC |
| CH 0.25% | 25.13 ± 0.09 bE | 25.66 ± 0.07 bD | 26.33 ± 0.25 cB | 26.96 ± 0.08 bA | 26.06 ± 0.09 bC |
| CH 0.50% | 25.00 ± 0.13 bE | 25.46 ± 0.09 bC | 25.73 ± 0.09 dB | 26.33 ± 0.24 bA | 25.33 ± 0.09 cD |
| CH 0.75% | 24.06 ± 0.09 cE | 24.40 ± 0.16 cC | 24.80 ± 0.16 eB | 25.60 ± 0.32 cA | 24.33 ± 0.25 dD |
| XG 0.1% | 23.4 ± 0.28 dE | 24.06 ± 0.07 cD | 24.73 ± 0.22 eB | 25.53 ± 0.11 cA | 24.26 ± 0.24 dC |
| XG 0.2% | 22.4 ±0.20 eE | 22.93 ± 0.12 eC | 23.46 ± 0.18 fD | 24.46 ± 0.17 dA | 24.13 ± 0.09 dB |
| XG 0.3% | 21.86 ± 0.18 fE | 22.46 ± 0.07 eD | 23.21 ± 0.16 fC | 24.13 ± 0.04 dA | 23.58 ± 0.25 eB |
| (C) Titratable acidity (%) | |||||
| CL | 1.85 ± 0.12 hA | 1.64 ± 0.03 iB | 1.40 ± 0.05 jC | 1.15 ± 0.05 hD | 0.91 ± 0.06 aE |
| AL 1% | 2.01 ± 0.03 fA | 1.87 ± 0.08 fB | 1.74 ± 0.09 gC | 1.61 ± 0.13 fD | 1.47 ± 0.05 gE |
| AL 2% | 2.13 ± 0.07 dA | 2.04 ± 0.05 dB | 1.92 ± 0.03 dC | 1.79 ± 0.11 dD | 1.68 ± 0.06 fE |
| AL 3% | 2.21 ± 0.06 bA | 2.15 ± 0.04 bB | 2.04 ± 0.04 bC | 1.94 ± 0.03 aD | 1.75 ± 0.06 cE |
| CH 0.25% | 1.92 ± 0.05 gA | 1.77 ± 0.03 hB | 1.64 ± 0.03 iC | 1.42 ± 0.07 gD | 1.23 ± 0.03 jE |
| CH 0.50% | 1.92 ± 0.05 gA | 1.81 ± 0.03 gB | 1.71 ± 0.12 hC | 1.61 ± 0.12 fD | 1.45 ± 0.06 iE |
| CH 0.75% | 2.04 ± 0.04 fA | 1.98 ± 0.64 eB | 1.89 ± 0.03 eC | 1.81 ± 0.03 cD | 1.73 ± 0.05 dE |
| XG 0.1% | 2.11 ± 0.07 eA | 1.98 ± 0.16 eB | 1.83 ± 0.03 fC | 1.68 ± 0.07 eD | 1.51 ± 0.06 hE |
| XG 0.2% | 2.19 ± 0.06 cA | 2.09 ± 0.03 cB | 1.98 ± 0.05 cC | 1.85 ± 0.07 bD | 1.72 ± 0.05 eE |
| XG 0.3% | 2.26 ± 0.03 aA | 2.19 ± 0.12 aB | 2.06 ± 0.05 aC | 1.94 ± 0.04 aD | 1.81 ± 0.03 bE |
| (D) Ascorbic acid (mg/100 g FW) | |||||
| CL | 34.83 ± 0.52 jA | 31.16 ± 2.07 jB | 28.23 ± 1.37 jC | 23.46 ± 0.51 iD | 10.26 ± 1.03 iE |
| AL 1% | 37.03 ± 2.26 hA | 35.93 ± 0.05 hB | 34.46 ± 0.53 hC | 30.43 ± 0.89 hD | 18.7 ± 0.87 hE |
| AL 2% | 41.06 ± 2.26 fA | 39.6 ± 1.55 fB | 35.56 ± 0.5 gC | 31.53 ± 0.52 fD | 21.43 ± 1.03 fE |
| AL 3% | 42.16 ± 2.07 dA | 41.8 ± 0.05 dB | 36.66 ± 0.49 eC | 33.36 ± 1.03 dD | 24.63 ± 1.04 dE |
| CH 0.25% | 35.93 ± 1.86 iA | 33.73 ± 1.37 iB | 31.16 ± 0.51 iC | 23.1 ± 0.03 jD | 11.93 ± 0.51 jE |
| CH 0.50% | 40.7 ± 1.55 gA | 39.23 ± 1.86 gB | 36.03 ± 1.03 fC | 31.33 ± 0.89 gD | 21.16 ± 0.52 gE |
| CH 0.75% | 41.26 ± 2.07 eA | 40.16 ± 0.52 eB | 38.43 ± 0.52 dC | 33.66 ± 0.52 cD | 25.83 ± 0.53 bE |
| XG 0.1% | 46.46 ± 1.37 cA | 43.26 ± 1.03 cB | 40.70 ± 0.18 cC | 32.26 ± 2.07 eD | 22.21 ± 1.55 eE |
| XG 0.2% | 48.03 ± 3.62 bA | 47.31 ± 0.89 bB | 45.46 ± 0.51 bC | 33.73 ± 1.37 bD | 25.66 ± 1.37 cE |
| XG 0.3% | 52.8 ± 0.11 aA | 51.33 ± 1.37 aB | 49.5 ± 0.12 aC | 39.23 ± 1.03 aD | 32.51 ± 1.79 aE |
| Treatment | Days of Storage | ||||
|---|---|---|---|---|---|
| 2 | 4 | 6 | 8 | 10 | |
| (A) Total phenolic content | |||||
| CL | 0.56 ± 0.02 ap | 0.63 ± 0.03 aq | 0.68 ± 0.03 ar | 0.78 ± 0.05 as | 0.61 ± 0.04 ap |
| AL 1% | 0.66 ± 0.05 fp | 0.68 ± 0.07 cdq | 0.79 ± 0.03 der | 1.24 ± 0.04 is | 0.79 ± 0.03 fr |
| AL 2% | 0.65 ± 0.02 eq | 0.68 ± 0.02 cdr | 0.79 ± 0.03 cds | 1.03 ± 0.03 et | 0.64 ± 0.02 ap |
| AL 3% | 0.65 ± 0.07 eq | 0.67 ± 0.05 cqr | 0.71 ± 0.02 ar | 0.81 ± 0.04 bs | 0.63 ± 0.06 ap |
| CH 0.25% | 0.57 ± 0.09 bp | 0.66 ± 0.03 bq | 0.71 ± 0.08 ar | 0.88 ± 0.07 cs | 0.63 ± 0.03 ap |
| CH 0.50% | 0.58 ± 0.05 bp | 0.68 ± 0.02 dq | 0.74 ± 0.03 br | 0.96 ± 0.07 ds | 0.66 ± 0.04 bp |
| CH 0.75% | 0.61 ± 0.04 cp | 0.73 ± 0.07 gq | 0.80 ± 0.08 eq | 0.98 ± 0.05 dr | 0.68 ± 0.09 dp |
| XG 0.1% | 0.67 ± 0.05 gp | 0.73 ± 0.02 gq | 0.79 ± 0.03 der | 1.22 ± 0.07 ht | 0.88 ± 0.08 gs |
| XG 0.2% | 0.65 ± 0.02 ep | 0.71 ± 0.02 fq | 0.78 ± 0.04 cder | 1.05 ± 0.03 ft | 0.86 ± 0.02 gs |
| XG 0.3% | 0.63 ± 0.03 dp | 0.69 ± 0.07 eq | 0.77 ± 0.02 cr | 0.82 ± 0.04 bs | 0.69 ± 0.02 eq |
| (B) ABTS assay | |||||
| CL | 62.51 ± 0.1 ap | 65.19 ± 0.38 aq | 68.35 ± 0.37 as | 70.11 ± 0.17 at | 61.01 ± 0.45 ap |
| AL 1% | 67.76 ± 0.11 fq | 69.13 ± 0.27 dq | 71.07 ± 0.10 cdr | 73.86 ± 0.10 cds | 66.59 ± 0.54 cp |
| AL 2% | 66.81 ± 0.2 eq | 68.06 ± 0.35 cr | 69.45 ± 0.10 bs | 72.83 ± 0.21 bct | 63.36 ± 0.43 abp |
| AL 3% | 66.37 ± 0.11 deq | 67.32 ± 0.12 bcq | 68.86 ± 0.10 abr | 70.63 ± 0.10 as | 62.48 ± 1.06 ap |
| CH 0.25% | 63.14 ± 0.28 bp | 66.21 ± 0.10 bq | 68.64 ± 0.27 ar | 72.68 ± 0.35 bs | 62.31 ± 0.19 ap |
| CH 0.50% | 63.36 ± 0.28 bp | 67.32 ± 0.11 bcq | 70.55 ± 0.11 cr | 73.42 ± 1.34 bcds | 64.25 ± 0.83 bp |
| CH 0.75% | 64.79 ± 0.16 cp | 69.53 ± 0.21 dr | 72.76 ± 0.10 es | 73.86 ± 0.37 cdt | 66.28 ± 0.58 cq |
| XG 0.1% | 67.84 ± 0.78 fp | 69.97 ± 0.10 dq | 71.36 ± 0.78 dqr | 74.30 ± 0.27 ds | 71.91 ± 0.83 er |
| XG 0.2% | 66.44 ± 0.81 dep | 68.13 ± 0.63 cq | 70.55 ± 0.10 cr | 71.07 ± 0.10 ar | 69.16 ± 0.31 dq |
| XG 0.3% | 65.19 ± 0.38 cdp | 67.25 ± 0.68 bq | 69.38 ± 0.35 br | 70.56 ± 0.31 ar | 65.81 ± 0.99 cp |
| (C) DPPH radical scavenging activity | |||||
| CL | 61.57 ± 0.26 ap | 68.81 ± 0.22 aq | 71.05 ± 0.25 ar | 78.36 ± 0.06 as | 62.90 ± 0.15 ar |
| AL 1% | 73.12 ± 0.26 fp | 75.24 ± 0.14 cq | 83.15 ± 0.24 fr | 90.89 ± 0.33 es | 74.76 ± 0.67 eq |
| AL 2% | 72.98 ± 0.35 fq | 75.19 ± 0.11 cr | 81.84 ± 0.20 ds | 87.77 ± 0.20 dt | 68.47 ± 0.30 dp |
| AL 3% | 72.88 ± 0.13 fq | 73.24 ± 0.15 bq | 75.29 ± 0.06 br | 77.88 ± 0.32 as | 63.08 ± 0.18 ap |
| CH 0.25% | 63.12 ± 0.23 bp | 72.81 ± 0.33 br | 75.36 ± 0.12 bs | 86.82 ± 0.18 ct | 64.54 ± 0.21 bq |
| CH 0.50% | 64.83 ± 0.21 cp | 75.29 ± 0.06 cr | 80.31 ± 0.16 cs | 91.30 ± 0.06 et | 64.78 ± 0.23 bq |
| CH 0.75% | 67.54 ± 0.10 dq | 79.58 ± 0.41 er | 85.22 ± 0.29 gs | 92.18 ± 0.22 ft | 65.11 ± 0.21 cp |
| XG 0.1% | 73.19 ± 0.10 fp | 79.58 ± 0.36 er | 83.17 ± 0.22 fs | 90.82 ± 0.29 et | 75.02 ± 0.18 fq |
| XG 0.2% | 72.86 ± 0.16 fp | 75.41 ± 0.05 cr | 82.51 ± 0.37 es | 88.30 ± 0.54 dt | 73.81 ± 0.38 eq |
| XG 0.3% | 68.81 ± 0.22 eq | 76.17 ± 0.24 dr | 80.12 ± 0.05 cs | 82.77 ± 0.05 bt | 67.88 ± 0.18 dp |
| (D) Lipid peroxidation assay | |||||
| CL | 33.49 ± 0.74 ap | 35.45 ± 0.37 ap | 37.06 ± 0.31 aq | 39.87 ± 0.44 ar | 35.09 ± 0.92 ap |
| AL 1% | 39.51 ± 0.32 ep | 40.17 ± 0.58 eq | 41.77 ± 0.74 eq | 43.89 ± 0.44 dr | 39.22 ± 0.43 dp |
| AL 2% | 38.31 ± 1.09 dp | 39.96 ± 0.12 eq | 40.57 ± 0.42 dqr | 41.59 ± 0.74 bcr | 37.35 ± 0.31 bp |
| AL 3% | 35.54 ± 0.25 bp | 37.65 ± 0.39 cq | 39.01 ± 0.43 cr | 41.37 ± 0.18 bcs | 36.09 ± 0.14 ap |
| CH 0.25% | 34.63 ± 0.21 ap | 36.34 ± 0.25 bq | 38.32 ± 0.35 br | 40.16 ± 0.58 as | 37.60 ± 0.18 br |
| CH 0.50% | 35.34 ± 0.26 bp | 37.30 ± 0.23 cq | 39.56 ± 0.23 cr | 41.08 ± 0.37 abs | 38.61 ± 0.32 cdr |
| CH 0.75% | 35.54 ± 0.25 bp | 38.56 ± 0.11 dq | 41.62 ± 0.42 er | 42.13 ± 0.37 bcr | 38.96 ± 0.21 dq |
| XG 0.1% | 39.81 ± 0.37 ep | 40.42 ± 0.21 eq | 42.87 ± 0.46 fr | 44.63 ± 0.86 er | 39.86 ± 0.43 dp |
| XG 0.2% | 37.15 ± 0.31 cp | 38.96 ± 0.46 dq | 40.92 ± 0.75 der | 42.43 ± 0.93 bcs | 37.85 ± 0.36 bcpq |
| XG 0.3% | 35.39 ± 0.43 bp | 37.55 ± 0.44 cq | 38.56 ± 0.58 aq | 41.72 ± 0.51 bcr | 36.34 ± 0.32 ap |
| Treatment | Days of Storage | ||||
|---|---|---|---|---|---|
| 2 | 4 | 6 | 8 | 10 | |
| (A) Neochlorogenic acid | |||||
| CL | 10.92 ± 0.13 prs | 13.67 ± 0.31 mnq | 16.91 ± 0.36 jkl | 22.52 ± 0.44 df | 19.37 ± 0.24 gj |
| AL 1% | 11.29 ± 0.23 opq | 16.22 ± 0.29 klm | 19.37 ± 0.21 ghi | 25.16 ± 0.36 cd | 22.16 ± 0.31 ef |
| AL 2% | 13.96 ± 0.43 mno | 15.11 ± 0.27 lmn | 18.06 ± 0.25 ik | 24.16 ± 0.21 cde | 28.06 ± 0.35 ab |
| AL 3% | 10.67 ± 0.44 qstuv | 12.15 ± 0.16 opt | 14.82 ± 0.16 lmn | 18.32 ± 0.26 hijk | 21.61 ± 0.31 efg |
| CH 0.25% | 6.84 ± 0.34 xz | 8.37 ± 0.26 uxy | 10.38 ± 0.14 stuv | 22.42 ± 0.37 df | 29.42 ± 0.25 a |
| CH 0.50% | 5.58 ± 0.32 z | 7.19 ± 0.16 wz | 9.36 ± 0.25 tux | 17.61 ± 0.16 ijkl | 22.82 ± 0.23 cdef |
| CH 0.75% | 6.28 ± 0.24 yz | 7.40 ± 0.18 wxyz | 8.12 ± 0.08 vwx | 16.17 ± 0.31 klm | 21.23 ± 0.22 efh |
| XG 0.1% | 11.19 ± 0.22 optu | 12.12 ± 0.20 opt | 13.42 ± 0.27 opqr | 20.19 ± 0.28 fi | 25.64 ± 0.17 bc |
| XG 0.2% | 8.981 ± 0.53 uxy | 10.69 ± 0.26 psv | 12.62 ± 0.14 nqrs | 16.22 ± 0.24 klm | 20.39 ± 0.27 fgi |
| XG 0.3% | 7.141 ± 0.33 xyz | 10.11 ± 0.12 stw | 13.67 ± 0.38 mp | 17.56 ± 0.30 ijl | 21.34 ± 0.43 efg |
| (B) Chlorogenic acid | |||||
| CL | 18.31 ± 0.43 pqr | 19.63 ± 0.35 ipq | 21.69 ± 0.18 deijk | 25.2 ± 0.31 abc | 23.11 ± 0.11 cdef |
| AL 1% | 20.11 ± 0.16 hpq | 21.2 ± 0.21 fgn | 22.95 ± 0.16 cdg | 26.71 ± 0.23 a | 25.18 ± 0.27 abc |
| AL 2% | 18.92 ± 0.24 1rs | 19.11 ± 0.12 lms | 21.11 ± 0.15 fmn | 25.54 ± 0.27 ab | 23.16 ± 0.32 cdef |
| AL 3% | 19.66 ± 0.31 ijpq | 19.69 ± 0.27 ipq | 19.92 ± 0.08 ipq | 23.18 ± 0.17 cde | 21.33 ± 0.16 efjk |
| CH 0.25% | 16.07 ± 0.28 tu | 18.31 ± 0.18 prst | 20.65 ± 0.41 gop | 26.45 ± 0.11 a | 23.82 ± 0.27 bcd |
| CH 0.50% | 16.33 ± 0.11 tu | 17.05 ± 0.07 stu | 17.85 ± 0.27 qrst | 21.92 ± 0.34 deh | 19.21 ± 0.15 qrs |
| CH 0.75% | 15.15 ± 0.15 u | 16.36 ± 0.07 tu | 17.01 ± 0.39 stu | 23.68 ± 0.30 bde | 19.39 ± 0.32 kqr |
| XG 0.1% | 17.33 ± 0.42 rst | 18.21 ± 0.11 qrst | 19.61 ± 0.18 ijpqr | 23.77 ± 0.13 bcd | 21.74 ± 0.27 dhij |
| XG 0.2% | 19.14 ± 0.20 ls | 19.31 ± 0.10 lqrs | 19.51 ± 0.06 jkqr | 22.61 ± 0.22 deh | 18.38 ± 0.44 pqst |
| XG 0.3% | 17.14 ± 0.34 rstu | 18.14 ± 0.18 lmrs | 18.83 ± 0.22 nrs | 21.25 ± 0.21 glm | 18.96 ± 0.58 qrs |
| (C) Ellagic acid | |||||
| CL | 0.42 ± 0.02 opu | 0.43 ± 0.01 opuv | 0.46 ± 0.03 out | 1.21 ± 0.03 def | 1.06 ± 0.01 efgh |
| AL 1% | 0.24 ± 0.03 uvw | 0.26 ± 0.03 tuvw | 0.29 ± 0.02 stuv | 0.59 ± 0.01 mr | 0.45 ± 0.01 ov |
| AL 2% | 0.76 ± 0.02 jkl | 0.95 ± 0.05 ghi | 1.33 ± 0.01 cd | 1.55 ± 0.02 c | 1.41 ± 0.03 cd |
| AL 3% | 0.22 ± 0.01 uvw | 0.22 ± 0.04 uvw | 0.25 ± 0.01 uvw | 0.29 ± 0.03 sw | 0.27 ± 0.02 tuv |
| CH 0.25% | 0.29 ± 0.03 stw | 0.37 ± 0.03 qrs | 0.63 ± 0.03 klm | 1.21 ± 0.02 def | 0.97 ± 0.02 f |
| CH 0.50% | 0.73 ± 0.04 jn | 0.86 ± 0.01 hijk | 0.98 ± 0.04 fij | 1.52 ± 0.02 c | 2.62 ± 0.01 b |
| CH 0.75% | 1.05 ± 0.03 efi | 1.26 ± 0.02 de | 1.51 ± 0.01 c | 2.61 ± 0.01 b | 3.71 ± 0.02 a |
| XG 0.1% | 0.23 ± 0.01 uvw | 0.41 ± 0.01 opv | 0.56 ± 0.02 lmq | 0.83 ± 0.03 ijk | 0.78 ± 0.03 jkl |
| XG 0.2% | 0.41 ± 0.07 pvw | 0.49 ± 0.02 nos | 0.53 ± 0.01 lmno | 0.67 ± 0.02 klo | 0.51 ± 0.04 mno |
| XG 0.3% | 0.18 ± 0.02 w | 0.19 ± 0.03 vw | 0.21 ± 0.01 vw | 0.31 ± 0.03 rsw | 0.29 ± 0.02 stuw |
| (D) Epicatechin | |||||
| CL | 31.12 ± 0.21 hi | 32.61 ± 0.21 ghi | 35.96 ± 0.42 efg | 38.18 ± 0.27 e | 34.51 ± 0.11 fgh |
| AL 1% | 48.70 ± 0.32 c | 52.33 ± 0.31 b | 59.50 ± 0.58 a | 62.31 ± 0.24 a | 55.58 ± 0.59 b |
| AL 2% | 36.12 ± 0.25 ef | 37.31 ± 0.34 ef | 41.68 ± 0.39 d | 45.23 ± 0.39 c | 38.25 ± 0.47 de |
| AL 3% | 17.31 ± 0.11 vwxy | 22.79 ± 0.26 qu | 26.17 ± 0.22 mnq | 29.52 ± 0.27 ijkl | 25.33 ± 0.25 mr |
| CH 0.25% | 23.22 ± 0.27 pqt | 25.61 ± 0.16 mnr | 26.33 ± 0.28 mno | 28.51 ± 0.21 jlm | 23.67 ± 0.19 ops |
| CH 0.50% | 16.15 ± 0.12 xyz | 18.18 ± 0.30 vwxy | 22.22 ± 0.19 rstu | 24.76 ± 0.29 nor | 23.57 ± 0.22 ops |
| CH 0.75% | 16.86 ± 0.17 vwz | 20.18 ± 0.27 stuv | 23.36 ± 0.11 pqrs | 26.82 ± 0.30 klm | 24.66 ± 0.27 nqr |
| XG 0.1% | 16.76 ± 0.09 wxyz | 19.62 ± 0.31 uvwx | 23.99 ± 0.18 opqr | 26.72 ± 0.25 lmp | 23.77 ± 0.22 ops |
| XG 0.2% | 23.93 ± 0.24 or | 25.52 ± 0.43 mnor | 27.16 ± 0.23 klmn | 29.66 ± 0.30 ijk | 28.35 ± 0.24 jm |
| XG 0.3% | 13.81 ± 0.13 z | 15.72 ± 0.20 yz | 17.72 ± 0.09 vwxy | 19.98 ± 0.18 tuv | 18.13 ± 0.19 vw |
| Treatment | Days of Storage | ||||
|---|---|---|---|---|---|
| 2 | 4 | 6 | 8 | 10 | |
| (A) Phloridzin | |||||
| CL | 5.14 ± 0.12 pqr | 5.49 ± 0.26 cdr | 6.25 ± 0.22 fgh | 6.61 ± 0.11 cgi | 6.08 ± 0.28 dfg |
| AL 1% | 4.35 ± 0.21 rst | 4.92 ± 0.21 efi | 5.29 ± 0.14 fkl | 5.95 ± 0.22 def | 5.62 ± 0.25 ghi |
| AL 2% | 5.37 ± 0.18 ls | 8.31 ± 0.32 frs | 18.17 ± 0.4 lmn | 12.21 ± 0.34 br | 6.14 ± 0.17 acq |
| AL 3% | 2.62 ± 0.11 tu | 2.81 ± 0.31 ifij | 3.90 ± 0.27 dfji | 4.41 ± 0.56 mno | 3.40 ± 0.22 br |
| CH 0.25% | 2.80 ± 0.14 hpq | 3.61 ± 0.14 cgik | 4.19 ± 0.23 cfi | 4.65 ± 0.12 acn | 4.37 ± 0.36 cf |
| CH 0.50% | 4.41 ± 0.21 | 4.81 ± 0.18 dgj | 5.25 ± 0.33 mn | 5.71 ± 0.36 fop | 2.62 ± 0.02 cbh |
| CH 0.75% | 4.39 ± 0.11 irs | 4.90 ± 0.26 dhk | 5.73 ± 0.16 prs | 5.95 ± 0.12 cd | 4.01 ± 0.11 djk |
| XG 0.1% | 2.13 ± 0.30 cdr | 2.51 ± 0.15 mn | 2.74 ± 0.49 cdg | 3.61 ± 0.19 bfh | 6.28 ± 0.09 ijm |
| XG 0.2% | 3.01 ± 0.22 tu | 4.21 ± 0.12 cgh | 5.05 ± 0.20 bdi | 5.51 ± 0.32 ckl | 2.86 ± 0.05 jk |
| XG 0.3% | 2.4 ± 0.26 bcg | 2.92 ± 0.16 def | 3.90 ± 0.24 cfi | 5.71 ± 0.18 klm | 7.62 ± 0.07 mo |
| (B) Kaempferol | |||||
| CL | 0.91 ± 0.03 at | 0.92 ± 0.05 cp | 1.20 ± 0.08 ap | 1.61 ± 0.09 fgh | 1.50 ± 0.05 djk |
| AL 1% | 0.96 ± 0.02 bp | 1.15 ± 0.02 abrs | 1.23 ± 0.09 cp | 1.56 ± 0.02 bq | 1.45 ± 0.07 rt |
| AL 2% | 0.51 ± 0.04 det | 0.57 ± 0.02 des | 0.64 ± 0.06 ep | 0.71 ± 0.01 cp | 0.69 ± 0.02 epq |
| AL 3% | 0.16 ± 0.02 fs | 0.16 ± 0.05 bfs | 0.16 ± 0.04 be | 0.19 ± 0.05 cde | 0.19 ± 0.01 ij |
| CH 0.25% | 0.11 ± 0.08 act | 0.12 ± 0.05 bs | 0.19 ± 0.02 cde | 0.21 ± 0.09 efg | 0.19 ± 0.04 pq |
| CH 0.50% | 0.13 ± 0.03 at | 0.15 ± 0.02 acr | 0.16 ± 0.05 eq | 0.19 ± 0.06 cd | 0.27 ± 0.02 fgh |
| CH 0.75% | 0.16 ± 0.07 bcs | 0.18 ± 0.09 eds | 0.20 ± 0.07 deq | 0.22 ± 0.06 ijk | 0.11 ± 0.02 brs |
| XG 0.1% | 0.27 ± 0.01 ct | 0.28 ± 0.04 cfr | 0.21 ± 0.06 ecp | 0.33 ± 0.08 de | 0.18 ± 0.04 mn |
| XG 0.2% | 0.16 ± 0.06 des | 0.19 ± 0.09 ders | 0.24 ± 0.09 ebd | 0.25 ± 0.06 lm | 0.21 ± 0.01 efg |
| XG 0.3% | 0.21 ± 0.03 fs | 0.23 ± 0.04 frs | 0.41 ± 0.06 cdp | 0.42 ± 0.01 bcd | 0.42 ± 0.05 det |
| (C) Quercetin-3-glucoside | |||||
| CL | 1.34 ± 0.09 dfh | 1.41 ± 0.09 ikm | 1.43 ± 0.03 jmn | 1.52 ± 0.08 efr | 1.31 ± 0.04 df |
| AL 1% | 2.34 ± 0.02 bfg | 2.51 ± 0.04 lm | 3.74 ± 0.08 cfg | 3.82 ± 0.07 bcg | 3.71 ± 0.08 cjk |
| AL 2% | 2.65 ± 0.06 ad | 2.81 ± 0.05 cdm | 3.41 ± 0.06 hi | 3.22 ± 0.01 abp | 1.79 ± 0.06 pq |
| AL 3% | 2.31 ± 0.07 cfg | 2.52 ± 0.02 efg | 2.81 ± 0.08 afg | 2.91 ± 0.03 cde | 0.43 ± 0.09 ade |
| CH 0.25% | 2.71 ± 0.01 acd | 2.95 ± 0.01 afe | 3.17 ± 0.06 pqr | 3.21 ± 0.08 fg | 4.11 ± 0.03 cdf |
| CH 0.50% | 2.08 ± 0.04 kqr | 2.19 ± 0.05 dt | 2.32 ± 0.09 ef | 2.41 ± 0.05 bce | 2.26 ± 0.08 adg |
| CH 0.75% | 3.14 ± 0.01 jk | 3.21 ± 0.02 cdr | 3.29 ± 0.03 bfh | 3.32 ± 0.05 lmn | 6.32 ± 0.08 cf |
| XG 0.1% | 3.61 ± 0.05 bc | 3.96 ± 0.05 adh | 3.81 ± 0.02 fi | 4.98 ± 0.03 cdg | 2.96 ± 0.09 mn |
| XG 0.2% | 2.82 ± 0.08 lm | 3.19 ± 0.06 pqr | 3.46 ± 0.01 ikl | 3.94 ± 0.08 kl | 2.33 ± 0.06 ij |
| XG 0.3% | 2.39 ± 0.06 bef | 2.91 ± 0.09 cde | 3.28 ± 0.07 fgr | 3.85 ± 0.07 bq | 1.20 ± 0.02 ch |
| (D) Procyanidin b2 | |||||
| CL | 6.12 ± 0.18 cfh | 6.22 ± 0.17 bk | 6.35 ± 0.24 de | 6.67 ± 0.22 an | 6.86 ± 0.16 efj |
| AL 1% | 9.12 ± 0.12 ef | 9.51 ± 0.23 acg | 10.32 ± 0.18 fj | 11.79 ± 0.14 cfn | 11.01 ± 0.12 deh |
| AL 2% | 9.16 ± 0.24 bck | 9.25 ± 0.12 cd | 9.38 ± 0.16 ach | 10.72 ± 0.18 cd | 10.61 ± 0.34 df |
| AL 3% | 6.66 ± 0.22 gh | 6.75 ± 0.24 fgh | 7.39 ± 0.25 dk | 7.88 ± 0.29 dgn | 7.58 ± 0.26 bcf |
| CH 0.25% | 6.02 ± 0.32 efk | 6.21 ± 0.12 mn | 6.51 ± 0.22 bfi | 6.82 ± 0.15 ach | 6.75 ± 0.12 achi |
| CH 0.50% | 6.26 ± 0.25 cd | 6.62 ± 0.22 be | 6.70 ± 0.14 efn | 6.91 ± 0.14 bfh | 6.62 ± 0.15 jkl |
| CH 0.75% | 7.20 ± 0.19 ac | 7.52 ± 0.20 bdg | 7.75 ± 0.51 hi | 7.92 ± 0.22 ikl | 7.74 ± 0.17 cfj |
| XG 0.1% | 6.86 ± 0.14 abf | 6.61 ± 0.17 bch | 8.91 ± 0.42 ehi | 7.21 ± 0.17 fgi | 7.41 ± 0.11 dmn |
| XG 0.2% | 6.69 ± 0.34 dfg | 6.81 ± 0.24 cgj | 8.70 ± 0.45 acn | 7.25 ± 0.13 klmn | 12.77 ± 0.26 chi |
| XG 0.3% | 6.11 ± 0.40 kl | 6.31 ± 0.19d ef | 8.82 ± 0.33 bc | 7.36 ± 0.18 cghi | 9.27 ± 0.19 mn |
Publisher’s Note: MDPI stays neutral with regard to jurisdictional claims in published maps and institutional affiliations. |
© 2021 by the authors. Licensee MDPI, Basel, Switzerland. This article is an open access article distributed under the terms and conditions of the Creative Commons Attribution (CC BY) license (https://creativecommons.org/licenses/by/4.0/).
Share and Cite
Guroo, I.; Gull, A.; Wani, S.M.; Wani, S.A.; Al-Huqail, A.A.; Alhaji, J.H. Influence of Different Types of Polysaccharide-Based Coatings on the Storage Stability of Fresh-Cut Kiwi Fruit: Assessing the Physicochemical, Antioxidant and Phytochemical Properties. Foods 2021, 10, 2806. https://doi.org/10.3390/foods10112806
Guroo I, Gull A, Wani SM, Wani SA, Al-Huqail AA, Alhaji JH. Influence of Different Types of Polysaccharide-Based Coatings on the Storage Stability of Fresh-Cut Kiwi Fruit: Assessing the Physicochemical, Antioxidant and Phytochemical Properties. Foods. 2021; 10(11):2806. https://doi.org/10.3390/foods10112806
Chicago/Turabian StyleGuroo, Ishrat, Amir Gull, Sajad Mohd Wani, Sajad Ahmad Wani, Asma A. Al-Huqail, and Jwaher Haji Alhaji. 2021. "Influence of Different Types of Polysaccharide-Based Coatings on the Storage Stability of Fresh-Cut Kiwi Fruit: Assessing the Physicochemical, Antioxidant and Phytochemical Properties" Foods 10, no. 11: 2806. https://doi.org/10.3390/foods10112806
APA StyleGuroo, I., Gull, A., Wani, S. M., Wani, S. A., Al-Huqail, A. A., & Alhaji, J. H. (2021). Influence of Different Types of Polysaccharide-Based Coatings on the Storage Stability of Fresh-Cut Kiwi Fruit: Assessing the Physicochemical, Antioxidant and Phytochemical Properties. Foods, 10(11), 2806. https://doi.org/10.3390/foods10112806