Article

Understanding the Key Factors of Older Adults’ Continuance Intention in Congregate Meal Halls

1
Department of Creative Design, National Yunlin University of Science & Technology, Yunlin 640, Taiwan
2
Department of Agricultural and Resource Economics, University of Tennessee, Knoxville, TN 37996, USA
*
Author to whom correspondence should be addressed.
Foods 2021, 10(11), 2638; https://doi.org/10.3390/foods10112638
Submission received: 23 September 2021 / Revised: 27 October 2021 / Accepted: 28 October 2021 / Published: 30 October 2021

Abstract

:
Eating congregate/community meals with friends promotes a balanced and healthy diet among older adults. It is helpful for postponing aging, preventing chronic diseases, and improving their quality of life. However, little research has examined the continuance intention for older adults with the congregate meal program in Taiwan. This study established a model for key factors of older adults’ continuance intention dining at senior meal halls, and hypotheses to explain them, and subsequently designed questionnaires and scales. By analyzing the longitudinal data collected from 416 individuals using survey questionnaires, we found that the perceived service quality is the main factor that affects the perceived satisfaction, and the perceived satisfaction of the older adults plays an important role in this survey. It showed that if the older adults are satisfied with the service quality provided by the senior meal halls, which will accordingly affect the post-use trust, they will show a positive continuance intention to participate in the senior meal halls. We also found that the older adults have positive views on the planning and service contents of the existing senior meal halls. Together, these results illustrate the process and provide comprehensive insights and evidence to create a better user experience and improve the satisfaction of the congregate meal for older adults.

1. Introduction

As defined by the World Health Organization (WHO), a society with 20% of the total population aged over 65 years old is classified as a super-aged society [1]. According to the statistics of the Department of Household Registration, Ministry of the Interior, Taiwan is expected to enter the super-aged society in 2025, meaning that 20% of the population will be over 65 years old [2] (Figure 1), which would imply a severe aging population structure in Taiwan. Retired older adults may lose their goals in life, and may feel insignificant [3]. Additionally, when older adults lose their goals in life, consequent brain and physiology degeneration may occur, which can lead to serious social problems, such as dementia accelerated by loneliness [4], suicide due to depression [5], and even dying alone. Since these issues involve enormous consumption of medical and social resources, the current situation presents a challenge for the successful aging of older adults [6].
In previous decades, there has been a growing emphasis on “aging in place” globally [7], hoping to call more attention to the health, residential environment, psychology, diet, and interpersonal relationships of older adults [8]. Social Eating Programs for older adults have mentioned the nutritional risks and social isolation of older adults living in communities. According to Fulkerson [9], using Meals on Wheels, Eating with Friends, and Congregate/Community Meals can promote a balanced and healthy diet among older adults, which is helpful for postponing aging, preventing chronic diseases, and improving their quality of life [10]. Meanwhile, these programs can also alleviate problems, such as inconvenience in preparing meals, loneliness and depression, and a lack of activities. The Ministry of the Interior (Taiwan) has listed congregate/community meals in Welfare Law concerning older adults since 1997. For communities near rural areas, the establishment of congregate/community meals and senior meal halls is essential, due to the severe aging population structure and migration of young and middle-aged populations [11]. In addition, although senior meal halls have achieved initial success, there are still a considerable number of older adults who feel insecure about local aging and senior meal halls, which even lead to distrust, rejection, aversion [
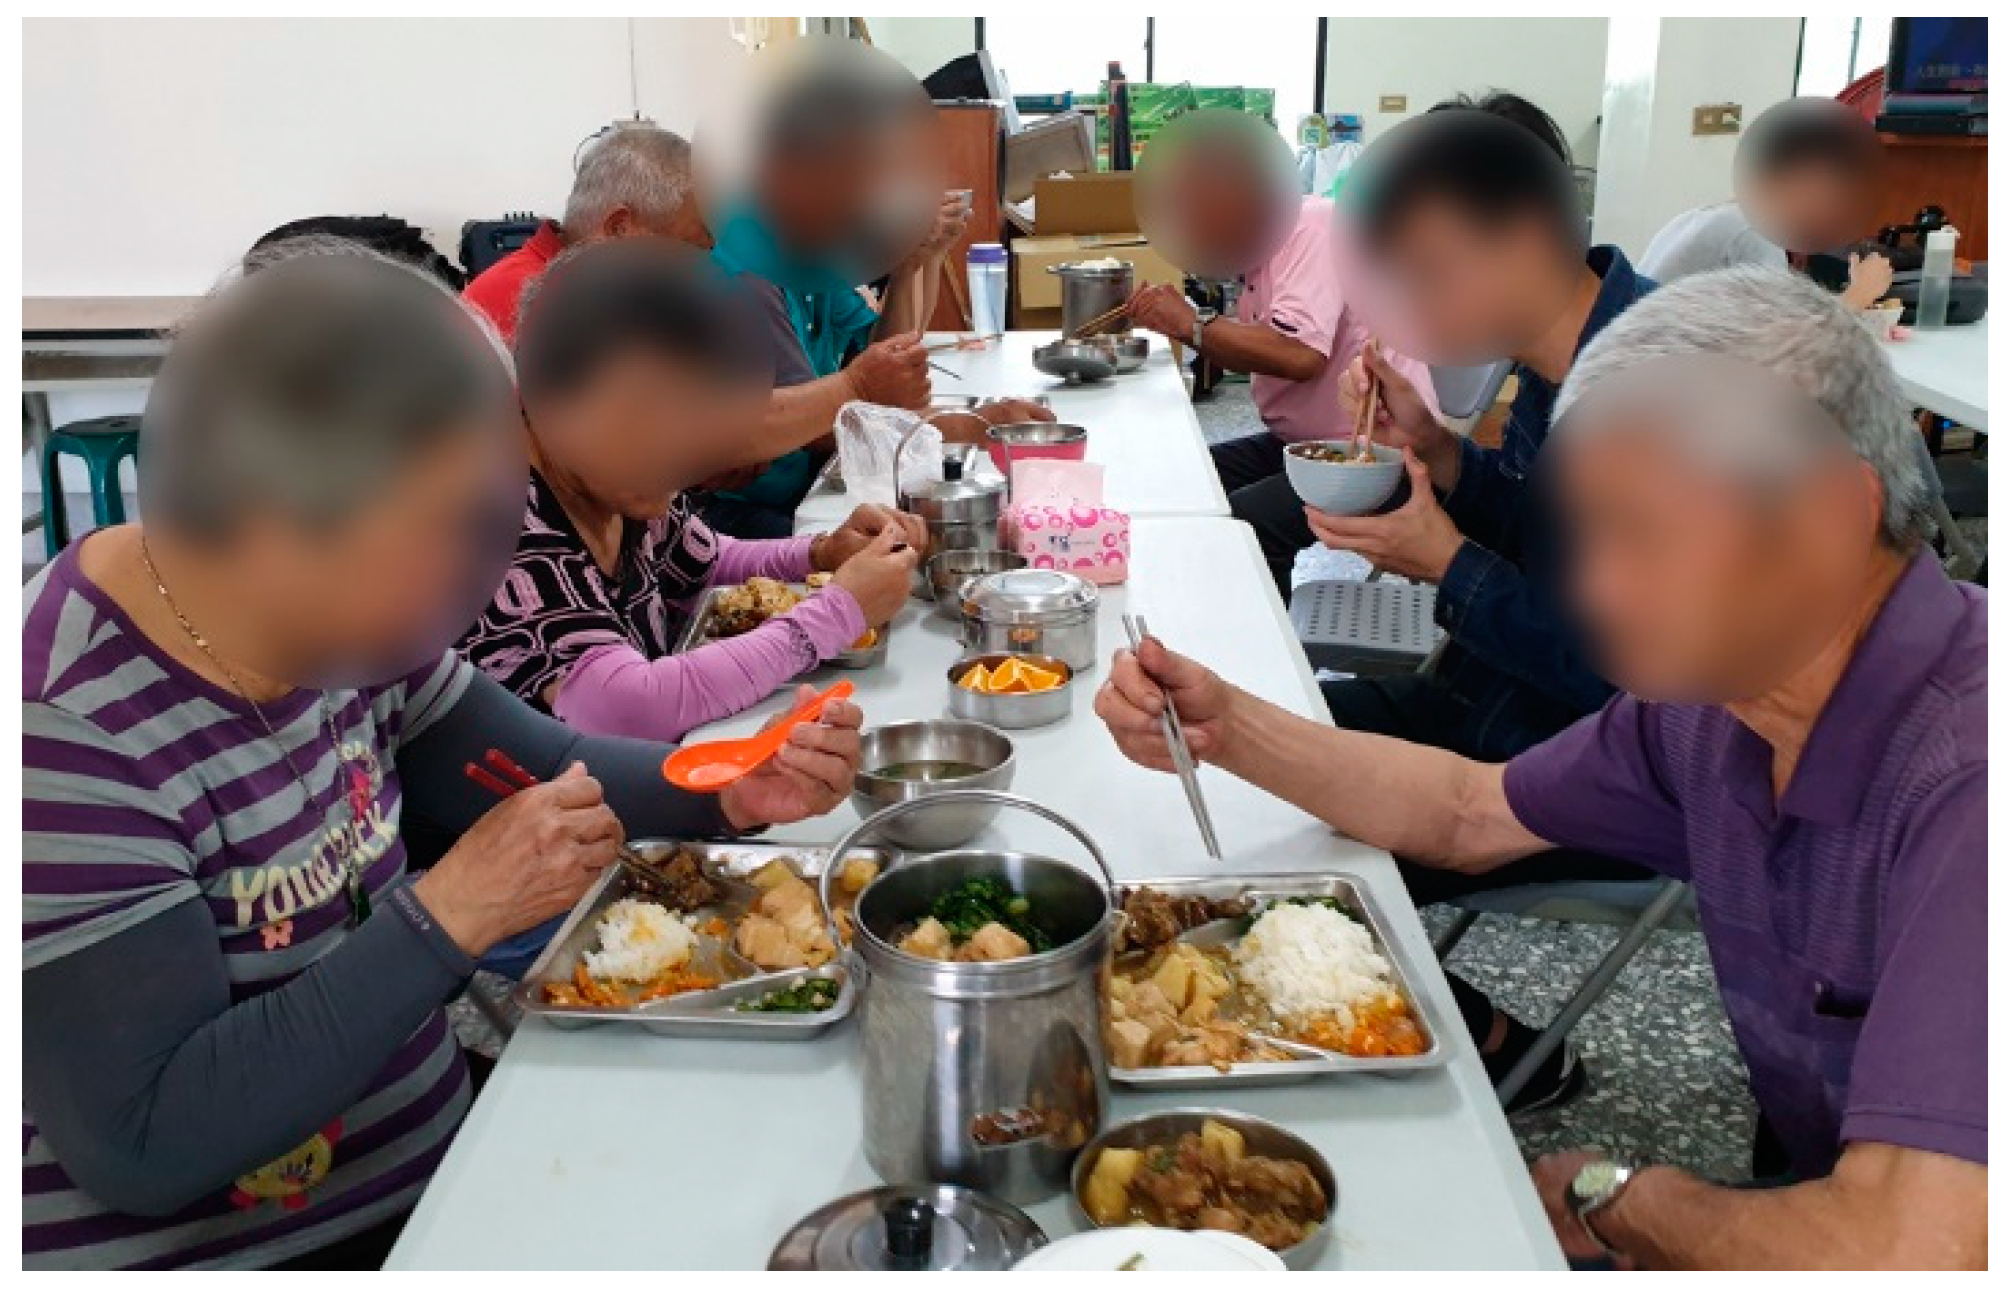
12], and reluctance in dining out. Taking Yunlin County in this study as an example, where the seniors account for the second-highest percentage of the population of Taiwan’s 22 cities and counties, the county government has subsidized the establishment of several senior meal halls, where nearly 8000 people eat every day. This fact indicates that the older adults in Yunlin County have a certain demand for catering services. Therefore, it is necessary to look for experiences from the older adults who have dined at senior congregate meal halls, understand their pre-use trust, post-use trust, satisfaction, and continuance intention, through which we can better understand their experience, feelings, and mental processes when experiencing these meal halls (
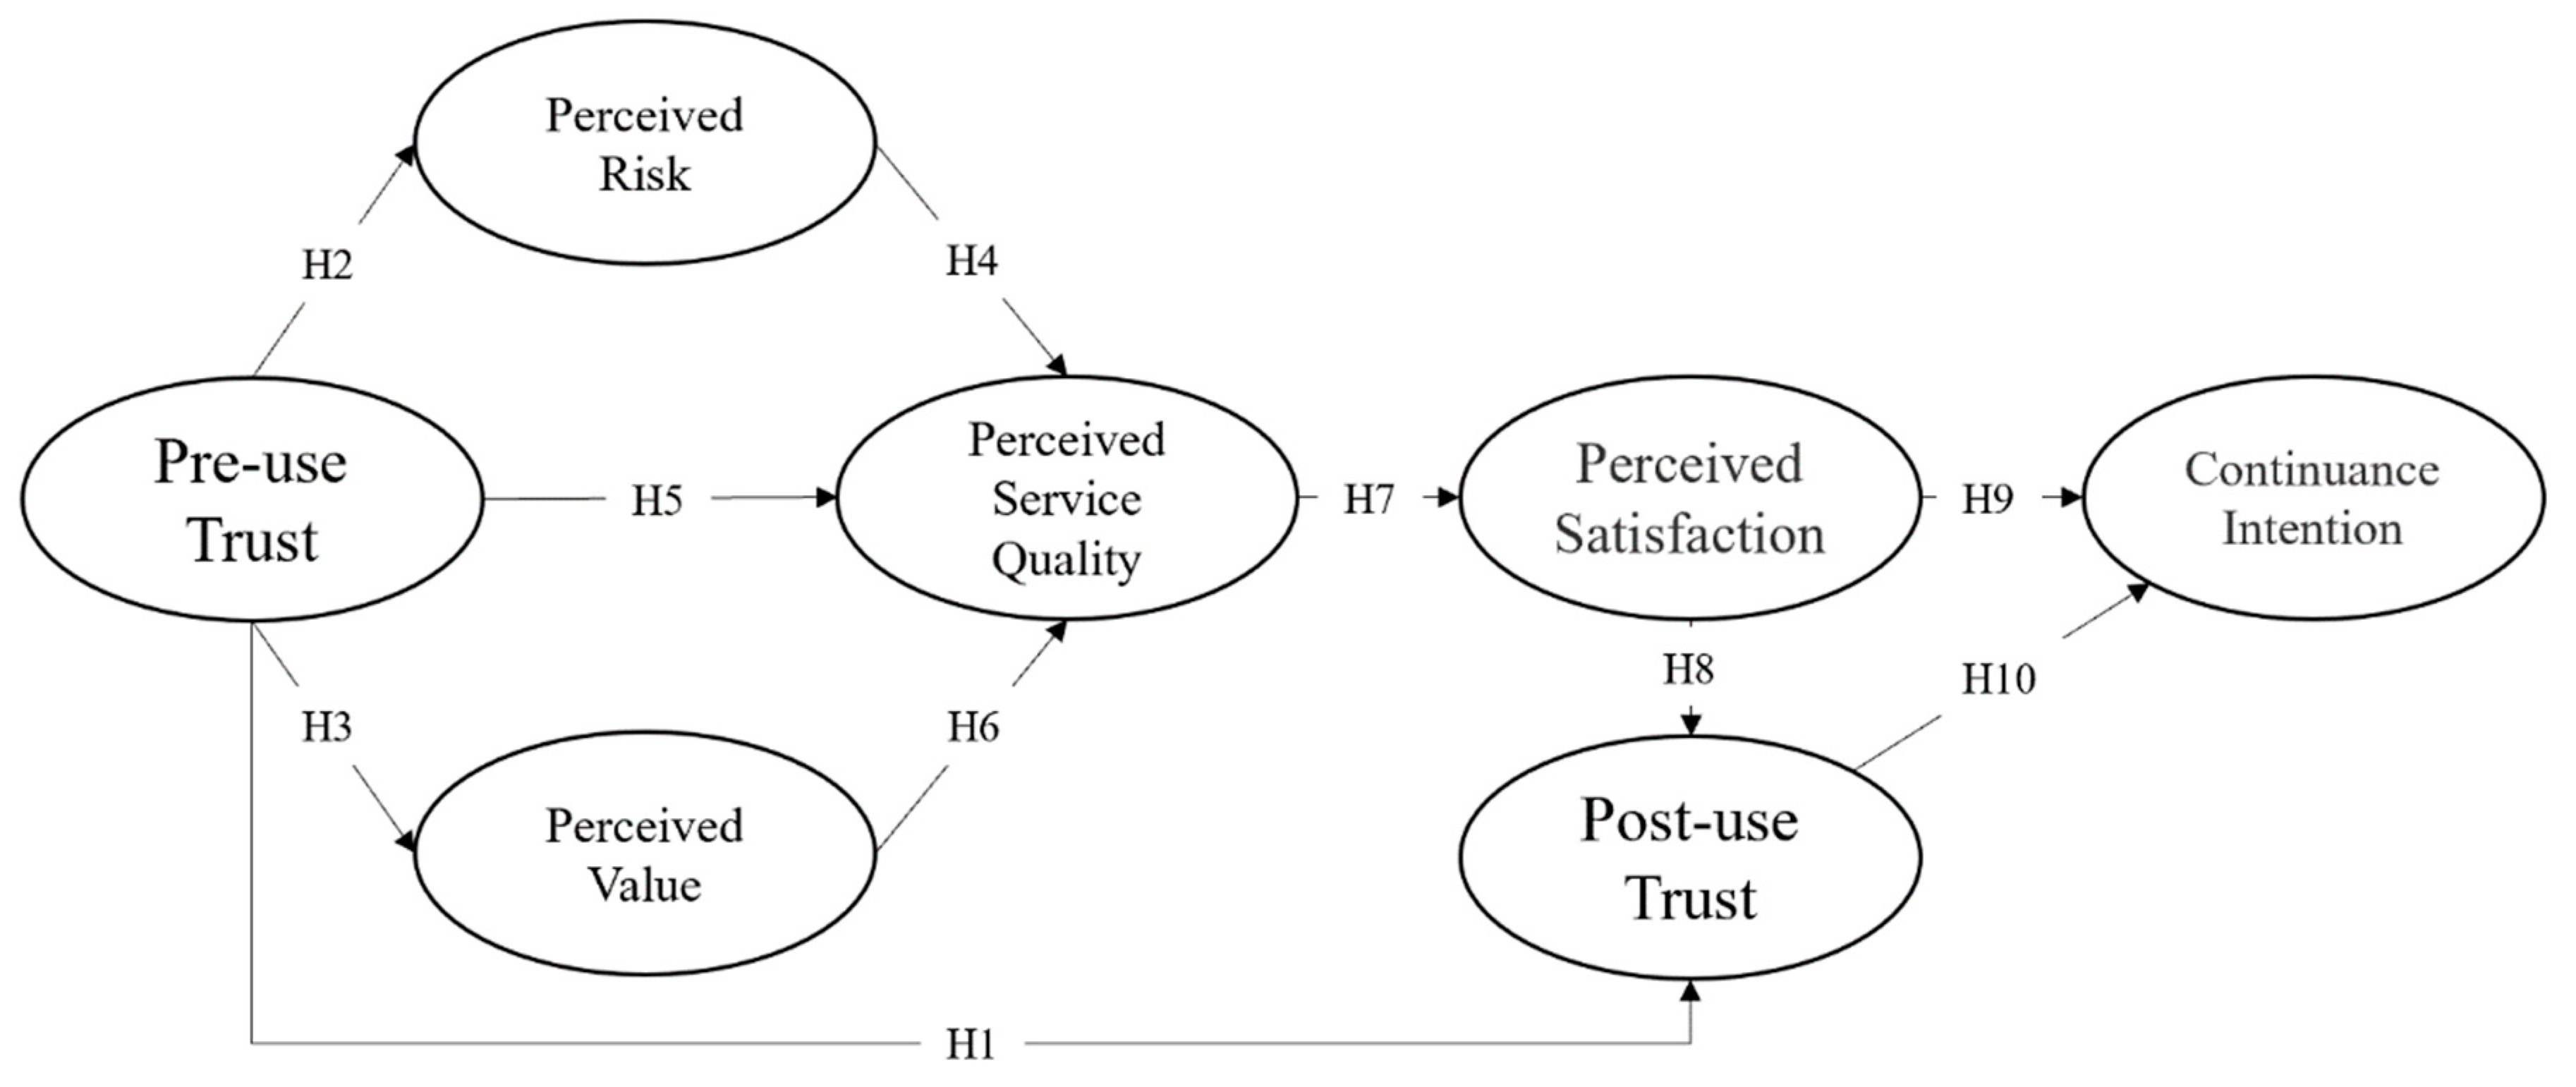
Figure 2). Our results can contribute to their specification by providing information about the reasons that drive the factors of this model.
This study established a model for key factors of older adults’ continuance intention dining at senior meal halls, and hypotheses to explain them. From a questionnaire formed from scales used in previous studies, data was gathered to enable structural equation modeling to be conducted to test these hypotheses. The findings allow suggestions to be put forth in order to shape aging policy to guide practitioners, and to support government decision-making.

2. Theoretical Framework and Research Hypotheses

2.1. Trust

As one of the factors explaining consumers’ attitude, satisfaction, commitment, or behavioral intention, trust plays a significant role in uncertain and risky circumstances [13,14]. Generally, trust is a mental state interpreted as positive results of “perceived probabilities”, “confidence”, or “expectations” [15]. Trust is a dynamic concept [16] that changes, develops, and accumulates through repeated behavior [17]. The trust level of consumers will change through use or experience, and there is a feedback cycle of “trust-action-study-trust”, which may repeatedly run [18]. Therefore, trust can be classified as pre-use trust and post-use trust, by which to describe differences of consumers’ trust in products or services through potential influencing factors, and understand the value and influence of products or services on consumers [19]. While the social participation of older adults and the environment complement each other, trust is the basis of social participation [20]. Therefore, to improve older adults’ participation level in the senior meal halls, and understand its influence on older adults, it is necessary to understand the difference between pre-use trust and post-use trust. Older adults’ welfare and quality of life could be focused on two aspects: food, and service. In this study, pre-use trust represented the trust level before the older adults participated in community senior meal halls, while post-use trust represented the trust level after the older adults had participated in the community senior meal halls. Pre-use trust is the prerequisite and influencing factor of post-use trust [16]. That is, in addition to the relevant influencing factors of the topic, post-use trust can also be affected by pre-use trust. Therefore, the hypothesis is as follows:
Hypothesis 1 (H1).
There is a significant positive correlation between pre-use trust and post-use trust in older adults’ participation in senior meal halls.

2.2. Perceived Risk (PR) and Perceived Value (PV)

Initially belonging to psychology, perceived risk refers to the expected negative effects that consumers feel when they buy specific products [21]. Due to factors such as retirement, the decline of physical functions, and social and economic status, older adults are likely to have social-psychological pressure, leading to a higher risk of depression [22]. In comparison with others, older adults are more likely to feel insecure. Although senior meal halls have been implemented for many years in Taiwan, many people still do not know much about them. Therefore, older adults may have concerns about issues such as food security [23] and economic cost [24]. The community service of senior meal halls mainly includes two aspects of “food” and “service”. “Food” belongs to the physical health dimension, which also includes the economic dimension, while “service” belongs to the psychological dimension [25]. In this study, perceived risk mainly explored the practical problems that older adults might face before or when participating in senior meal halls. Meanwhile, trust is one of the determinants to reduce perceived risk and uncertainty [26]. The higher the trust of older adults in senior meal halls, the lower the expected perceived risks are when they participate in community senior meal halls. Therefore, the hypothesis is as follows:
Hypothesis 2 (H2).
There is a significant negative correlation between pre-use trust and perceived risk in older adults’ participation in senior meal halls.
Value is the reflection of a capital cost optimization related to purchasing or production, which creates high-performing (value in use) and attractive (noble value) products or services for consumers [27]. On the other hand, perceived value is the value of products or services as perceived by consumers, which can be seen as the trade-off between perceived benefits and perceived costs [28]. Consumers will repeatedly patronize companies or enterprises with higher perceived value [29]. Although there is usually a negative correlation between perceived value and perceived risk [30], the perceived risk of this study focused more on reality, while the perceived value focused more on psychology. Therefore, no discussion will be made concerning the two factors. Mentally speaking, with certain accessibility, senior meal halls have lower participation requirements and offer opportunities to interact with others, which is one of the positive ways in which to achieve successful aging [31]. Therefore, taking senior meal halls as a platform and medium promotes older adults maintaining their physical and mental health, while older adults can encourage and support each other, and chat and interact to expand their social network [32]. Furthermore, the improvement of trust can also promote the improvement of perceived value [33]. Thus, the higher the trust in senior meal halls among older adults, the higher the probability of a positive perception of the community senior meal halls. Therefore, the hypothesis is as follows:
Hypothesis 3 (H3).
There is a significant positive correlation between pre-use trust and perceived value in older adults’ participation in senior meal halls.

2.3. Perceived Service Quality (PQ)

Perceived service quality is the consumers’ overall evaluation of the perceived service, and whether it meets their expectations [34]. The evaluation standard of the service quality is dynamic, which varies according to different service items [35], and is usually classified as interaction quality, physical service environment, and outcome quality [36]. Consumers’ previous experience can be an effective reference for perception and service quality analysis [37]. In other words, consumers must have experienced relevant services before having the perceived service quality, which will affect subsequent perception, such as satisfaction or brand loyalty [38], and further decisions about whether to use it again or not. Meanwhile, in the same way that perception is generated after using or experiencing a product or service, the perceived service quality will be affected by the previous factors of pre-use trust, perceived risk, and perceived value. In this study, perceived service quality represented the perceived service quality of the community senior meal halls participated by older adults. Therefore, the hypotheses are as follows:
Hypothesis 4 (H4).
There is a significant negative correlation between perceived risk and perceived service quality in older adults’ participation in senior meal halls.
Hypothesis 5 (H5).
There is a significant positive correlation between perceived value and perceived service quality in older adults’ participation in senior meal halls.
Hypothesis 6 (H6).
There is a significant positive correlation between pre-use trust and perceived service quality in older adults’ participation in senior meal halls.

2.4. Perceived Satisfaction (PS)

Perceived satisfaction is seen as an evaluation by comparing expectations and actual experience of products or services [39]. The service and experience evaluation results are considered to be the main predictors of behavioral intention [40]. Perceived service quality and satisfaction can be converted, as both are consumers’ evaluation factors or opinions on particular products or services [34]. The difference between the two factors is that the judgment criteria of perceived service quality are more realistic and concrete, while satisfaction depends more on personal tendency and emotion [41]. Therefore, older adults’ satisfaction with senior meal halls represents the relative relationship before and after the participation in community senior meal halls, which reflects the internal feeling of the older adults involved. Therefore, the hypothesis is as follows:
Hypothesis 7 (H7).
There is a significant positive correlation between perceived service quality and perceived satisfaction in older adults’ participation in senior meal halls.

2.5. Continuance Intentiion (CI)

Continuance intention, one of the means to measure whether products or services are successful [42], refers to the behavior shown after using or experiencing [43]. To promote the senior meal halls and make them widely accepted, in addition to the initial participation, continuance intention or behavior of the older adults is important [44]. As mentioned above, satisfaction is one of the main predictors [40,45] that affect the post-use trust [46] and continuance intention through trust [47]. In this study, continuance intention represented that, after participating in community senior meal halls, the older adults’ perceived probability of continuance use in the future from a subjective perspective. Therefore, the hypotheses are as follows:
Hypothesis 8 (H8).
There is a significant positive correlation between perceived satisfaction and post-use trust in older adults’ participation in senior meal halls.
Hypothesis 9 (H9).
There is a significant positive correlation between perceived satisfaction and continuance intention in older adults’ participation in senior meal halls.
Hypothesis 10 (H10).
There is a significant positive correlation between post-use trust and continuance intention in older adults’ participation in senior meal halls.

2.6. Proposed Theoretical Model

Based on the discussions above, ten research hypotheses and the following model (e.g., Figure 3) were proposed. In particular, the model includes seven dimensions, namely pre-use trust, perceived risk, perceived value, perceived service quality, perceived satisfaction, post-use trust, and continuance intention.

2.7. Definition and Measure of Variables

Based on the research topic and related literature, this questionnaire for this study was designed by selecting items from previous studies. The variables, operationalized definitions, and source of the items are shown in Table 1.

3. Data and Methodology

3.1. Sample and Data Collection

Taking older adults who have participated in senior meal halls as subjects, from March to May 2021, the questionnaires of this study were distributed to older adults in 88 senior meal halls in Yunlin County in written form. Ethical approval for this study was obtained from the National Cheng Kung University Human Research Ethics Committee (110-417-2). All participants originally gave informed consent to participate in this survey, including consent for their data to be used for research purposes. There were 20 to 30 older adults in each hall on average, and five to six people were randomly selected. In addition to demographic variables, the Likert 7-point scale was used for the items, ranging from 1 point (Strongly disagree) to 7 points (Strongly agree). Finally, 440 samples were collected. After eliminating invalid samples (logic error or too many similar options), there were 416 valid questionnaires. The estimated parameters of this research questionnaire include 38 questions, while all 416 questionnaires met Jackson’s standard, where the ratio of estimated parameters to sample number should be higher than 1:10 [55]. Therefore, the following data analysis is based on these valid questionnaires.
Overall, among these respondents, 46.9% were male, and 53.1% were female. Over half of the participants(60.6%) had received an elementary school education. 67.1% were lived with family members, whereas 32.9% were lived independently. Most participants reported living in rural areas (62.5%). Approximately 38% of older adults reported that their main mode of transportation was using a private vehicle (motorcycle or car), 26.2% by bicycle, and 35.8% by foot. Slightly more than half of the respondents (51%) reported preparing food materials on their own, and 34% older adults received food prepared by family members, and others by neighborhood, friends, and caregivers (15%). Furthermore, older adult respondents reported “occasionally (48.1%)” for their weekly cooking frequency, followed by “frequently (21.1%)”, and “always (14.9%)”.

3.2. Reliability Analysis

Reliability tests and item analyses were carried out based on the results of the pre-test questionnaire to make the research results more accurate. The unstable items were deleted to ensure the reliability and avoid discrimination of the scales. As indicated in Table 2, the Cronbach`s α value of all dimensions is greater than 0.7, meaning that all the dimensions have high reliability. Furthermore, the Cronbach’s α value of each dimension will be lower than the current results when any of the items is deleted, suggesting that no item should be deleted. In general, the scales have high reliability for further analysis.

3.3. Descriptive Analysis and Normal Distribution Test

The hypothesis model of this study includes seven dimensions, namely pre-use trust, perceived risk, perceived value, perceived service quality, perceived satisfaction, post-use trust, and continuance intention. Moreover, the 38 items, along with the mean and standard deviation of the samples are shown in Table 3. At the same time, Table 4 shows the normal distribution of the sample data. The absolute value of skewness of all components is less than 3, while the absolute value of kurtosis is less than 7. Thus, it is considered that the data in this study conform with the normal distribution [56].

3.4. Confirmatory Factor Analysis

3.4.1. Convergent Validity

AMOS v22.0 software was adopted to analyze the structural equation model in this study. Through a large amount of research, AMOS was proven to be a reliable structural equation model software. In addition, the data analysis includes two stages, according to the study of Anderson and Gerbing [57]. The first stage is the measurement model, where the maximum likelihood estimation method is used to estimate parameters, including factor loading, reliability, convergent validity, and discriminant validity. Congruent with the studies on convergence validity by Hair et al. [58], Nunnally and Bernstein [59] and Fornell and Larcker [60], and the study on loading of standardized factors by Chin [61] and Hooper et al. [62], the standardized factor loading in this study is higher than 0.6, the reliability of study dimension composition is higher than 0.7, and the average variance extraction (AVE) is higher than 0.5. These results indicate that the dimensions have good convergence validity [58]. The above numbers are listed in Table 4.
For discriminant validity, according to the study of Fornell and Larcker [60], if the square root of the AVE of each dimension is greater than the correlation coefficient between dimensions, it indicates that the model has discriminant validity. Meanwhile, this study showed that the values of all diagonal lines are greater than those outside the diagonal lines, indicating that every dimension in this study has a good discriminant validity (e.g., Table 5).

3.4.2. Model Fit Test

According to Jackson et al. [63], Kline [56], Schumacker [64], and Hu and Bentler [65], several indicators (MLχ2, DF, χ2/DF, RMSEA, SRMR, TLI, CFI, NFI, GFI, PGFI, PNFI, and IFI) should be selected to evaluate the structural model fit. Based on the research hypothesis and models, as shown in Table 6, most of the standard model fit evaluation indicators meet the recommended fit’s independent and combination rules. Hence, the structural model has a good fit.

3.5. Path Analysis

The path analysis results of Table 7 indicate that Pre-use Trust(PT) significantly influences Post-use Trust(PO)(b = 0.296, p < 0.001), Perceived Risk(PR) (b = −0.226, p = 0.001), and PV (b = 0.469, p < 0.001). Perceived Risk (PR) (b = −0.165, p < 0.001) and Pre-use Trust(PT) (b = 0.306 p < 0.001) significantly influence Perceived Service Quality(PQ). Perceived Service Quality (PQ) (b = 0.360, p < 0.001) significantly influences Perceived Satisfaction (PS). Perceived Satisfaction (PS) (b = 0.175, p = 0.001) significantly influences Post-use Trust (PO). Perceived Satisfaction (PS) (b = 0.127, p = 0.021) and Post-use Trust(PO) (b = 0.307, p < 0.001) significantly influence Continuance Intention (CI).

3.6. Hypothesis Explanation

This study used the structural equation model to determine the influence factors of continuance intention on older adults’ participation in senior meal halls.
Table 7 shows the normalization coefficient of the Structural equation modeling (SEM) model in this study. The higher coefficient implies that the independent variable plays a significant role in the dependent variable. Meanwhile, Figure 4 shows the influence between variables in the structural model.

4. Discussion

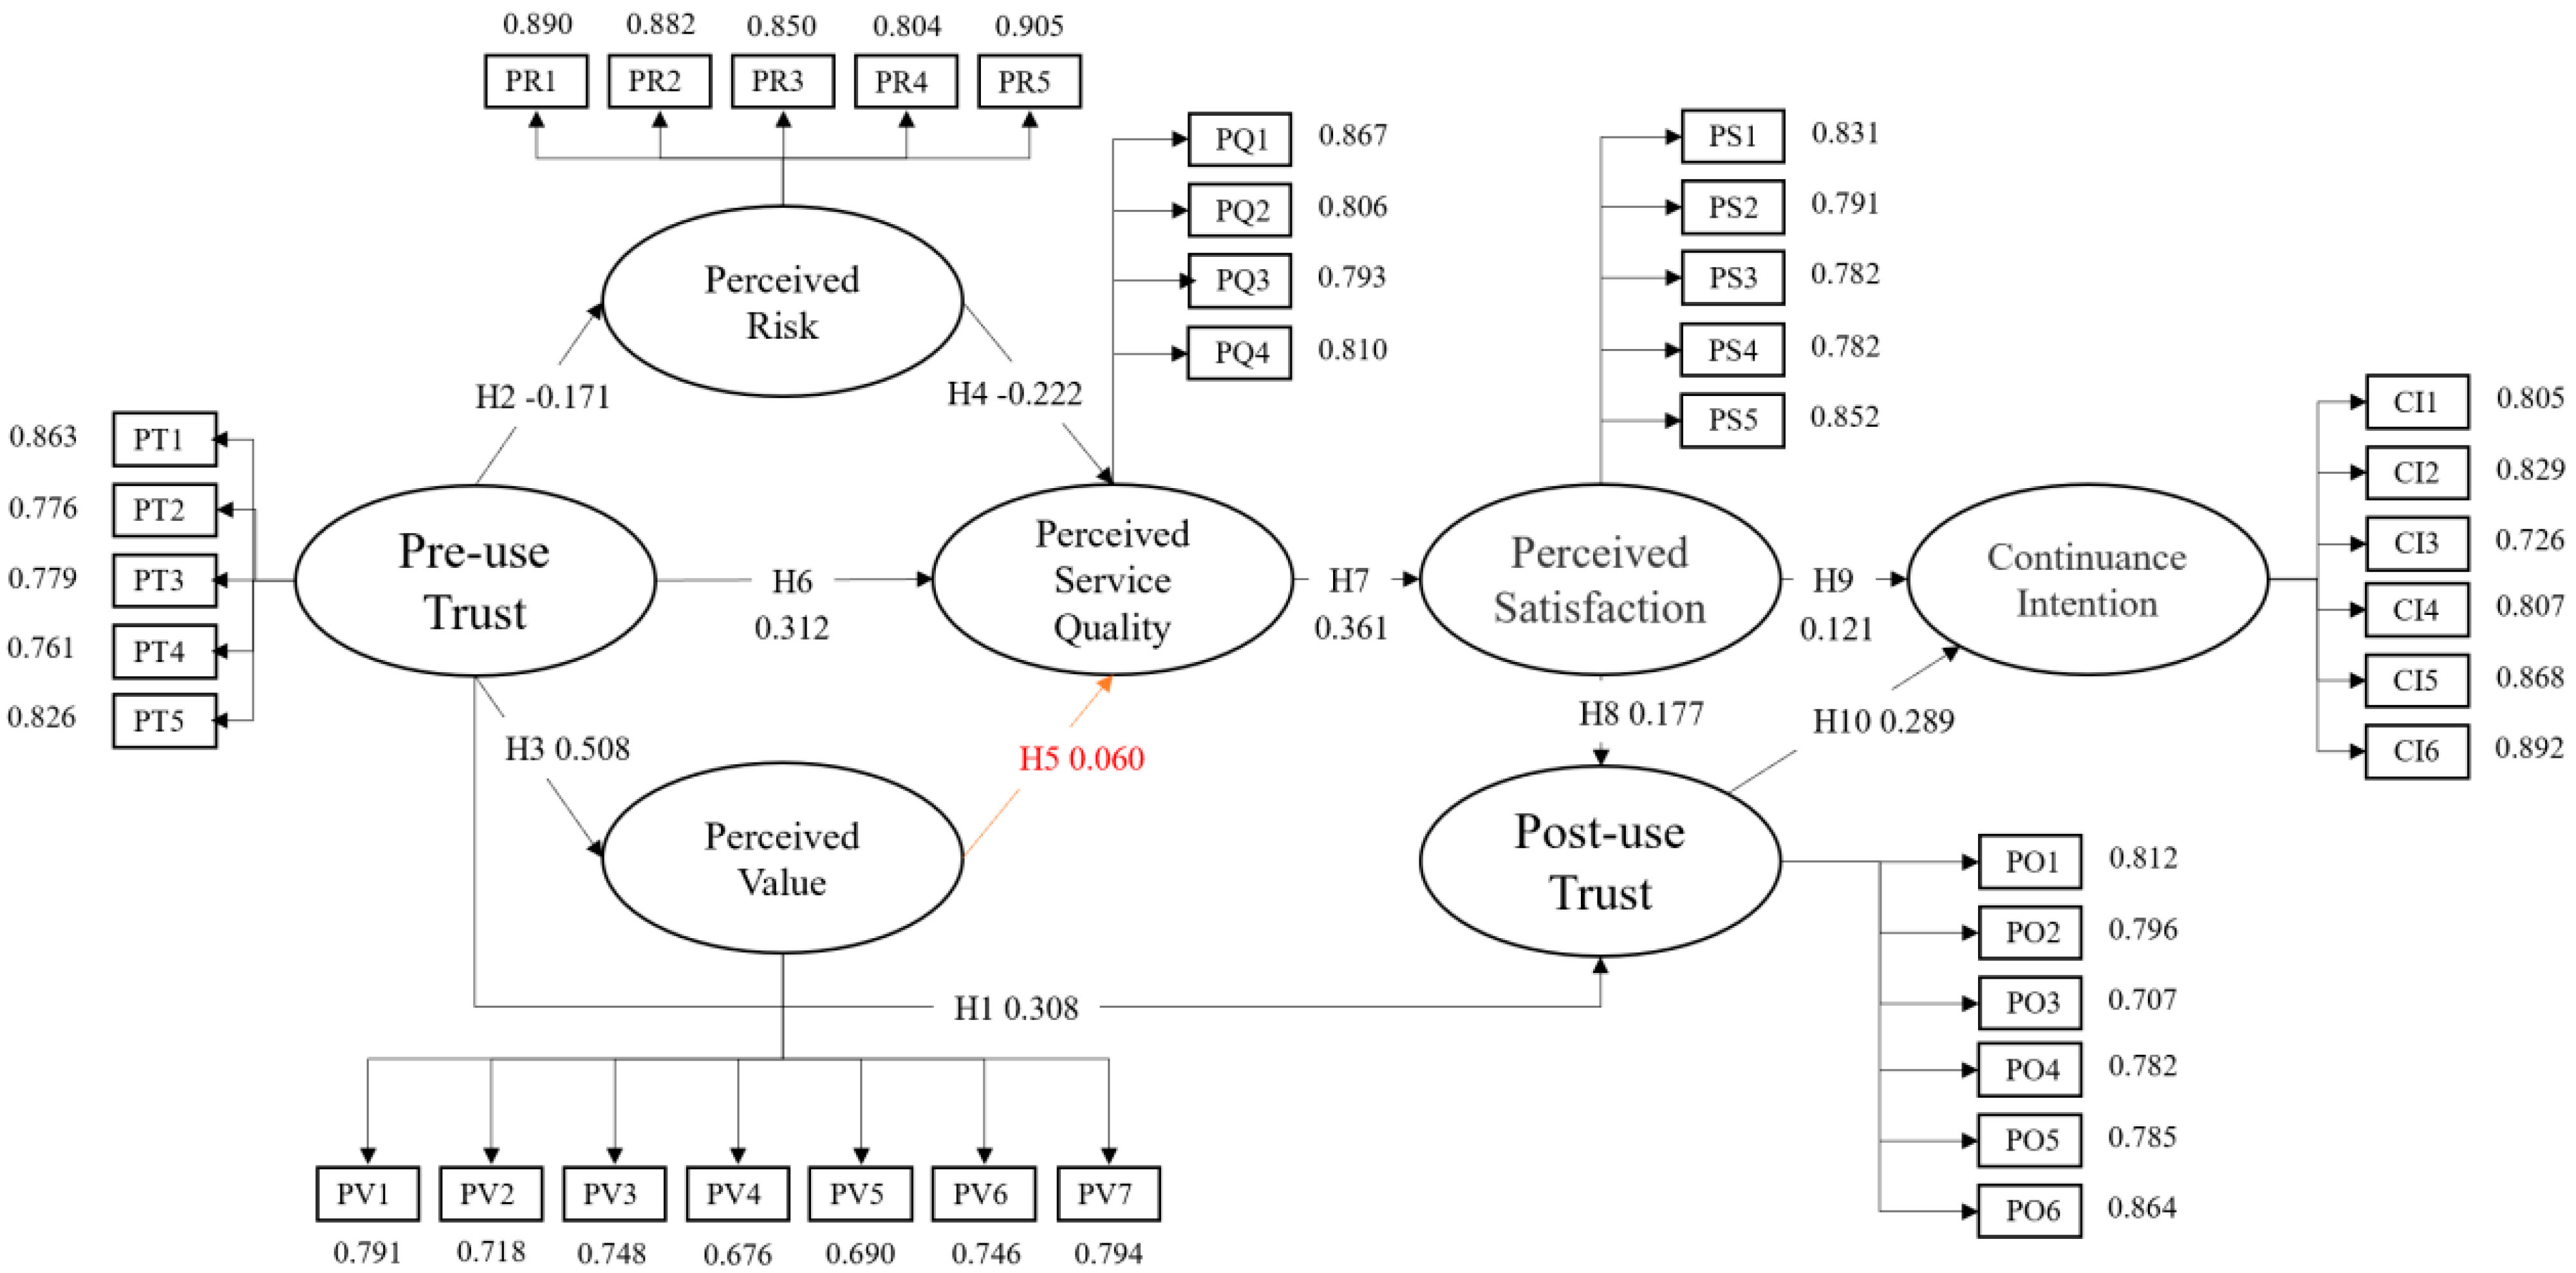
This study identified critical factors affecting older adults’ continuous participation in senior meal halls through structural equation modeling. Our study results in several important findings.
First, this result provides evidence that older adults’ pre-use trust has a strong positive effect on perceived value. The hypothesis from extended valence framework along with the hypothesized path from pre-use trust to usage in the perceived value stage of the model is fully supported. Further, the path coefficient is the highest, suggesting that the more positive pre-use trust the older adults hold, the more value they can feel from the senior meal halls. Through relevant government policy advocacies, shared peer and community recommendations, trial and guide promotion meetings, such information on the space equipment, food concepts, and functions of senior meal halls, older adults have already known the content of attending the meal program. It has generated public reputation on its effectiveness, and constructed the participants’ pre-use trust in senior meal halls. Moreover, after their actual participation in senior meal halls, the older adults feel motivated to enter the senior meal halls, and participate in the well-designed food promotion activities and catering services. In addition, they can get to know, talk, and share life trivia with other older adults and enthusiastic volunteers to achieve the effects on physical and mental health. Consequently, the trust level of senior meal hall participants will positively correlate with the perceived value.
Among the survey samples, 67% of older adults live with their family members. In addition to their own efforts, they need the assistance of family members or caregivers to prepare their meals. Although 84% of the older adults have cooking habits, they easily fail to have a balanced diet [9], because of their children’s eating out, a small number of diners, and an unstable meal preparation. Therefore, it is necessary for older adults to eat in a community society. Older adults of the same age may relieve their psychological pressure, and find a way to communicate with others through the interaction of eating together [66]. In addition, the correct dietary concept could be communicated in the process through the transmission and exchange of nutritional information. These findings are consistent with the results of previous studies [67,68]. Furthermore, the older adults feel at ease to eat at a fixed meal time, feeling that it can reduce the burden and trouble of their children in the meal preparation [69], and that they need not rely on relatives and friends to live. Ultimately, they feel the value of participation in senior meal halls.
Second, the results indicate pre-use trust has a strong negative effect on perceived risk. Perceived risks existed due to the limitations of individual economic ability, food preparation ability, mobility, and physical and mental degradation to older adults’ participation in senior meal halls [70,71]. The results of this study suggest that more than 60% of the older adults get to and from the senior meal halls by cars and motorcycles, while 40% walk, which may lead to traffic risks [72,73]. In addition, due to the recent improvement of dietary quality and concept, the concern for food security has also increased. Moreover, with the help of nutritionists in planning the menu, there is no need to eat leftovers several times, or excessively pickled food as in the past, as an imbalanced diet may lead to imbalanced nutrition [74]. Therefore, the risk factors such as cost standard, taste, nutritional balance, and food security are relatively reduced, proving a significant negative correlation between the degree of pre-use trust and the perceived risk. Moreover, the higher the pre-use trust is, the lower the degree of perceived risk older adults hold.
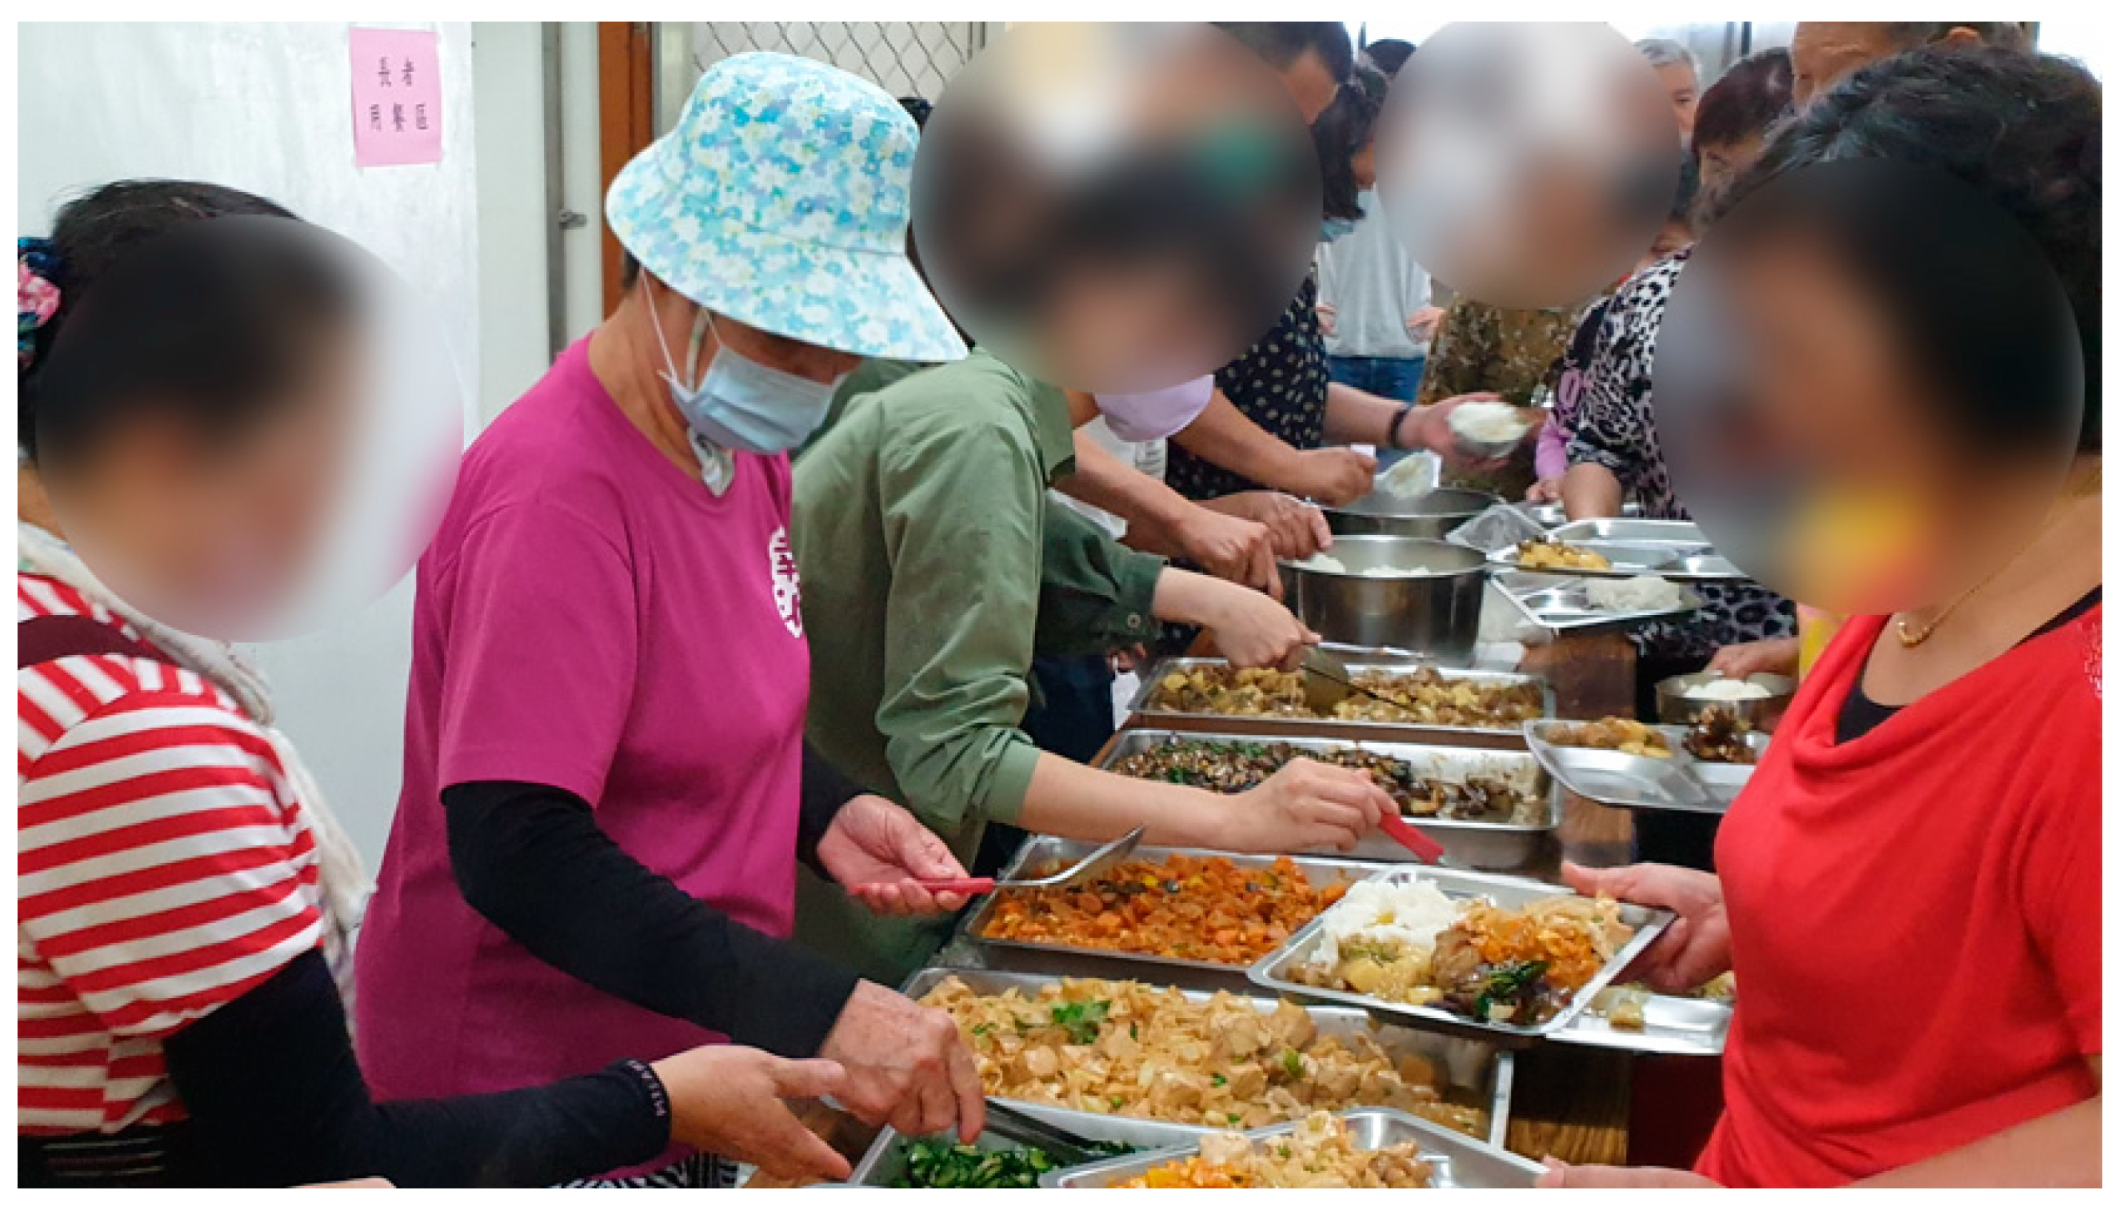
Third, we find that there is a significant negative correlation between the above-mentioned older adults’ perceived risk and the senior consumers’ perceived service quality. In addition, the older adults’ pre-use trust in senior meal halls and their perceived service quality has a significant positive correlation. This represents the concept of pre-use trust fully established by senior meal halls through government policies and community word-of-mouth. Currently, senior meal halls in Taiwan also encourage older adults not only to be passive recipients of care services, but also to become service providers (Figure 5). Therefore, many volunteers are involved in various service projects of the senior meal halls. The image they have established also promotes the perceived service quality of the older adults’ participation [75].
However, there is no significant correlation between the perceived value and the perceived service quality in older adults’ participation in senior meal halls. This result is different from the proposed hypothesis (H5). The reason why the perceived value does not influence perceived service quality may be that the perceived value of older adults belongs to the spiritual and psychological level of services, such as atmosphere [76], interaction mode, and diet education. Meanwhile, the perceived service quality corresponds with clear service contents (taste, space construction, charging price, and others). Older adults may pay more attention to the actual perceived service quality, while less attention is paid to the influence of psychological value.
In terms of the overall perceived service quality, the current senior meal halls, in combination with the Long-term Care Plan of Taiwan 2.0, shall provide nutritional assessment and interview and nutritional consultation for dietary guidance, alongside providing rich and varied dishes according to the needs and physical conditions of the older adults. As for management and control of service quality, a standard menu for cooking dishes should be established to ensure stable color, flavor, and taste in each dish. In daily quality control management, the service quality of internal staff should be emphasized, and workflow should be formulated to avoid unstable quality.
An irregular satisfaction survey of the meals should be conducted to serve as a basis for adjusting and improving dishes. In addition, services, such as simple blood pressure measurement, prevention of dementia, and nutrition lectures could be added. At the same time, the circular economy model is applied to increase the participation opportunities of older adults of the same age, by which to improve their participation in the perceived satisfaction of senior meal halls. The overall evaluation of the above specific service items indicates the experience and feelings of the older adults, making them feel that perceived service quality is essential for the perceived satisfaction of the senior meal halls. As one of the core services, perceived service quality is an important reference indicator for the overall high satisfaction of the senior meal halls.
Fourth, we find that there is a significant positive correlation among perceived satisfaction, post-use trust, and continuance intention of older adults participating in senior meal halls, which shows that the perceived satisfaction influences trust attitude and continuance intention. Furthermore, the higher the perceived satisfaction, the greater the influence on the post-use trust and continuance intention among older adults. Through meal planning and food security, cleaning, interpersonal interaction, price, space layout and arrangement, and other service factors such as meal serving, the sense of community is established, where post-use trust is consequently generated.
Finally, there is a significant positive correlation between post-use trust and continuance intention on older adults’ participation in senior meal halls. This suggests that the post-use trust of this study has an influence on the continuance intention behavior. Use trust will become one of the factors in considering whether older adults continue to participate in the senior meal hall plan. The higher the trust, the more concerned they will be about hall equipment, space cooperation, and dining atmosphere. Consequently, a higher continuance intention of participation is generated [65]. In contrast, continuous participation in senior meal halls gradually changes the diet and lifestyle of older adults and promotes successful aging.

5. Conclusions and Suggestions

5.1. Conclusions

With the rapid development of the aging society, the older adults’ catering services and lifestyles are constantly changing. In Taiwan, by eating together in the form of senior meal halls run by communities and relying on stable government planning and mechanism, it is expected that the dietary needs of the older adults could be met, and successful and healthy aging could be achieved. Previous studies on the senior meal halls for older adults are mostly qualitative analyses, lacking empirical data. Based on various important theories, the contribution of this study is to take pre-use trust as the first level of influence source of post-use trust, perceived risk, and perceived value, and establish a theoretical framework to influence the initial attitude of older adults participating in senior meal halls. The structural equation model was used to determine the main factors affecting the perceived service quality, perceived satisfaction, and continuance intention. Moreover, through an analysis of the related influence of this study, most of the dimensions have a direct or indirect influence on the continuance intention of participating in senior meal halls. The model of influencing factors on continuance intention of older adults’ participation in senior meal halls established in this study is an acceptable model, which suggests that this model has a certain effect on explaining the intention of the older adults’ participation in senior meal halls. Consequently, this can also provide an important reference for future policy and industrial development.
In addition, the results also show that the perceived service quality is the main factor that predicts the perceived satisfaction, while the perceived satisfaction of the older adults plays an important role in this survey. It shows that if the older adults are satisfied with the service quality (such as food flavor, space environment, atmosphere, among other factors) provided by the senior meal halls, which will accordingly affect the post-use trust, they will show a positive continuance intention to participate in the senior meal halls.
Through this survey, we believe that our study provided comprehensive insights and evidence into older adult’s continuance intention process in congregate meal halls. The survey also indicated that, in addition to their concern about the food provided, the older adults also pay attention to how they can avail of health education publication services, nutrition consulting services, welfare information, or recommendation services through senior meal halls [77]. Therefore, it is essential to determine how to develop other regular activities to increase interaction frequency, social interaction, and willingness to continue participating [78]. This may include increasing the participation of older adults by recommendation, front-end tasks such as picking vegetables, washing vegetables, or menu planning, and follow-up tasks such as serving dishes, placing dishes, tidying up, or space arrangement, so that older adults can have a sense of achievement in social participation and labor efforts. At the same time, efforts should be made to improve the mobility limitations of older adults due to aging or inconvenient transportation. All of these will be indispensable factors for older adults to continue participating in senior meal halls.

5.2. Research Limitations and Future Research Suggestions

Some limitations of this study may indicate future research directions.
Firstly, this study explored the mutual influencing factors of the older adults’ trust attitude, perceived value, and continuance intention of participating in senior meal halls. Thus, researchers can continue to explore multiple dietary plans with different meal-sharing patterns and service scales in the future. Secondly, due to the limitation of time and resources, this study only collected questionnaires from senior meal halls run by public sectors in central Taiwan. Although a highly aged county in Taiwan was taken as a reference value, individual differences still exist in different counties and cities. Therefore, different opinions may be held on the topic of this study. It is suggested that future research explores senior meal halls run by different counties, cities, or organizations to provide a reference for the government, communities, and relevant industries.

Author Contributions

Conceptualization, W.-C.T.; Data curation, W.-C.T.; Formal analysis, W.-C.T.; Supervision, W.-C.T. and X.C.; Writing—original draft, W.-C.T.; Writing—review and editing, W.-C.T. and X.C. All authors have read and agreed to the published version of the manuscript.

Funding

This research was funded by the Taiwan Ministry of Science and Technology (grant number: MOST 110-2410-H-224 -017).

Institutional Review Board Statement

The study was conducted according to the guidelines of the Declaration of Helsinki, and approved by National Cheng Kung University Human Research Ethics Committee under number (110-417-2).

Informed Consent Statement

Informed consent was obtained from all subjects involved in the study. All respondents gave their informed consent for inclusion of their answers before they participated in the study. Respondent details have been collected in an anonymous way with no personally identifiable information. Written informed consent has been obtained from the patient(s) to publish this paper.

Data Availability Statement

The data presented in this study are available on request from the first author.

Acknowledgments

I am grateful to Guan-Ting Lu for his work in data collection and the grant of Ministry of Science and Technology. I also thank the anonymous reviewers who provided valuable comments on the manuscript.

Conflicts of Interest

The authors declare no conflict of interest.

References

  1. WHO. Ageing, Active: A Policy Framework; WHO: Geneva, Switzerland, 2002. [Google Scholar]
  2. National Development Council, Population Projection 2020-2070, Taiwan. Available online: https://www.ndc.gov.tw/ (accessed on 26 October 2021).
  3. Han, J.; Richardson, V.E. The relationships among perceived discrimination, self-perceptions of aging, and depressive symptoms: A longitudinal examination of age discrimination. Aging Ment. Health 2014, 19, 747–755. [Google Scholar] [CrossRef] [PubMed]
  4. Carandang, R.R.; Shibanuma, A.; Kiriya, J.; Asis, E.; Chavez, D.C.; Meana, M.; Murayama, H.; Jimba, M. Determinants of depressive symptoms in Filipino senior citizens of the community-based ENGAGE study. Arch. Gerontol. Geriatr. 2019, 82, 186–191. [Google Scholar] [CrossRef] [PubMed]
  5. Holt-Lunstad, J.; Smith, T.B.; Baker, M.; Harris, T.; Stephenson, D. Loneliness and Social Isolation as Risk Factors for Mortality. Perspect. Psychol. Sci. 2015, 10, 227–237. [Google Scholar] [CrossRef] [Green Version]
  6. Santini, Z.I.; Jose, P.E.; Cornwell, E.Y.; Koyanagi, A.; Nielsen, L.; Hinrichsen, C.; Meilstrup, C.; Madsen, K.R.; Koushede, V. Social disconnectedness, perceived isolation, and symptoms of depression and anxiety among older Americans (NSHAP): A longitudinal mediation analysis. Lancet Public Health 2020, 5, e62–e70. [Google Scholar] [CrossRef] [Green Version]
  7. Buffel, T.; Handler, S. Age-Friendly Cities and Communities: A Global Perspective; Policy Press: Bristol, UK, 2018. [Google Scholar]
  8. Lewis, C.; Buffel, T. Aging in place and the places of aging: A longitudinal study. J. Aging Stud. 2020, 54, 100870. [Google Scholar] [CrossRef]
  9. Fulkerson, J.A.; Larson, N.; Horning, M.; Neumark-Sztainer, D. A Review of Associations Between Family or Shared Meal Frequency and Dietary and Weight Status Outcomes Across the Lifespan. J. Nutr. Educ. Behav. 2014, 46, 2–19. [Google Scholar] [CrossRef] [PubMed]
  10. Divert, C.; Laghmaoui, R.; Crema, C.; Issanchou, S.; Van Wymelbeke, V.; Sulmont-Rossé, C. Improving meal context in nursing homes. Impact of four strategies on food intake and meal pleasure. Appetite 2015, 84, 139–147. [Google Scholar] [CrossRef] [PubMed]
  11. Welfare, M.O.H.A. Ten-Year Long-Term Care Program. Available online: https://1966.gov.tw/LTC/cp-3635-42393-201.html (accessed on 26 October 2021).
  12. Phillips, J.; Walford, N.; Hockey, A. How do unfamiliar environments convey meaning to older people? Urban dimensions of placelessness and attachment. Int. J. Ageing Later Life 2012, 6, 73–102. [Google Scholar] [CrossRef]
  13. Hartmann, M.; Klink, J.; Simons, J. Cause related marketing in the German retail sector: Exploring the role of consumers’ trust. Food Policy 2015, 52, 108–114. [Google Scholar] [CrossRef]
  14. Sengupta, A.S.; Balaji, M.; Krishnan, B.C. How customers cope with service failure? A study of brand reputation and customer satisfaction. J. Bus. Res. 2014, 68, 665–674. [Google Scholar] [CrossRef]
  15. Şahin, A.; Kitapçi, H.; Zehir, C. Creating Commitment, Trust and Satisfaction for a Brand: What is the Role of Switching Costs in Mobile Phone Market? Procedia Soc. Behav. Sci. 2013, 99, 496–502. [Google Scholar] [CrossRef] [Green Version]
  16. Lee, J.-N.; Choi, B. Effects of initial and ongoing trust in IT outsourcing: A bilateral perspective. Inf. Manag. 2011, 48, 96–105. [Google Scholar] [CrossRef]
  17. Gefen, D.; Karahanna, E.; Straub, D. Inexperience and experience with online stores: The importance of tam and trust. IEEE Trans. Eng. Manag. 2003, 50, 307–321. [Google Scholar] [CrossRef] [Green Version]
  18. Urban, G.L.; Amyx, C.; Lorenzon, A. Online Trust: State of the Art, New Frontiers, and Research Potential. J. Interact. Mark. 2009, 23, 179–190. [Google Scholar] [CrossRef]
  19. Lin, J.; Wang, B.; Wang, N.; Lu, Y. Understanding the evolution of consumer trust in mobile commerce: A longitudinal study. Inf. Technol. Manag. 2013, 15, 37–49. [Google Scholar] [CrossRef]
  20. Veenstra, G.; Luginaah, I.; Wakefield, S.; Birch, S.; Eyles, J.; Elliott, S. Who you know, where you live: Social capital, neighbourhood and health. Soc. Sci. Med. 2005, 60, 2799–2818. [Google Scholar] [CrossRef]
  21. Dunn, M.G.; Murphy, P.E.; Skelly, G.U. Research note: The influence of perceived risk on brand preference for supermarket products. J. Retail. 1986, 62, 204–216. [Google Scholar]
  22. Koster, A.; Bosma, H.; Kempen, G.I.; Penninx, B.W.; Beekman, A.T.; Deeg, D.J.; van Eijk, J.T. Socioeconomic differences in incident depression in older adults: The role of psychosocial factors, physical health status, and behavioral factors. J. Psychosom. Res. 2006, 61, 619–627. [Google Scholar] [CrossRef]
  23. Bergmans, R.S.; Sadler, R.C.; Wolfson, J.A.; Jones, A.D.; Kruger, D. Moderation of the Association Between Individual Food Security and Poor Mental Health by the Local Food Environment Among Adult Residents of Flint, Michigan. Health Equity 2019, 3, 264–274. [Google Scholar] [CrossRef] [Green Version]
  24. Murayama, Y.; Yamazaki, S.; Yamaguchi, J.; Hasebe, M.; Fujiwara, Y. Chronic stressors, stress coping and depressive tendencies among older adults. Geriatr. Gerontol. Int. 2020, 20, 297–303. [Google Scholar] [CrossRef]
  25. Huang, J.-P. Discussion on the Satisfaction and Depression Emotion of the Elderly in the Community and the Related Factors; National Taipei University of Nursing and Health Sciences: Taipei, Taiwan, 2018. [Google Scholar]
  26. Kim, S.S.; Malhotra, N.K. A Longitudinal Model of Continued IS Use: An Integrative View of Four Mechanisms Underlying Postadoption Phenomena. Manag. Sci. 2005, 51, 741–755. [Google Scholar] [CrossRef]
  27. Eggert, A.; Ulaga, W.; Frow, P.; Payne, A. Conceptualizing and communicating value in business markets: From value in exchange to value in use. Ind. Mark. Manag. 2018, 69, 80–90. [Google Scholar] [CrossRef]
  28. Lovelock, C. Services Marketing People, Technology, Strategy, 5/e; Pearson Education: London, UK, 2008. [Google Scholar]
  29. Ryu, K.; Lee, H.-R.; Kim, W.G. The influence of the quality of the physical environment, food, and service on restaurant image, customer perceived value, customer satisfaction, and behavioral intentions. Int. J. Contemp. Hosp. Manag. 2012, 24, 200–223. [Google Scholar] [CrossRef]
  30. Ho, S.S.; Leong, A.D.; Looi, J.; Chen, L.; Pang, N.; Tandoc, E. Science Literacy or Value Predisposition? A Meta-Analysis of Factors Predicting Public Perceptions of Benefits, Risks, and Acceptance of Nuclear Energy. Environ. Commun. 2018, 13, 457–471. [Google Scholar] [CrossRef]
  31. Cheng, M.-H.; Zheng, M.-C. Arrangements of the congregate meal site based on elderly interactive behavior. In Proceedings of the 2017 International Conference on Applied System Innovation (ICASI), Sapporo, Japan, 13–17 May 2017; pp. 154–157. [Google Scholar] [CrossRef]
  32. Cassel, J. Psychosocial Processes and “Stress”: Theoretical Formulation. Int. J. Health Serv. 1974, 4, 471–482. [Google Scholar] [CrossRef]
  33. Kim, D.J.; Ferrin, D.L.; Rao, H.R. Trust and Satisfaction, Two Stepping Stones for Successful E-Commerce Relationships: A Longitudinal Exploration. Inf. Syst. Res. 2009, 20, 237–257. [Google Scholar] [CrossRef] [Green Version]
  34. Chen, C.-F. Investigating structural relationships between service quality, perceived value, satisfaction, and behavioral intentions for air passengers: Evidence from Taiwan. Transp. Res. Part A Policy Pr. 2008, 42, 709–717. [Google Scholar] [CrossRef]
  35. Chen, L.; Li, Y.-Q.; Liu, C.-H. How airline service quality determines the quantity of repurchase intention—Mediate and moderate effects of brand quality and perceived value. J. Air Transp. Manag. 2018, 75, 185–197. [Google Scholar] [CrossRef]
  36. Brady, M.K.; Cronin, J.J. Some New Thoughts on Conceptualizing Perceived Service Quality: A Hierarchical Approach. J. Mark. 2001, 65, 34–49. [Google Scholar] [CrossRef] [Green Version]
  37. Ju, Y.; Back, K.-J.; Choi, Y.; Lee, J.-S. Exploring Airbnb service quality attributes and their asymmetric effects on customer satisfaction. Int. J. Hosp. Manag. 2018, 77, 342–352. [Google Scholar] [CrossRef]
  38. Cheng, C.-C.; Chang, Y.-Y.; Chen, C.-T. Construction of a service quality scale for the online food delivery industry. Int. J. Hosp. Manag. 2021, 95, 102938. [Google Scholar] [CrossRef]
  39. Oliver, R.L. A Cognitive Model of the Antecedents and Consequences of Satisfaction Decisions. J. Mark. Res. 1980, 17, 460–469. [Google Scholar] [CrossRef]
  40. Gabbott, M.; Hogg, G. An empirical investigation of the impact of non-verbal communication on service evaluation. Eur. J. Mark. 2000, 34, 384–398. [Google Scholar] [CrossRef]
  41. Oliver, R.L. Satisfaction: A Behavioral Perspective on the Consumer: A Behavioral Perspective on the Consumer; Routledge: Oxford, UK, 2014. [Google Scholar]
  42. Teo, T.S.H.; Srivastava, S.C.; Jiang, L. Trust and Electronic Government Success: An Empirical Study. J. Manag. Inf. Syst. 2008, 25, 99–132. [Google Scholar] [CrossRef]
  43. Montazemi, A.R.; Qahri-Saremi, H. Factors affecting adoption of online banking: A meta-analytic structural equation modeling study. Inf. Manag. 2015, 52, 210–226. [Google Scholar] [CrossRef]
  44. Bhattacherjee, A. Understanding Information Systems Continuance: An Expectation-Confirmation Model. MIS Q. 2001, 25, 351–370. [Google Scholar] [CrossRef]
  45. Dash, G.; Kiefer, K.; Paul, J. Marketing-to-Millennials: Marketing 4.0, customer satisfaction and purchase intention. J. Bus. Res. 2020, 122, 608–620. [Google Scholar] [CrossRef]
  46. Yeh, Y.S.; Li, Y. Building trust in m-commerce: Contributions from quality and satisfaction. Online Inf. Rev. 2009, 33, 1066–1086. [Google Scholar] [CrossRef] [Green Version]
  47. Jiang, Y.; Lau, A.K. Roles of consumer trust and risks on continuance intention in the sharing economy: An empirical investigation. Electron. Commer. Res. Appl. 2021, 47, 101050. [Google Scholar] [CrossRef]
  48. Fernandes, T.; Calamote, A. Unfairness in consumer services: Outcomes of differential treatment of new and existing clients. J. Retail. Consum. Serv. 2016, 28, 36–44. [Google Scholar] [CrossRef] [Green Version]
  49. Babu, M.M.; Dey, B.L. Appraisal of the potential of the growth of e-retailer based on impact of perceived value on trust for online purchases. Strat. Chang. 2018, 27, 477–487. [Google Scholar] [CrossRef]
  50. Im, I.; Kim, Y.; Han, H.-J. The effects of perceived risk and technology type on users’ acceptance of technologies. Inf. Manag. 2008, 45, 1–9. [Google Scholar] [CrossRef]
  51. Hsiao, K.-L.; Chen, C.-C. What drives smartwatch purchase intention? Perspectives from hardware, software, design, and value. Telemat. Inform. 2018, 35, 103–113. [Google Scholar] [CrossRef]
  52. Sok, P.; O'Cass, A. Achieving service quality through service innovation exploration—exploitation: The critical role of employee empowerment and slack resources. J. Serv. Mark. 2015, 29, 137–149. [Google Scholar] [CrossRef]
  53. Kim, S.; Lee, J.-S. Is satisfaction enough to ensure reciprocity with upscale restaurants? The role of gratitude relative to satisfaction. Int. J. Hosp. Manag. 2013, 33, 118–128. [Google Scholar] [CrossRef]
  54. Chen, S.C.; Chen, H.H. The empirical study of customer satisfaction and continued behavioural intention towards self-service banking: Technology readiness as an antecedent. Int. J. Electron. Financ. 2009, 3, 64. [Google Scholar] [CrossRef]
  55. Jackson, D.L. Revisiting Sample Size and Number of Parameter Estimates: Some Support for the N:q Hypothesis. Struct. Equ. Model. A Multidiscip. J. 2003, 10, 128–141. [Google Scholar] [CrossRef]
  56. Kline, R.B. Response to Leslie Hayduk’s Review of Principles and Practice of Structural Equation Modeling, 4th Edition. Can. Stud. Popul. 2018, 45, 188–195. [Google Scholar] [CrossRef]
  57. Anderson, J.C.; Gerbing, D.W. Structural equation modeling in practice: A review and recommended two-step approach. Psychol. Bull. 1988, 103, 411–423. [Google Scholar] [CrossRef]
  58. Hair, J.F.; Black, W.C.; Babin, B.J.; Anderson, R.E.; Tatham, R.L. Multivariate Data Analysis; Prentice Hall: Upper Saddle River, NJ, USA, 1998; Volume 5. [Google Scholar]
  59. Nunnally, J.; Jum, N.; Bernstein, I.H.; Bernstein, I. Psychometric Theory; McGraw-Hill Companies: New York, NY, USA, 1994. [Google Scholar]
  60. Fornell, C.; Larcker, D.F. Evaluating Structural Equation Models with Unobservable Variables and Measurement Error. J. Mark. Res. 1981, 18, 39–50. [Google Scholar] [CrossRef]
  61. Chin, W.W. Commentary: Issues and opinion on structural equation modeling. Commentary 1998, 22, 7–16. [Google Scholar]
  62. Hooper, D.; Coughlan, J.; Mullen, M.R. Structural equation modelling: Guidelines for determining model fit. Electron. J. Bus. Res. Methods 2008, 6, 53–60. [Google Scholar]
  63. Jackson, D.L.; Gillaspy, J.A., Jr.; Purc-Stephenson, R. Reporting practices in confirmatory factor analysis: An overview and some recommendations. Psychol. Methods 2009, 14, 6. [Google Scholar] [CrossRef]
  64. Whittaker, T.A. A Beginner's Guide to Structural Equation Modeling; Taylor & Francis: Oxford, UK, 2011. [Google Scholar]
  65. Hu, L.; Bentler, P.M. Cutoff criteria for fit indexes in covariance structure analysis: Conventional criteria versus new alternatives. Struct. Equ. Model. A Multidiscip. J. 1999, 6, 1–55. [Google Scholar] [CrossRef]
  66. Sen, B.; Goldfarb, S.; Tarver, W. Family structure and risk behaviors: The role of the family meal in assessing likelihood of adolescent risk behaviors. Psychol. Res. Behav. Manag. 2014, 7, 53–66. [Google Scholar] [CrossRef] [Green Version]
  67. Björnwall, A.; Sydner, Y.M.; Koochek, A.; Neuman, N. Eating Alone or Together among Community-Living Older People—A Scoping Review. Int. J. Environ. Res. Public Health 2021, 18, 3495. [Google Scholar] [CrossRef] [PubMed]
  68. Winter, J.; McNaughton, S.; Nowson, C. Older adults’ attitudes to food and nutrition: A qualitative study. J Aging Re 2016, 5, 114–119. [Google Scholar] [CrossRef]
  69. Ishikawa, M.; Takemi, Y.; Yokoyama, T.; Kusama, K.; Fukuda, Y.; Nakaya, T.; Nozue, M.; Yoshiike, N.; Yoshiba, K.; Hayashi, F.; et al. “Eating together” is associated with food behaviors and demographic factors of older Japanese people who live alone. J. Nutr. Health Aging 2016, 21, 662–672. [Google Scholar] [CrossRef]
  70. Rempe, H.M.; Sproesser, G.; Gingrich, A.; Spiegel, A.; Skurk, T.; Brandl, B.; Hauner, H.; Renner, B.; Volkert, D.; Sieber, C.C.; et al. Measuring eating motives in older adults with and without functional impairments with The Eating Motivation Survey (TEMS). Appetite 2019, 137, 1–20. [Google Scholar] [CrossRef]
  71. Host, A.; McMahon, A.-T.; Walton, K.; Charlton, K. Factors Influencing Food Choice for Independently Living Older People—A Systematic Literature Review. J. Nutr. Gerontol. Geriatr. 2016, 35, 67–94. [Google Scholar] [CrossRef]
  72. Deeming, C. Food and Nutrition Security at Risk in Later Life: Evidence from the United Kingdom Expenditure & Food Survey. J. Soc. Policy 2010, 40, 471–492. [Google Scholar] [CrossRef]
  73. Chung, W.T.; Gallo, W.T.; Giunta, N.; Canavan, M.E.; Parikh, N.S.; Fahs, M.C. Linking Neighborhood Characteristics to Food Insecurity in Older Adults: The Role of Perceived Safety, Social Cohesion, and Walkability. J. Hered. 2011, 89, 407–418. [Google Scholar] [CrossRef] [Green Version]
  74. Kim, C.-O. Food choice patterns among frail older adults: The associations between social network, food choice values, and diet quality. Appetite 2016, 96, 116–121. [Google Scholar] [CrossRef]
  75. Liu, Y.; Duan, Y.; Xu, L. Volunteer service and positive attitudes toward aging among Chinese older adults: The mediating role of health. Soc. Sci. Med. 2020, 265, 113535. [Google Scholar] [CrossRef]
  76. Stroebele-Benschop, N.; Depa, J.; De Castro, J.M. Environmental Strategies to Promote Food Intake in Older Adults: A Narrative Review. J. Nutr. Gerontol. Geriatr. 2016, 35, 95–112. [Google Scholar] [CrossRef] [PubMed]
  77. Sulmont-Rossé, C.; Symoneaux, R.; Feyen, V.; Maitre, I. Improving Food Sensory Quality With and For Elderly Consumers. Methods Consum. Res. 2018, 2, 355–372. [Google Scholar] [CrossRef] [Green Version]
  78. Thomas, N.; Emond, R. Living alone but eating together: Exploring lunch clubs as a dining out experience. Appetite 2017, 119, 34–40. [Google Scholar] [CrossRef] [PubMed]
Figure 1. Aging process of Taiwan [2].
Foods 10 02638 g001
Figure 2. Older adults eat in the senior meal hall. (The image was taken by the author).
Foods 10 02638 g002
Figure 3. A model for continuance intention in congregate meal halls.
Foods 10 02638 g003
Figure 4. Research structure pattern diagram.
Foods 10 02638 g004
Figure 5. Older adults engage as volunteers for food service. (The image was taken by the author).
Foods 10 02638 g005
Table 1. Definition of variable operability and reference scales.
Research VariableOperability DefinitionReference Scale
Pre-use trustTrust level before individuals participate in community senior meal halls[16,48,49]
Perceived riskExpected perceived risk probability of individuals who participate in community senior meal halls[50]
Perceived valuePerceived positive results probability of individuals participate in community senior meal halls[51]
Perceived service qualityPerceived service quality level of individuals who participate in community senior meal halls[52]
Perceived satisfactionRelative relationship between experience before and after individuals participate in community senior meal halls[19,48,53]
Post-use trustTrust level after individuals participate in community senior meal halls[16,48,49]
Continuance intentionPerceived probability of continuance of use in the future from a subjective perspective by individuals who participate in community senior meal halls[54]
Table 2. Reliability and items analysis of the dimension items.
DimensionQuestionCITCCronbach’s Alpha Value after Deleting the ItemCronbach’s Alpha Value
Pre-use trustPT10.8010.8670.900
PT20.7310.883
PT30.7350.882
PT40.7200.885
PT50.7720.874
perceived riskPR10.8500.9200.937
PR20.8480.920
PR30.8200.925
PR40.7750.933
PR50.8710.916
Perceived valuePV10.7390.8710.893
PV20.6750.879
PV30.6920.877
PV40.6310.884
PV50.6530.881
PV60.6980.876
PV70.7470.870
Perceived service qualityPQ10.7900.8500.892
PQ20.7490.865
PQ30.7490.866
PQ40.7600.862
Perceived satisfactionPS10.7870.8770.904
PS20.7410.887
PS30.7340.888
PS40.7400.887
PS50.7950.875
Post-use trustPO10.7690.8930.911
PO20.7520.895
PO30.6870.904
PO40.7410.896
PO50.7510.895
PO60.8100.887
Continuance intentionCI10.7610.9150.925
CI20.7790.912
CI30.6970.923
CI40.7780.913
CI50.8360.905
CI60.8570.902
Note: CITC:corrected item-total correlation.
Table 3. Descriptive analysis and normal distribution test of dimension items.
NumberAverage ValueSDSkewnessKurtosis
Pre-use trust4165.101.13−1.392.31
Perceived risk4164.201.52−0.47−1.04
Perceived value4164.721.10−0.860.55
Perceived service quality4165.241.16−0.770.46
Perceived satisfaction4165.091.17−0.59−0.67
Post-use trust4164.901.16−0.61−0.27
Continuance intention4165.121.24−1.080.77
Note: SD: Standard Deviation
Table 4. Measurement model.
DimensionItemUnstd.S.E.Unstd./S.E.p-ValueStd.CRAVE
PTPT11.000---0.8670.9000.644
PT20.8390.04518.8340.0000.774
PT30.8260.04418.9260.0000.777
PT40.8260.04518.3970.0000.762
PT50.8920.04320.9090.0000.828
PRPR11.000---0.8900.9380.752
PR20.9200.03526.1800.0000.883
PR30.9020.03724.1960.0000.850
PR40.8220.03821.7100.0000.804
PR50.9610.03527.6870.0000.905
PVPV11.000---0.7930.8940.546
PV20.8880.05715.4620.0000.721
PV30.9200.05716.0390.0000.743
PV40.8990.06314.3400.0000.677
PV50.8700.05914.7260.0000.693
PV60.9210.05716.1050.0000.746
PV70.9810.05717.2950.0000.790
PQPQ11.000---0.8610.8920.674
PQ20.9140.04619.7650.0000.811
PQ30.8590.04519.2540.0000.797
PQ40.9310.04719.9040.0000.815
PSPS11.000---0.8340.9040.655
PS20.8960.04818.5570.0000.791
PS30.8900.04918.2630.0000.782
PS40.9090.04918.3630.0000.785
PS51.0000.04920.5590.0000.849
POPO11.000---0.8190.9110.632
PO20.9660.05218.5680.0000.796
PO30.8130.05116.0070.0000.713
PO40.9050.05018.2230.0000.785
PO50.9360.05218.1400.0000.783
PO60.9970.04820.9560.0000.867
CICI11.000---0.8050.9260.678
CI20.9580.04919.5400.0000.830
CI30.7850.04816.3250.0000.726
CI40.9310.04918.8430.0000.809
CI51.0090.04920.8000.0000.867
CI61.0660.04921.7020.0000.893
Note: Unstd.: Unstandardized factor loadings, S.E.: Standard Error, Std.: Standardized factor loadings, CR: Composite Reliability, AVE: Average Variance Extracted.
Table 5. Discriminant validity for the measurement model.
PTPRPVPQPSPOCI
PT0.802
PR−0.1510.867
PV0.452−0.2280.738
PQ0.315−0.2620.2200.820
PS0.303−0.1730.4310.2900.809
PO0.301−0.1600.3190.5000.2420.794
CI0.316−0.1760.2540.3980.1640.2870.823
Note: The items on the diagonal in bold represent the square roots of the Average Variance Extracted(AVE); off-diagonal elements are the correlation estimates.
Table 6. Evaluation results.
IndicatorsNormResultsJudgment
MLχ2The small the better1349.508
DFThe large the better655.000
χ2/DF1 < χ2/DF < 52.060Yes
RMSEA <0.080.051Yes
SRMR<0.080.036Yes
TLI (NNFI)>0.90.931Yes
CFI>0.90.936Yes
NFI>0.90.883No
GFI>0.80.858Yes
PGFI>0.50.759Yes
PNFI>0.50.823Yes
IFI>0.90.936Yes
Note: MLχ2: ML chi-square, DF: Degrees of Freedom, χ2/DF: normed Chi-square, RMSEA: Root Mean Square Error Approximation, SRMR: Standardized Root Mean Square Residual, TLI: Tucker-Lewis Index, CFI: Comparative Fit Index, NFI: Normative Fit Index, GFI: Goodness of Fit index, PGFI: Parsimony Goodness of Fit Index, PNFI: Parsimony Normed Fit Index, IFI: Incremental Fit Index.
Table 7. Regression coefficient.
HypothesisDVIVUnstdS.E.Unstd./S.E.p-ValueStd.Results
H1POPT0.2960.0515.8230.0000.308Yes
H2PRPT−0.2260.070−3.2510.001−0.171Yes
H3PVPT0.4690.0509.4510.0000.508Yes
H4PQPR−0.1650.037−4.4130.000−0.222Yes
H5PQPV0.0630.0640.9920.3210.060No
H6PQPT0.3060.0615.0520.0000.312Yes
H7PSPQ0.3600.0536.7380.0000.361Yes
H8POPS0.1750.0513.4260.0010.177Yes
H9CIPS0.1270.0552.3060.0210.121Yes
H10CIPO0.3070.0575.3690.0000.289Yes
Note: DV: Dependent Variable, IV: Independent Variable
Publisher’s Note: MDPI stays neutral with regard to jurisdictional claims in published maps and institutional affiliations.

