
Geographical and Varietal Traceability of Chinese Jujubes Based on Physical and Nutritional Characteristics


1
Institute of Quality Standard and Testing Technology, BAAFS, No. 9 Middle Road of Shuguanghuayuan, Haidian District, Beijing 100097, China
2
Beijing Center of AGRI-Products Quality and Safety, No. 6 Middle Road of Yumin, Xicheng District, Beijing 100029, China
*
Authors to whom correspondence should be addressed.
Foods 2021, 10(10), 2270; https://doi.org/10.3390/foods10102270
Submission received: 25 August 2021
/
Revised: 14 September 2021
/
Accepted: 20 September 2021
/
Published: 25 September 2021
(This article belongs to the Section Food Quality and Safety)
Abstract
:Chinese jujube fruits are known for their high nutritional and functional values. To protect advantageous regional jujube fruits, it is important to monitor quality indicators and trace the origin and variety. In this study, 31 quality indicators of Chinese jujubes collected from 6 main producing areas were determined. According to different origins and varieties, Chinese jujube fruits were divided into five and six categories, respectively. To simplify the parameters, eight of the main characteristics, namely, soluble sugar content, fresh mass, edible rate, Na, Mg, K, Zn, and cyclic adenosine monophosphate (cAMP), were screened based on multiple comparison, correlation analysis, and principal component analysis (PCA). According to the eight main parameters, it was found that that both the categorical and cross-validated classification accuracy of linear discriminant analysis (LDA) were 100%. The discrimination accuracy of the testing set samples based on the orthogonal partial least squares-discriminant analysis (OPLS-DA) model were 90 and 93% for geographical and varietal classification, respectively. This indicated that the eight main parameters could be used as the characteristic parameters for the origin and variety traceability of Chinese jujubes.
1. Introduction
Jujube (Ziziphusjujuba Mill.) has a long history of cultivation, and it is widely distributed across Asian countries, including China, and in southeastern Europe, particularly in Spain, Italy, and Malta [1]. Jujube is famous for its high nutritional and functional value, because it is rich in soluble sugar, trace elements, phenolics, organic acids, triterpene acids, and cyclic adenosine monophosphate (cAMP) [2,3]. Therein, phenolics and triterpene acids have been discovered to have many health benefits including antioxidant activity and anticarcinogenic properties [4]. cAMP is a derivative of nucleotide, which has the function of being a secondary messenger and participates in the regulation of a wide range of physiological and biochemical processes [5].
Therefore, a number of national, provincial, ministerial and regional level programs applied to jujube fruits [1,6]. China has the highest output of red jujubes in the world—6.873 milliontons [4]. More than 90% of fresh jujubes in China’s total output are dried to prevent microbial reproduction and prolong the storage time [7]. In China, jujube is widely consumed as food and is used in traditional Chinese medicine. It has antitumor properties, improves the cardiovascular and cerebrovascular systems, and enhances human immunity and hematopoietic function [8]. The physical and chemical properties of jujubes are affected by their origin, because the edaphoclimatic conditions vary between regions [9].
In recent years, food quality and security issues, such as the variety of raw materials, batch mixing, and resource transformation, have occurred frequently, which are related to the livelihood of people, social stability, and healthy development of the national economy [10]. To avoid food quality and safety problems, countries all over the world require strict tracing and monitoring of the whole food production process ‘from farm to table’. Because it is cost-effective, time saving and universal, multiple mineral element analysis is one of the techniques mainly applied in traceability and adulteration studies. Gonzalez-Dominguez et al. [11] determined the content of sensory and health characteristics of strawberry, including sugars, organic acids, phenolic compounds, and essential and non-essential mineral elements, and the results showed a good identification result for cultivar and cultivation system differentiation. Zhang et al. [12] analyzed the nutrients and mineral elements of Tibet highland barley (Hordeum vulgare L.) and classified barley sources effectively by linear discriminant analysis. Sun et al. [13] identified the geographical origin of Chinese Angelica based on specific metal element fingerprinting. It demonstrated the feasibility of origin and variety traceability by nutritional characteristics. In order to improve the accuracy of such tracing, several simple physical parametersare combined with nutritional parameters in this study.
To protect advantageous regional Chinese jujubes, providing optimum benefits as functional foods, as well as tracing and verifying Chinese jujubes, the physical and nutritional characteristics of Chinese jujubes from different origins and varieties were studied. Based on principal component analysis (PCA), the main parameters for category differentiation were screened, which would objectively and comprehensively evaluate the internal quality of Chinese jujubes. Combined with the discriminant model, the origin and variety of Chinese jujubes were identified. This provided a theoretical basis for the main quality parameters’ determination of Chinese jujubes from different areas and varieties, which would be of great significance in the origin and variety traceability and production of Chinese jujubes.
2. Materials and Methods
2.1. Sampling Information
A total of 111 Chinese jujube samples were collected from five regions of China: Xinzheng (city of Henan), Cangzhou (city of Hebei), Taigu (county of Shanxi), Yanliang (district of Shaanxi), and Hotan (district of Xinjiang) (Figure 1). Six varieties were sampled, and each collection contained 12–21 samples (Table 1). Five replicates had been performed for each investigated sample. After the seed was removed, the resultant fruits were immediately homogenized. According to the differences in origin and variety, Chinese jujube samples were divided into five and six categories, respectively.
2.2. Quality Parameter Determination
2.2.1. Fresh Fruit Mass Determination
The average fresh mass of jujube fruit was determined according to Chinese standard GB/T5835-2009. Briefly, 1000 g of Chinese jujube fruit from each variety from different origins was randomly selected and measured with an electronic balance. The average fresh mass of the fruit was calculated by dividing the total weight of the fruit by the fruit number. Each measurement was made in triplicate.
2.2.2. Determination of Shape Ratio of Fruits
The shape ratio of jujube fruit refers to the ratio of polar diameter to equatorial diameter of the fruit [6]. By measuring the horizontal (equatorial diameter) and vertical distance (polar diameter) of the fruit (30 per category) using a digital caliper, the shape ratio was determined. Each measurement was conducted in triplicate.
2.2.3. Edible Fruit Rate Determination
The edible rate of the jujube fruit was determined according to Chinese standard GB/T5835-2009. In this study, 200–300 g of healthy jujube fruit was measured. The flesh and stone were separated, and the flesh was weighed. The edible rate of the fruit was calculated by the flesh weight divided by the total weight of the fruit. Each measurement was performed in triplicate.
2.2.4. Moisture Content Determination
According to GB 5009.3-2016, the moisture content of the Chinese jujubes was determined by drying 5 g samples in an air oven at a temperature of 105 °C until a constant weight was reached.
2.2.5. Soluble Sugar Determination
Soluble sugar content was determined according to the Chinese standard NY/T2742-2015 by 3,5-dinitrosalicylic acid colorimetry. Zinc acetate solution was prepared by dissolving 21.6 g zinc acetate in a little water, adding 3 mL glacial acetic acid, and fixing the volume to 100 mL with water. Potassium ferrocyanide solution was prepared by dissolving 10.6 g potassium ferrocyanide in 100 mL water. Fruit sample homogenate (10.00 g) was transferred to a 250 mL volumetric flask. Zinc acetate solution (3.0 mL) and potassium ferrocyanide solution (3.0 mL) were slowly added, and then water was added to the scale. After standing for 2 min, the sample was filtered through filter paper. Aliquots of 0, 0.2, 0.4, …, 1.2 mL of standard solutions containing 1 mg/mL glucose were transferred to seven separate 10 mL glass tubes and diluted to 2.0 mL with water. Each solution was then mixed with 4.0 mL 3,5-dinitrosalicylic acid reagent. The absorbance of each solution was then measured in a 1.0 cm quartz cuvette at 540 nm after being heated for 5 min at 100 °C. A standard glucose absorbance curve was then obtained from these measurements. A mixture of 5.0 mL of each jujube fruit sample solution and 1.0 mL hydrochloric acid solution (6.0 mol/L) was heated for 10 min at 80 °C. After being cooled to room temperature, 3 drops of the methyl red parameter were added and neutralized with 6 mol/L NaOH solution to a light pink color. It was diluted to a volume of 100 mL and then measured as described above for the standard glucose solutions.
2.2.6. Mineral Element Determination
Sodium, magnesium, potassium, manganese, iron, copper, and zinc were determined using inductively coupled plasma mass spectrometry after digestion in nitric acid according to Chinese standard GB5009.268-2016. Briefly, 0.2~0.5 g of solid sample (accurate to 0.001 g) was weighed or 1.00~3.00 mL of liquid sample was transferred into the microwave digestion inner tank. Firstly, we heated the sample containing ethanol or carbon dioxide at low temperature on the electric heating plate to remove ethanol or carbon dioxide, add 5~10 mL nitric acid, covered it and left it for 1 h or overnight, and tightened the tank cover. Digestion was carried out according to the standard operating steps of microwave digestion instrument (see Table S1 for digestion reference conditions). The digestion tank was taken out after cooling and put on the electric heating plate at 100 °C for 30 min or in an ultrasonic water bath for 2~5 min. Fixed the volume with water to 25~50 mL and mixed it well.
2.2.7. Ascorbic Acid Determination
The ascorbic acid content was measured by high-performance liquid chromatography (HPLC) using the reference of Chinese standard GB5009.86-2016. The homogenized sample (0.5 g) was transferred to a 50 mL volumetric flask with 20 g/L partial phosphoric acid solution. It was shaken well and transferred to a 50 mL centrifuge tube. After ultrasonic extraction for 5 min, it was centrifuged for 5 min at 4000 r/min, and the supernatant was passed through a 0.45 μm water phase filter membrane. Finally, the filtrate was used for ascorbic acid analysis.
2.2.8. Dietary Fiber Determination
The content of dietary fiber was analyzed according to Chinese standard GB5009.88-2014. After being desugared, 1.0 g samples were enzymatically digested with 50 mL α-amylase at a constant temperature of 95–100 °C for 35 min. According to the ratio of ethanol to sample solution volume of 4:1 in each sample enzymatic solution, 95% ethanol was added and precipitated at room temperature for 1 h. The residue was successively washed twice with 15 mL 78% ethanol, 15 mL 95% ethanol, and 15 mL acetone. After washing, the solution was removed by suction filtration, the residue was dried overnight at 105 °C, and total dietary fiber content was obtained.
2.2.9. cAMP Determination
cAMP was analyzed according to a published method [14] with a minor modification. The sample (1.0 g) was transferred to a 50 mL volumetric flask. After adding 40 mL ultrapure water, it was extracted ultrasonically at 80 °C for 1 h. An appropriate amount of supernatant was filtered through a 0.45 μm membrane filter and injected into an HPLC with a 20 μL injection volume. An Agilent 1260 Infinity HPLC system equipped with an Agilent TC C18 column (4.6 mm × 250 mm, 5 μm) was used to separate cAMP. The mobile phase consisted of 20: 80 (v/v) methanol: 20 mmol/L KH2PO4 with a flow rate of 1 mL/min. The column was maintained at 30 °C during the elution program.
2.3. Statistical Analyses
Statistical data were analyzed using SPSS 22.0 (SPSS Inc., Armonk, NY, USA). Duncan’s multiple comparison test was performed to determine the significant differences between samples from different categories; a p < 0.05 value was considered to be significant. Correlation analysis (CA) was used to quantitatively analyze the relationship between the two variables. The raw data were converted to standardized data ranging between 0 and 1 before CA. Principal component analysis (PCA) was applied to reduce the dimension of the data and retain most of the information of the original data. The cumulative variance contribution rate usually reflected the ratio of the original information contained in the principal component (PC). After the data were rotated by the maximum variance method, the load value of each factor was closer to 0 or 1, which could better explain and summarize the factors under each PC.
PCA, partial least squares-discriminant analysis (PLS-DA), and orthogonal partial least squares-discriminant analysis (OPLS-DA) were conducted using SIMCA 14.1, (UMetrics AB, Umeå, Sweden) to cluster and distinguish samples in different categories. The goodness of fit in discriminant analysis was measured by the statistical parameter of R2 [15]. A total of 23 Chinese jujube samples were used as training sets and 13 samples as testing sets to verify the accuracy of the established OPLS-DA model. The predictive ability was expressed as the percentage of correctly classified samples relative to the total dataset. LDA was used to evaluate whether samples from different categories could be classified by certain parameters.
3. Results
3.1. Differences in Chinese Jujube Samples from Different Categories
As shown in Table 1 and Table S2 (contents of 15 individual amino acids are shown in Table S2), there were significant differences among the qualities of Chinese jujubes of 7 categories (p < 0.05). As seen in Figure S1, the ascorbic acid content in Huizao from Henan were the highest (p < 0.05). In Jinsixiaozao from Hebei, fresh mass and cAMP were higher than those in other categories (p < 0.05). The edible rate and moisture content in Hupingzao from Shanxi were significantly higher than those in other categories (p < 0.05). Compared with the other categories, the tyrosine and arginine content in Tanzao samples from Shaanxi were higher (p < 0.05). Except for the above 7 parameters, the remaining 24 parameters were highest in samples from Xinjiang (p < 0.05). This indicates that the nutritional and functional characteristics of Chinese jujubes were affected by their origin.
The characteristics of 31 Chinese jujube quality parameters are shown in Table S3. Among all parameters, the coefficient of variation (CV) of Na was the largest, which was 134.93%, indicating a significant difference for Na among different categories. The CV values of ascorbic acid content followed, with a range of 19.00–357.00 mg/100 g. The edible rate of Chinese jujubes from different categories had the smallest CV (1.35%), indicating no significant difference for edible rate among different categories, and it could be excluded from further screening of the most important quality parameters.
3.2. CA of Quality Parameters
CA was conducted to quantify the relationship among different quality parameters of Chinese jujubes. According to Table 2 (individual amino acids were not provided), there were significant positive correlations between Fe and Cu (p < 0.05). Highly significant negative correlations were found between ascorbic acid and soluble sugar content, moisture content and soluble sugar content, and moisture content and cAMP (p < 0.01). Edible rate and dietary fiber, Mg and Cu, and K and Mn presented highly positive correlations (p < 0.01). In general, correlations exist to a certain extent between some parameters, indicating that several quality parameters overlapped. To improve the classification efficiency and accuracy, it was necessary to further categorize and simplify the relevant parameters.
3.3. PCA Analysis for Main Parameter Selection and Quality Evaluation
PCA was applied to decompose data into a few independent variables that could explain most of the original variance [16]. It has been widely adopted to simplify quality parameters and quality evaluations [16,17,18]. To evaluate the components accounting for most of the variability in raw data, the decomposition by PCA was graphically described in the form of a scree plot (Figure 2). It suggested that PCs with eigenvalues greater than 1 could be retained based on Kaiser’s rule [19]. In this study, the eigenvalues of the first five PCs were larger than 1, explaining 85.81% of the total variance. They accounted for 57.04, 11.95, 7.17, 5.62, and 4.03%, respectively, of the total variation in the data (Figure 1). The maximum variation of the dataset was represented by the first PC. To clarify the details of each PC represented, varimax rotation was performed to further analyze the quality parameter values. As a modification of coordinates used in PCA, varimax rotation maximized the sum of the variances of the squared loadings [20].
The maximum variance method is to find the rotational load that can maximize the variance of the square of the load in each column of the load matrix. After the data were rotated by the varimax method, the factor loadings were closer to 0 or 1, which could better explain and summarize the factors under each PC. The greater the factor loadings, the higher the contribution ratio under the PC. The results of PCA after rotation are shown in Table 3. K, Mg, soluble sugar content, and Na had a positive correlation with the first PC; however, the moisture content was negative. Because there were highly negative correlations between soluble sugar content and moisture content, moisture content had a lower loading value, excluding it from the main quality parameters. For PC2, phenylalanine, arginine, lysine, leucine, tyrosine, and histidine were the main influencing parameters. Therefore, no main quality parameter was selected from PC2. The main influencing parameters of PC3 were fresh mass, cAMP, and edible rate. Shape ratio and Zn were the main influencing parameters in the fourth and fifth PCs, respectively. However, the varimax rotated factor loadings of PC2 and PC4 were not high (<0.8); therefore, no main parameter was screened from them. As a result, soluble sugar content (X1), fresh mass (X3), edible rate (X5), Na (X7), Mg (X8), K (X9), Zn (X13), and cAMP (X15) were selected as the main parameters.
Dividing the PC loadings of each parameter by the square root of its corresponding eigenvalue, the weight coefficients of 31 quality parameters and the expressions of 5PCs were obtained [21]. By the standardized data and the weights of five characteristic quality factors, the synthesis scores and ranking of Chinese jujubes is presented in Table S4. The categories with a synthesis score from high to low were Xinjiang Junzao, Xinjiang Huizao, Shaanxi Tanzao, Shaanxi Xiangzao, Shanxi Hupingzao, Henan Huizao, and Hebei Jinsixiaozao. Xingjiang, Junzao, with the highest score, had the best comprehensive quality, followed by Xinjiang Huizao.
3.4. Chemometric Analysis
Other than reducing the dimensionality of numerical datasets in a multivariate problem, PCA can also classify samples into different groups as a classical unsupervised algorithm of pattern recognition [16]. PLS-DA and OPLS-DA were prevalently applied to discriminate two or more groups; multi-classification enabled the simultaneous modeling of multiple classes [22].
To discriminate regionally different Chinese jujube samples, PCA, PLS-DA, and OPLS-DA analyses were conducted on the basis of the eight main quality parameters in Chinese jujubes (Figure 3a–c). The OPLS-DA (R2 = 0.912) model clearly classified samples into five different categories. In contrast, PCA (R2 = 0.81) and PLS-DA (R2 = 0.9) models had poor classification and discrimination. Linear discriminant analysis of the eight variables in Chinese jujubes showed that the correct classification rate of the original dataset and the accuracy of leave-one-out cross-validation was 100%. To test the accuracy of the model, 70% of the data was used as training set and 30% of the data was used as testing set. The testing set samples were divided into different categories by the OPLS-DA model (Figure 3d). Each column of the confusion matrix represents the prediction category, and each row represents the true category (Table 4(a)). The discrimination accuracy of samples in five categories was 100% in the training set and 71.43–100% in the testing set.
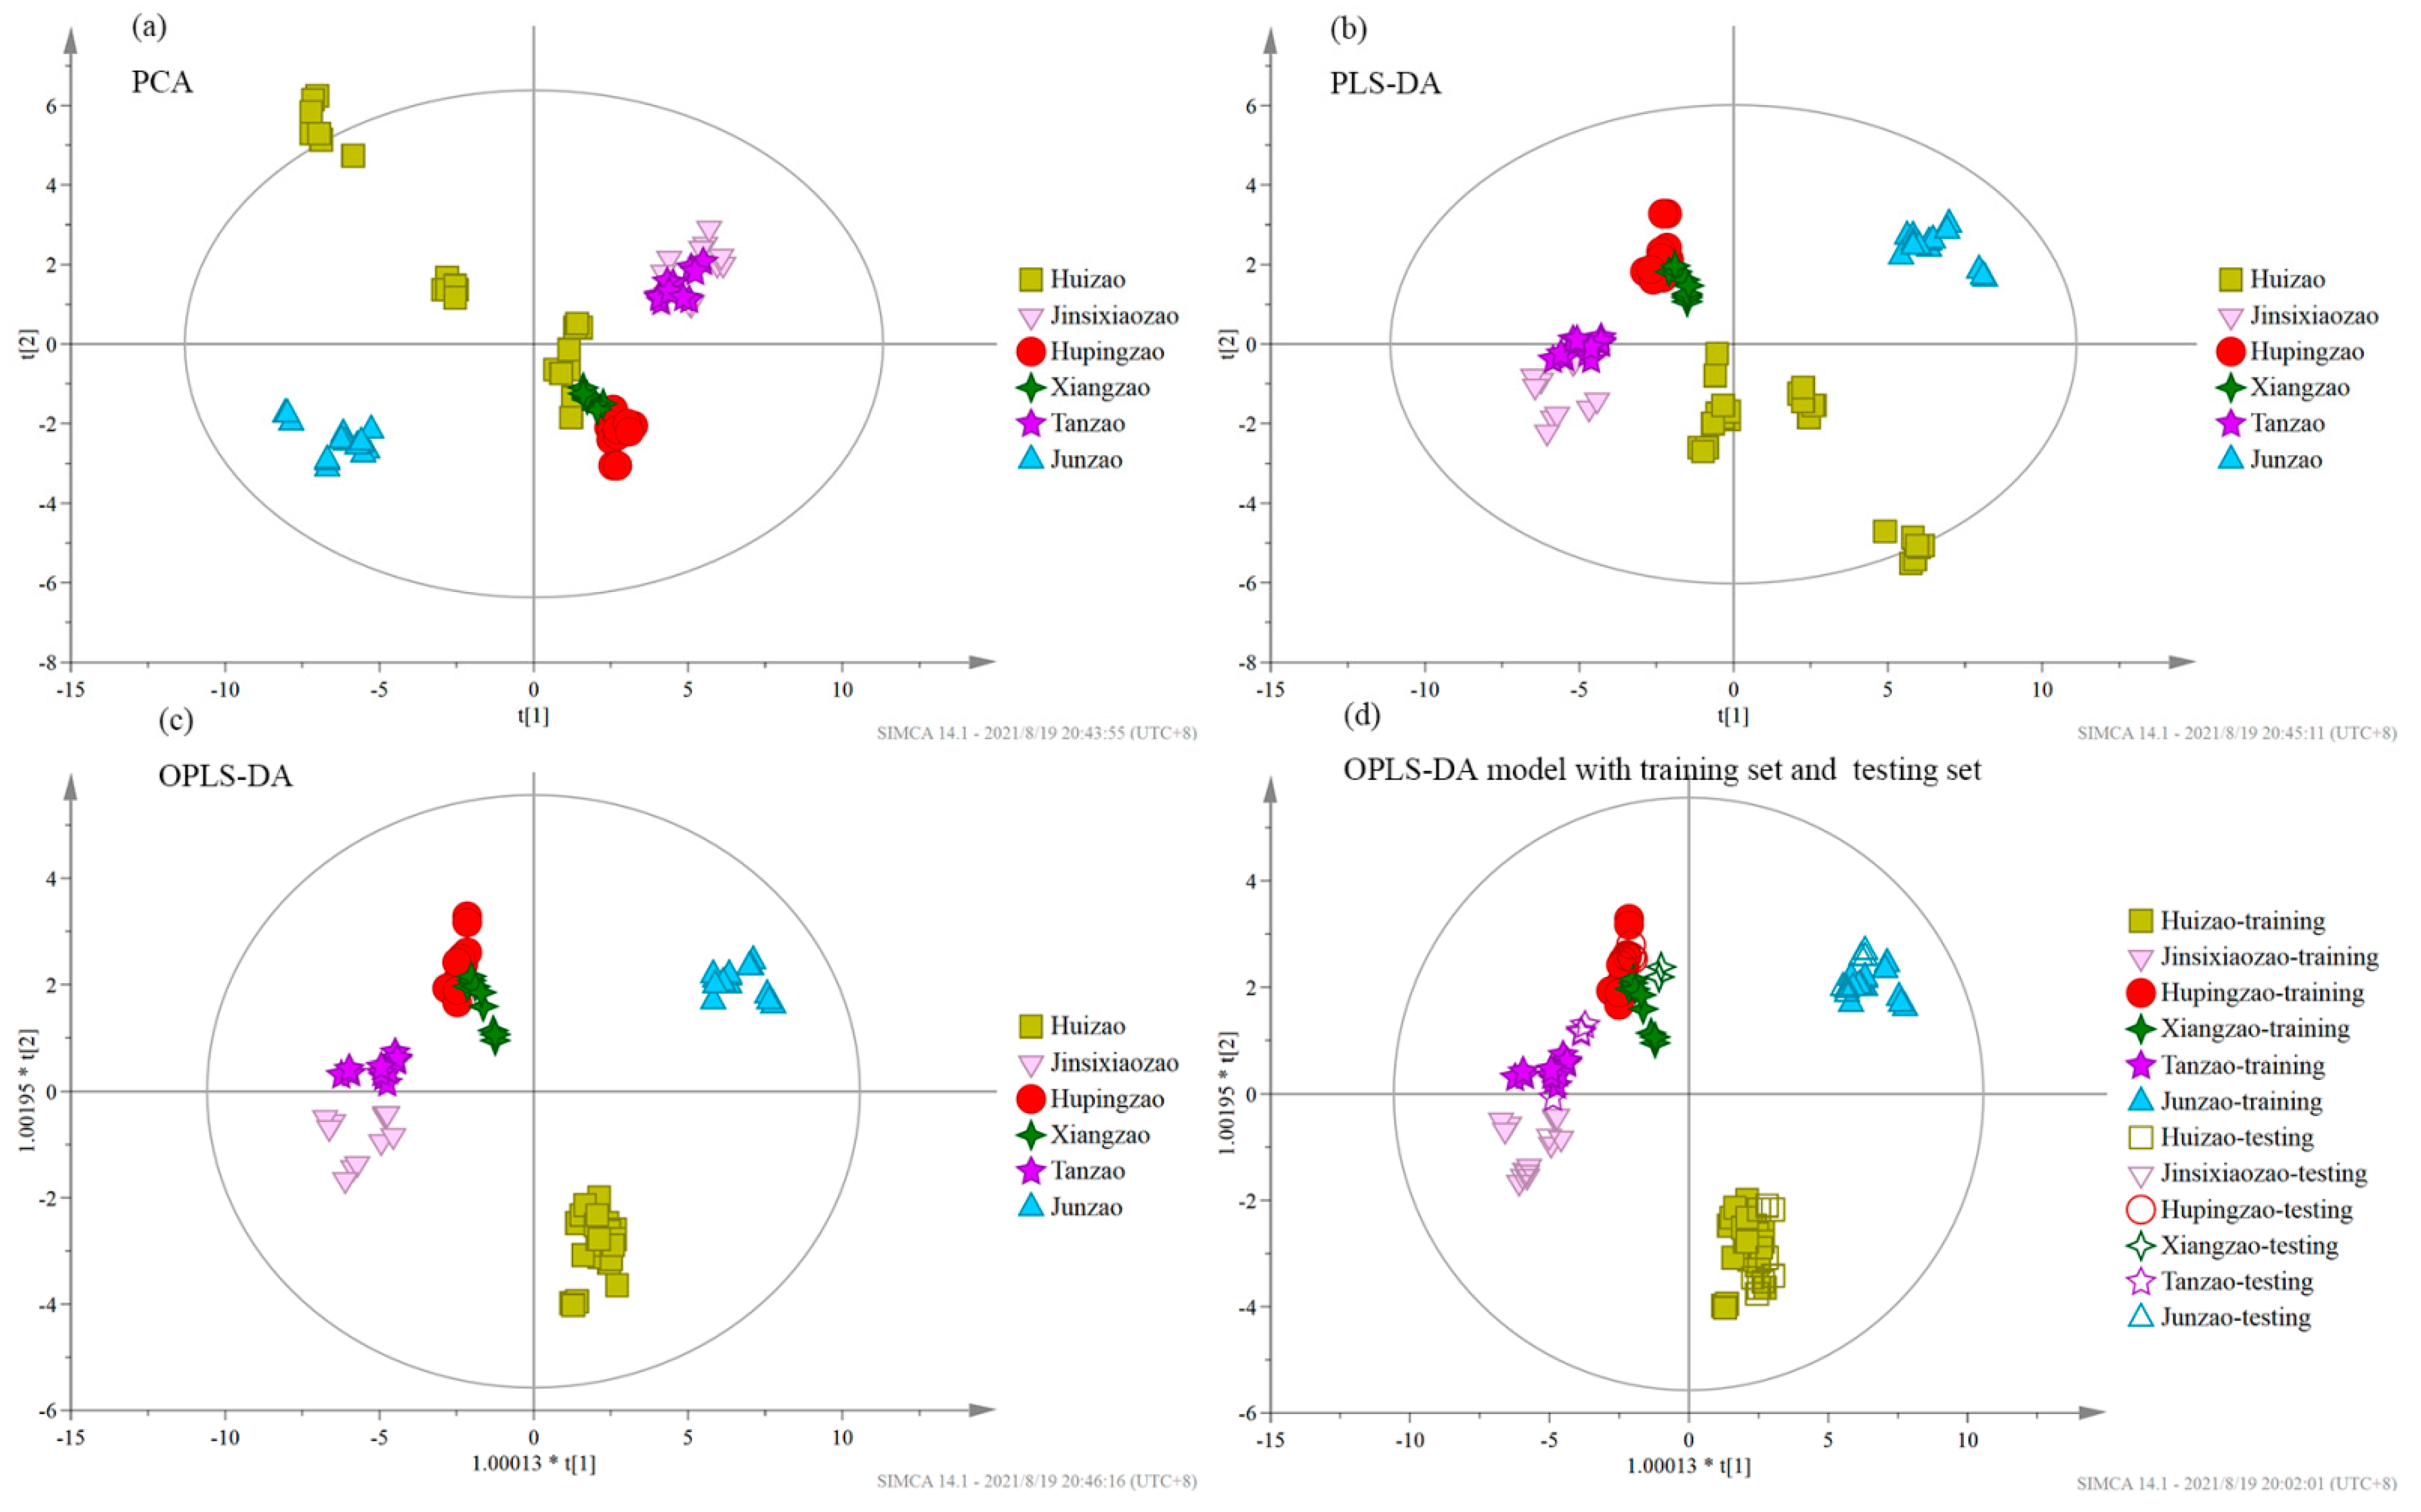
For varietally different Chinese jujube samples discrimination, the OPLS-DA (R2 = 0.924) model clearly classified samples into six different categories. In contrast, PCA (R2 = 0.905) and PLS-DA (R2 = 0.916) models had poor classification and discrimination (Figure 4a–c). Linear discriminant analysis of the eight variables in Chinese jujubes showed that the correct classification rate of the original dataset and the accuracy of cross-validation was 100%. To test the accuracy of the model, the testing set samples were divided into different categories by the OPLS-DA model (Figure 4d). The discrimination accuracy of the samples in six categories was 100% in the training set and 75–100% in the testing set (Table 4(b)).
4. Discussion
Chinese jujubes have a high nutritional value, and they are especially rich in ascorbic acid and cAMP. For ascorbic acid, the content is similar to that of kiwifruit [23] and 30 times more than that in cherry [24]. The lower concentrations of ascorbic acid in the Xinjiang region may be because it was lost during the special drying process with fruit air drying on the tree. As the second messenger in the organism’s cells, the level of cAMP in mature jujube was 30–160 μg/g, the highest amount which was observed in more than 180 natural plants [25]. In this study, cAMP levels in Xinjiang Junzao reached up to 213.29 mg/kg. Chinese jujube is an important source of K, Zn, Mg, Na, and Fe [26]. The high K and low Na contents in Chinese jujubes are good for people with hypertension problems [27,28]. Chinese jujubes can be used as a supplement for Fe deficiency without any side effects, such as nausea, headaches, and anorexia, which may occur with iron tablet supplements [29].
The nutritional value of Chinese jujubes differs with origin and variety. Generally, Xinjiang Junzao and Huizao had the best comprehensive quality, which may be related to the geographical environment. Although genotype is the main factor determining fruit physical and chemical properties, geographical environment and management techniques affect fruit nutrient biosynthesis and metabolism [30]. Being located in the northwest of China, Xinjiang possesses a high day-to-night temperature difference, long sunshine duration, high sunshine intensity, and a low rainfall amount. It benefits the accumulation of nutrients in jujube fruits, resulting in high quality jujube fruits in the Xinjiang region [6].
There were correlations to a certain extent among quality parameters. The positive correlation between edible rate and dietary fiber that was observed in this study had also been reported by Bi et al. [20]. Gao et al. [31] also found that moisture content and soluble sugar content had significant negative correlations. Highly significant negative correlations between moisture content and cAMP were consistent with Chen et al. [6]. However, there was a lack of literature on other significant correlations. More studies should be conducted to validate the correlation between different indices and explore the mechanisms behind these correlations.
Different methods were effectively used in the traceability of the origin and variety of Chinese jujubes. PCA and LDA were conducted to classify and differentiate 21 jujube cultivars using 24 fatty acids. Most groups were clearly separated [32]. The fatty acid methyl ester profiles of fruit peels and pulp of Ziziphus jujuba could be used to discriminate four Spanish cultivars with the LDA model [33]. By machine vision, a multilayer perceptron neural network could be used to classify jujube fruits into four qualitative grades with an accuracy of 98.61% [34]. Near-infrared spectroscopy was applied for the geographical origin classification of jujube fruit samples. PCA provided a useful qualitative technique for the discrimination of jujube fruits [35]. In this study, the origin and variety traceability of Chinese jujubes was realized from the perspective of physical and nutritional characteristics. Compared with PCA and PLS-DA, the OPLS-DA classification model discriminated Chinese jujube samples with the highest prediction performance. OPLS is a variant of PLS in which the PLS model is rotated, placing the Y -predictive part of the model in the first component [36]. OPLS-DA had a stronger interpretation ability because it could filter out the signals irrelevant to the model by integrating an orthogonal signal correction filter with PLS.
5. Conclusions
In this study, samples of six varieties of Chinese jujube from five regions of China were collected. A total of 31 quality parameters based on physical and nutritional characteristics were determined. Duncan’s multiple comparison, CA, and PCA were successfully applied for screening characteristic quality parameters to discriminate Chinese jujubes of different categories. Duncan’s multiple comparison showed that the quality of Chinese jujubes of different categories was significantly different (p < 0.05). CA indicated that positive or negative correlations existed to a certain extent between some quality parameters. Through PCA, eight main quality parameters were finally obtained from five PCs: soluble sugar content (X1), fresh mass (X3), edible rate (X5), Na (X7), Mg (X8), K (X9), Zn (X13), and cAMP (X15). Based on the eight screened characteristic parameters, a strong discrimination result based on the geographical and varietal origin of Chinese jujubes was exerted by multivariate statistical analysis (PCA, PLS-DA, OPLS-DA). The source and variety of blind samples could also be correctly determined by the established discrimination model. Based on the OPLS-DA model, the discrimination accuracy of the testing samples was 90% and 93% for geographical and varietal classification, respectively. The original and cross-validated correct rates of LDA were 100%. By selecting the eight characteristic parameters from 31 parameters, it simplified the origin and variety traceability process and improved the efficiency, which might be applied in the food industry for quality control.
Supplementary Materials
The following are available online at https://www.mdpi.com/article/10.3390/foods10102270/s1, Figure S1: Correlations among 31 quality indicators of Chinese jujubes; Table S1: Reference conditions of sample digester; Table S2: Contents of 15 individual amino acids in Chinese jujubes from different categories; Table S3: Characteristics of 31 quality indicators of Chinese jujubes; Table S4: The scores and ranking of Chinese jujubes of different categories.
Author Contributions
Data curation, writing—original draft preparation, L.W.; methodology, L.L.; formal analysis, G.Z.; software, N.J.; conceptualization, funding acquisition, X.O.; conceptualization, funding acquisition, writing—reviewing and editing, M.W. All authors have read and agreed to the published version of the manuscript.
Funding
This research was funded by the Project of National Agricultural Product Quality and Safety Risk Assessment, GJFP2020043.
Data Availability Statement
Not applicable.
Conflicts of Interest
The authors declare no conflict of interest.
References
- Liu, X.X.; Liu, H.M.; Yan, Y.Y.; Fan, L.Y.; Yang, J.N.; Wang, X.D.; Qin, G.Y. Structural characterization and antioxidant activity of polysaccharides extracted from jujube using subcritical water. LWT 2020, 117, 108645. [Google Scholar] [CrossRef]
- Sheng, J.P.; Shen, L. Chinese jujube (Ziziphus jujuba Mill.) and Indian jujube (Ziziphus mauritiana Lam.). In Postharvest Biology and Technology of Tropical and Subtropical Fruits; Yahia, E.M., Ed.; Woodhead Publishing: Sawston, UK, 2011; pp. 299–326e. [Google Scholar]
- Tang, Q.; Li, C.; Ge, Y.; Li, X.; Cheng, Y.; Hou, J.; Li, J. Exogenous application of melatonin maintains storage quality of jujubes by enhancing anti-oxidative ability and suppressing the activity of cell wall-degrading enzymes. LWT 2020, 127, 109431. [Google Scholar] [CrossRef]
- Lin, X.; Zhou, L.; Li, T.; Brennan, C.; Fu, X.; Liu, R.H. Phenolic content, antioxidant and antiproliferative activities of six varieties of white sesame seeds (Sesamum indicum L.). RSC Adv. 2017, 7, 5751–5758. [Google Scholar] [CrossRef] [Green Version]
- Pon, Y.L.; Auersperg, N.; Wong, A.S. Gonadotropins regulate N-cadherin-mediated human ovarian surface epithelial cell survival at both post-translational and transcriptional levels through a cyclic AMP/protein kinase A pathway. J. Biol. Chem. 2005, 280, 15438–15448. [Google Scholar] [CrossRef] [PubMed] [Green Version]
- Chen, K.; Fan, D.; Fu, B.; Zhou, J.; Li, H. Comparison of physical and chemical composition of three chinese jujube (Ziziphusjujuba Mill.) cultivars cultivated in four districts of Xinjiang region in China. Food Sci. Technol. 2019, 39, 912–921. [Google Scholar] [CrossRef] [Green Version]
- Song, J.; Chen, Q.; Bi, J.; Meng, X.; Wu, X.; Qiao, Y.; Lyu, Y. GC/MS coupled with MOS e-nose and flash GC e-nose for volatile characterization of Chinese jujubes as affected by different drying methods. Food Chem. 2020, 331, 127201. [Google Scholar] [CrossRef]
- Gao, Q.H.; Wu, P.T.; Liu, J.R.; Wu, C.S.; Parry, J.W.; Wang, M. Physico-chemical properties and antioxidant capacity of different jujube (Ziziphus jujuba Mill.) cultivars grown in loess plateau of China. Sci. Hortic. 2011, 130, 67–72. [Google Scholar] [CrossRef]
- Chen, T.; Zhao, Y.; Zhang, W.; Yang, S.; Ye, Z.; Zhang, G. Variation of the light stable isotopes in the superior and inferior grains of rice (Oryzasativa L.) with different geographical origins. Food Chem. 2016, 209, 95–98. [Google Scholar] [CrossRef] [PubMed]
- Qian, J.; Dai, B.; Wang, B.; Zha, Y.; Song, Q. Traceability in food processing: Problems, methods, and performance evaluations-a review. Crit. Rev. Food Sci. Nutr. 2020, 1–14. [Google Scholar] [CrossRef]
- Gonzalez-Dominguez, R.; Sayago, A.; Akhatou, I.; Fernandez-Recamales, A. Multi-chemical profiling of strawberry as a traceability tool to investigate the effect of cultivar and cultivation conditions. Foods 2020, 9, 96. [Google Scholar] [CrossRef] [Green Version]
- Zhang, T.; Wang, Q.; Li, J.; Zhao, S.; Qie, M.; Wu, X.; Bai, Y.; Zhao, Y. Study on the origin traceability of Tibet highland barley (Hordeum vulgare L.) based on its nutrients and mineral elements. Food Chem. 2021, 346, 128928. [Google Scholar] [CrossRef]
- Sun, L.; Ma, X.; Jin, H.Y.; Fan, C.J.; Li, X.D.; Zuo, T.T.; Ma, S.C.; Wang, S. Geographical origin differentiation of Chinese Angelica by specific metal element fingerprinting and risk assessment. Environ. Sci. Pollut. Res. Int. 2020, 27, 45018–45030. [Google Scholar] [CrossRef]
- Zhang, Y.Y.; Mao, X.H.; Zhang, J.Y. Effects of different extraction methods on cAMP from wild jujube. Food Sci. Technol. 2018, 43, 192–195. [Google Scholar]
- Varra, M.O.; Ghidini, S.; Zanardi, E.; Badiani, A.; Ianieri, A. Authentication of European sea bass according to production method and geographical origin by light stable isotope ratio and rare earth elements analyses combined with chemometrics. Ital. J. Food Saf. 2019, 8, 7872. [Google Scholar] [CrossRef] [PubMed]
- Tian, Y.; Gou, X.; Niu, P.; Sun, L.; Guo, Y. Multivariate data analysis of the physicochemical and phenolic properties of not from concentrate apple luices to explore the alternative cultivars in juice production. Food Anal. Methods 2018, 11, 1735–1747. [Google Scholar] [CrossRef]
- Chen, L.; Yu, F.; Sun, S.; Liu, X.; Sun, Z.; Cao, W.; Liu, S.; Li, Z.; Xue, C. Evaluation indicators of Ruditapes philippinarum nutritional quality. J. Food Sci.Technol. 2021, 58, 2943–2951. [Google Scholar] [CrossRef] [PubMed]
- Xue, Y.L.; Chen, J.N.; Han, H.T.; Liu, C.J.; Gao, Q.; Li, J.H.; Li, D.J.; Tanokura, M.; Liu, C.Q. Multivariate analyses of the physicochemical properties of turnip (Brassicarapa L.) chips dried using different methods. Dry. Technol. 2019, 38, 411–419. [Google Scholar] [CrossRef]
- Shin, E.C.; Pegg, R.B.; Phillips, R.D.; Eitenmiller, R.R. Interrelationships among tocopherols of commercial Runner market type peanuts grown in the United States. Int. J. Food Sci. Technol. 2010, 45, 2622–2628. [Google Scholar] [CrossRef]
- Bi, J.F.; Wang, X.; Chen, Q.Q.; Liu, X.; Wu, X.Y.; Wang, Q.; Lv, J.; Yang, A.J. Evaluation indicators of explosion puffing Fuji apple chips quality from different Chinese origins. LWT—Food Sci. Technol. 2015, 60, 1129–1135. [Google Scholar] [CrossRef]
- Liu, C.J.; Wang, H.O.; Xue, Y.L.; Zhang, Z.Y.; Niu, L.Y.; Li, D.J.; Jiang, N.; Cui, L.; Liu, C.Q. Screening quality evaluation factors of freezedried peach (Prunus persica L. Batsch) powders from different ripening time cultivars. J. Food Qual. 2017, 2017, 7213694. [Google Scholar] [CrossRef] [Green Version]
- He, X.; Yangming, H.; Gorska-Horczyczak, E.; Wierzbicka, A.; Jelen, H.H. Rapid analysis of Baijiu volatile compounds fingerprint for their aroma and regional origin authenticity assessment. Food Chem. 2021, 337, 128002. [Google Scholar] [CrossRef] [PubMed]
- Cheaitou, A.; van Delft, C.; Dallery, Y.; Jemai, Z. Two-period production planning and inventory control. Int. J. Prod. Econ. 2009, 118, 118–130. [Google Scholar] [CrossRef]
- Jia, C.; Shan, C.; Zhou, T.; Xiangyang, L.I.; Peng, W.U.; Sun, Y. Comparison of fruit nutritional traits of major cultivars of Chinese cherry (Prunus pseudocerasus Lindl.). Food Sci. 2019, 40, 244–250. [Google Scholar]
- Jiang, T.; He, F.; Han, S.; Chen, C.; Zhang, Y.; Che, H. Characterization of cAMP as an anti-allergic functional factor in Chinese jujube (Ziziphus jujuba Mill.). J. Funct. Foods 2019, 60, 103414. [Google Scholar] [CrossRef]
- Ibrahim, S.A.; Ayad, A.A.; Williams, L.L.; Ayivi, R.D.; Gyawali, R.; Krastanov, A.; Aljaloud, S.O. Date fruit: A review of the chemical and nutritional compounds, functional effects and food application in nutrition bars for athletes. Int. J. Food Sci. Technol. 2020, 56, 1503–1513. [Google Scholar] [CrossRef]
- Chang, S.K.; Alasalvar, C.; Shahidi, F. Review of dried fruits: Phytochemicals, antioxidant efficacies, and health benefits. J. Funct. Foods 2016, 21, 113–132. [Google Scholar] [CrossRef]
- Hassan, I.; Cotrozzi, L.; Haiba, N.S.; Basahi, J.; Hammam, E. Trace elements in the fruits of date palm (Phoenix dactylifera L.) in Jeddah City, Saudi Arabia. Agrochimica 2017, 61, 75–93. [Google Scholar]
- Hasnaoui, A.; Elhoumaizi, M.A.; Asehraou, A.; Sindic, M.; Hakkou, A. Chemical composition and microbial quality of dates grown in Figuig oasis of Marocco. Int. J. Agric. Biol. 2010, 12, 311–314. [Google Scholar] [CrossRef]
- Guo, S.; Duan, J.A.; Qian, D.; Tang, Y.; Wu, D.; Su, S.; Wang, H.; Zhao, Y. Content variations of triterpenic acid, nucleoside, nucleobase, and sugar in jujube (Ziziphu sjujuba) fruit during ripening. Food Chem. 2015, 167, 468–474. [Google Scholar] [CrossRef] [PubMed]
- Gao, Q.H.; Wu, C.S.; Yu, J.G.; Wang, M.; Ma, Y.J.; Li, C.L. Textural characteristic, antioxidant activity, sugar, organic acid, and phenolic profiles of 10 promising jujube (Ziziphusjujuba Mill.) selections. J. Food Sci. 2012, 77, C1218–C1225. [Google Scholar] [CrossRef] [PubMed]
- Zhang, R.; Sun, X.; Zhang, K.; Zhang, Y.; Song, Y.; Wang, F. Fatty acid composition of 21 cultivars of Chinese jujube fruits (Ziziphusjujuba Mill.). J. Food Meas. Charact. 2020, 15, 1225–1240. [Google Scholar] [CrossRef]
- Reche, J.; Almansa, M.S.; Hernandez, F.; Carbonell-Barrachina, A.A.; Legua, P.; Amoros, A. Fatty acid profile of peel and pulp of Spanish jujube (Ziziphusjujuba Mill.) fruit. Food Chem. 2019, 295, 247–253. [Google Scholar] [CrossRef]
- Rahimi, A.; Banakar, A.; Zareiforush, H.; Beygvand, M.; Montazeri, M. Classification of Jujube fruits using different data mining methods. Researcher 2014, 6, 52–61. [Google Scholar]
- Guo, Y.; Ni, Y.; Kokot, S. Evaluation of chemical components and properties of the jujube fruit using near infrared spectroscopy and chemometrics. Spectrochim. Acta A Mol. Biomol. Spectrosc. 2016, 153, 79–86. [Google Scholar] [CrossRef] [PubMed]
- Eriksson, L.; Trygg, J.; Wold, S. CV-ANOVA for significance testing of PLS and OPLS® models. J. Chemom. 2008, 22, 594–600. [Google Scholar] [CrossRef]
Figure 1.
Sampling sites of Chinese jujube samples.
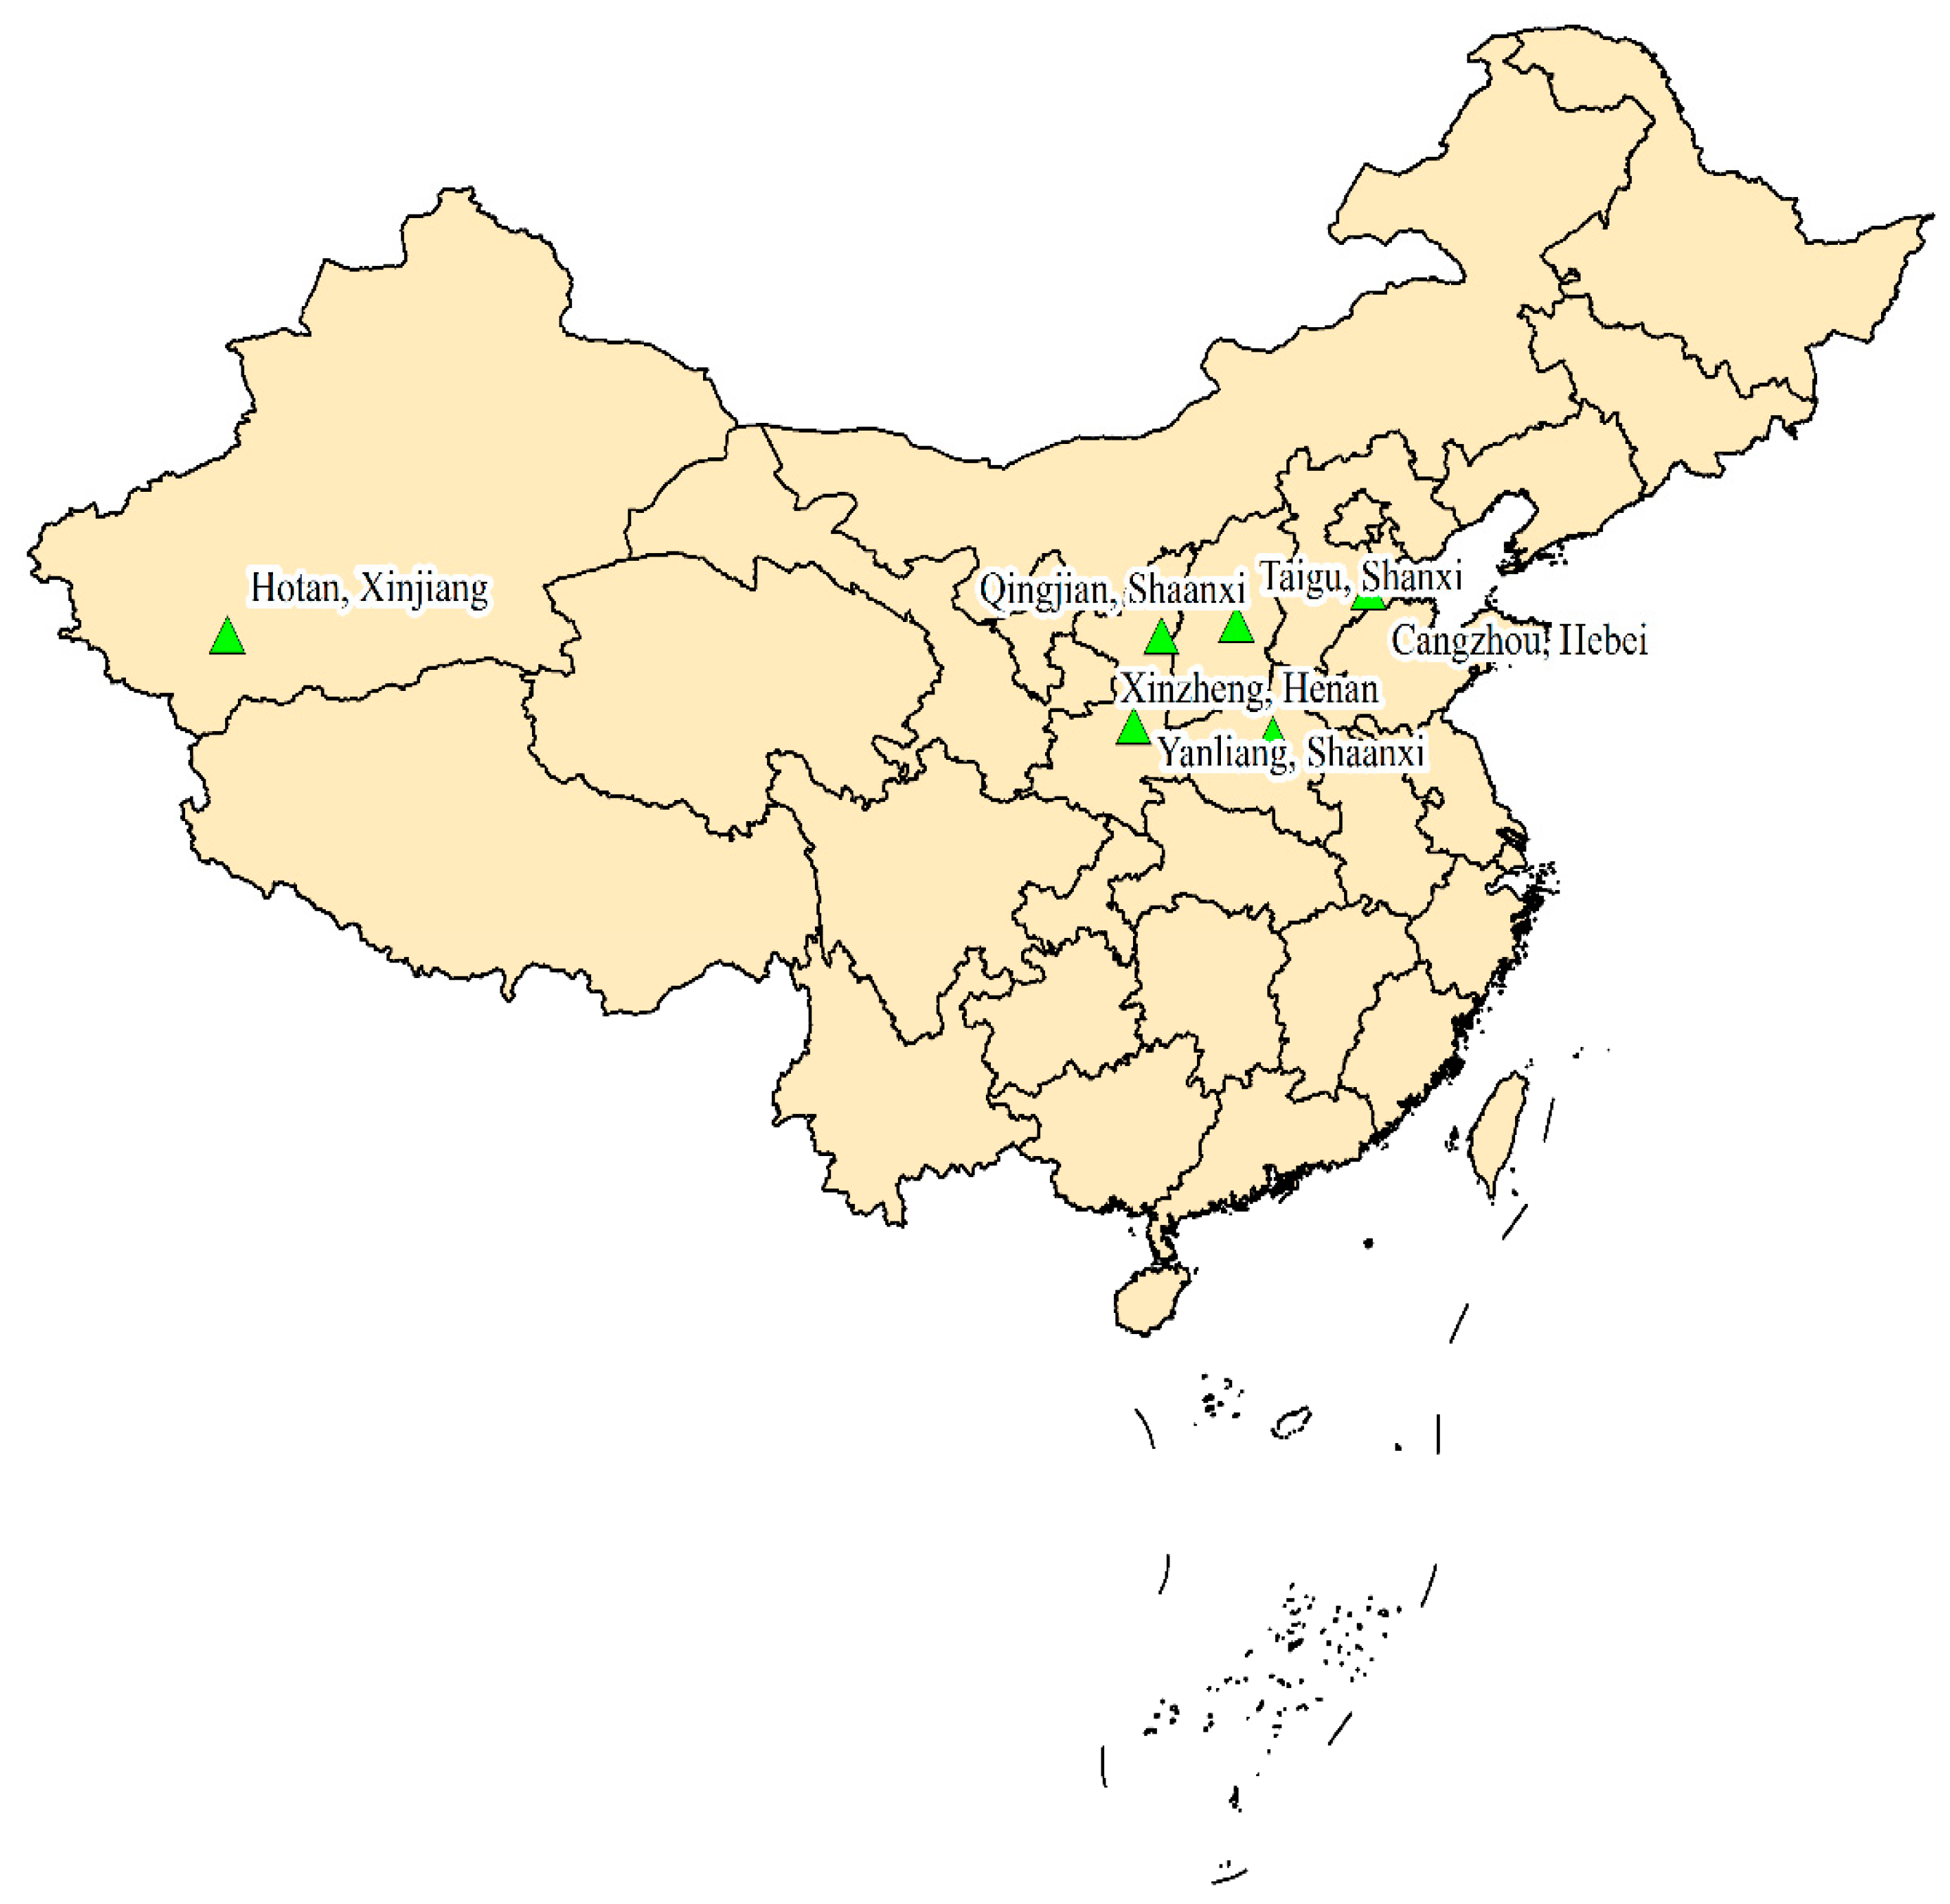
Figure 2.
Contributions of the total variance accounted for by the PCs.
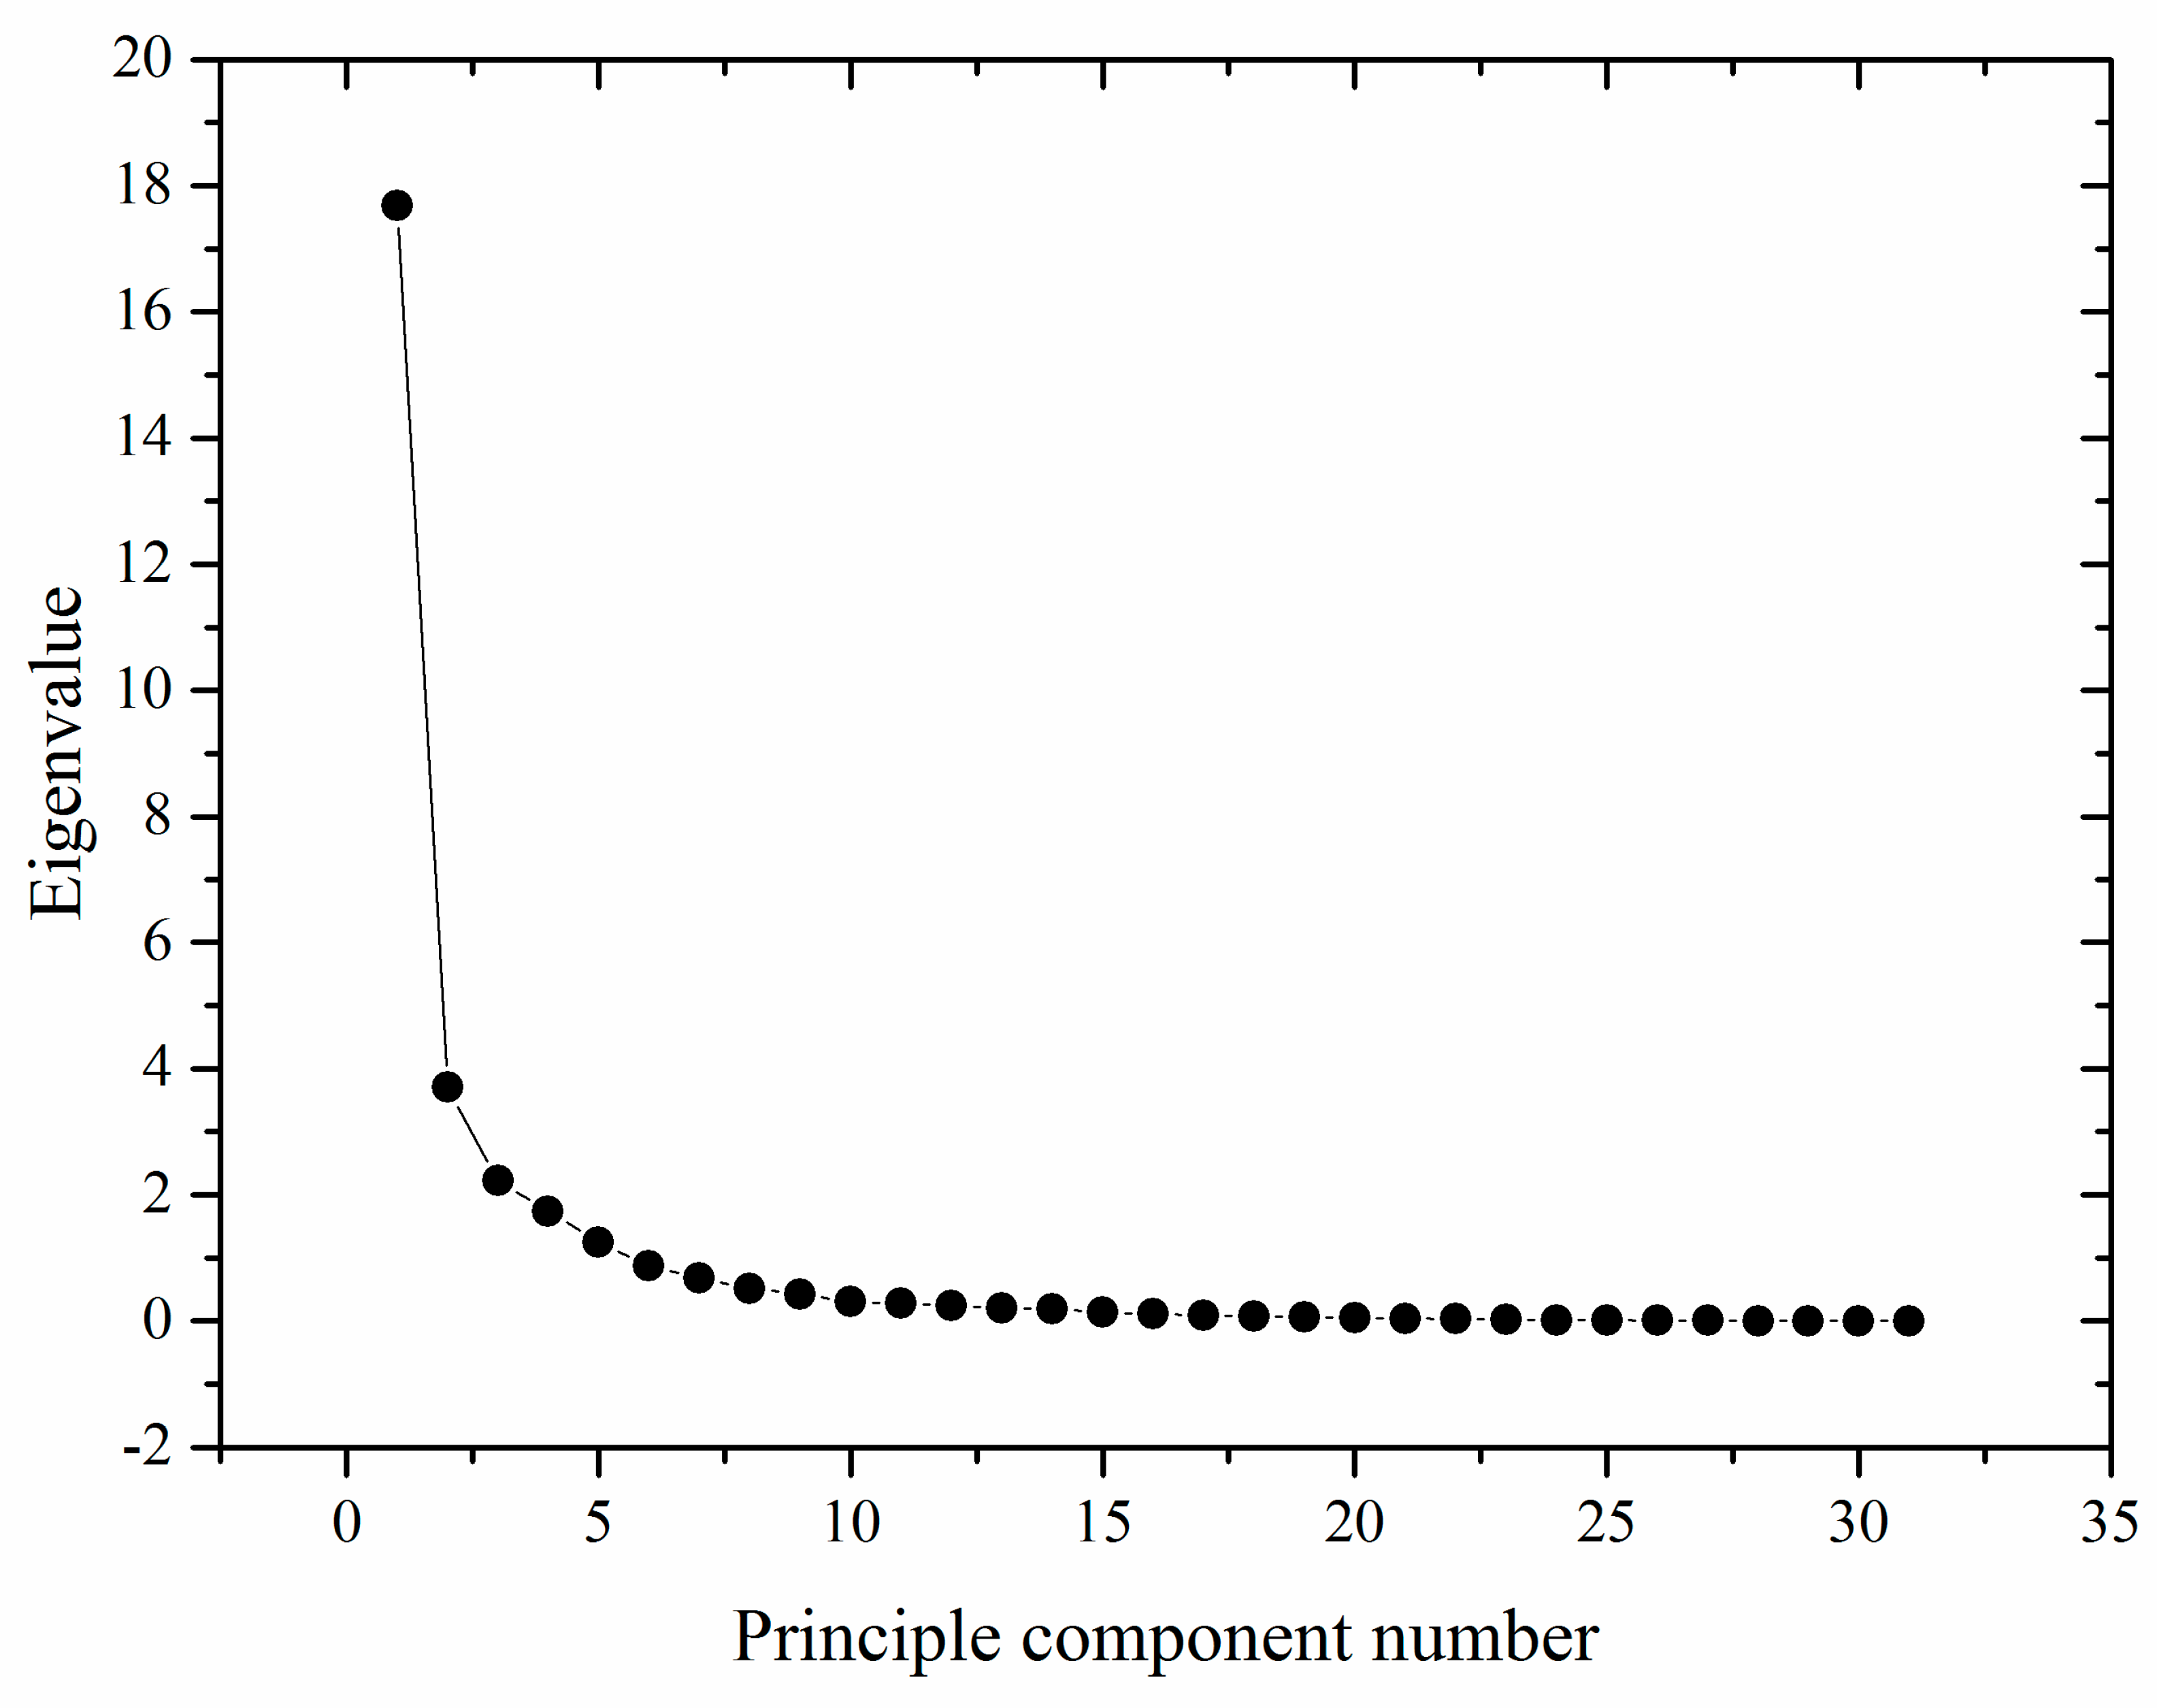
Figure 3.
Principal component analysis (PCA), partial least squares-discriminant analysis (PLS-DA), and orthogonal partial least squares-discriminant analysis (OPLS-DA) of Chinese jujube samples in five regions with the eight main quality parameters, and the OPLS-DA model of the five categories of Chinese jujubes samples with the training set and testing set: (a) PCA; (b) PLS-DA; (c) OPLS-DA; (d) OPLS-DA model with training set and testing set.
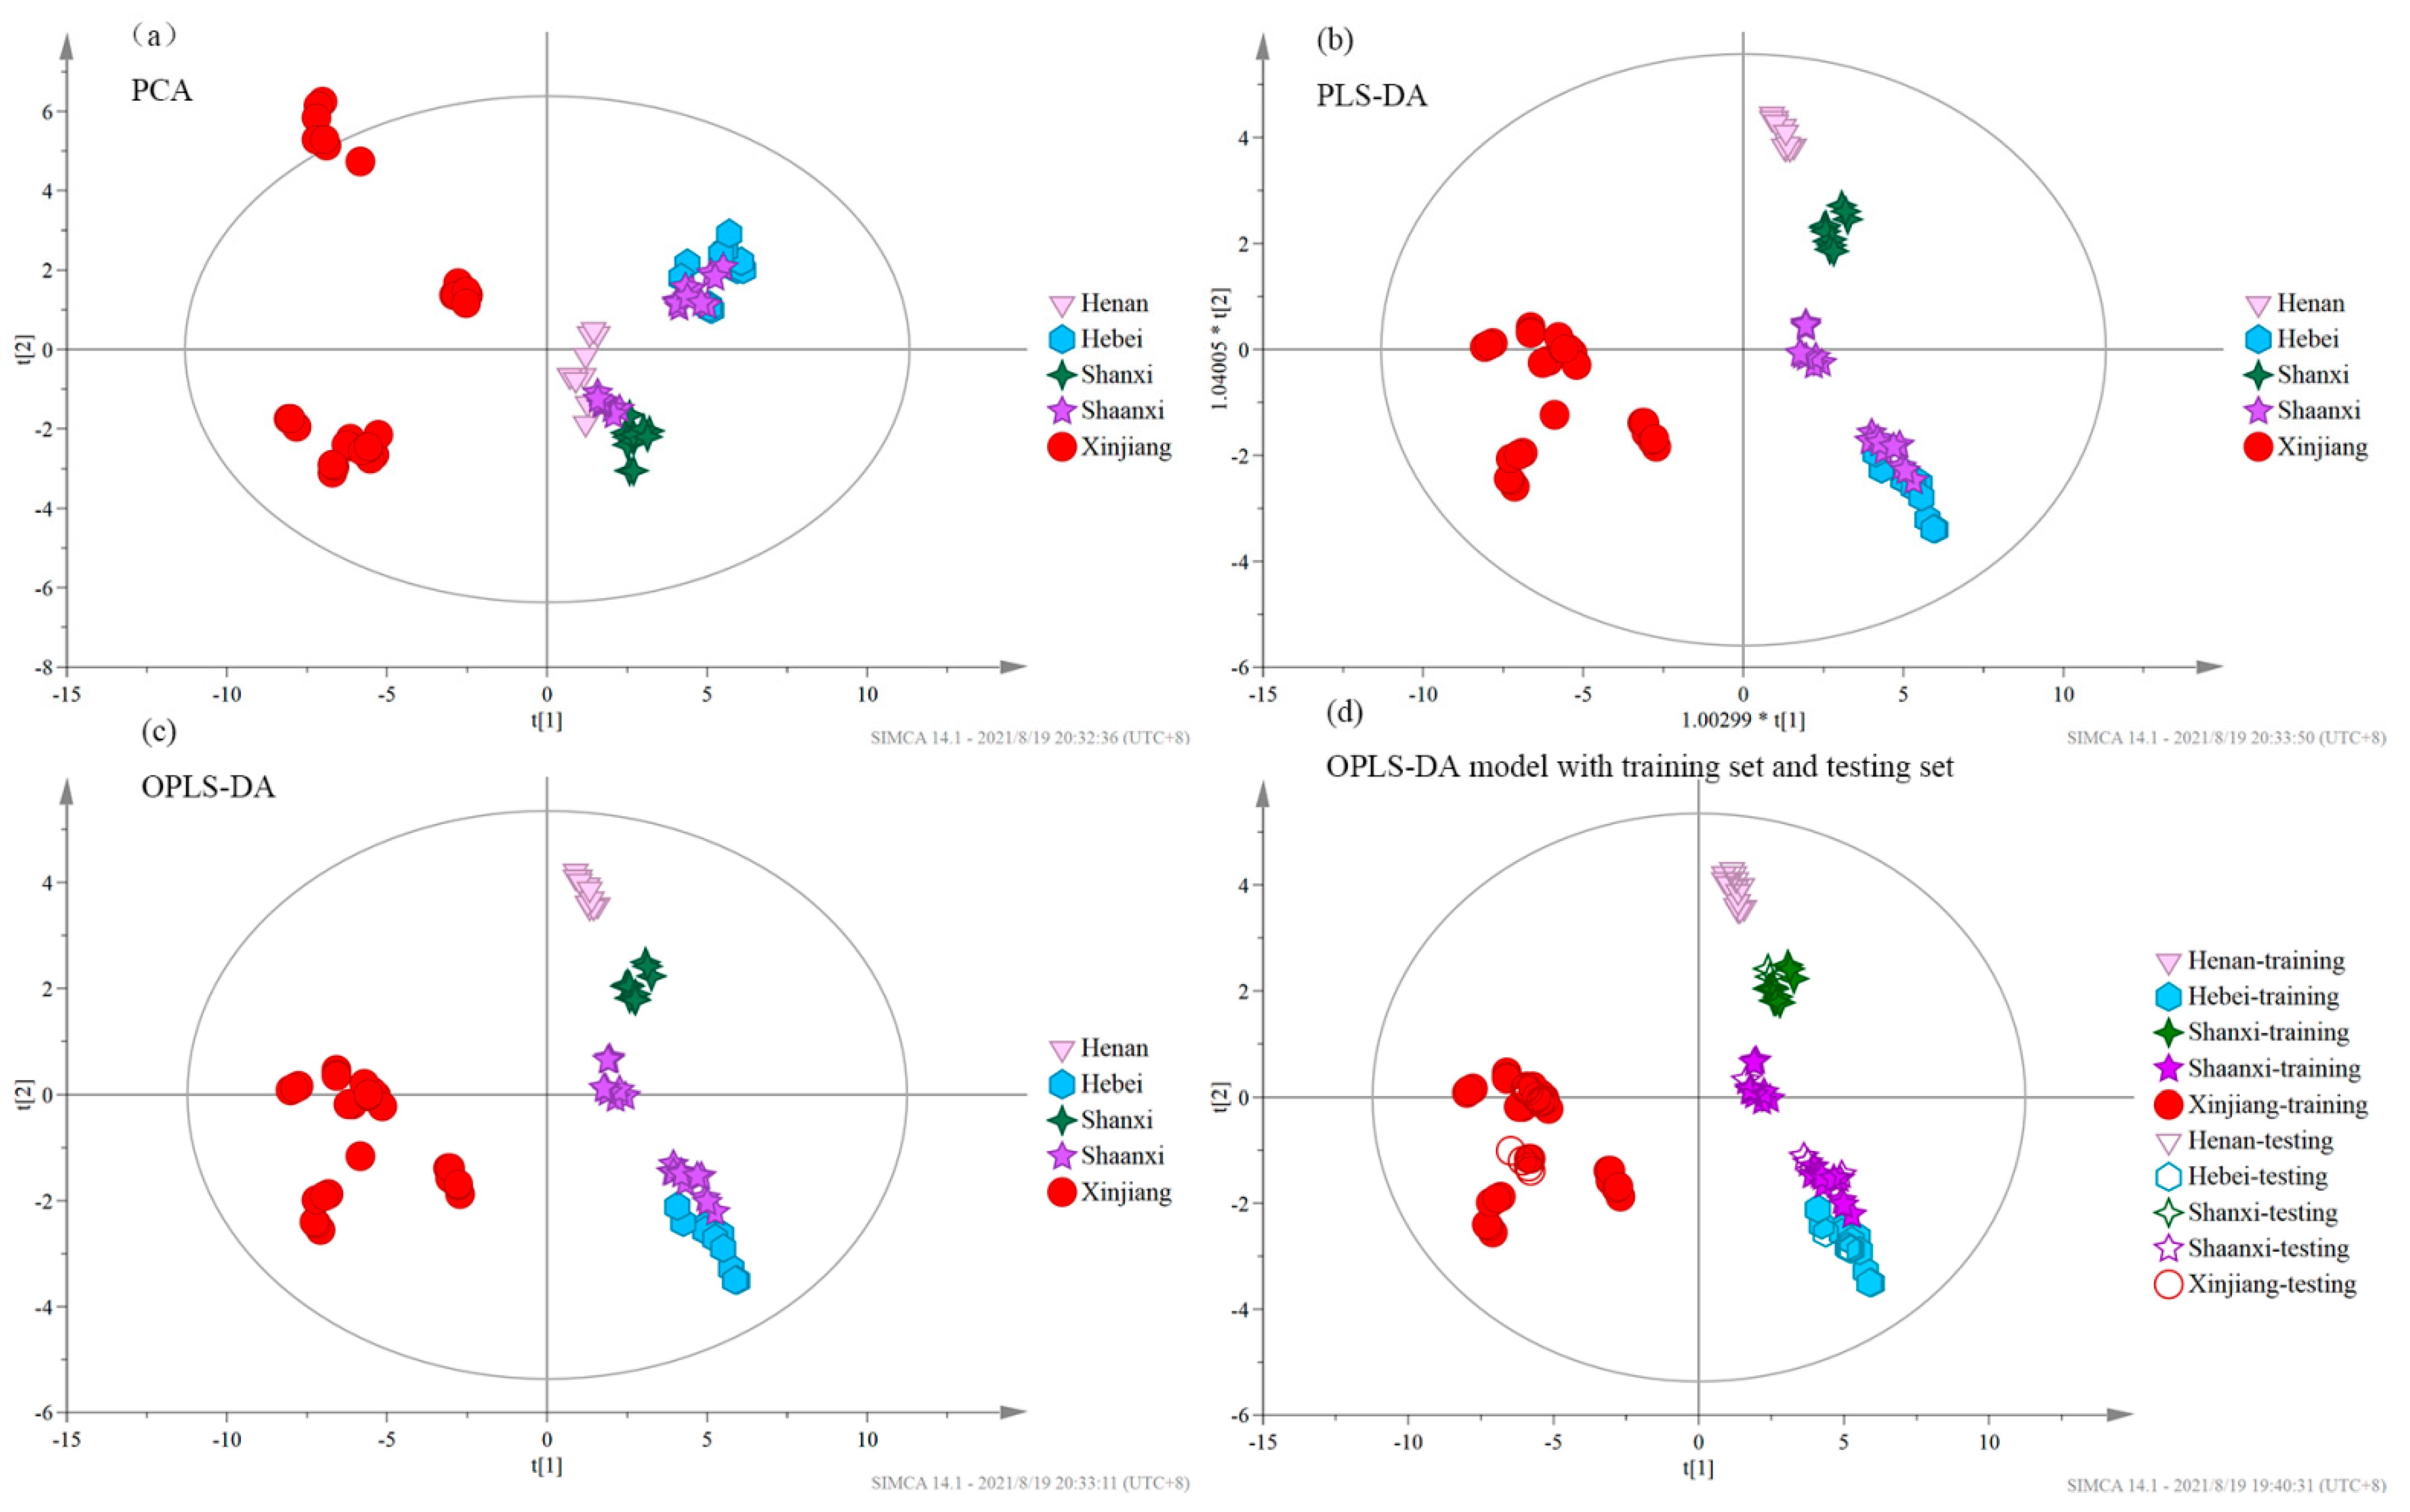
Figure 4.
Principal component analysis (PCA), partial least squares-discriminant analysis (PLS-DA), and orthogonal partial least squares-discriminant analysis (OPLS-DA) of Chinese jujube samples in six varieties with the eight main quality parameters, and the OPLS-DA model of the six categories of Chinese jujubes samples with the training set and testing set: (a) PCA; (b) PLS-DA; (c) OPLS-DA; (d) OPLS-DA model with training set and testing set.

Table 1.
Determination of 16 physical and nutritional parameters in Chinese jujubes from different categories.
Table 1.
Determination of 16 physical and nutritional parameters in Chinese jujubes from different categories.
| Quality Parameters | Henan Huizao | Hebei Jinsixiaozao | Shanxi Hupingzao | Shaanxi Xiangzao | Shaanxi Tanzao | Xinjiang Junzao | Xinjiang Huizao | |
|---|---|---|---|---|---|---|---|---|
| Sample number | 15 | 15 | 15 | 12 | 15 | 21 | 18 | |
| Physical parameters | Fresh mass (g) | 10.41 ± 0.72 d | 7.50 ± 0.80 d | 18.08 ± 2.41 b | 14.63 ± 0.73 c | 10.26 ± 1.42 d | 25.96 ± 3.66 a | 7.84 ± 3.00 d |
| Shape ratio | 1.45 ± 0.07 ab | 1.35 ± 0.02 bc | 1.28 ± 0.12 bc | 1.18 ± 0.02 c | 1.28 ± 0.32 bc | 1.57 ± 0.10 a | 1.40 ± 0.06 ab | |
| Edible rate (%) | 92.67 ± 0.22 c | 92.58 ± 0.70 c | 95.47 ± 0.30 a | 94.29 ± 0.21 b | 93.70 ± 1.13 b | 95.41 ± 0.99 a | 93.82 ± 0.49 b | |
| Soluble sugar (%) | 24.28 ± 1.16 c | 19.94 ± 1.88 d | 23.26 ± 1.08 c | 23.93 ± 1.00 c | 22.66 ± 2.58 c | 37.93 ± 0.72 b | 39.77 ± 0.61 a | |
| Moisture content (%) | 65.18 ± 2.71 a | 65.12 ± 0.80 a | 68.75 ± 2.45 a | 67.66 ± 0.72 a | 64.41 ± 0.72 a | 41.35 ± 0.45 b | 38.46 ± 6.59 b | |
| Nutritional parameters | Ascorbic acid (mg/100 g) | 331.80 ± 1.88 a | 330.40 ± 18.08 a | 168.20 ± 30.33 b | 113.00 ± 16.73 c | 186.40 ± 10.67 b | 70.50 ± 2.74 d | 34.17 ± 13.64 e |
| Na (mg/kg) | 3.78 ± 0.58 c | 56.04 ± 16.42 c | 27.00 ± 13.06 c | 24.38 ± 3.76 c | 9.12 ± 2.06 c | 149.95 ± 21.11 b | 357.05 ± 127.88 a | |
| Mg (mg/kg) | 243.80 ± 12.52 c | 208.60 ± 25.39 cd | 147.80 ± 10.57 f | 182.25 ± 11.15 de | 168.40 ± 5.77 de | 305.00 ± 35.89 b | 400.33 ± 75.58 a | |
| K (mg/kg) | 3652.20 ± 366.73 c | 2908.40 ± 220.97 c | 3024.40 ± 278.62 c | 3229.00 ± 298.67 c | 2066.40 ± 280.09 d | 6307.17 ± 637.33 b | 7183.67 ± 1156.97 a | |
| Mn (mg/kg) | 2.34 ± 0.19 ab | 1.70 ± 0.30 c | 2.08 ± 0.38 bc | 1.65 ± 0.10 c | 2.24 ± 0.50 ab | 2.67 ± 0.36 a | 2.67 ± 0.36 a | |
| Fe (mg/kg) | 5.10 ± 0.38 c | 4.50 ± 0.49 c | 4.22 ± 0.63 c | 3.60 ± 0.59 c | 7.64 ± 6.37 bc | 10.97 ± 1.68 ab | 14.57 ± 3.65 a | |
| Cu (mg/kg) | 1.39 ± 0.23 b | 1.23 ± 0.23 bc | 1.27 ± 0.12 bc | 1.25 ± 0.13 bc | 1.06 ± 0.21 bc | 0.88 ± 0.22 c | 1.81 ± 0.54 a | |
| Zn (mg/kg) | 2.46 ± 0.59 cd | 3.48 ± 0.47 a | 3.18 ± 0.64 ab | 1.98 ± 0.22 d | 3.34 ± 0.54 ab | 2.67 ± 0.72 bc | 3.30 ± 0.45 ab | |
| dietary fiber (%) | 4.54 ± 0.03 f | 6.23 ± 0.04 c | 6.07 ± 0.03 d | 5.94 ± 0.04 e | 6.10 ± 0.03 d | 6.64 ± 0.04 b | 6.76 ± 0.15 a | |
| cAMP (mg/kg) | 45.15 ± 20.05 c | 41.92 ± 11.29 c | 93.01 ± 13.95 b | 57.06 ± 21.07 c | 41.96 ± 4.59 c | 213.29 ± 34.14 a | 90.86 ± 12.99 b | |
| Total amino acid (mg/100 g) | 1.16 ± 0.10 cd | 1.04 ± 0.06 d | 1.08 ± 0.05 cd | 1.36 ± 0.04 b | 1.22 ± 0.03 bc | 1.81 ± 0.10 a | 1.82 ± 0.24 a | |
Values are means ± SD. Numbers with different superscript are significantly (p < 0.05) different with respect to column for the different categories: Duncan’s multiple comparison test.
Table 2.
Correlation analysis (CA) on quality parameters.
| X1 | X2 | X3 | X4 | X5 | X6 | X7 | X8 | X9 | X10 | X11 | X12 | X13 | X14 | X15 | X31 | |
|---|---|---|---|---|---|---|---|---|---|---|---|---|---|---|---|---|
| X1 | 1 | |||||||||||||||
| X2 | −0.777 ** | 1 | ||||||||||||||
| X3 | 0.319 | −0.381 | 1 | |||||||||||||
| X4 | 0.393 | −0.067 | 0.217 | 1 | ||||||||||||
| X5 | 0.351 | −0.593 | 0.798 | 0.016 | 1 | |||||||||||
| X6 | −0.945 ** | 0.698 | −0.205 | −0.496 | −0.216 | 1 | ||||||||||
| X7 | 0.788 | −0.624 | −0.032 | 0.221 | 0.137 | −0.742 | 1 | |||||||||
| X8 | 0.836 | −0.496 | −0.049 | 0.444 | −0.001 | −0.882 | 0.734 | 1 | ||||||||
| X9 | 0.928 | −0.661 | 0.205 | 0.439 | 0.233 | −0.934 | 0.745 | 0.931 | 1 | |||||||
| X10 | 0.622 | −0.423 | 0.208 | 0.562 | 0.219 | −0.666 | 0.422 | 0.666 | 0.657 ** | 1 | ||||||
| X11 | 0.783 | −0.599 | −0.014 | 0.366 | 0.08 | −0.826 | 0.621 | 0.793 | 0.765 | 0.729 | 1 | |||||
| X12 | 0.19 | −0.111 | −0.587 | 0.038 | −0.395 | −0.258 | 0.267 | 0.430 ** | 0.367 | 0.201 | 0.344 * | 1 | ||||
| X13 | −0.008 | 0.06 | −0.256 | 0.117 | −0.085 | −0.097 | 0.158 | 0.169 | 0.045 | 0.315 | 0.296 | 0.192 | 1 | |||
| X14 | 0.553 | −0.717 | 0.23 | 0.071 | 0.425 ** | −0.603 | 0.600 | 0.390 | 0.487 | 0.203 | 0.517 | −0.039 | 0.313 | 1 | ||
| X15 | 0.678 | −0.586 | 0.761 | 0.458 | 0.598 | −0.654 ** | 0.315 | 0.38 | 0.627 | 0.409 | 0.408 | −0.232 | −0.201 | 0.483 | 1 | |
| X31 | 0.913 | −0.796 | 0.272 | 0.389 | 0.305 | −0.926 | 0.627 | 0.805 | 0.894 | 0.569 | 0.766 | 0.222 | −0.13 | 0.562 | 0.689 | 1 |
Note: ** and * mean significant level at 0.01 and 0.05, respectively. X1–X15, X31: soluble sugar (%), ascorbic acid (mg/100 g), fresh mass (g), shape ratio, edible rate (%), moisture content (%), Na (mg/kg), Mg (mg/kg), K (mg/kg), Mn (mg/kg), Fe (mg/kg), Cu (mg/kg), Zn (mg/kg), dietary fiber (%), cAMP (mg/kg), totalamino acid (mg/100 g).
Table 3.
Varimax rotated factor loadings of the first five principal components (PCs).
| Quality Parameter | PC1 | PC2 | PC3 | PC4 | PC5 |
|---|---|---|---|---|---|
| Soluble sugar (X1, %) | 0.859 | 0.366 | 0.180 | 0.167 | −0.007 |
| Ascorbic acid (X2, mg/100 g) | −0.590 | −0.671 | −0.283 | 0.176 | −0.087 |
| Fresh mass (X3, g g) | 0.039 | 0.177 | 0.922 | 0.161 | −0.128 |
| Shape ratio (X4) | 0.319 | −0.068 | 0.123 | 0.792 | 0.023 |
| Edible rate (X5, %) | 0.114 | 0.345 | 0.800 | −0.166 | 0.110 |
| Moisture content (X6, %) | −0.848 | −0.332 | −0.085 | −0.303 | −0.067 |
| Na (X7, mg/kg) | 0.842 | 0.120 | −0.021 | −0.164 | 0.226 |
| Mg (X8, mg/kg) | 0.915 | 0.069 | −0.152 | 0.266 | 0.049 |
| K (X9, mg/kg) | 0.932 | 0.182 | 0.079 | 0.228 | −0.015 |
| Mn (X10, mg/kg) | 0.470 | 0.230 | 0.034 | 0.597 | 0.304 |
| Fe (X11, mg/kg) | 0.684 | 0.376 | −0.148 | 0.327 | 0.280 |
| Cu (X12, mg/kg) | 0.399 | 0.030 | −0.718 | −0.020 | 0.062 |
| Zn (X13, mg/kg) | 0.057 | −0.105 | −0.168 | 0.139 | 0.919 |
| Dietary fiber (X14, %) | 0.525 | 0.388 | 0.327 | −0.204 | 0.462 |
| cAMP (X15, mg/kg) | 0.453 | 0.317 | 0.868 | 0.343 | −0.136 |
| Aspartate (X16, g/100 g) | 0.568 | 0.255 | 0.474 | 0.360 | −0.007 |
| Threonine (X17, g/100 g) | 0.710 | 0.426 | 0.280 | 0.392 | 0.066 |
| Serine (X18, g/100 g) | 0.659 | 0.433 | 0.231 | 0.259 | −0.021 |
| Glutamate (X19, g/100 g) | 0.694 | 0.638 | −0.100 | 0.162 | 0.075 |
| Proline (X20, g/100 g) | 0.658 | 0.362 | −0.127 | 0.168 | −0.251 |
| Glycine (X21, g/100 g) | 0.608 | 0.592 | 0.280 | 0.213 | −0.020 |
| Alanine (X22, g/100 g) | 0.554 | 0.691 | 0.258 | 0.031 | 0.011 |
| Valine (X23, g/100 g) | 0.641 | 0.646 | 0.286 | 0.093 | 0.077 |
| Isoleucine (X24, g/100 g) | 0.561 | 0.695 | −0.032 | 0.228 | −0.271 |
| Leucine (X25, g/100 g) | 0.563 | 0.737 | 0.116 | 0.190 | −0.048 |
| Tyrosine (X26, g/100 g) | 0.092 | 0.736 | 0.121 | −0.348 | −0.085 |
| Phenylalanine (X27, g/100 g) | 0.406 | 0.779 | 0.182 | 0.156 | −0.066 |
| Lysine (X28, g/100 g) | 0.329 | 0.738 | 0.277 | 0.295 | −0.120 |
| Histidine (X29, g/100 g) | 0.404 | 0.704 | 0.289 | −0.056 | 0.196 |
| Arginine (X30, g/100 g) | −0.326 | 0.749 | 0.081 | 0.119 | 0.455 |
| Total amino acid (X31, mg/100 g) | 0.794 | 0.518 | 0.116 | 0.222 | −0.152 |
Table 4.
(a) Classification of Chinese jujube samples based on eight main quality parameters by the OPLS-DA model; (b) discriminating accuracy of main quality parameters in Chinese jujube samples using the OPLS-DA model.
Table 4.
(a) Classification of Chinese jujube samples based on eight main quality parameters by the OPLS-DA model; (b) discriminating accuracy of main quality parameters in Chinese jujube samples using the OPLS-DA model.
| (a) | ||||||||||||
| Data set | Region | Sample Number | Discriminant Accuracy (%) | Henan | Hebei | Shanxi | Shaanxi | Xinjiang | ||||
| Training set | Henan | 11 | 100 | 11 | 0 | 0 | 0 | 0 | ||||
| Hebei | 11 | 100 | 0 | 11 | 0 | 0 | 0 | |||||
| Shanxi | 11 | 100 | 0 | 0 | 11 | 0 | 0 | |||||
| Shaanxi | 20 | 100 | 0 | 0 | 0 | 20 | 0 | |||||
| Xinjiang | 28 | 100 | 0 | 0 | 0 | 0 | 28 | |||||
| Testing set | Henan | 4 | 100 | 4 | 0 | 0 | 2 | 0 | ||||
| Hebei | 4 | 75 | 0 | 3 | 0 | 1 | 0 | |||||
| Shanxi | 4 | 100 | 0 | 0 | 4 | 0 | 0 | |||||
| Shaanxi | 7 | 71.43 | 0 | 2 | 0 | 5 | 0 | |||||
| Xinjiang | 11 | 100 | 0 | 0 | 0 | 0 | 11 | |||||
| (b) | ||||||||||||
| Data set | Region | Sample Number | Discriminant Accuracy (%) | Huizao | Jinsixiaozao | Hupingzao | Xiangzao | Tanzao | Junzao | |||
| Training set | Huizao | 24 | 100 | 11 | 0 | 0 | 0 | 0 | 0 | |||
| Jinsixiaozao | 11 | 100 | 0 | 11 | 0 | 0 | 0 | 0 | ||||
| Hupingzao | 11 | 100 | 0 | 0 | 11 | 0 | 0 | 0 | ||||
| Xiangzao | 9 | 100 | 0 | 0 | 0 | 11 | 0 | 0 | ||||
| Tanzao | 11 | 100 | 0 | 0 | 0 | 0 | 11 | 0 | ||||
| Junzao | 15 | 100 | 0 | 0 | 0 | 0 | 0 | 15 | ||||
| Testing set | Huizao | 9 | 100 | 9 | 0 | 0 | 0 | 0 | 0 | |||
| Jinsixiaozao | 4 | 100 | 0 | 4 | 0 | 0 | 0 | 0 | ||||
| Hupingzao | 4 | 75 | 0 | 0 | 3 | 1 | 0 | 0 | ||||
| Xiangzao | 3 | 100 | 0 | 0 | 0 | 3 | 0 | 0 | ||||
| Tanzao | 4 | 75 | 0 | 1 | 0 | 0 | 3 | 0 | ||||
| Junzao | 6 | 100 | 0 | 0 | 0 | 0 | 0 | 6 | ||||
Publisher’s Note: MDPI stays neutral with regard to jurisdictional claims in published maps and institutional affiliations. |
© 2021 by the authors. Licensee MDPI, Basel, Switzerland. This article is an open access article distributed under the terms and conditions of the Creative Commons Attribution (CC BY) license (https://creativecommons.org/licenses/by/4.0/).
Share and Cite
MDPI and ACS Style
Wu, L.; Li, L.; Zhang, G.; Jiang, N.; Ouyang, X.; Wang, M. Geographical and Varietal Traceability of Chinese Jujubes Based on Physical and Nutritional Characteristics. Foods 2021, 10, 2270. https://doi.org/10.3390/foods10102270
AMA Style
Wu L, Li L, Zhang G, Jiang N, Ouyang X, Wang M. Geographical and Varietal Traceability of Chinese Jujubes Based on Physical and Nutritional Characteristics. Foods. 2021; 10(10):2270. https://doi.org/10.3390/foods10102270
Chicago/Turabian StyleWu, Linxia, Ling Li, Guoguang Zhang, Nan Jiang, Xihui Ouyang, and Meng Wang. 2021. "Geographical and Varietal Traceability of Chinese Jujubes Based on Physical and Nutritional Characteristics" Foods 10, no. 10: 2270. https://doi.org/10.3390/foods10102270
Note that from the first issue of 2016, this journal uses article numbers instead of page numbers. See further details here.