Article

A Scientometric Assessment of Agri-Food Technology for Research Activity and Productivity

1
Technopreneurship and Innovation Management Program, Graduate School, Chulalongkorn University, Bangkok 10330, Thailand
2
Department of Computer Engineering, Faculty of Engineering, Chulalongkorn University, Bangkok 10330, Thailand
3
Department of Chemistry, Faculty of Science, Chulalongkorn University, Bangkok 10330, Thailand
*
Author to whom correspondence should be addressed.
Publications 2021, 9(4), 57; https://doi.org/10.3390/publications9040057
Submission received: 5 November 2021 / Revised: 3 December 2021 / Accepted: 16 December 2021 / Published: 20 December 2021
(This article belongs to the Special Issue Modern Problems of Scientometric Assessment of Publication Activity)

Abstract

:
In accordance with the UN Sustainable Development Goals (SDGs), several SDGs target global food issues, including zero hunger (food security and sustainable agriculture), responsible consumption and production (food losses), climate action (greenhouse gas emissions from food waste), and partnerships for the goals (research collaboration). As such, it is vital to identify technology and market opportunities to support advanced development by exploring scientific and technological research on such SDGs. The significance of technological innovation and evaluations of activity, productivity, and collaboration aids and guides future research streams. Motivated by the growing severity of the global food waste crisis, this paper focuses on the case study of shelf-life extension technology for food and applies a scientometric analysis of patents based on text mining. VantagePoint was used to analyze 2516 patents issued between 2000 and 2020, with the aim of understanding the conceptual structure of knowledge and the social relationships among key players. The results indicate that the technology is experiencing a period of growth, and it can be clustered into five technology sectors. Across all technology clusters, China outperformed other countries in terms of the number of patents. Almost all of China’s patents applied for technology commercialization domestically, whereas other countries tended to apply for patents overseas to exploit opportunities. The findings have implications for both policymaking and strategic decision-making using a multi-layered network innovation system.

1. Current Issues in Agri-Food Industry and Technology

Leaders from 193 countries around the world initiated a plan known as the Sustainable Development Goals (SDGs) together with the United Nations Development Program (UNDP). In total, there are 17 SDGs, each focusing on creating a future without poverty, hunger, or insecurity. Several SDGs target global food issues, including zero hunger (food security and sustainable agriculture), responsible consumption and production (food losses), climate action (greenhouse gas emissions from food waste), and partnerships for the goals (research collaboration).
At present, various global trends are influencing food security and the degree to which food and agricultural systems are sustainable. By 2050, the global population is estimated to reach approximately 10 billion, which has been forecasted to correspond to a growth in agricultural demand by 50% over 2013 [1]. Considered in relation to other sectors, growth in the agricultural sector is two to four times more effective in raising individual incomes. Agricultural activities also play a pivotal role in economic growth, as reflected by the fact that 4% of worldwide gross domestic product (GDP) is based on agriculture, with this figure exceeding 25% in several developing countries [2]. Nevertheless, growth facilitated by agriculture has been noted for its potentially damaging impact on food safety and food security. Available data indicate that agriculture and land use changes account for approximately 25% of climate change effects observed in recent years (e.g., via greenhouse gas emissions). These activities produce levels of waste and pollution that cannot be sustained in the long term [3]. At the same time, it is anticipated that climate change will directly influence food nutrition and food quality in the future. Given that food waste and food losses occur for approximately 33% of all food produced around the world, it is crucial to recognize that resolving challenges surrounding food waste and loss is essential for enhancing not only food and nutrition security but also the situation regarding climate change and environmental stress [3].
A range of factors can be considered causes of food loss and waste. Over 80% of food loss and waste derives from post-harvest management activities such as processing, packaging, distribution, and consumption, and this waste stems from limitations in terms of shelf-life length [4]. Shelf-life extension technology can delay the spoiling of food and, in this way, lead to the prevention of food loss and waste. Of note, fresh vegetables and fruits, which offer high nutritional and health benefits, have become increasingly popular globally, resulting in a recent global pattern of higher consumption and greater investment in R&D activities. In terms of post-harvest processing activities, these have a detrimental impact on shelf-life length in terms of surface browning and lower nutritional content, which has raised public health concerns in some jurisdictions [5]. Hence, the development and dynamics of R&D in this issue have to be examined as a way to enhance food safety, minimize food waste, and improve consumer protection.

2. Scientific and Technology Opportunities based on Scientometric Analysis

Technology opportunity analysis (TOA) was originally proposed by Cooper and Schendel [6] as a tool for helping organizations to counter threats (e.g., disruption) arising from novel technologies. It refers to the group of activities that can lower uncertainty regarding technology. TOA enables the establishment of competitive advantages by forecasting trends, obtaining key technology information, and learning about research and development (R&D) opportunities [7]. Furthermore, TOA has the potential to facilitate technological progress either generally or in a particular discipline [8]. Obtaining insights of this kind in a timely manner is crucial for establishing a competitive advantage in both strategic planning and operational aspects.
To improve TOA performance, it is possible to leverage tools from the big data era. In particular, a data-driven TOA process involving the comprehensive analysis of technical documentation (e.g., patents) can be utilized to assist decision making [9]. Patents, which can be regarded as specific types of technical documents, are fundamental in knowledge-based economies, and they have garnered significant attention in the literature on technology competition and technology monitoring [8,10]. Patents contain more than 80% of technical information worldwide and are a trigger for new ideas and solutions [11]. The widespread application of information from patents includes areas such as technology forecasting, technology policy, technology assessment, and innovation improvement [8]. Patents serve as the legal basis for intellectual property rights, but they also contain rich content and detailed information relating to a specific novel technology [12].
Patent information is used for various purposes, ranging from legal to technological to managerial purposes. These uses include evaluating the originality or evolution of technology, finding competitors, determining the capacity for innovation, assisting in the design of patent planning and strategy, conducting quality analysis of patents, and finding patents with substantial promise [8]. As a case in point, directors within organizations can use patent information to safeguard against investing in R&D projects that will not yield benefits [13], coordinate R&D projects that lead to critical patents [14], and gain insight into popular or impactful technologies [15].
One characteristic of patents is an International Patent Classification (IPC) code, as defined by the World Intellectual Property Organization (WIPO) [16]. It is an index that serves the purpose of classifying inventions in a standardized way. An IPC code indicates the technology area that an invention belongs to and provides a hierarchically organized system of symbols that are language-independent, which can be used to classify patents and utility models. A definition of IPC codes is given at the WIPO’s webpage (https://www.wipo.int/classifications/ipc/, accessed on 30 July 2021). As a classification tool, IPC codes are routinely applied in patent offices worldwide. IPC codes are categorized into five levels: sections (A-H), classes, subclasses, main groups, and subgroups. Based on an analysis of the distribution of IPC codes, it is possible to establish an understanding of the main technical areas in any given field. As a consequence, the analysis of IPC codes can also help in understanding the research areas and knowledge flow of the technology.
The value of patents is critical for competition in today’s markets. If a patent can lead to commercial opportunities such as new product launches or new technology licenses, it is considered to have business value [17]. Patents are also a fine-grained source of information relating to markets, and at the level of countries, patents are reflective of the country’s capacity for technological innovation [17]. For this reason, the number of patents associated with the country can also be viewed as a proxy for the country’s level of innovation and technology.
In addition, a citation is defined as a reference to prior work (i.e., prior art) that is regarded as relevant for an ongoing patent application [15]. There are two main types of citations: backward citations and forward citations. Backward citations refer to patents that are cited by a specific patent, whereas forward citations refer to patents that cite a specific patent [15]. Commonly used indicators that assist in predicting the technological value and commercial viability of a patent are patent citations and the state-of-the-art they include, as well as the frequency of citing previous documents [15]. To be more specific, forward citations are frequently used as a proxy for the value of the patent. That is to say, a patent with a significant number of forward citations has a greater likelihood compared to those with a limited number of forward citations of leading to a competitive advantage and playing a key role in a particular field of technology [18]. Understanding the economic value of a patent, as well as its significance, aids in investigating the connection between firm performance and the number of forward citations. In the research undertaken by Chen and Chang [19], the researchers confirmed that citation value is positively associated with market value. Nevertheless, the authors found that when patent citations exceed an optimal threshold value, they are negatively associated with corporate market value owing to the R&D spillover effect. For this reason, tracking the forward citations of any given patent application enables the identification of emerging competitors, potential infringers, and future licensing opportunities. The total number of citations can be used to determine the market value of the technology of the active or influencing assignees.
Text mining has been applied throughout the literature for the analysis of technology opportunities, tracing or monitoring the evolution of the technology, and identifying upcoming trends [20,21]. As a case in point, Chae and Gim [22] developed a model for investigating technical inventions and promoting competition in innovation from patent applications on the basis of patent classification systems. The authors proposed a hierarchically organized technological taxonomy of the classification of each patent, which detailed key developments in patent applications. In the research of Liu et al. [23], the authors undertook social network analysis to examine developments in patent collaboration in China in the field of smart technology for smart grids. For the purpose of identifying the positions of technology in a network (e.g., in terms of the greatest importance, the most influencers, and the most interconnections), the researchers calculated indicators such as betweenness centrality and degree centrality. Given the growth in the value and significance of patents, a range of analysis and search systems have been developed. Further analysis system studies are required to analyze patents worldwide from a diverse perspective. Hence, this study focuses on patents, which have emerged as important not only for business value but also for social value, and it analyzes them from a policymaking and technology management point of view, highlighting the implications from patent analysis.
Despite the value of patent technology opportunity analysis in enabling the identification of technology competition and the investigation of strategies for business and technology development [24], the literature on patents for shelf-life extension technology is—to the best of our knowledge—limited. Most prior studies have focused on analyzing supply chains that handle fruits, vegetables, and other foodstuffs, and they have not targeted the question of novel technology for shelf-life extension [25,26,27]. As a case in point, Tatry, Fournier, Jeannequin, and Dosba [25] reviewed the literature on fruit and vegetable species to identify key actors, topics, and species, thereby establishing an accurate picture of the state of the research landscape. In the research undertaken by Daim, Rueda, Martin, and Gerdsri [26], the focus was the patent analysis of food safety technologies, which enabled the authors to predict upcoming technologies, market responses, and commercial successes in this sector. Hence, the study’s results have strong empirical grounding and may motivate researchers to engage in deeper scientometric studies in other fields.
In light of several factors—namely, the rapid expansion in the number of patents for shelf-life extension technology, the growing attention paid toward industrial applications in this area, and the emergence of innovative technologies such as bio-based technologies [28,29]—the following research questions are important to pursue:
  • What trends, technologies, and market opportunities exist in terms of technology clusters, sectors, and fields, and how are they interrelated?
  • Who are the active players (i.e., countries and assignees) and what are the dynamics of patent activities to explore the research landscape?
With these questions in mind, this paper presents a scientometric text mining approach known as technology intelligence—which leverages both qualitative and quantitative methods—to assist in patent analysis. The model offers methods that can be used to understand the conceptual structure in exploring the development of technology areas, as well as the social structure in terms of networks and collaboration patterns at a multi-level perspective (i.e., country-level, organization-level, and so on). This process empirically applies patents associated with fruit shelf-life extension technology, which is a problematic area in post-harvesting management in agriculture, with the aim of establishing a holistic understanding—encompassing micro to macro views—and presenting insights from a meta-perspective that facilitates comprehension of the current state, development, and trends in shelf-life extension technology research.

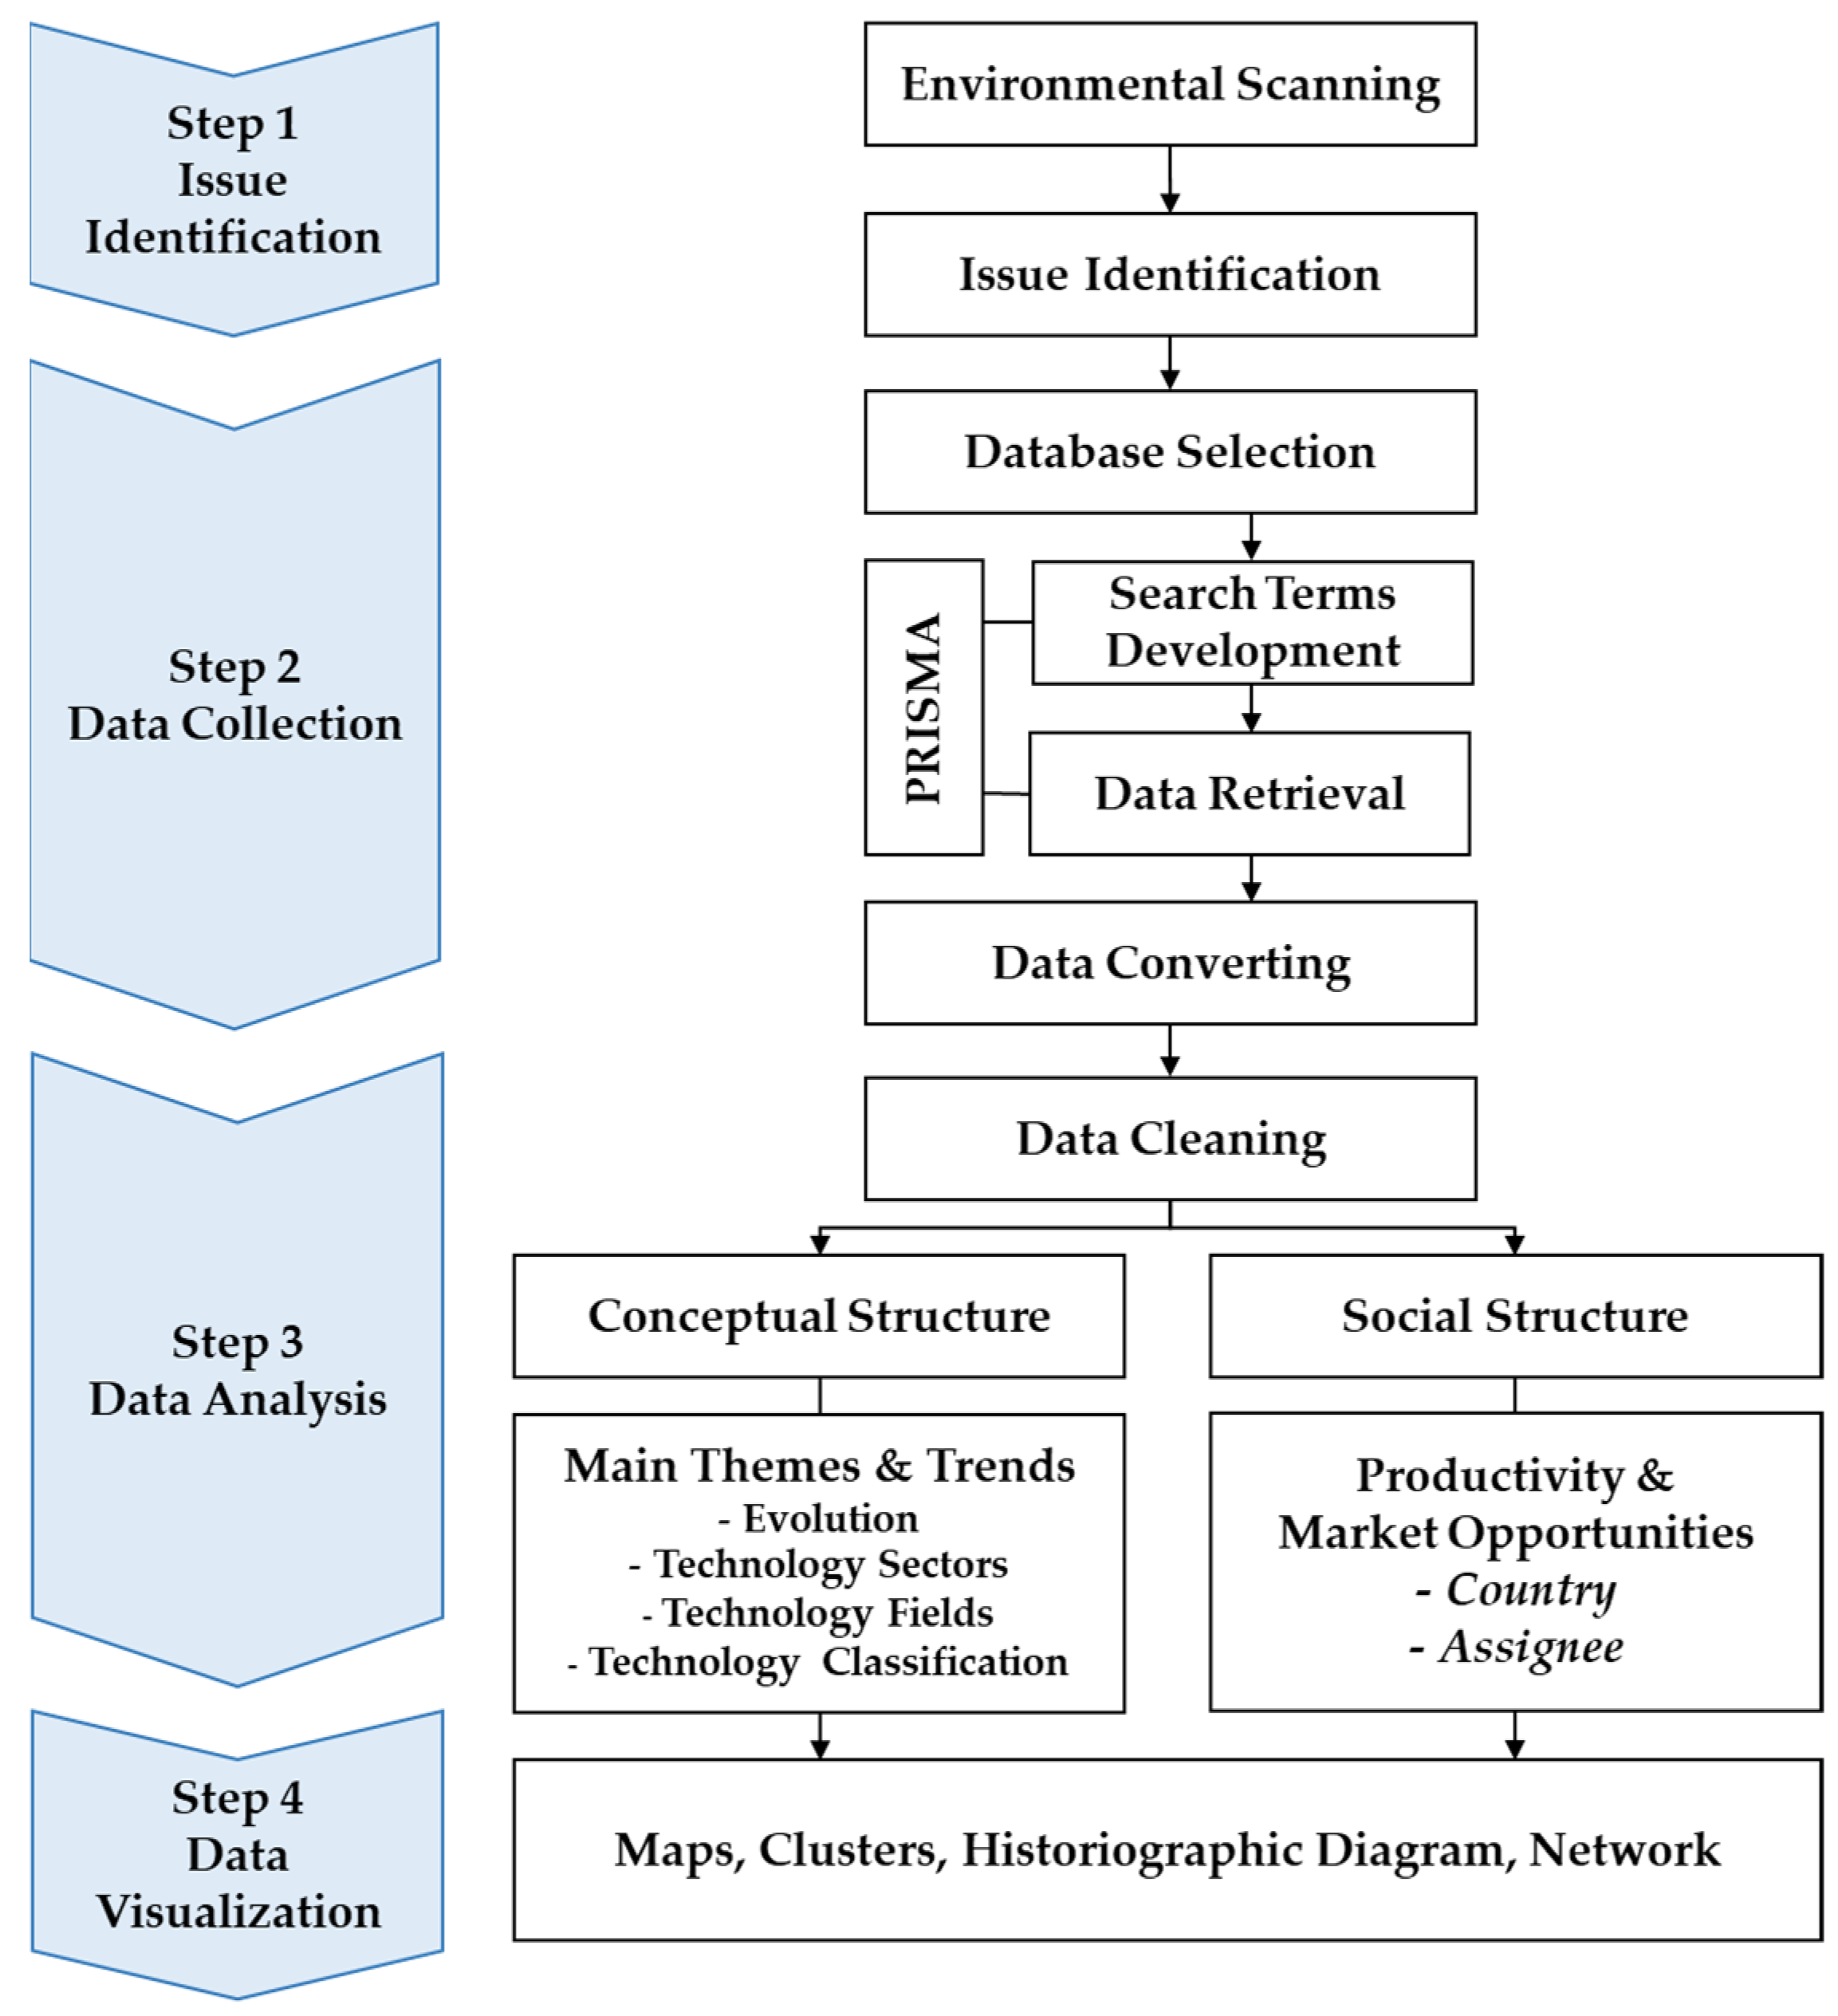
3. Methodology and Data

The concept of technology intelligence, which refers to the activity of extracting crucial decision-making information to promote innovation [7], was used in this research. Additionally, technology intelligence enables researchers to gain insight into technological developments that produce competitive advantages [30]. Therefore, scientometric analysis, which refers to technology intelligence as an approach for technology opportunity analysis, was used for patent analysis. The use of this approach is valuable in finding existing areas in which technology is under development (e.g., specific technology fields and sectors), as well as exploring trends in research network and collaboration. In particular, this can yield benefits for governments, corporations, and universities in terms of supporting and guiding R&D. Scientometric patent text mining was used to yield insights from the analysis of raw big data pertaining to patents. As previously noted, the focal point of the research is post-harvest food management, particularly technology for fruit shelf-life extension. This focus was selected to illuminate existing technologies in the field, as well as key players, thus enabling future collaborations for the improvement of food quality, security, and safety. Considerations relating to this study’s materials and methods are discussed in the next sections.

3.1. Data Source

When investigating the state of technical resource distribution and the development features of a certain area of technology, it is possible to organize complex technical information into comprehensible and logical statistics based on an analysis of patent data [31]. For this reason, applying scientometric analysis to patent data holds significant promise. In this research, we specified keywords associated with this technology. Following the Boolean approach described by Porter et al. [32], and also with the assistance of an expert researcher, search terms were built up from initial search strings. The following search term was used to retrieve patent documents from TotalPatent One: ‘TITLE-ABS (“shelf life” OR shelf-life OR “storage life”) AND (extension* OR extend* OR increas* OR improv* OR prolong* OR pro-long*) AND (fruit*) AND (postharvest* OR post-harvest* OR fresh* OR “fresh cut” OR fresh-cut)’. In this search term, the asterisk guarantees that the search will not exclude variants of the words.
The data collection process was conducted throughout April 2021. One of the most comprehensive patent databases available online, TotalPatent One (https://www.totalpatentone.com), was accessed on 1 April 2021 and used as the data source for retrieving patent documents, and the search was restricted to the period between 2000 and 2020. TotalPatent One, a patent search platform, was used because of high coverage data with more than 100 patent authorities [33]. The rationale for selecting 2000 as the start year was based on a finding from our prior analysis, which indicated that prior to 2000, a regulation existed that prevented universities and government agencies from owning patents, and the number of patents was limited [34]. It is also important to note that as a result of the lag period between filing and publishing patents, the number of relevant patents identified in this study was not completed. Nevertheless, this did not influence our analysis of this area of technology. At the end of the data collection process, 2516 patents were identified, which were subsequently imported into the text mining software for data analysis.

3.2. Data Cleaning

As an essential pre-processing step before data analysis, data cleaning was applied to eliminate errors and duplication arising from variability in expressions and names. Unmatched data were combined to facilitate standardization, and the “List Cleanup” tool—paired with a manual cleanup—was applied to unify country, assignee, and inventor names. As a case in point, certain applicant names are the same but they are expressed differently; for this reason, text manipulation algorithms were applied to the applicant names and they also underwent careful manual inspection. Every applicant’s name was converted into a term with the same meaning, which was also the case for terms such as “Co.”, “Co”, “Limited”, “ltd.” and “Ltd”, which were substituted with empty strings.

3.3. Data Analysis

Porter and Cunningham’s [35] nine-step text mining approach—beginning with problem identification and ending with utilization—was applied to analyze the data. Additionally, given that quantitative methods for text mining applied in isolation are unable to yield insights from the data, qualitative data—specifically, the evaluations of domain-specific experts—were used to lend greater robustness, depth, and credibility to the results. This process is based on a more concise and general adaptation of our previous research [34,36]. The framework’s scientometric process is outlined in Figure 1.
VantagePoint version 13.1 (https://www.thevantagepoint.com/), from Search Technology, Inc., located in Norcross, GA, USA, was used as the text mining software for data analysis. The rationale for using this software was that it is capable of managing big data (i.e., the number of patents retrieved from TotalPatent One), and it also offers a useful suite for refining, investigating, and reporting on information. Additionally, the software can perform a range of scientometric procedures—ranging from the simple to the sophisticated—that are valuable in enabling the identification of patterns, relationships, and trends, which are, in turn, essential for the classification and visual representation of big data. VantagePoint is also capable of inferring relationships between data fields (e.g., the connections between assignees, countries, and technology development areas, as well as their corresponding collaborations, citations, and organizations) [37].
To generate a data overview, scientometric indicators and descriptive statistics were used, examples of which include publication years, country productivity, assignee productivity, annual patent growth, and analysis of filing years. More advanced techniques were also used for knowledge synthesis, including conceptual structure and social structure. Conceptual structure illuminates what science and technology focus on by classifying technology fields and sectors, and social structure focuses on the interactions between actors (i.e., via analysis of assignees and countries), collaboration patterns, and technology and market opportunities [38]. As a case in point, to identify technology sectors and technology fields, International Patent Classification (IPC) codes were used for the following purposes: first, for the analysis of market of interest, where these refer to the countries in which most patents were filed by non-residents (i.e., filings by entities that were not domiciled in the target country); and second, for assignee analysis, where the assignments that were universities, government agencies, individuals, and companies were regarded as understanding the role in collaboration and its technology development opportunities. The details of the data analysis are the following.
First, for the statistical analysis of technology evolution (Section 4.1), the trend line was constructed using MS Excel to understand the evolution and growth rate of numbers of patents. This helped to establish a clear picture regarding the stage of the technology life cycle (TLC). Furthermore, to understand the evolution in each stage of the TLC, it is notable that statistical tools are available to implement tests to explore the differences between each stage of technology development. For this reason, we examined whether specific patent indices (numbers of patents and values of examination periods) are associated with different values in the identified TLC phases (here, the emerging phase and the growth phase). The tested indices were acquired from bibliometric information from the database that was exported to the software for the analysis. An interesting question relates to the issue of whether the length of the process of examination (i.e., the time elapsed between the year a patent was filed and the year it was published) influences the two phases. Additionally, to comparatively examine the means of two groups (in this case, emerging phase and growth phase), we applied an independent samples t-test using IBM’s SPSS (version 22) from IBM Corporation, located in Endicott, NY, United States. This made it possible to generate statistical evidence suggesting that the associated population means were significantly different or not. Specifically, for the independent samples t-test, Levene’s test was initially performed to identify whether variance in the length of the examination process was equal due to different formulations in calculating p-value in t-test analysis. The cutoff point for the p-value was set at 0.05. For p-values less than 0.05, this indicates that the mean values of the examination periods are statistically significant between a given two TLC stages.
Second, for IPC code analysis (Section 4.2), data clustering techniques, which are techniques for data mining analysis, were used to identify structure in multivariate datasets. The K-means clustering algorithm can be applied in various areas with beneficial effects, and the rising level of computing power has resulted in the greater availability of large datasets [39]. Data clustering utilizes partitioning-based techniques, which rely on the iterative movement of data points from cluster to cluster. Data clustering leads to the division of the data points in a dataset into non-overlapping clusters or groups based on their characteristics. The idea is to generate clusters of data points that are highly similar within the group and minimally similar between the groups [40]. Thus, we applied this method to patent data by classifying three attributes (IPC codes, technology sectors, and technology fields) to group patents into clusters. We initially conducted data analysis to gain the profiles of patents in our dataset and then conducted a cluster validation process to find an optimal number of clusters in patent data [41]. As a result, we set five clusters (k = 5) according to the cluster validation process.
Third, for market opportunity analysis by patent filings (Section 4.3), we applied the patent filings profiles (e.g., origin countries and targeted countries) to understand market opportunities for technology commercialization. In this research, we focus primarily on market analysis by exploring both origin and target countries, and we especially seek to gain insight into the nature of countries’ potential markets. As a result, we can obtain information between original countries and targeted countries in terms of whether they focus on domestic or international markets.
Fourth, for the market analysis using numbers of citations (Section 4.4), we applied forward citation analysis to explore the trends regarding patent applications that enable the identification of opportunities, namely, competitors, potential infringers, and future licensing opportunities.
Last, for the collaboration analysis (Section 4.4), and for the purpose of evaluating and identifying collaboration in technological development, VantagePoint was applied to construct a cluster map reflecting the collaboration network shown in the retrieved patents. In a cluster map, the connecting lines represent collaborative research groups in which both an assignee and co-assignees are mentioned in the patents. Furthermore, the yellow nodes correspond to the number of patents, but where the size would be too large, numerical values are shown.

3.4. Data Visualization

Data visualization was undertaken after the analysis process. In particular, to gain insights into the development and evolution of technology, graphs, clusters, and maps were applied, principally because they serve as a decision-making aid. Data visualizations of this kind are expected to play an essential role in guiding executives and managers within corporations, governments, and higher education institutions to develop strategies for R&D, as well as to direct future planning and network formation.
The basic visualization tool applied in this research is the graph (e.g., line chart, bar chart, pie chart, donut chart, etc.), which is employed in the data representations. The advanced visualization tool used in this research is the cluster map (Section 5.3). This map is based on co-occurrence analysis, which assists in creating lists (called nodes) of items by combining all the terms to generate clusters. The sizes of nodes refer to the numbers of records and the linkage lines refer to the relationship degree [36]. The map helps readers understand the groups of interested items and their relationships.

4. Results and Discussion

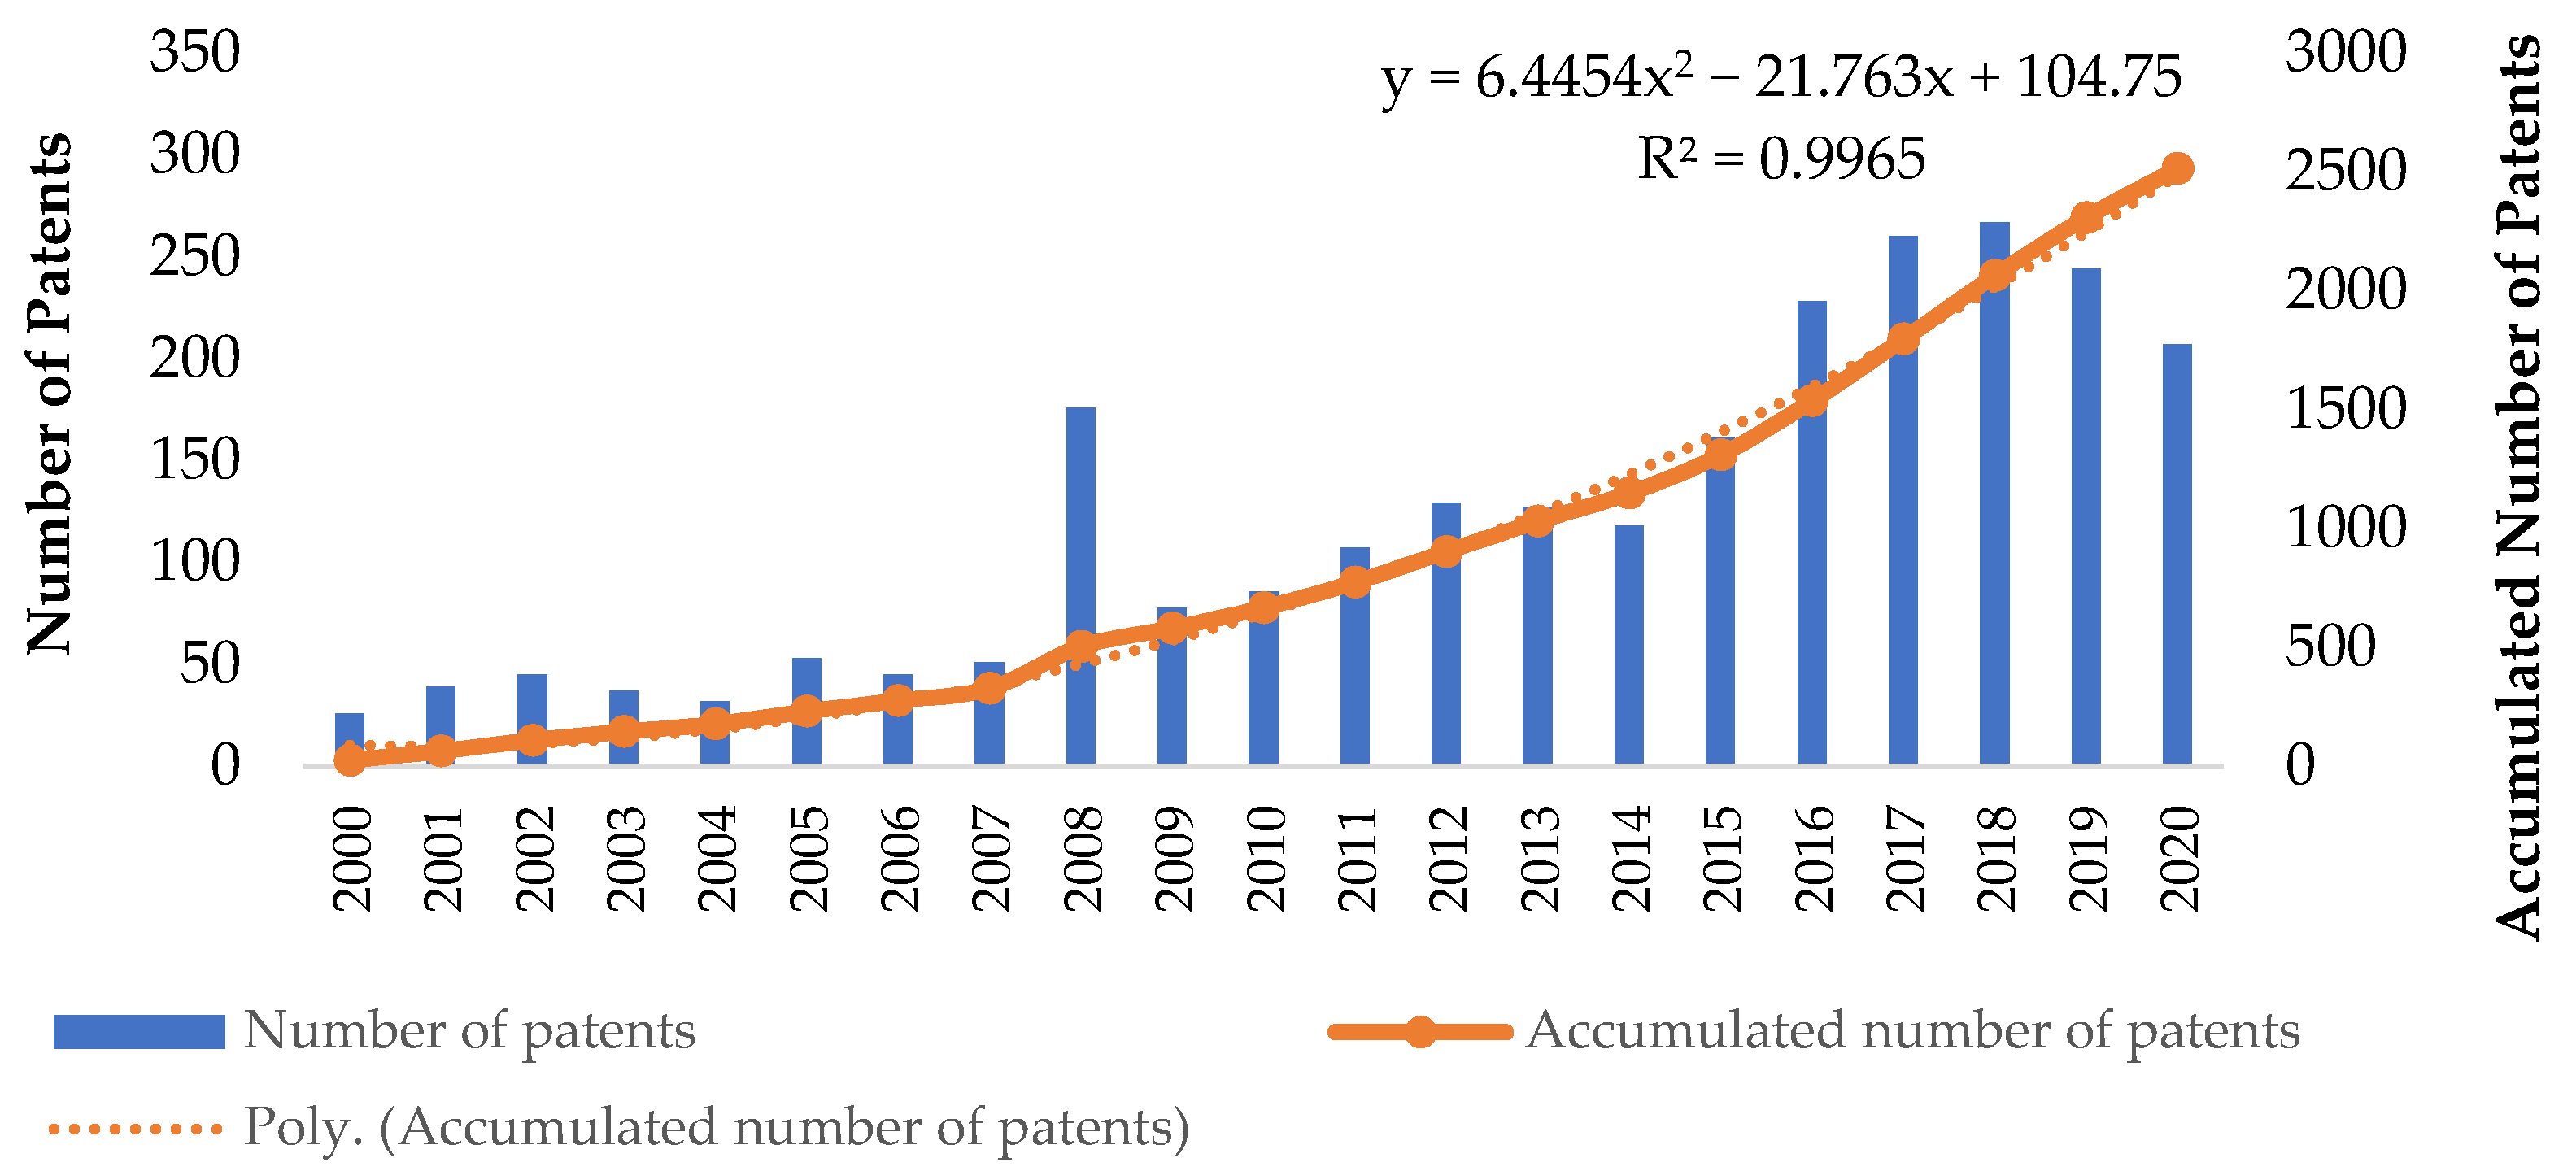
4.1. Evolution over Time

Based on the patents retrieved from TotalPatent One, Figure 2 provides an overview of the number of patents published per year (bar chart), the cumulative frequency representation of these numbers (solid line chart), and the trendline of growth (dash line chart). A total of 2516 patents were published on shelf-life extension technology between 2000 and 2020. Based on the technology life cycle (TLC), it is possible to separate the technological development into two phases, which are the “emerging phase” and “growth phase”. In Figure 2, the emerging phase, where the growth rate increases linearly, lasts from 2000 to 2007, whereas the growth phase begins in 2008 and continues through until 2020. The number of patent publications reached a peak in 2008, and most of these were from corporations where patents filed in 2006 were ultimately granted in 2008 (see Section 3.3 for details). This may be attributable to the fact that Achour [42] proposed a novel indicator, the Global Stability Index (GSI), in 2006 (with a pre-published release in 2005), which can be used to quantify the decline in quality of a foodstuff during storage or commercialization. GSI enables food shelf-life to be estimated effectively by integrating diverse attributes of food into one measure. It has been shown to yield favorable results compared to the traditional procedure of accelerated shelf-life testing (ASLT) [43]. The novel method may have made it easier to undertake more sensitive and precise experiments to quantify food shelf-life, becoming one of the factors to attract researchers to this technology.
Figure 2 indicates that over the period from 2000 to 2020, the rate at which patents were published increased significantly. Between 2000 and 2007, an average of 41 patents was published each year, but between 2008 and 2020, this increased to 168 patents per year. This rate of growth corresponds to a polynomial curve obtained from MS Excel (R2 = 99.6%). Taken together, these data suggest that shelf-life extension technology is growing in popularity among players and is associated with promising possibilities both for R&D and commercialization. The reduction in the number of patents published in 2020 stems from the fact that the data were incomplete at the time the research was undertaken. It is noteworthy that the patents published since 2015 represent 50% of the total number of patents retrieved from TotalPatent One. Continuous patent applications and rising numbers are an indicator of the maturity phase in the TLC [44], but shelf-life extension technology has not yet attained maturity. To summarize, patents concerning shelf-life extension technology indicate that this is an emerging field marked by growing popularity.
A useful area of investigation is the identification of patent indices that display typically different values at each phase in the TLC of a given technology. We sought to determine whether our case study was consistent with the results from prior studies. Descriptive statistics relating to this issue are given in Table 1. On average, the examination periods for the emerging and growth phase were 3.18 ± 2.07 and 2.39 ± 1.97 years, respectively.
As shown in Table 2, the results of Levene’s test and the t-test led to the conclusion that the variances and mean values of examination periods between the two groups were statistically different. Hence, this serves as strong evidence indicating that the time for the examination process of the two phases was different at the significance level of 0.05. There are several possible explanations to account for the finding that the examination process lasts significantly longer in the emerging phase compared to the growth phase. Haupt et al. [45] explained that at the outset of any given technological development (i.e., in the emerging phase of the TLC), applicants often submit broad claims with the intention of limiting opportunities for subsequent patents. In turn, this increases the length of the examination process. It is also notable that the longer examination times associated with the emerging phase can be accounted for by referencing the fact that the examiners lack specific experience concerning the technology at the emerging stage [45]. Moreover, after shorter examination processes in the growth stage, Haupt, Kloyer, and Lange [45] expected a longer average duration for the maturity stage because the applications have to be compared to a higher technological standard; however, our technology life cycle has not reached that stage. At the same time, there are diverse determinants that may influence the examination process, including application characteristics (e.g., total number of classifications), applicant characteristics (e.g., applicant type), and environmental characteristics (e.g., heterogeneity in the technology area) [46].

4.2. Technology Topic Analysis

4.2.1. Overall Technological Development

IPC codes can be used to identify key technologies and emerging technologies. As shown in Figure 3, the technical topics in shelf-life extension patents focused primarily on section A (Human Necessities; 2168 pieces, 74.2% of records), section C (Chemistry and Metallurgy; 356 pieces, 12.2%), and section B (Performing operations; Transporting; 288 pieces, 9.9%). The remaining patents were in section F (Mechanical Engineering, Lighting, Heating, Weapons, and Blasting; 41 pieces, 1.4%), section G (Physics; 36 pieces, 1.22%), and other categories. The fact that most patents were in section A is consistent with this section’s focus on foodstuffs, including both products (e.g., fruits) and processes (e.g., treatment and nutrition modification) for preservation such as disinfectants and to prevent the growth of organisms.
For the detailed analysis, we used the proportion of IPC subgroups of subfields to indicate the leading ten IPC subgroups, which are shown in Appendix A (Table A1). Approximately 9380 records of IPC subgroups were identified in the analyzed report, which indicates that a non-obvious disparity exists in the patent applications among different IPC codes. The IPC in the first place occupied 4.2%, whereas several other IPC subgroups occupied less than 3%. We also noted that the IPC subgroups that count only a single time over the analysis period amounted to 598 pieces, occupying 6.4%, which resulted in a reduction of intensity in the leading IPC subgroups. Those one-time cited subgroups can be considered inactive fields. Based on the IPC subgroups that corresponded to the number of patents, it was found that the technical topics for global patents focused primarily on enzymes, organic compounds, and microorganisms (A23B 7/154); coating protective layers, or compositions or apparatus (A23B 7/16); and fruit or vegetable products with preparation or treatment (A23L 19/00), and so on.

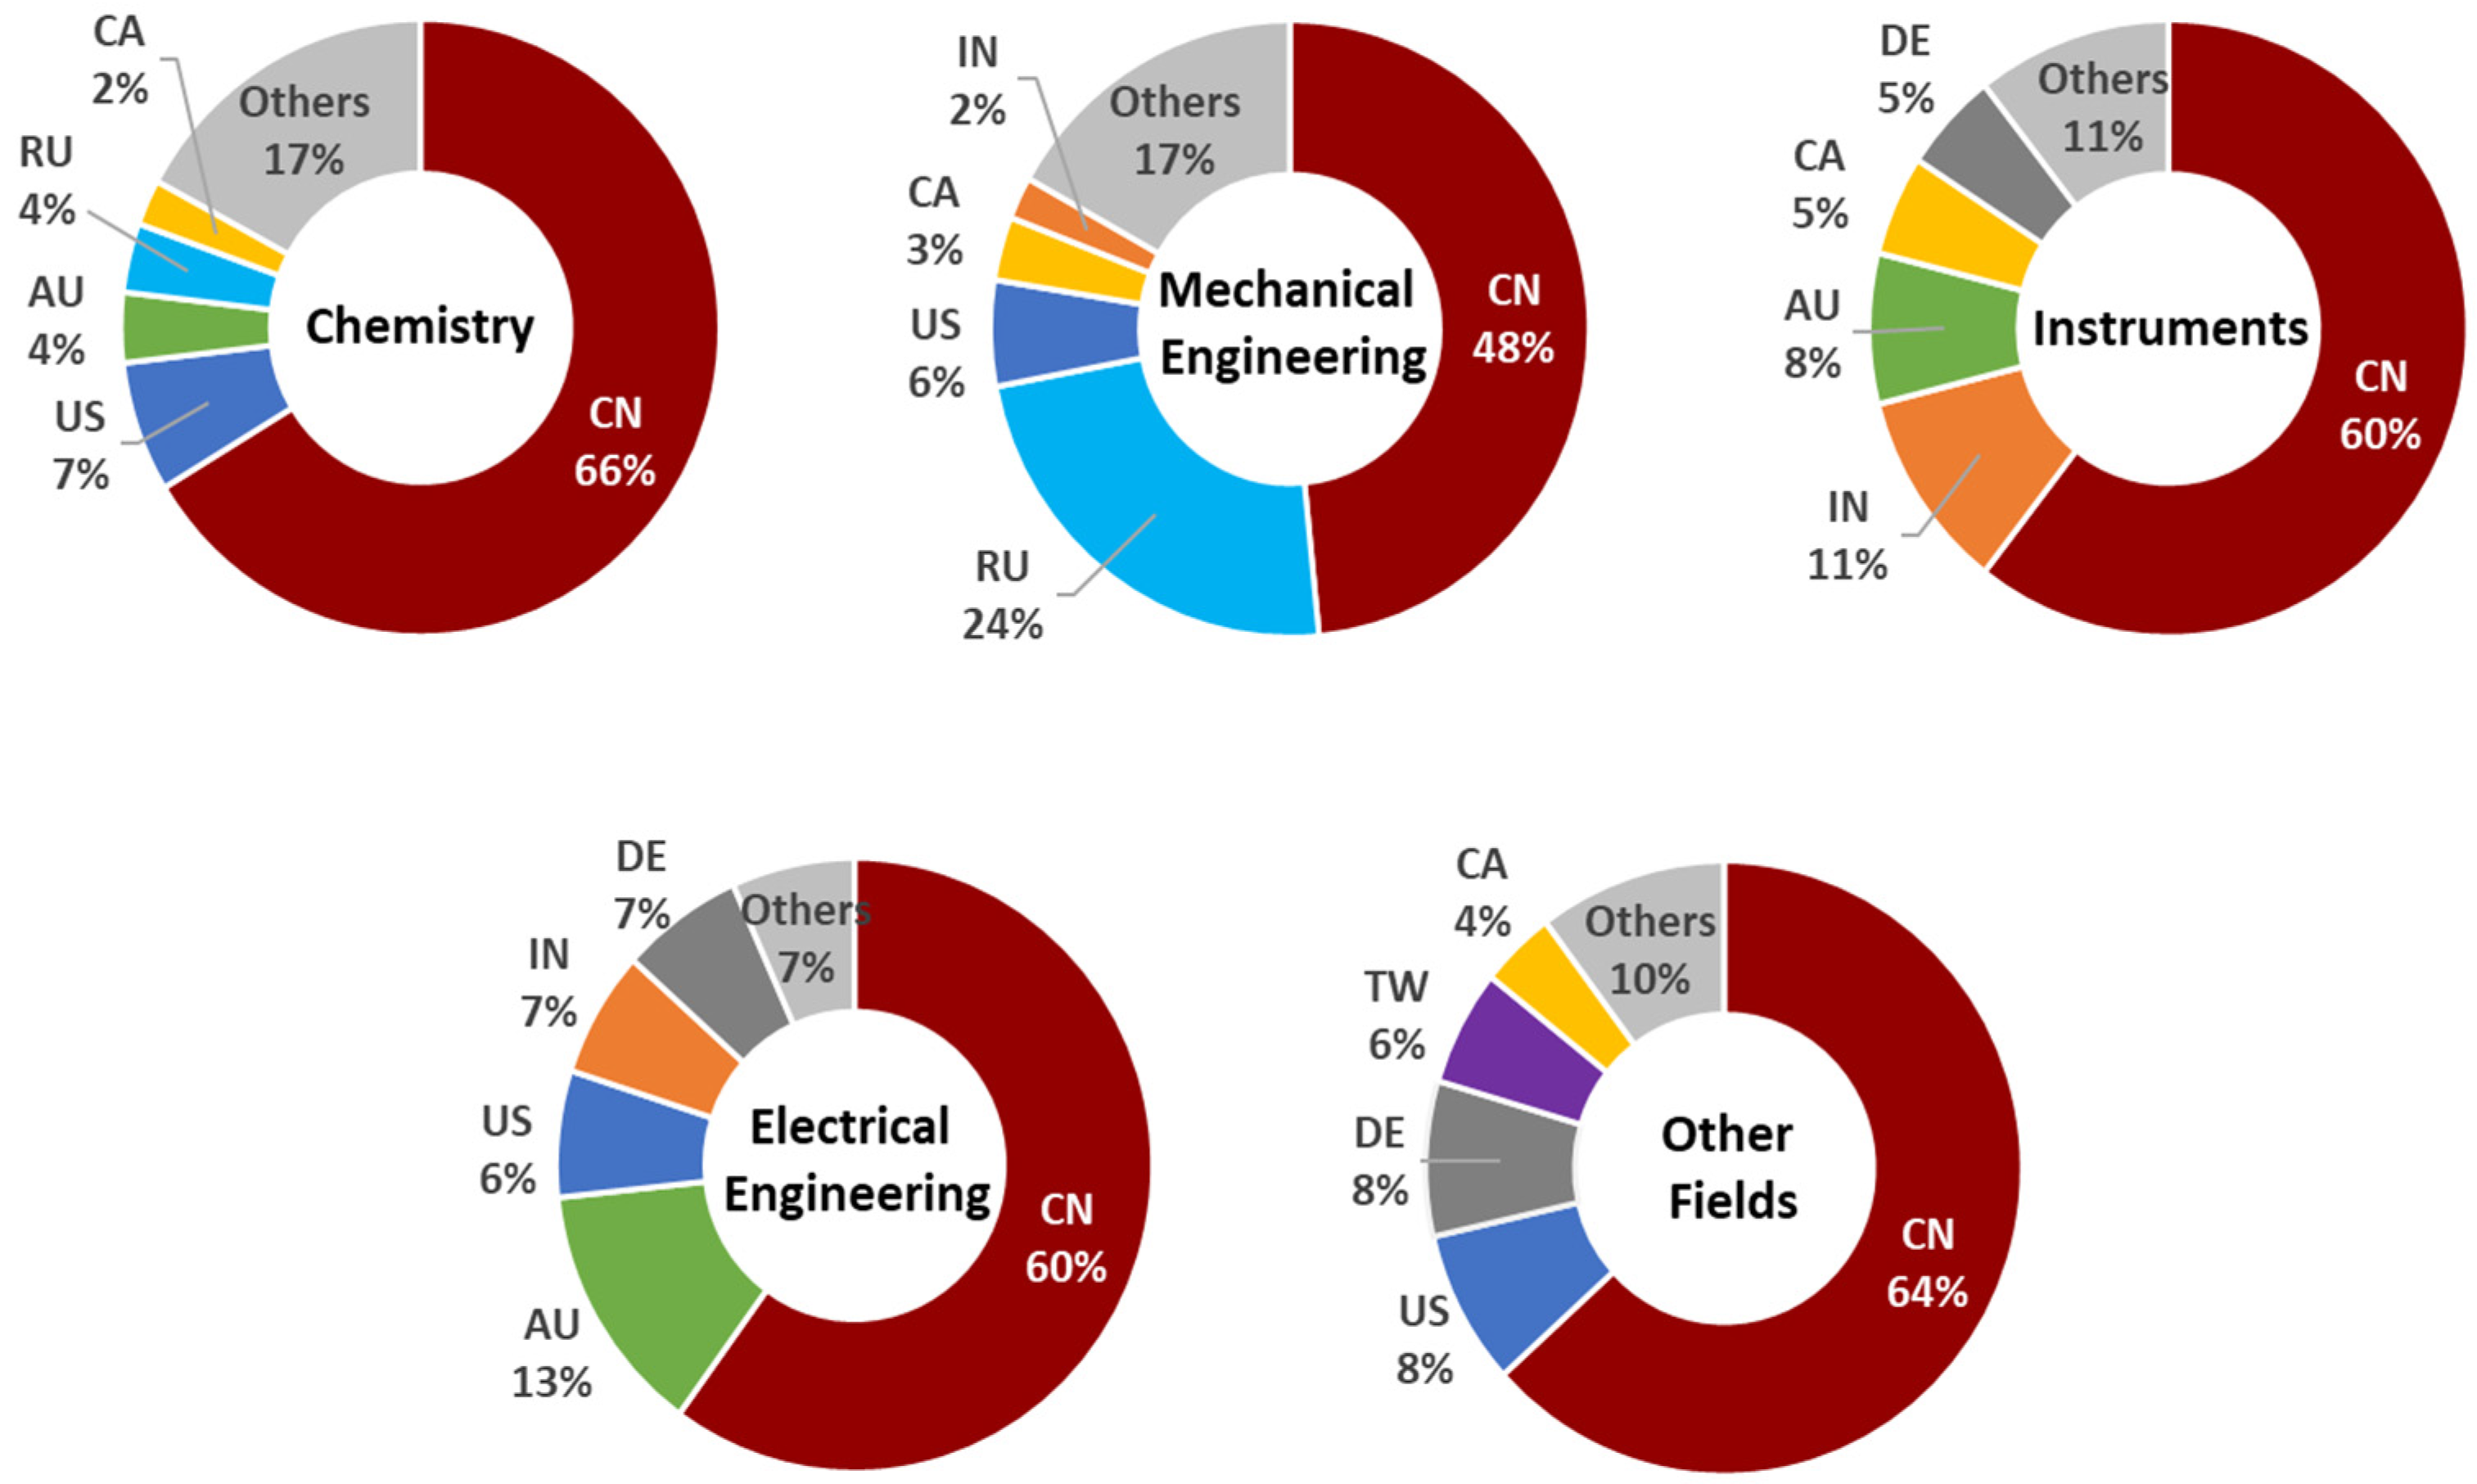
4.2.2. Technological Sectors and Fields

Data clustering was used in this research to identify patent data characteristics. Three variables (or attributes) were used to group the patent datasets: IPC codes, technology sectors, and technology fields. In total, 1403 IPC codes in the subclass level were distributed in each cluster and calculated as a percentage. There are the five clusters (or technology sectors) showing a group of patents, including chemistry (73.8%), mechanical engineering (17.2%), instruments (2.6%), electrical engineering (2.5%), and other fields (3.8%). Data clustering led to the identification of the two largest numbers of patents and three clusters with a relatively small number of patents. The “chemistry” cluster had the largest number of patents. This cluster can be considered to represent an adequate technical sector as it is associated with a large number of registered patents. By contrast, the “instrument”, “electrical engineering”, and “other fields” clusters can be viewed as inadequate technology clusters due to their limited numbers of patents. Every cluster contains data that reflect the relationship between IPC codes and the key terms extracted from patent titles. Both can be used to describe the technologies, inventions, and influencers that are useful for R&D and technology management in the future.
Table 3 provides an overview of patent cluster characteristics based on the attributes of the technology sector, technology field, and IPC subclass code. Each of the clusters comprises specific technology fields and IPC codes. The IPC subclass codes serve as a representative of the inventions shown in each technology field, and it is possible to use these codes to assess the connections between technologies. In particular, this can be achieved by utilizing association rule mining to discover relationships among technological developments. In this study, it was found that the main group and subgroup under the IPC subclass codes resulted in different technology sectors and fields that are not presented in this paper.
The next step in our analysis involved applying various processes to extract key terms from the titles of patents. These processes included tokenizing, stop word filtering, transforming cases, and stemming. An example of patent titles is given in Table A2 (Appendix A). Additionally, Figure 3 shows that the five shelf-life extension technology clusters were largely concentrated in terms of IPC distribution. There was also a clear disparity in the patent applications across the IPC codes. The diverse nature of the cluster distribution reflects the fact that, due to the complex business environment [28], the demand for effective and universal technology is increasing. It also appears to be the case that most patents in the field of shelf-life extension technology are the products of interdisciplinary academic research. For this reason, emphasizing interdisciplinary collaboration is worthwhile among inventors and researchers to produce new viewpoints and lead to favorable research outcomes.

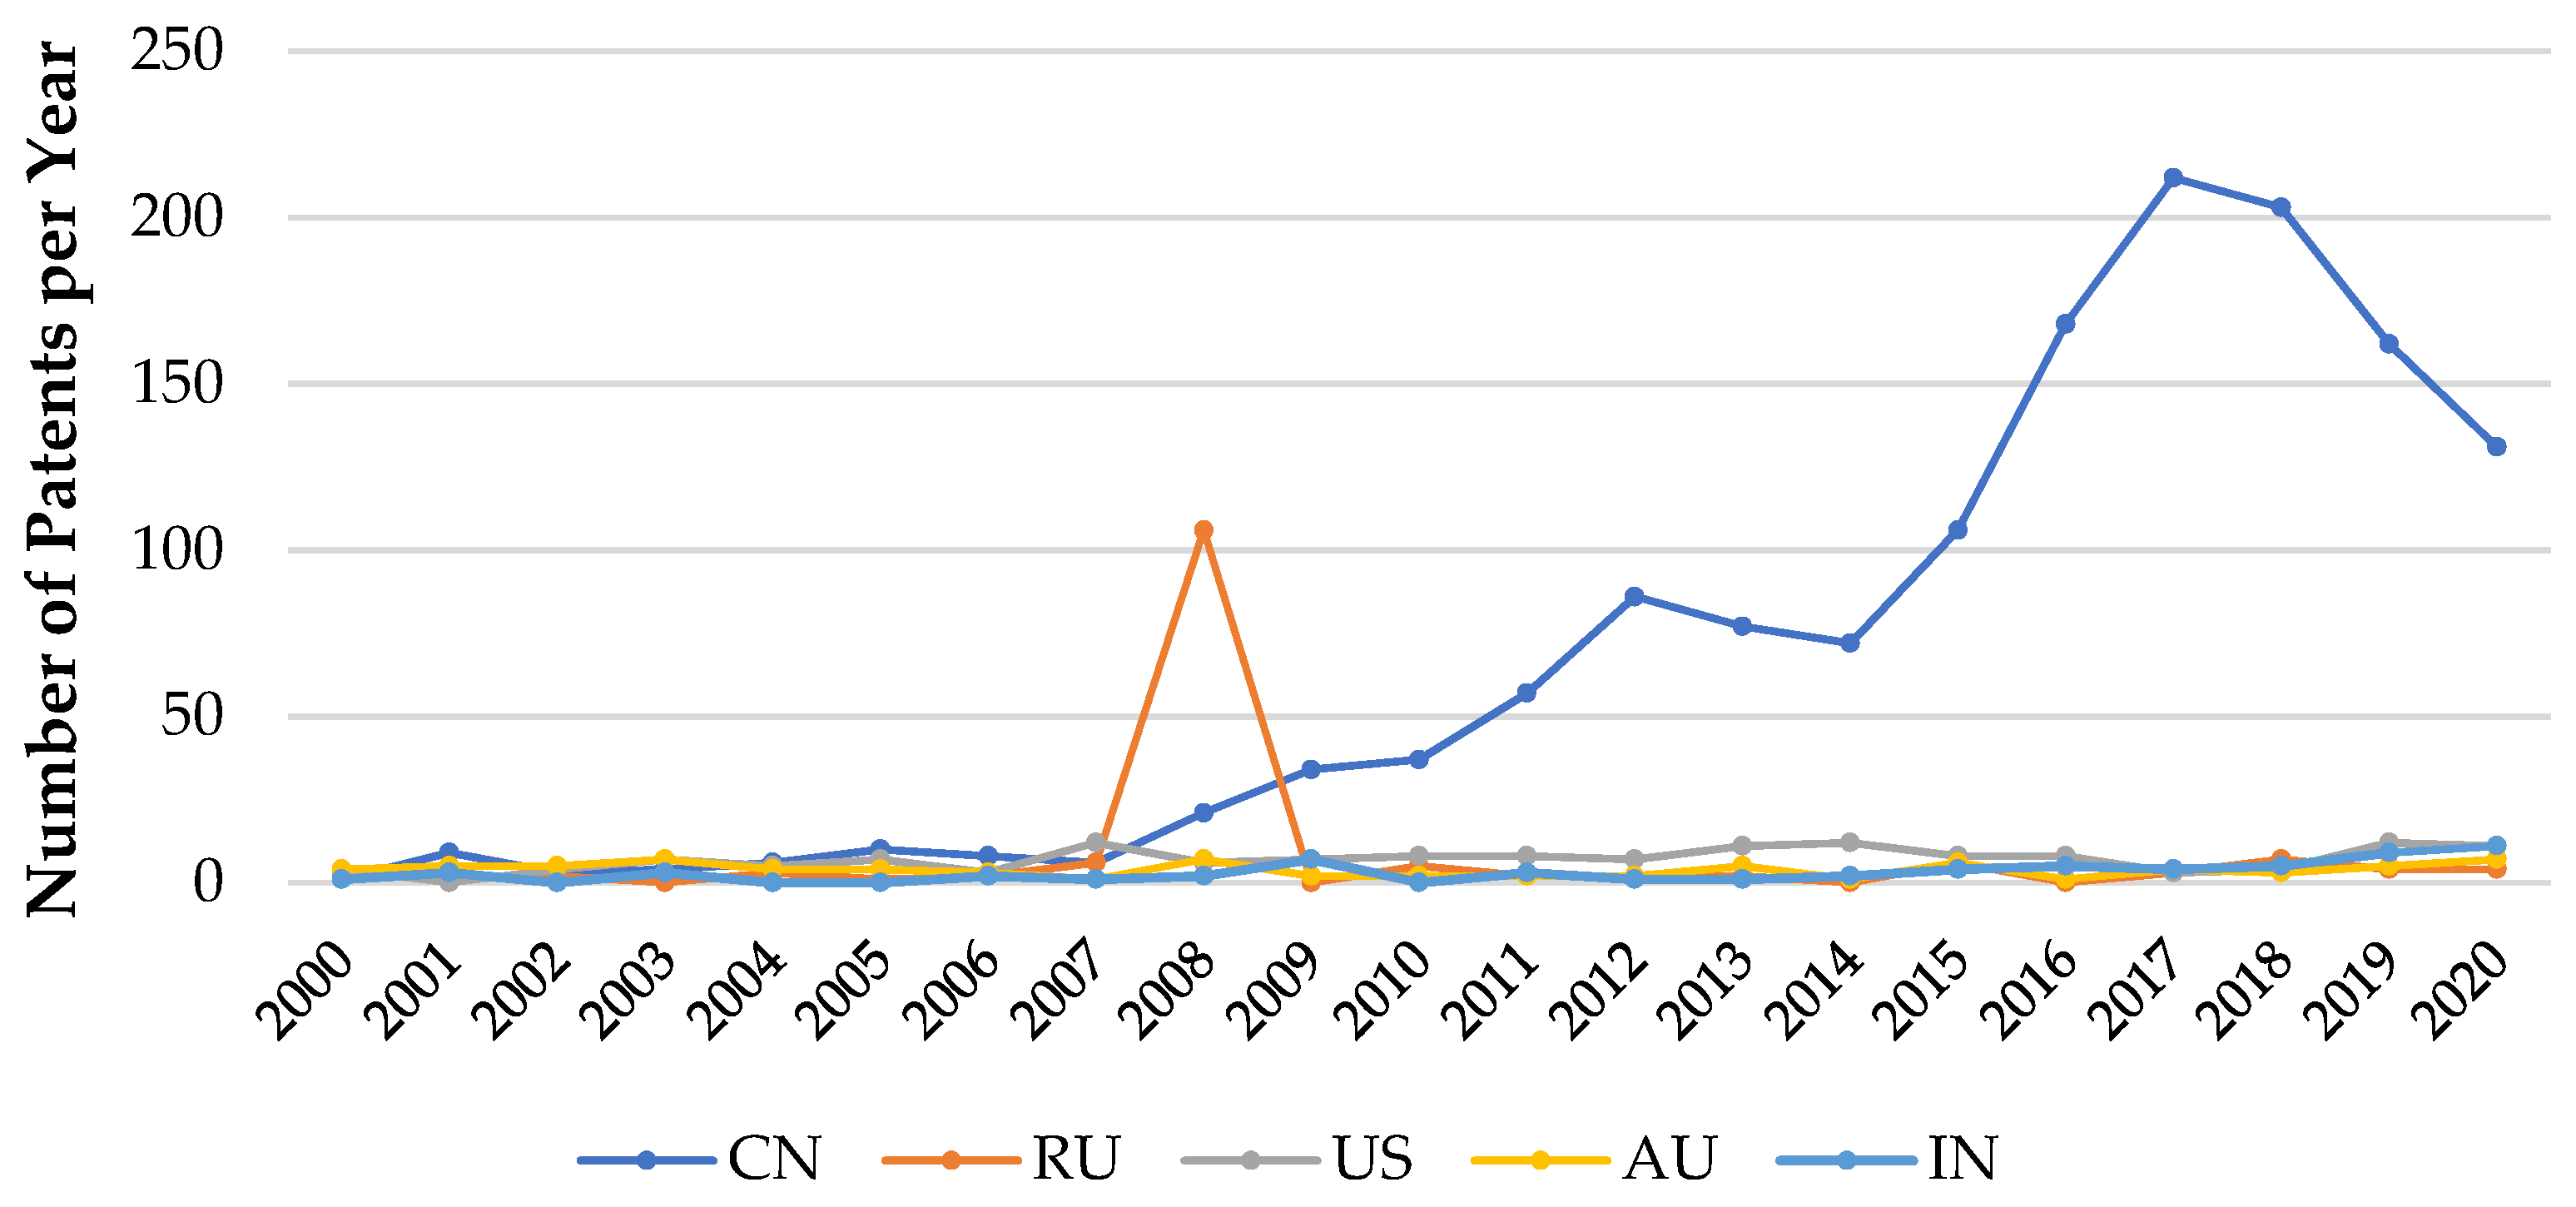
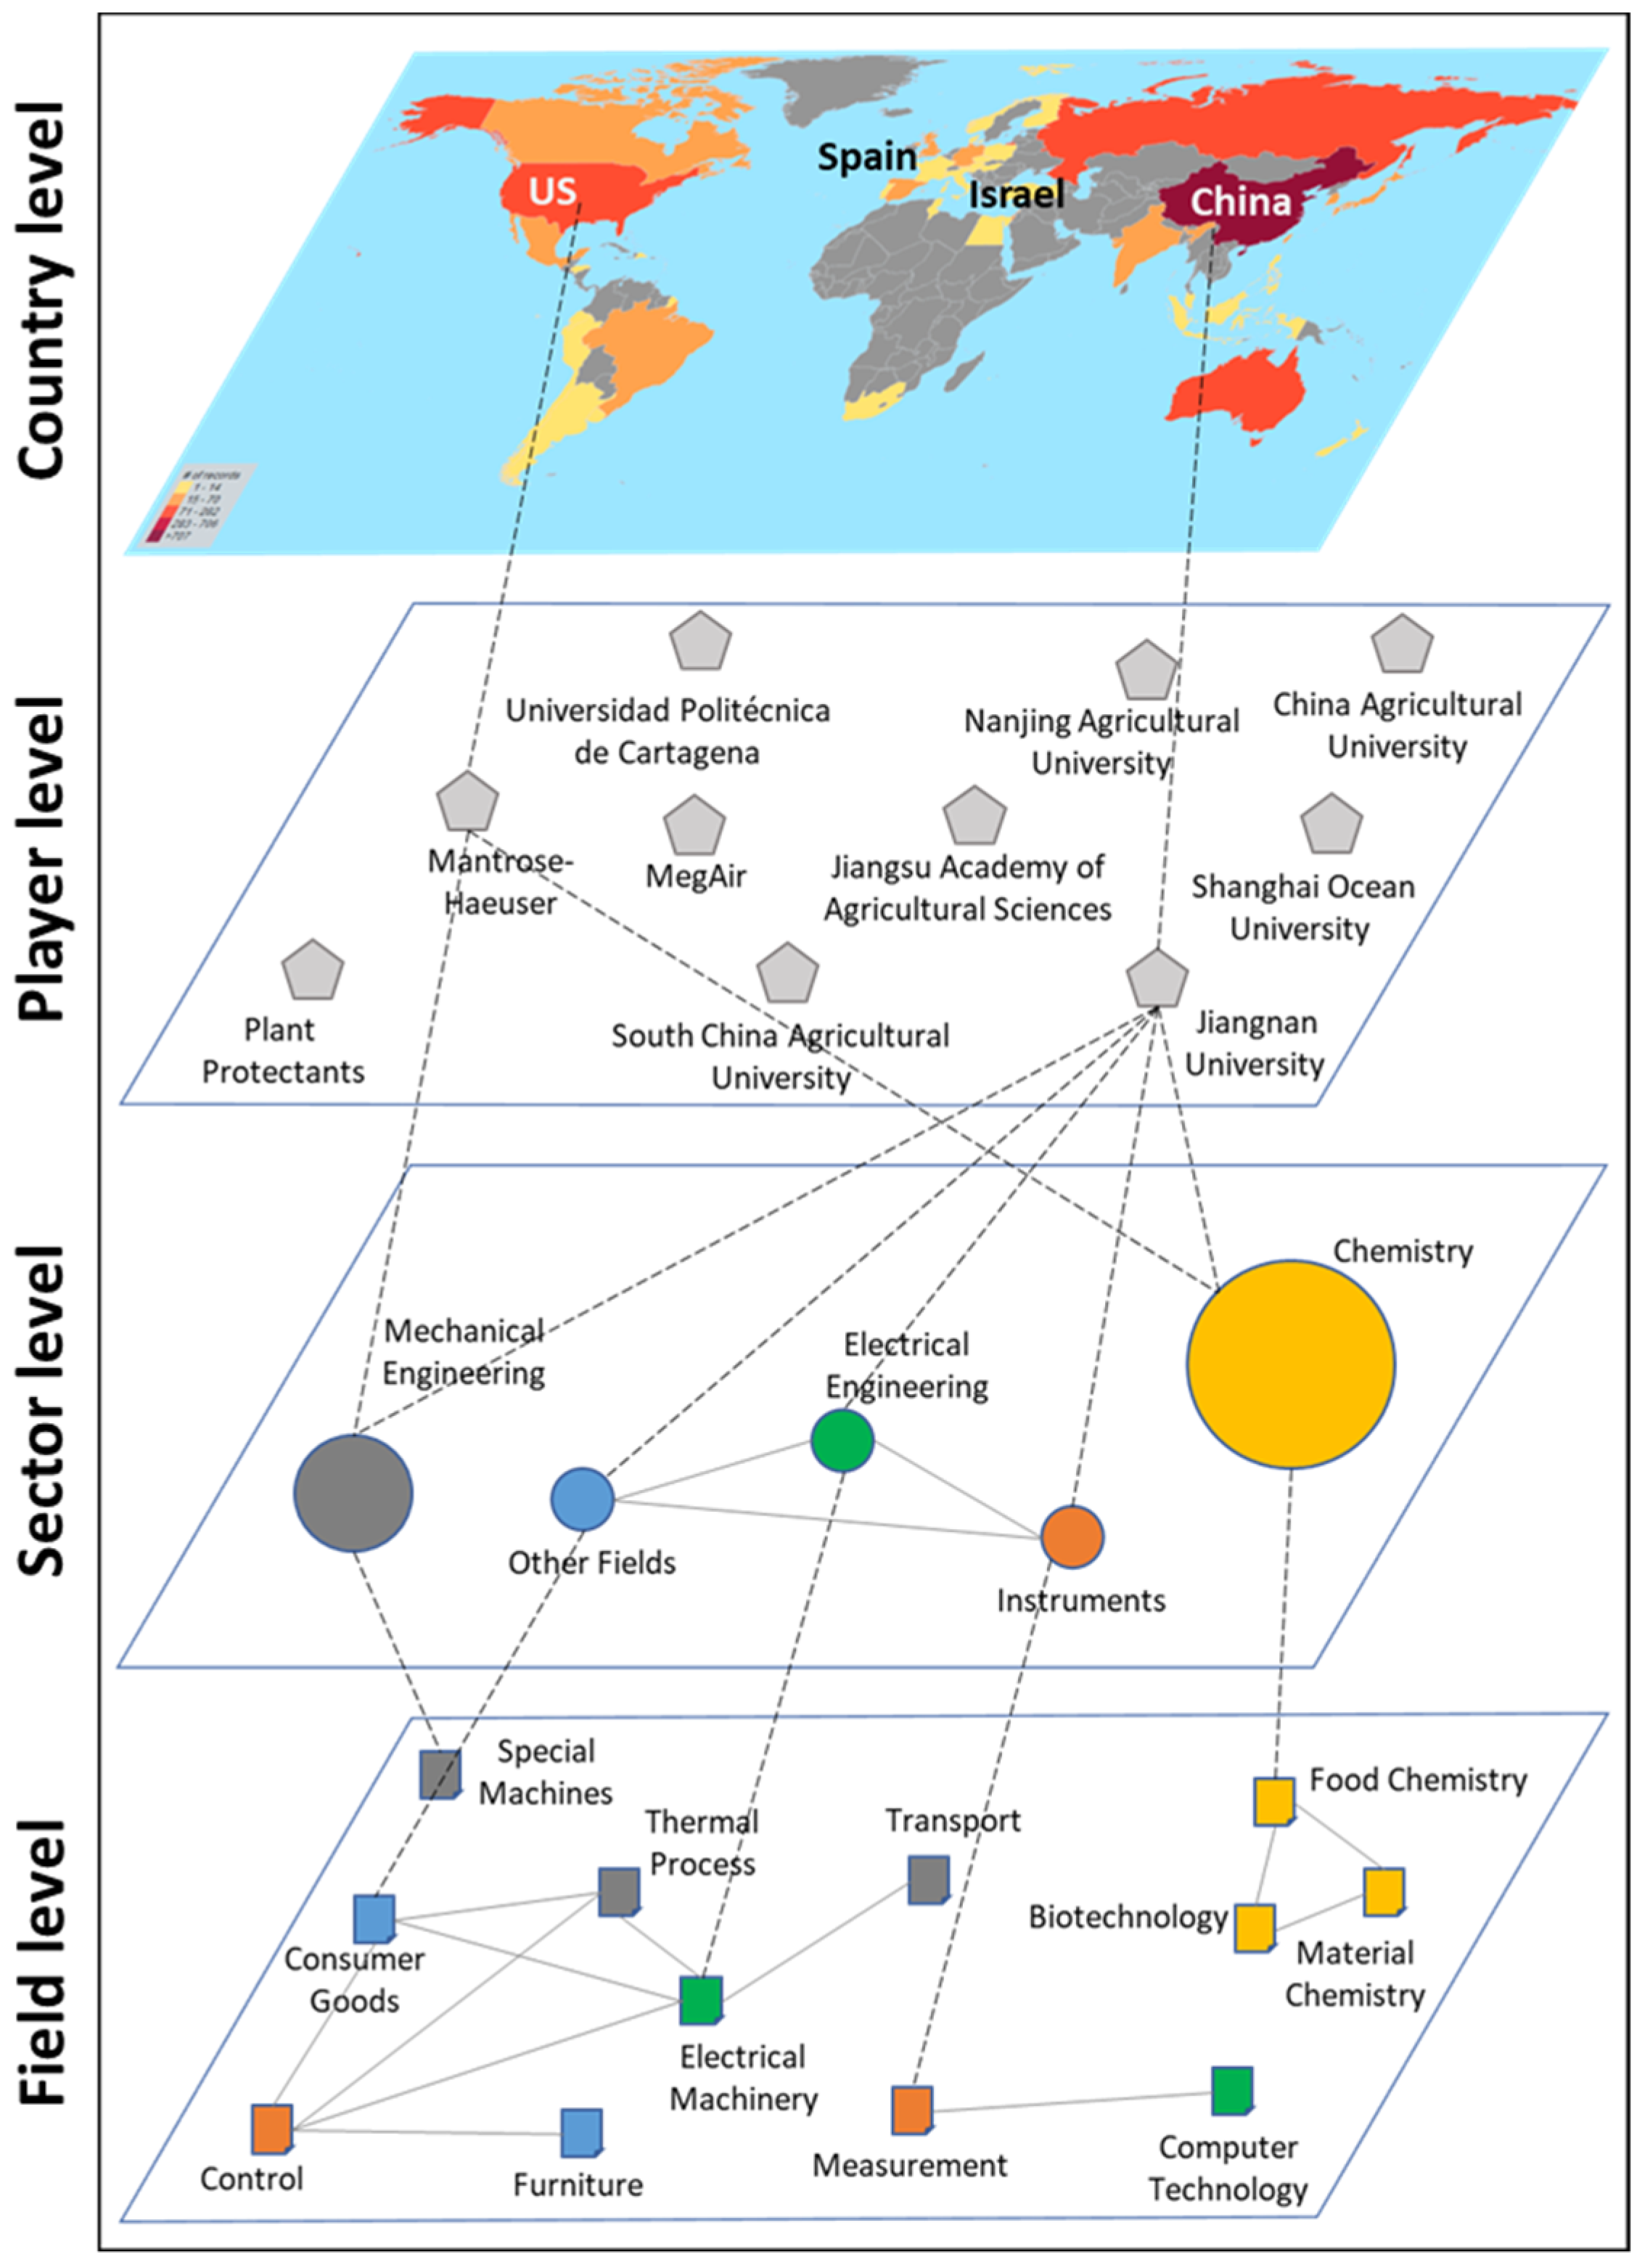
4.3. Country-Level Analysis

4.3.1. Countries’ Productivity

The purpose of this section is to present a general overview of development trends in shelf-life extension technology. Models such as the PESTEL framework, which is an acronym for a series of factors (i.e., political, economic, social, technological, environmental, and legal), reflect the fact that in any particular technological area, the competitive capacities and resources of countries differ. Table 4 shows the evolution trends of the 10 leading countries in terms of the number of published patents. The top countries during the emerging phase, each with more than 30 patents, were China, the United States, and Australia, whereas for the growth phase, the share of the number of patents associated with the United States and Australia declined. Of note, China’s share of patents increased significantly to 62.4%. Additionally, Russia, which was the second-leading country, grew from 18 patents to 141 patents in the later phase, which led to a slight increase in the proportion of Russian patents. In total throughout the years, the ten leading countries held more than 80% of the existing patents. In terms of the total number of patents, China accounts for more than 50% of the global total, and as such is the leader in the field. The results indicate that the greatest number of patents was associated with the Asian region, including China, India, Korea, and Japan. In the EU, Russia alone was noticeable in terms of its patenting activities. Whereas Canada and the United States played a significant role, the main player in South America was Brazil.
Figure 4 illustrates that during the emerging phase, all of the countries contributed patents closely (see Table 4). After 2007, the leading five countries, with the exception of China, grew gradually in terms of the number of patents. However, the rate of patent publication in China grew significantly over the two periods, leading to Chinese supremacy in this technological area. Specifically, China’s dominant position in the growth phase, accounting for 62.4% of the percentage share, was preceded by a share of 14.3% in the emerging phase. One way to account for this result is by referencing China’s recent emergence as a leading exporter in the fruit market. China’s status in this area has produced development chances for Chinese inventors and applicants in technology development. It is also noteworthy that China’s evaluation system strongly values patents [47]. Regarding Russia, it is notable that a peak occurred in terms of the number of patents published in 2008, amounting to over 100. This observation is consistent with Figure 2 wherein a clear peak occurred in 2008. In terms of detailed analysis, the patents published in 2008 were originally filed in 2006. These patents are those where the applicants used a novel method for the storage of different fruits. Most of the patents were filed by Kvasenkov Oleg Ivanovich, a member of the Russian Federation and the Russian Food Institute, who completed the paperwork as an individual, and ranked as one of the leading 100 patent applicants globally in 2016 [48]. In addition to China, the United States is also notable in terms of the number of patent applicants published across the emerging and growth phases.
Regarding R&D collaboration for patent production, our study identified no collaboration for patents across countries. That is to say, the applicants for each patent were always affiliated with a single country rather than multiple countries. Additionally, collaboration was not found at the level of continents, indicating that countries have nationally-bounded technology development that does not leverage the advantages of geological distance. Whenever companies, researchers, or inventors seek to create or develop products or services that are categorized into different technology sectors, it is necessary for them to explore whether competitors or other assignees are patent holders; this safeguards against conflicts in terms of intellectual property. The number of patents can be viewed as a proxy for the level of technological development in a given area in each country.
Figure 5 provides an overview of the leading countries in the respective technology sectors based on the number of patents in each cluster. The figure indicates that China is the greatest contributor across every sector, reflecting China’s strong influence on technological development. The United States ranked in the top five countries across all sectors with the exception of the instruments sector. Our analysis also revealed that other countries produce technology and patents in diverse technology sectors. As a case in point, in the field of mechanical engineering, which is concerned with machinery manufacturing, Russia was ranked as the second-greatest influence. The competitive advantages that Russia benefits from primarily relate to its advancement in machine-tool and equipment construction [49]. In the case of India, it is noteworthy that India’s rise as a substantial economy in recent decades is significantly reflected in developments in the equipment and instruments sector and electricity sector, which form the core of the Indian electronics industry [50]. India’s growing exports to Canada, Australia, Germany, and the United States are facilitating industry growth in industrial electronics (e.g., process control equipment, analytical instruments, automation instruments, and measuring and test equipment) [50].

4.3.2. Market Opportunities by International Patent Filings

The market refers to the destination of technology development. Patent analysis was applied to illuminate the nature of the target markets. A patent family is commonly defined as a set of patents filed in various countries with the aim of safeguarding a single invention [51]. When an entity aims to protect its invention in several jurisdictions, it is necessary to obtain patents in all corresponding patent offices. Due to this, the initial filing (also known as the priority filing), which is submitted to serve as protection for the invention, is succeeded by a sequence of filings, together constituting a patent family. In view of this, it is possible to pair patent family data in order to investigate international technology markets. In this analysis, the origin and target countries of a patent, as well as organizations, are represented in Table 5 by country or area codes of each applicant’s country information. Along with countries, the World Intellectual Property Organization (WIPO) and the European Patent Office (EPO) are key organizations in which countries can apply for patents, and so statistical analysis is included here for them. As a case in point, the Patent Cooperation Treaty (PCT) system helps applicants in establishing international patent protection [48]. Therefore, Table 5 presents the number of patents in target countries or organizations of this technology-related patents from the main origin countries. In the columns of Table 5, the number of patents applied for by the countries is shown.
Broadly speaking, it is possible to separate patent applicants into two groups: (1) applicants who primarily apply for patents locally, including China, Russia, the United States, India, and so on; and (2) applicants who primarily apply for the patents internationally, including Australia, Canada, Korea, Mexico, Brazil, and Japan. In the first group, China’s assignees applied for almost all of the patents in their home country. Although China made patent applications in the United States, the Pacific Islands, and WIPO, the numbers are significantly lower compared to applications from Canada and Mexico. This might indicate that the future market of China is primarily situated domestically. Notably, this is consistent with the suggestion that China will serve as a leading fruit export country, where the technology must be used domestically for exporting. The possibilities for China internationally appear not to be developed at present, which can be attributed to the domestic priority. Countries such as China, Russia, the United States, and India rank in the top countries for domestic patent applications. It has been noted that these countries typically hold a small number of family patent applications, as well as different patent applications, to protect various novel technologies.
In terms of the second group, it is possible for patent families to reflect patent value. This is because the overseas filing of patents typically leads to greater costs in the case of the applicant (i.e., due to patent office fees, patent attorney bills, and translation costs). The consequence of this is that applicants only seek to protect their inventions in other countries if it is worth it along the dimensions of cost, effort, and time [52]. Based on patent family size, it is reasonable to suggest that Australia, Canada, Korea, Mexico, Brazil, and Japan have relatively highly valued patents, which is potentially closer to commercialization. As a case in point, compared to the number of local patent applications, the total number of international patent applications from Australia and Canada was almost 10 to 14 times greater. This is indirectly reflective of the fact that applicants in this group are strongly internationalized, and they typically apply in multiple countries for patent protection for a single invention. Due to this, Australia and Canada are characterized by intense market competition. At the same time, the interesting target countries are the Pacific Islands (i.e., Australia and New Zealand). China, the United States, and Canada are seeking to submit international patent applications in this region. This stems from the competitive advantages associated with fruit cultivation such as various types of fruits planted in Australia and New Zealand, which results in effective commercialization and the growth of fruit exports [53].
To be specific, applicants who made applications to other countries or organizations primarily center on the United States and WIPO. For the purpose of reducing cost and simplifying the process of submitting other patent applications, almost all applicants made patent filings in WIPO. In the process of making only a single international patent application, it is possible for applicants to protect their novel technologies and inventions in multiple jurisdictions. WIPO is the primary target for international patent applications and, due to this, the patents granted are referred to as PCT patents. When an application for a PCT patent is made, patent rights associated with the PCT patent have validity in every PCT member mentioned [54]. Currently, there are approximately 800 pieces of PCT patents associated with shelf-life extension technology, which indicates that each country is engaging in international competition, which is expected to intensify in the coming years.

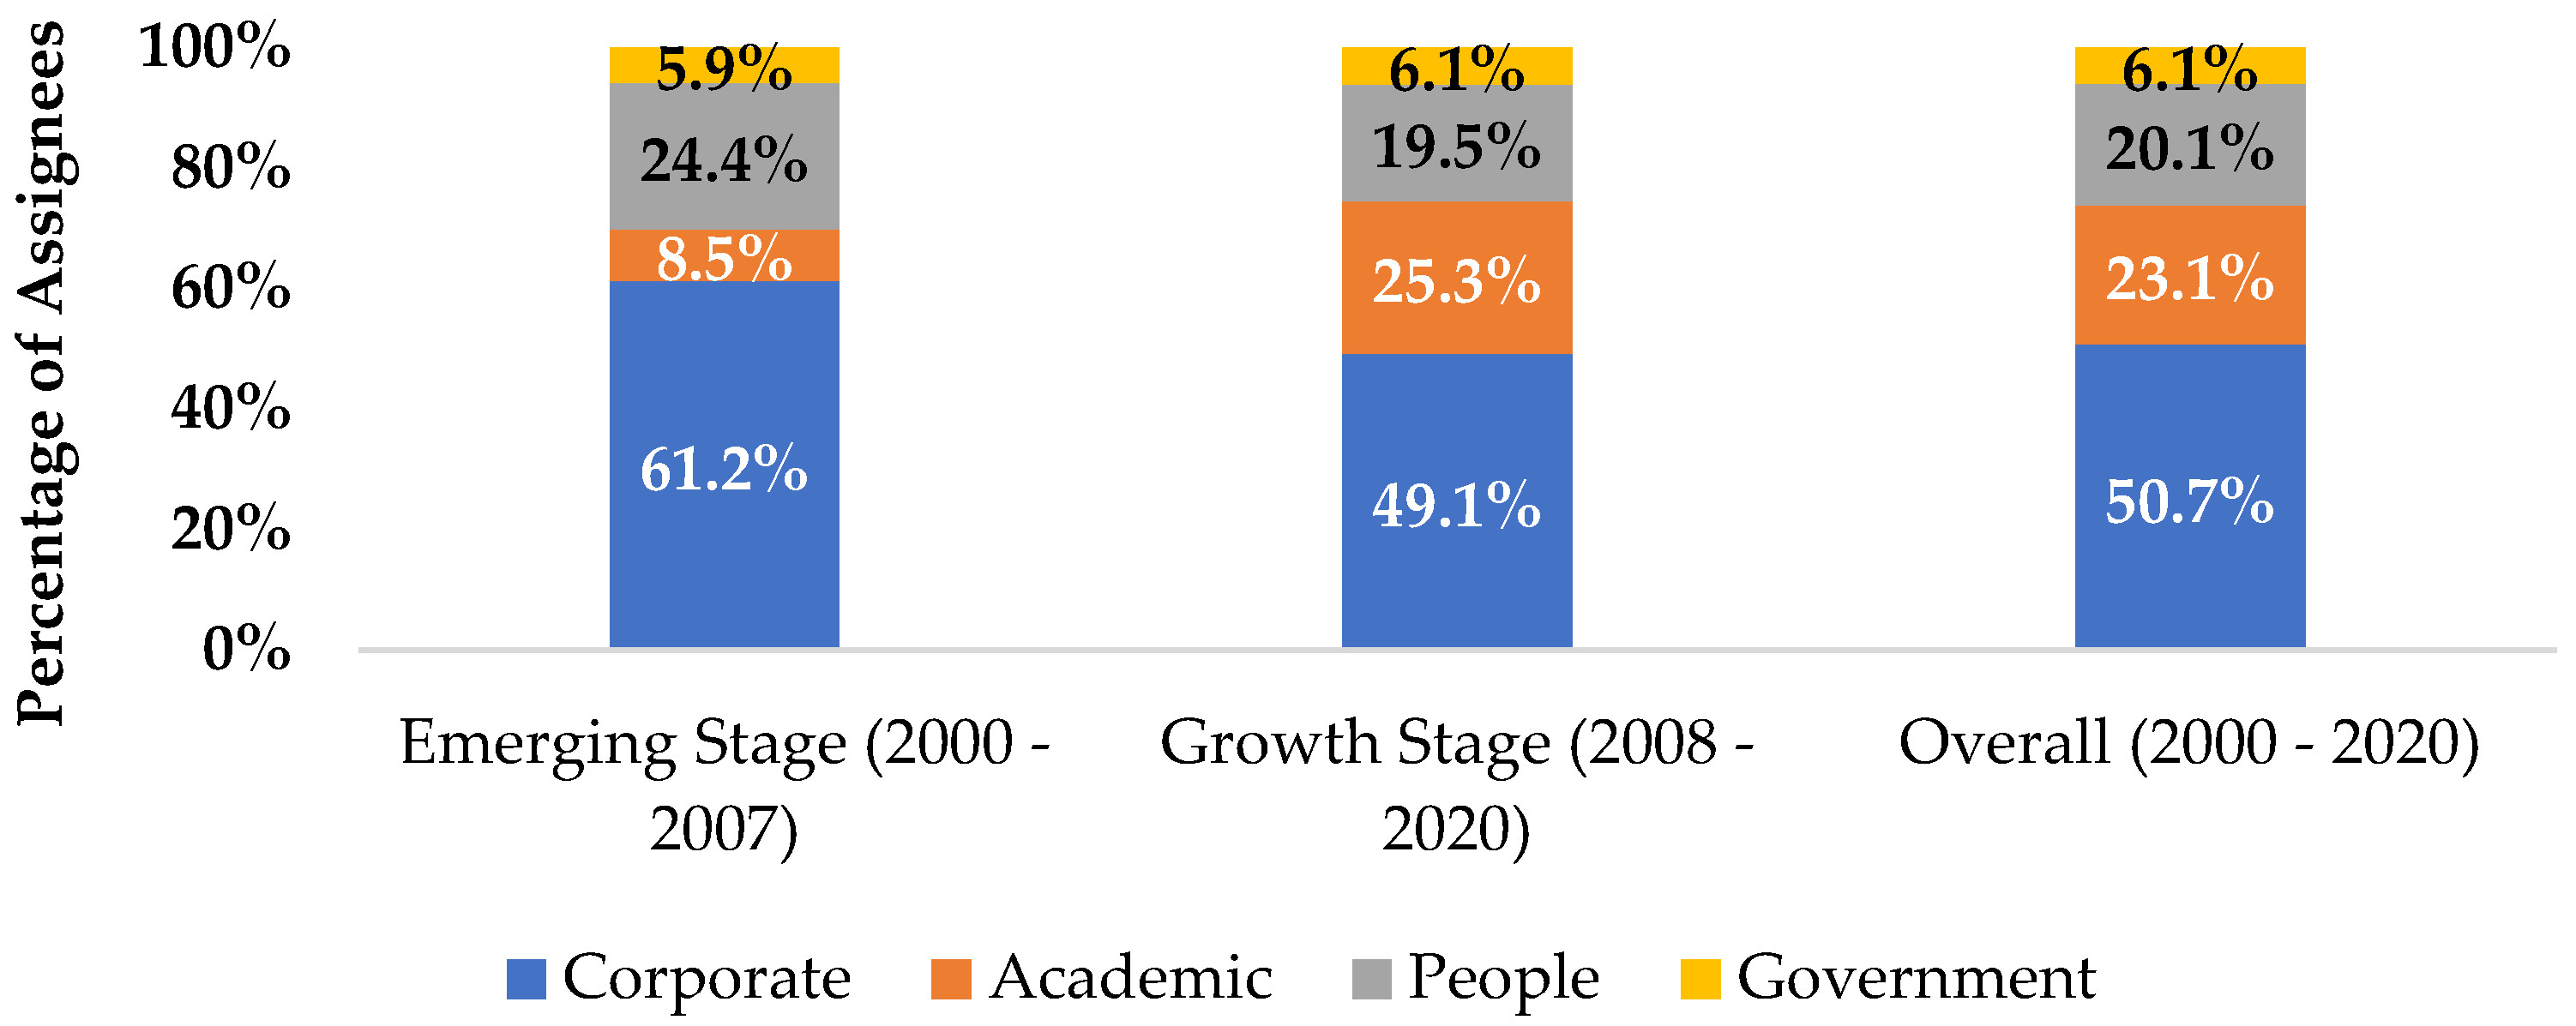
4.4. Assignee-Level Analysis

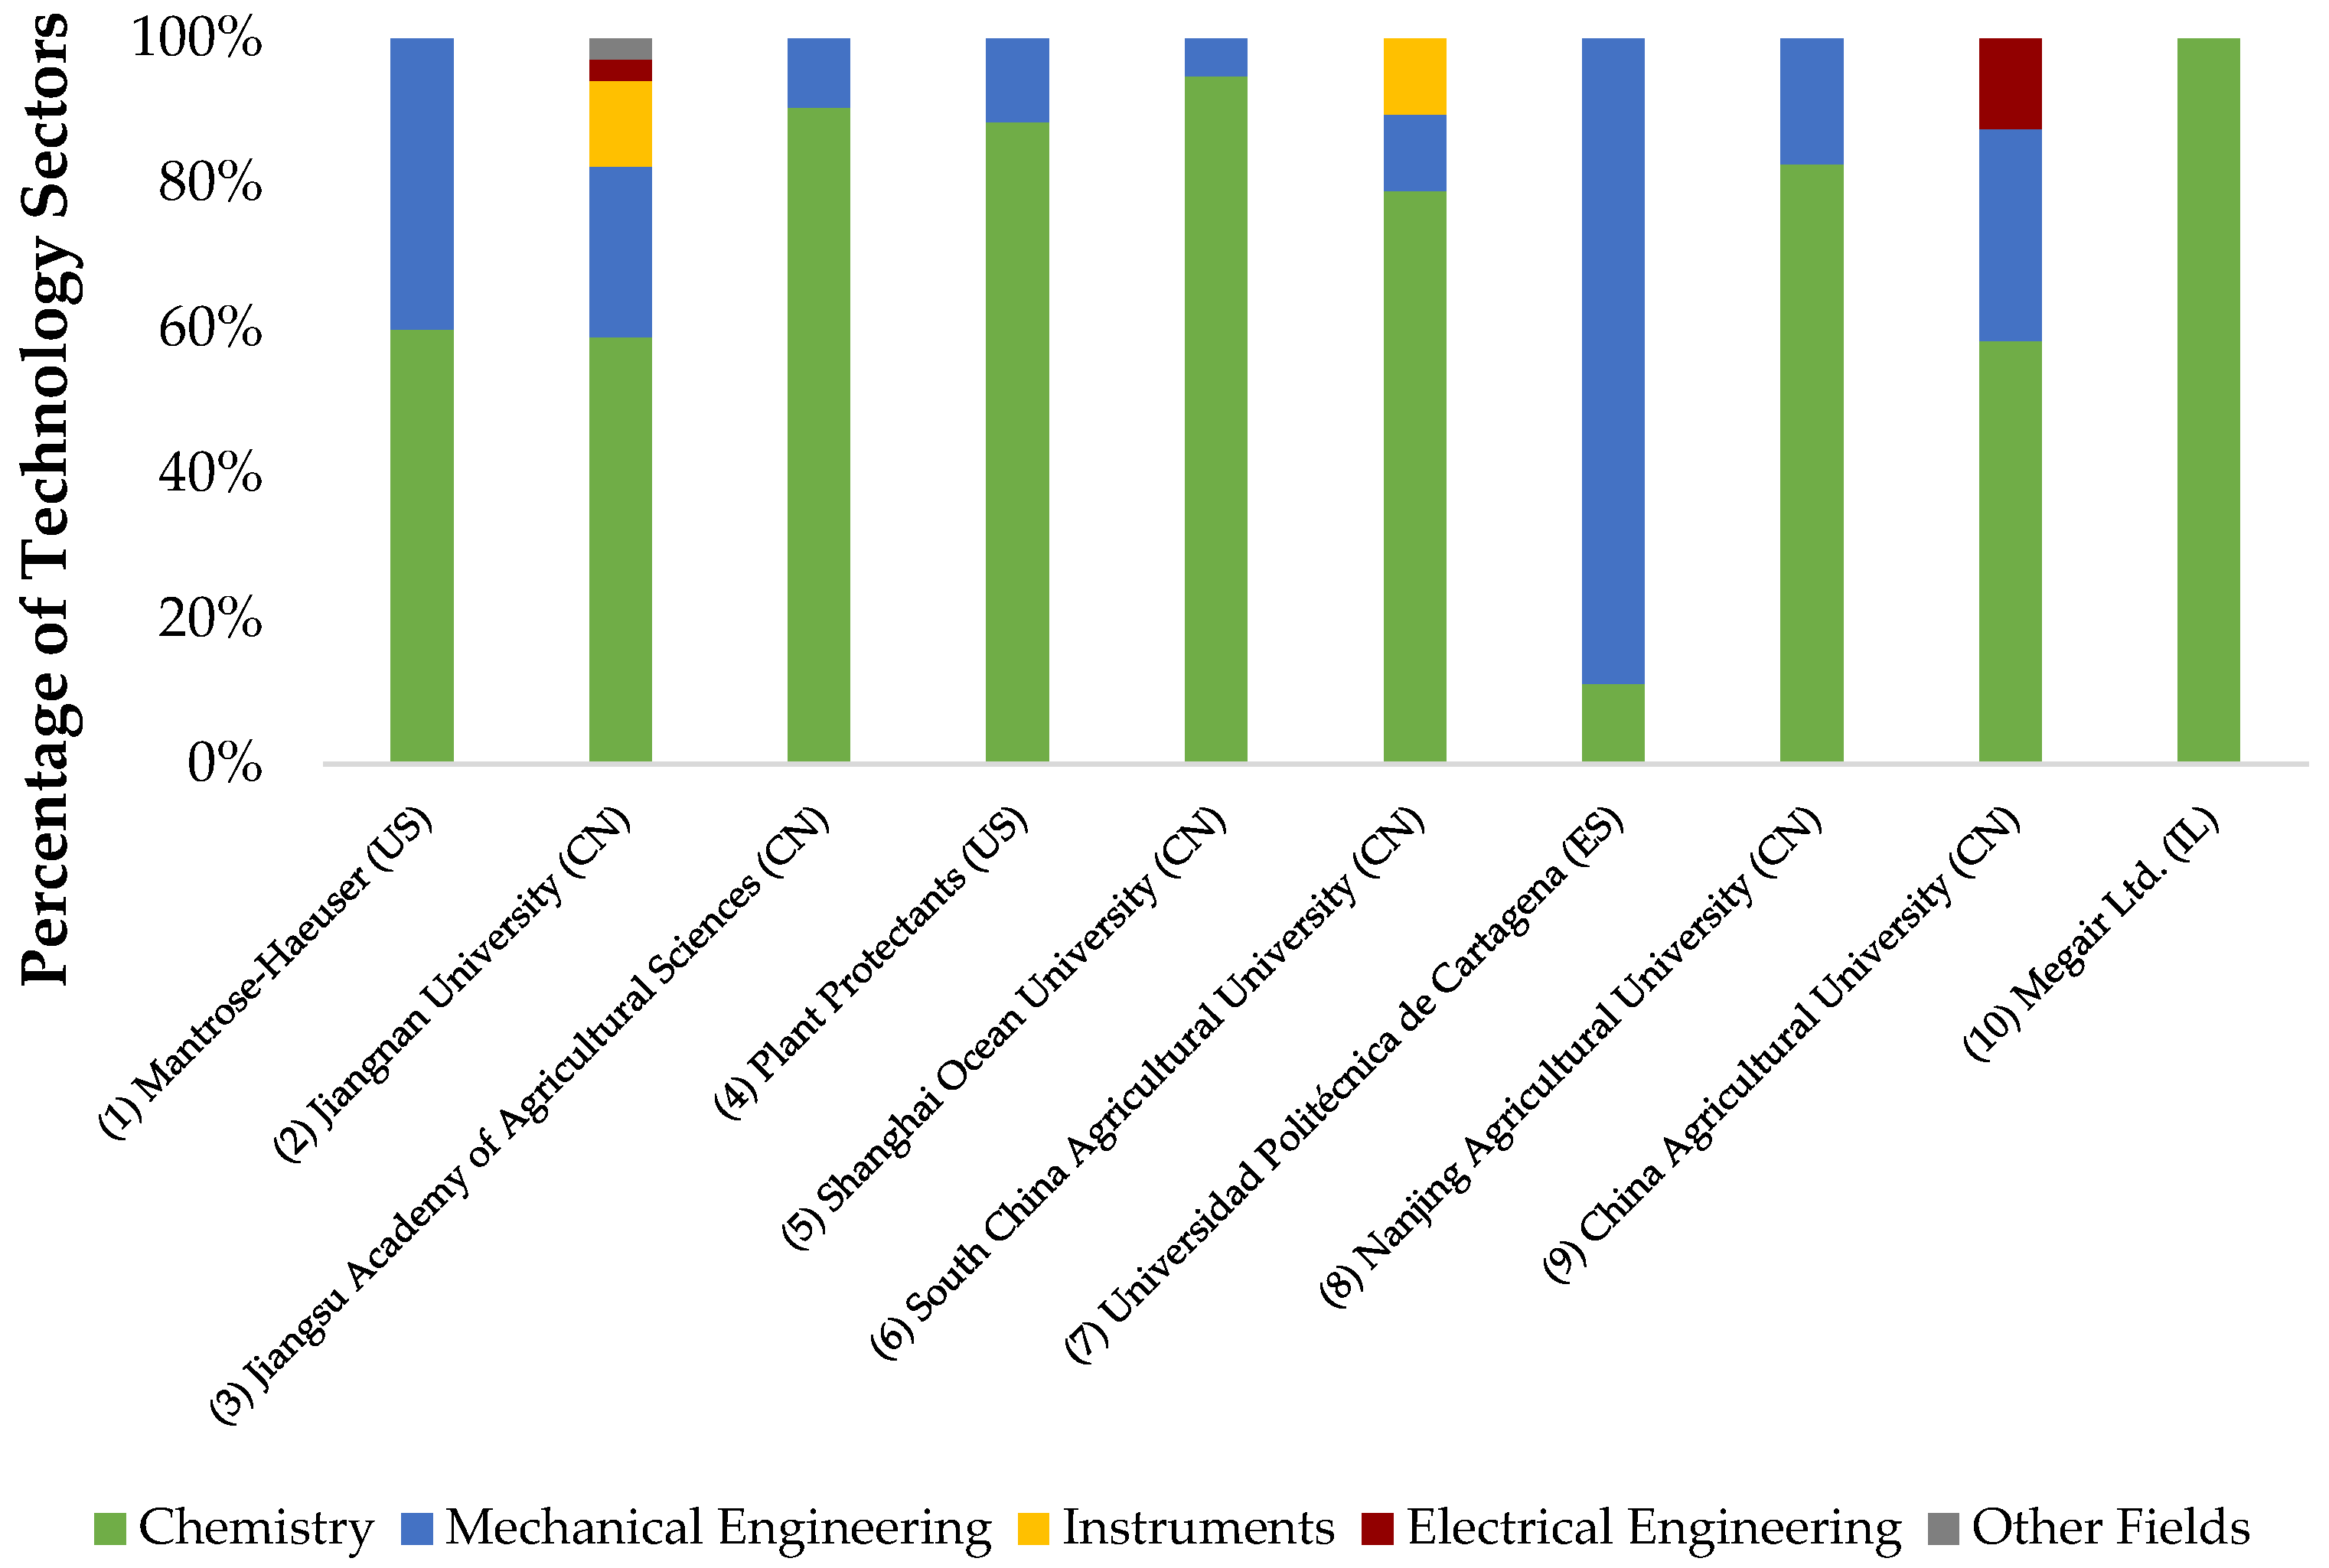
4.4.1. Assignees’ Productivity

The following four types of players were identified as assignees: companies (50.7%), universities (23.1%), individual researchers (where the applicant was the researcher’s name; 20.1%), and governments (including state-owned R&D institutions; 6.1%). Most contributions were submitted by companies engaging in R&D for the commercialization of shelf-life extension technologies for agricultural food. Two main types of products were observed that are involved in business-to-customer (B2C) and business-to-business (B2B), including the food packaging film and chemicals used during the post-harvesting process.
As illustrated in Figure 6, companies constituted the most influential assignee during the emerging phase (61.2%), whereas during the growth phase, academic institutions and universities developed considerably in terms of their patenting activities (increasing their share from 8.5% to 25.3%). Historically, higher education institutions have sought to bypass the costs associated with publishing patents and, instead, have prioritized research and the publication of scholarly literature to derive comparable benefits to those resulting from holding patents. As shown, this indicates that state-of-the-art technology in universities is reaching a higher technology readiness level (TRL) in terms of viable commercial applications [55], thereby increasing the number of patents.
At present, higher education institutions have technology transfer offices (TTOs) to assist the commercialization of research output (e.g., in terms of licensing, spin-offs, and patents) [56]. This accounts for the fact that universities published a greater number of patents during the growth phase compared to the emerging phase. Although universities can own patents, the effective commercial application of any patents held depends on effective strategizing and business model formation. On filing patents, universities may experience difficulties when seeking licenses because the technology may represent only an initial breakthrough in a lengthy process of development [57]. In many cases, higher education institutions will need to wait many years to receive a return on their investment.
In our organization-level focus on assignees, individual researchers or investors were excluded for the purpose of identifying the role played by corporations, universities, and other institutions in the development of shelf-life extension technology. Figure 7 provides an overview of the leading 10 applicants with respect to the number of patents. In this figure, the country code presented after the assignee name is indicative of the country of origin. The figure indicates that assignees 1, 4, and 10 were from corporations, whereas the remainder were from universities. The leading players in this space are Chinese universities seeking out opportunities to commercialize patents (e.g., licensing and spin-offs). Nevertheless, the leading ten applicants included a single US firm (ranked first), a Canadian firm (ranked fourth), and an Israeli firm (ranked tenth). The top-ranked firm, Mantrose-Haeuser, specializes in the development of edible coatings and specialty products for the food, industrial, and agricultural industries.

4.4.2. Market Opportunities by Number of Citations

Table 6 provides an overview of the leading 10 shelf-life extension technology patents in terms of the number of forward citations. Each of these patents was published in the growth phase of the technology life cycle. Of note, eight of the ten patents are held by China, with one belonging to the United States and another to Japan, which reflects China’s competitive advantage in terms of highly-cited patents. A total of four of the patents are held by corporations, whereas six are held by universities and research institutions. Hence, it is reasonable to conclude that universities and research institutions constitute the core driver of technology strength in this area. As the table indicates, the top-ranked assignee in terms of forward citations is concerned with a method for generating fresh-cut fruits and vegetables by leveraging gas and ultra-high pressure technology, which was submitted by China Agricultural University. Additionally, Zhejiang University holds two of the top ten cited patents, which reflects the university’s status as an important industry player.
Patents from Zhejiang University, CN103583675A and CN103583675B, also shown in Table 6, are concerned with prolonging the shelf-life of Chinese bayberry fruits (e.g., waxberry and yumberry) by applying low-temperature environments. Bayberry fruits are crucial economically and rich nutritionally, and they have been harvested in southern China for two millennia [58]. Bayberries, along with processed products that involve bayberries, undergo exportation to numerous countries (e.g., France, Spain, and Singapore), and the volume of exports has increased in recent years [59]. A particularly notable point is that all of the patents were filed in China. However, there are a number of assignees from other countries (e.g., Japan and the United States) that have identified market opportunities and sought to protect them in China. In the case of NatureSeal, this organization has played a critical role in the development of shelf-life extension technology globally. The patent CN106998716A, which is held by NatureSeal, facilitates corrosion-proof and taste-enhancing cutting of fresh products, including agricultural products. For CN107529769A, which is held by Japan’s Maruha Nichiro Corporation, the invention is concerned with extending the shelf-life of strawberries.

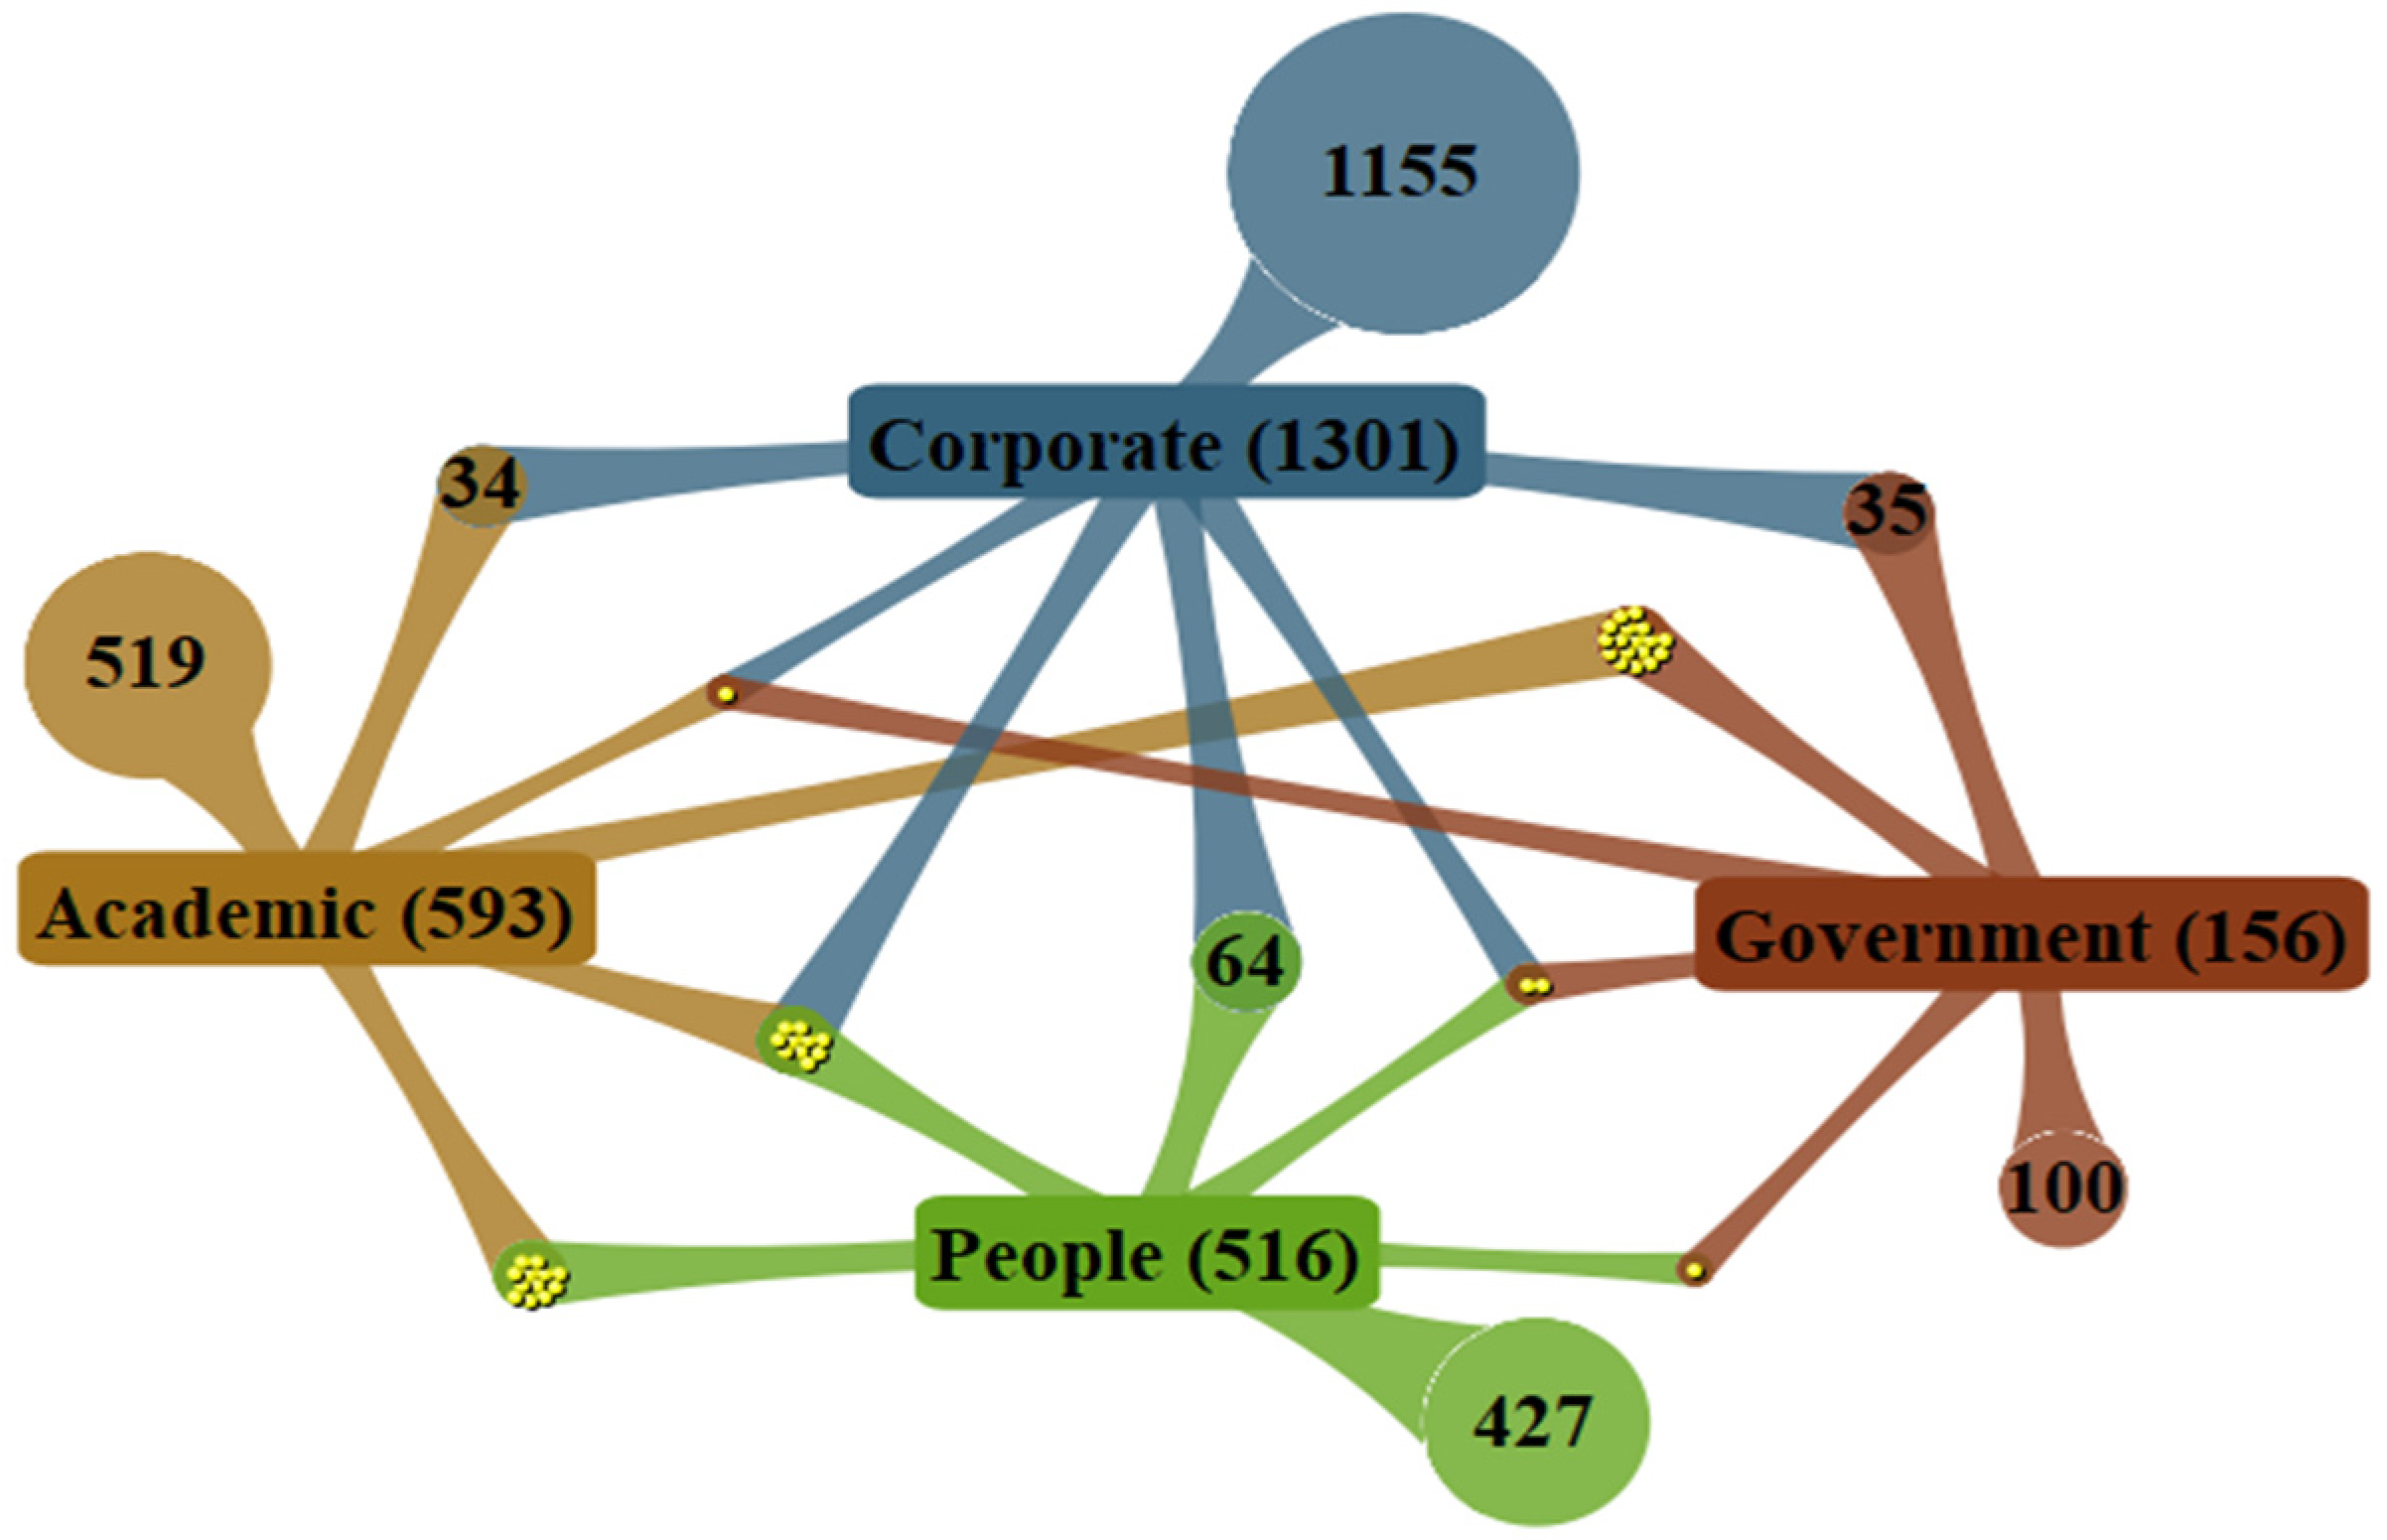
4.4.3. Collaboration Opportunities

The results indicate that most assignees of patents were individual players (i.e., either single corporations or universities). Furthermore, collaborative activities among the main players were limited relative to the total number of patents. This is indicative of the fact that collaborative activities were common within countries but not between countries. The primary individual player was corporations, followed by universities. This is inconsistent with the research collaboration found in the academic literature, where collaboration at diverse levels is observed (e.g., at the level of individuals, organizations, and countries) [36,60]. In this case, patents are inextricably linked to laws and regulations, technology benefits, and commercial opportunities, which is a fact that may lead to conflict among collaborators. We note that the use of different database sources may influence the results.
Although the relationships between entities were limited, some research collaborations among other players were identified (Figure 8). The most robust relationship was observed between corporations and researchers or inventors (64 patents named together as an assignee). This is typically seen because researchers who work within corporations often negotiate to be listed as an assignee when a patent is filed. At the same time, it is common for companies to create employment contracts for inventors stipulating that the inventor’s patent rights will be secured and protected. In the event that a corporate entity decides to be the assignee of the patent before establishing a sizeable portfolio, this may lead to complexities if their industry rivals create a “patent fence” around a technology area (i.e., strategically submitting a sequence of patents to disrupt R&D avenues) [61]. To safeguard against risks of this kind, companies can leverage their employees’ contracts regarding patent rights, thereby filing patents in the employee’s rather than the organization’s name. This helps to avoid revealing the organization name in patents and, notably, a common practice is for companies to do this initially, and only afterward to transfer the assignee name from the name of the inventor to the name of the company. This enables organizations to buy time with which they can develop a sufficiently robust portfolio for patent enforcement [62].
Regarding intra-collaboration within groups (i.e., corporate–corporate collaboration or university–university collaboration), no evidence of intra-collaboration was identified across the leading 20 entities. This reflects the fact that intellectual property such as ownership emerges as one of the issues in the context of negotiation. Even though companies frequently pursue patent applications independently, it is still necessary for them to collaborate with other entities as a consequence of limitations in terms of time, budget, and human resources. The number of collaborations between corporations and universities, as well as between corporations and governments, amounted to approximately 35 patents in each pair. As influenced by the input of experts, private companies can lower R&D costs by recruiting collaborating with other players (e.g., universities) because, for example, this prevents them from having to invest in expensive equipment or facilities.
Evidence was also found that our analysis for collaborative activities indicated three players (i.e., corporations, universities, and governments). In particular, the patent “Coating Agent for Fresh-Cut Fruit and the Manufacturing Method Thereof” emerged from collaborative activities among these three key players in Korea. At this point, the concept of the triple helix innovation model is worth noting, which stipulates that the university-government-industry helix is a source of economic development, knowledge development, and growth in innovation [63]. Of note, the notion of academic entrepreneurialism is linked to the triple helix concept. In 1980, Bayh-Dole Act (or Patent and Trademark Law Amendments Act) changed legislation relating to US intellectual property ownership [64]. In particular, the new legislation made it possible for government-funded researchers to register patents based on their findings and confer licenses onto other parties. As such, this development enabled researchers and universities to register patents. Additionally, after the reduction of state research funding, it was necessary for research institutions to seek funding from corporations [63].

5. Implications

5.1. Technology Development Opportunities

With strong implications for technology opportunities, the outcomes of scientometric analysis indicate connections in available patent data. Technology sectors (i.e., clusters) and technology fields comprise the influential technologies, and opportunities exist to develop novel inventions and technologies. Organizations seek to identify patents to explore the concept and technology, which enables them to create new products and services and, at the same time, to ensure they do not violate intellectual property. Patent management is crucial for organizations that depend on R&D to generate novel technology for their development. Organizations can explore the gap of technologies that have not been renewed, which is referred to as the “freedom to operate” (FTO) or “white space” [65], but technological development may be obstructed by patent holders. Companies can aim for partnerships regarding technology transfer, which could serve as a strategic approach to patent acquisition that is intended to commercialize or eventually protect patents [66]. It is possible to use the core technology to produce new developments in terms of products and services, and this does not lead to intellectual property violations. Additionally, when an organization can identify the white space or freedom to operate, it is also necessary to strive to assume a leading position in the field to maximize the value of the technology opportunity.
In the event that an assignee has more effective patent distribution, particularly in terms of white spaces, then they will benefit from a greater competitive advantage in terms of technical strength and, in this way, become a leader in the field. Regarding universities and research institutions, it is essential for them to increase the robustness of technology transfer and the industry-university-research system. To be specific, it is worthwhile for universities and research institutions to operate technology transfer offices (TTO), the purpose of which is to foster collaborative activities with corporations and industry, as well as to license inventions to industry for technology commercialization [8].

5.2. Collaboration Opportunities

With significant implications for collaborative activities, it is possible for universities, corporations, and governments to use the products of international collaborative networks [67] to gain insight into the overall trajectory of research and the evolution of patents worldwide.
First, it is essential for governments to allocate funding and resources to enable the cooperative innovation of different entity types (in particular, university-industry-government interactions). It is particularly crucial to motivate universities and research institutions to engage actively in collaborative innovation and technology development. As a case in point, mobilizing collaborative efforts between universities and research institutions can increase the strength of their capabilities and advocate individual innovation as a hub for industries to engage for the advisory in advanced technology development, thus leading to the promotion of collaborative innovation in this field. An interactive innovation model (e.g., incubators) has developed technology and business ideas into an array of firms, and to form research centers by combining diverse R&D entities from universities, governments, and industries, thus leading to the creation of a networked entity [68].
Second, it is reasonable to change the proportional structure of different collaborative relationships regarding patents in this field. It is an essential attempt to foster intra-collaboration on patents between universities and universities or, alternatively, between research institutions and research institutions. It is noticeable that universities and research institutions have strong and independent R&D capabilities. For this reason, they can achieve robust cooperative alliances by beginning from intra-group collaboration, which stems from the fact that their goals are aligned. Furthermore, integration and resource allocation in terms of human resources, technology, knowledge, and information can strengthen hub quality.
Third, it is essential to reinforce the frequency and intensity of collaboration by forming strategies in view of government policies, which can lead to win-win situations. As a case in point, the talent mobility (TM) mechanism in policy has emerged as an issue of intense interest for universities, policymakers, and industries. This is because the model has substantial utility for innovation and is critical for researchers, particularly when the knowledge area has applied components in technology, science, and innovation for business commercialization [69].
Fourth, key influencers (e.g., large corporations) can offer support to establish several large-scale associations for collaborative innovation. It is possible to initiate the associations based on government policy support, thus motivating corporations to foster associations to ensure they are at the center of a network in the same or diverse subjects. Owing to the establishment of these associations, authority and power can grow into various regions both domestically and overseas. As a case in point, Qiao, et al. [70] reported that when corporations are members of industry association networks, this strongly influences innovation and, in turn, performance in a positive way.
Finally, it is crucial to incentivize marginal entities to participate in communities for innovation, to establish cooperative relationships that foster technological innovation, to increase the robustness of knowledge and information sharing, and to facilitate long-term improvements in technology innovation for patent collaboration networks in this area.

5.3. Innovation Ecosystem

Figure 9 illustrates a multi-layered network innovation system, grounded on a set of patents, that has the capability to provide an account of the characteristics of the future innovation system [71]. To show the relationship, four layers are included, ranging from the business perspective (e.g., analysis at the country-level) to the technology perspective (e.g., fields of technology). In the case of the first layer (i.e., the layer at the top), this corresponds to the leading countries in the technology. As for the second layer, this shows the leading ten players, thus locating the principal actors in the innovation system. Hence, patent holders that were identified using the proposed approach in this study are shown. The third layer focuses on the level of technology sectors, and it visualizes their relationships on the basis of the similarity of their patents using IPC codes. In this layer, node size reflects the total number of patents associated with the respective sectors, and those with more patents are considered as having a greater level of activity in the creation of novel technologies. The fourth layer focuses on the field of technology, where relationships are established on the basis of technology field co-occurrence analysis. In the event that two fields are found frequently in the patents, these are considered to be interrelated.
In Figure 9, the two leading countries (China and United States) in patents for shelf-life extension technology are shown in the top layer. Examining this multi-layered network assists in knowing about active actors, interesting technological fields, and their association to technology sectors and different players. Based on this information, organizations can identify critical areas for R&D. Additionally, patent information performs a critical function in connecting innovation actors and areas of innovation technology. As a case in point, Mantrose-Haeuser, which was identified as a leading corporation in shelf-life extension technology, focused exclusively on the chemistry and mechanical engineering sectors, which reflects their positioning in the market. These sectors are in the domains of food chemistry and specialized machinery, both of which are associated with substantial future promise.

5.4. Limitations and Recommendations for Scientometric Analysis

Just as it is important to acknowledge the contributions of this research, it is also worthwhile to state several notable limitations. First, given that most areas of technology develop at a rapid pace and the patent landscape concerning any technology will expand and change over time, this analysis is not timeless. Therefore, further research, including patent roadmaps, should be undertaken to identify changes that may influence strategic directions, particularly as shelf-life extension technology transitions from the current growth phase into the maturity phase. The second limitation is that the patents included in this study were retrieved from the TotalPatent One database only. The availability of other sources, including local patent offices, means that more sources could have been considered to analyze and compare results. Despite this, TotalPatent One is one of the most comprehensive databases available, which means that the results obtained in this analysis can be generalized. By comparing with various databases from local patent offices, it may help to gain a deeper understanding of the research activities from each country.

6. Conclusions and Future Research

The purpose of this study was to present a scientometric analysis of patents relating to the field of shelf-life extension technology. The analysis leveraged data mining techniques and focused on both conceptual analysis (technology clustering) and social analysis (productivity, opportunity, and competitive advantage). It also used a multi-level analysis approach encompassing both the country-level and entity-level, where the analysis was informed by the technology life cycle.
The growth in the number of patents published since the year 2000 reflects the fact that technology-related patents have been receiving an increasingly large amount of attention in both the research community and industry. The analysis indicates that in the growth phase of this technology, the time required for the patent examination process has generally been lower compared to the time required in the preceding emerging phase.
The clustering algorithm was used to identify group similarities in the retrieved patent data. The five technology sectors constituted the focus groups, where each group contained varying IPC subclasses, as well as diverse fields. As a result, the following five technology sectors were identified: chemistry, instruments, electrical engineering, mechanical engineering, and other fields. Chemistry was a notable technology sector for its role in the synthesis of novel chemicals that extend shelf-life, with many new developments relying on chemical-based and bio-based technology. The second most notable sector concerning patents for shelf-life extension technology was that of mechanical engineering, which seeks to develop innovative methods and physical techniques.
Regarding the social structure and network, our results indicate that although China is currently the most significant contributor to this technology, collaboration of all kinds on patent applications is not extensively apparent. As such, the patent collaboration network yielded by our analysis is small and not sufficiently dense to maximize collaborative innovation. Based on this study’s analysis of patent collaboration, both corporation–university and corporation–government patent collaborations accounted for a substantial proportion of the identified collaborative relationships, with far fewer instances of other types of collaborative relationships.
Based on these findings, it is reasonable to conclude that in the field of shelf-life extension technology, there are significant differences in the proportions of collaborative relationship types formed by different patent applicants. Further to the results of our analysis, two corporations were identified as having key positions in patent collaboration with their local government and local university, respectively. Thus, the patent collaboration network in this field has these corporations at its core. Nevertheless, marginal entities were identified in the network, including small enterprises, universities, and individual researchers, but a patent collaboration network dominated by several cores has not yet been established.
For future research, workshops for strategy design and implementation can be undertaken with representatives from governments, universities, and industries. Such workshops may assist governments in their policymaking efforts to reinforce national progress in innovation and technology. In addition, a technology roadmap can be formulated to align research directions (i.e., short-, medium-, and long-term plans) with the advancement of this technology. In terms of the scientometric process, it is recommended to analyze the scientific publications relating to this technology, as well as to compare the results with the patents. This can help to illuminate the linkage between scientific development and technology development.

Author Contributions

Conceptualization, V.M. and N.M.; methodology, J.T. and V.M.; software, J.T.; validation, V.M.; formal analysis, J.T.; investigation, V.M.; resources, V.M. and C.G.; writing—original draft preparation, J.T.; writing—review and editing, V.M., C.G. and N.M.; visualization, J.T. and N.M.; supervision, V.M., C.G. and N.M. All authors have read and agreed to the published version of the manuscript.

Funding

This research was supported by Thailand Science Research and Innovation (TSRI) through its Research and Researchers for Industries (RRI) Scholarship Program, grant number PhD62I0011.

Data Availability Statement

The data supporting the results are available upon request from the corresponding author.

Acknowledgments

The following institutions supported this research: Technopreneurship and Innovation Management Program at the Graduate School, Chulalongkorn University, Thailand; and the Thailand Science Research and Innovation (TSRI) through its Research and Researchers for Industries (RRI) Scholarship Program. Search Technology’s VantagePoint is also acknowledged for generating the results.

Conflicts of Interest

The authors declare no conflict of interest. The funders had no role in the design of the study; in the collection, analyses, or interpretation of data; in the writing of the manuscript, or in the decision to publish the results.

Appendix A

Table A1. Major topic distribution of the patents.
No.IPC SubgroupsNumber of Records% ShareMeaning
1A23B 7/1543904.2%Organic compounds; microorganisms; enzymes
2A23B 7/162622.8%Coating with a protective layer; compositions or apparatus therefor
3A23L 19/002352.5%Products from fruits or vegetables; preparation or treatment thereof
4A23B 7/1572292.4%Inorganic compounds
5A23B 7/001992.1%Preservation or chemical ripening of fruit or vegetables
6A23B 7/041982.1%Freezing; subsequent thawing; cooling
7A23B 7/1531641.7%Preserving or ripening with chemicals in the form of liquids or solids
8A23B 7/101441.5%Preserving with acids; acid fermentation
9A23B 7/1481261.3%Preserving or ripening with chemicals in a controlled atmosphere, e.g., partial vacuum
10A01F 25/001001.1%Storing agricultural or horticultural produce; hanging-up harvested fruit
Table A2. Examples of patent titles from the technology sector.
ClusterTechnology SectorExamples of Patent Titles and IPC Subclass Codes
1Chemistry
Application of compound pencolide in preparation of preservative (A23B)
Continuous multi-microencapsulation process for improving the stability and storage life of biologically active ingredients (B01J)
Method and compositions to reduce polygalacturonase expression in plants for increasing storage-life of fruit (C12N)
2Mechanical engineering
Method for preparing of newly-harvested citrus fruits for storage (A01F)
Cold-chain freshness-preservation storage and transportation packaging box for fruit (B65D)
Semiconductor refrigeration temperature control fresh-keeping box powered by solar energy (F25B)
3Instruments
Food biopreservative composition and uses thereof (A61L)
Method and device for nondestructive and rapid prediction of shelf life and freshness of fruits (G01N)
Organic fruit keeps fresh and detoxifies device based on PLC and touch-sensitive screen (G05B)
4Electrical engineering
Ecological fresh-keeping light and ecological freshness retaining equipment (F21K)
A method and a device for predicting the shelf life of harvested fresh grapes (G06K)
Method and apparatus for applying audible sound frequency modulated electrical signal (H04R)
5Other fields
Fruit fresh-keeping setting table (A47F)
Full-automatic solar dehumidifying, air drying and refrigerating system (E04H)
Flavored fresh-keeping refrigerator (F25D)

References

  1. Food and Agriculture Organization of the United Nations. The Future of Food and Agriculture—Trends and Challenges; Food and Agriculture Organization of the United Nations: Rome, Italy, 2017. [Google Scholar]
  2. Food and Agriculture Organization of the United Nations. The State of Food and Agriculture; Food and Agriculture Organization of the United Nations: Rome, Italy, 2020. [Google Scholar]
  3. Food Loss and Food Waste. Available online: http://www.fao.org/food-loss-and-food-waste/en/ (accessed on 25 April 2021).
  4. Parfitt, J.; Barthel, M.; Macnaughton, S. Food waste within food supply chains: Quantification and potential for change to 2050. Philos. Trans. R. Soc. B 2010, 365, 3065–3081. [Google Scholar] [CrossRef] [Green Version]
  5. Ramos, B.; Miller, F.A.; Brandão, T.R.S.; Teixeira, P.; Silva, C.L.M. Fresh fruits and vegetables—An overview on applied methodologies to improve its quality and safety. Innov. Food Sci. Emerg. Technol. 2013, 20, 1–15. [Google Scholar] [CrossRef]
  6. Cooper, A.C.; Schendel, D. Strategic responses to technological threats. Bus. Horiz. 1976, 19, 61–69. [Google Scholar] [CrossRef]
  7. Mortara, L.; Thomson, R.; Moore, C.; Armara, K.; Kerr, C.; Phaal, R.; Probert, D. Developing a technology intelligence strategy at Kodak European Research: Scan & target. Res. Technol. Manag. 2010, 53, 27–38. [Google Scholar] [CrossRef]
  8. Yang, X.; Liu, X.; Song, J. A study on technology competition of graphene biomedical technology based on patent analysis. Appl. Sci. 2019, 9, 2613. [Google Scholar] [CrossRef] [Green Version]
  9. Schneider, N.; Lowe, D.M.; Sayle, R.A.; Tarselli, M.A.; Landrum, G.A. Big data from pharmaceutical patents: A computational analysis of medicinal chemists’ bread and butter. J. Med. Chem. 2016, 59, 4385–4402. [Google Scholar] [CrossRef] [PubMed]
  10. Quintero-Quintero, W.; Blanco-Ariza, A.B.; Garzón-Castrillón, M.A. Intellectual capital: A review and bibliometric analysis. Publications 2021, 9, 46. [Google Scholar] [CrossRef]
  11. Asche, G. “80% of technical information found only in patents”—Is there proof of this? World Pat. Inf. 2017, 48, 16–28. [Google Scholar] [CrossRef]
  12. Ogawa, T.; Kajikawa, Y. Assessing the industrial opportunity of academic research with patent relatedness: A case study on polymer electrolyte fuel cells. Technol. Forecast. Soc. Chang. 2015, 90, 469–475. [Google Scholar] [CrossRef] [Green Version]
  13. Kim, Y.G.; Suh, J.H.; Park, S.C. Visualization of patent analysis for emerging technology. Expert Syst. Appl. 2008, 34, 1804–1812. [Google Scholar] [CrossRef]
  14. Ju, Y.; Sohn, S.Y. Patent-based QFD framework development for identification of emerging technologies and related business models: A case of robot technology in Korea. Technol. Forecast. Soc. Chang. 2015, 94, 44–64. [Google Scholar] [CrossRef]
  15. Chakraborty, M.; Byshkin, M.; Crestani, F. Patent citation network analysis: A perspective from descriptive statistics and ERGMs. PLoS ONE 2020, 15, e0241797. [Google Scholar] [CrossRef]
  16. World Intellectual Property Organization. Guide to the International Patent Classification; World Intellectual Property Organization: Geneva, Switzerland, 2020. [Google Scholar]
  17. Hwang, J.-T.; Kim, B.-K.; Jeong, E.-S. Patent value and survival of patents. J. Open Innov. Technol. Mark. Complex. 2021, 7, 119. [Google Scholar] [CrossRef]
  18. Scherer, F.M.; Harhoff, D. Technology policy for a world of skew-distributed outcomes. Res. Pol. 2000, 29, 559–566. [Google Scholar] [CrossRef]
  19. Chen, Y.-S.; Chang, K.-C. Exploring the nonlinear effects of patent citations, patent share and relative patent position on market value in the US pharmaceutical industry. Technol. Anal. Strateg. Manag. 2010, 22, 153–169. [Google Scholar] [CrossRef]
  20. Rashid, S.; Khattak, A.; Ashiq, M.; Ur Rehman, S.; Rashid Rasool, M. Educational landscape of virtual reality in higher education: Bibliometric evidences of publishing patterns and emerging trends. Publications 2021, 9, 17. [Google Scholar] [CrossRef]
  21. Oliveira, C.Y.B.; Oliveira, C.D.L.; Müller, M.N.; Santos, E.P.; Dantas, D.M.M.; Gálvez, A.O. A scientometric overview of global dinoflagellate research. Publications 2020, 8, 50. [Google Scholar] [CrossRef]
  22. Chae, S.; Gim, J. A study on trend analysis of applicants based on patent classification systems. Information 2019, 10, 364. [Google Scholar] [CrossRef] [Green Version]
  23. Liu, W.; Tao, Y.; Yang, Z.; Bi, K. Exploring and visualizing the patent collaboration network: A case study of smart grid field in China. Sustainability 2019, 11, 465. [Google Scholar] [CrossRef] [Green Version]
  24. Mikhailov, O.V. Introduction from the guest editor of special issue “modern problems of scientometric assessment of publication activity”. Publications 2021, 9, 19. [Google Scholar] [CrossRef]
  25. Tatry, M.-V.; Fournier, D.; Jeannequin, B.; Dosba, F. EU27 and USA leadership in fruit and vegetable research: A bibliometric study from 2000 to 2009. Scientometrics 2014, 98, 2207–2222. [Google Scholar] [CrossRef]
  26. Daim, T.U.; Rueda, G.; Martin, H.; Gerdsri, P. Forecasting emerging technologies: Use of bibliometrics and patent analysis. Technol. Forecast. Soc. Chang. 2006, 73, 981–1012. [Google Scholar] [CrossRef]
  27. Florêncio, M.N.d.S.; Gomes, P.C.d.S.; Abud, A.K.d.S.; Oliveira, A.M.D., Jr. Innovation, research and development on the passion fruit peel flour: Bibliometric approach. Food Sci. Technol. 2020, 40, 130–135. [Google Scholar] [CrossRef] [Green Version]
  28. Ma, L.; Zhang, M.; Bhandari, B.; Gao, Z. Recent developments in novel shelf life extension technologies of fresh-cut fruits and vegetables. Trends Food Sci. Technol. 2017, 64, 23–38. [Google Scholar] [CrossRef] [Green Version]
  29. Yousuf, B.; Deshi, V.; Ozturk, B.; Siddiqui, M.W. Fresh-cut fruits and vegetables: Quality issues and safety concerns. In Fresh-Cut Fruits and Vegetables; Siddiqui, M.W., Ed.; Academic Press: Cambridge, MA, USA, 2020; pp. 1–15. [Google Scholar] [CrossRef]
  30. Castellanos, O.F.; Torres, L.M. Technology intelligence: Methods and capabilities for generation of knowledge and decision making. In Proceedings of the PICMET 2010 Technology Management for Global Economic Growth, Phuket, Thailand, 18–22 July 2010; pp. 1–9. [Google Scholar]
  31. Chen, N.; Liu, Y.; Cheng, Y.; Liu, L.; Yan, Z.; Tao, L.; Guo, X.; Luo, Y.; Yan, A. Technology resource, distribution, and development characteristics of global influenza virus vaccine: A patent bibliometric analysis. PLoS ONE 2015, 10, e0136953. [Google Scholar] [CrossRef]
  32. Porter, A.L.; Youtie, J.; Shapira, P.; Schoeneck, D.J. Refining search terms for nanotechnology. J. Nanopart. Res. 2008, 10, 715–728. [Google Scholar] [CrossRef]
  33. LexisNexis TotalPatent. Available online: http://www.lexisnexis.com/pdf/total-patent-overview.pdf (accessed on 30 November 2021).
  34. Thavorn, J.; Gowanit, C.; Muangsin, V.; Muangsin, N. Foresight through strategic technology intelligence for collaboration and innovation pathways. In Proceedings of the ISPIM Connects Bangkok—Partnering for an Innovative Community, Bangkok, Thailand, 1–4 March 2020; pp. 1–16. [Google Scholar]
  35. Porter, A.L.; Cunningham, S.W. Tech Mining: Exploiting New Technologies for Competitive Advantage; John Wiley & Sons, Inc.: Hoboken, NJ, USA, 2005. [Google Scholar]
  36. Thavorn, J.; Gowanit, C.; Muangsin, V.; Muangsin, N. Collaboration network and trends of global coronavirus disease research: A scientometric analysis. IEEE Access 2021, 9, 45001–45016. [Google Scholar] [CrossRef]
  37. Aria, M.; Cuccurullo, C. bibliometrix: An R-tool for comprehensive science mapping analysis. J. Informetr. 2017, 11, 959–975. [Google Scholar] [CrossRef]
  38. Aria, M.; Misuraca, M.; Spano, M. Mapping the evolution of social research and data science on 30 years of social indicators research. Soc. Indic. Res. 2020, 149, 803–831. [Google Scholar] [CrossRef]
  39. Yuan, C.; Yang, H. Research on K-value selection method of K-means clustering algorithm. J 2019, 2, 16. [Google Scholar] [CrossRef] [Green Version]
  40. Kara, M.E.; Oktay Fırat, S.Ü. Supplier risk assessment based on best-worst method and K-means clustering: A case study. Sustainability 2018, 10, 1066. [Google Scholar] [CrossRef] [Green Version]
  41. Ampornphan, P.; Tongngam, S. Exploring technology influencers from patent data using association rule mining and social network analysis. Information 2020, 11, 333. [Google Scholar] [CrossRef]
  42. Achour, M. A new method to assess the quality degradation of food products during storage. J. Food Eng. 2006, 75, 560–564. [Google Scholar] [CrossRef]
  43. Labuza, T.P.; Schmidl, M.K. Accelerated shelf life testing of foods. Food Technol. 1985, 39, 57–64. [Google Scholar]
  44. Byun, J.; Sung, T.-E.; Park, H.-W. Technological innovation strategy: How do technology life cycles change by technological area. Technol. Anal. Strateg. Manag. 2018, 30, 98–112. [Google Scholar] [CrossRef]
  45. Haupt, R.; Kloyer, M.; Lange, M. Patent indicators for the technology life cycle development. Res. Pol. 2007, 36, 387–398. [Google Scholar] [CrossRef]
  46. Tong, T.W.; Zhang, K.; He, Z.-L.; Zhang, Y. What determines the duration of patent examination in China? An outcome-specific duration analysis of invention patent applications at SIPO. Res. Pol. 2018, 47, 583–591. [Google Scholar] [CrossRef]
  47. Tang, L.; Shapira, P.; Youtie, J. Is there a clubbing effect underlying Chinese research citation increases? J. Assoc. Inf. Sci. Technol. 2015, 66, 1923–1932. [Google Scholar] [CrossRef] [Green Version]
  48. World Intellectual Property Organization. World Intellectual Property Indicators 2016; World Intellectual Property Organization: Geneva, Switzerland, 2016. [Google Scholar]
  49. Hakobyan, S. Overview of Manufacturing Industry in Russia; Deloitte CIS Research Centre: Moscow, Russia, 2017. [Google Scholar]
  50. European Committee for Standardization (CEN). Indian Electrical Equipment Including Consumer Electronics Industry; European Committee for Standardization (CEN): Brussels, Belgium, 2019. [Google Scholar]
  51. Martínez, C. Patent families: When do different definitions really matter? Scientometrics 2011, 86, 39–63. [Google Scholar] [CrossRef]
  52. Ma, T.; Porter, A.L.; Guo, Y.; Ready, J.; Xu, C.; Gao, L. A technology opportunities analysis model: Applied to dye-sensitised solar cells for China. Technol. Anal. Strateg. Manag. 2014, 26, 87–104. [Google Scholar] [CrossRef]
  53. Xia, C.; Nelson, R. Exploring Australia’s Comparative Advantage for Exporting Fresh Produce; Department of Agriculture and Water Resources: Canberra, ACT, Australia, 2018; pp. 176–198. [Google Scholar]
  54. World Intellectual Property Organization. Patent Cooperation Treaty Yearly Review 2020: The International Patent System; World Intellectual Property Organization: Geneva, Switzerland, 2020. [Google Scholar]
  55. Buchner, G.A.; Stepputat, K.J.; Zimmermann, A.W.; Schomäcker, R. Specifying technology readiness levels for the chemical industry. Ind. Eng. Chem. Res. 2019, 58, 6957–6969. [Google Scholar] [CrossRef]
  56. Siegel, D.S.; Veugelers, R.; Wright, M. Technology transfer offices and commercialization of university intellectual property: Performance and policy implications. Oxford Rev. Econ. Pol. 2007, 23, 640–660. [Google Scholar] [CrossRef]
  57. Hayes, A. When Universities Patent Their Research. Available online: https://www.ipwatchdog.com/2017/11/20/universities-patent-research/id=90200/ (accessed on 20 July 2021).
  58. Shi, T.; Sun, J.; Wu, X.; Weng, J.; Wang, P.; Qie, H.; Huang, Y.; Wang, H.; Gao, Z. Transcriptome analysis of Chinese bayberry (Myrica rubra Sieb. et Zucc.) fruit treated with heat and 1-MCP. Plant Physiol. Biochem. 2018, 133, 40–49. [Google Scholar] [CrossRef] [PubMed]
  59. Zhao, H.-Y.; Yang, G.-L.; Liu, Y.-L.; Ye, H.-P.; Qi, X.-J.; Wang, Q. Residual behavior and risk assessment of prochloraz in bayberries and bayberry wine for the Chinese population. Environ. Monit. Assess. 2019, 191, 644. [Google Scholar] [CrossRef] [PubMed]
  60. Chung, E.; Kwon, N.; Lee, J. Understanding scientific collaboration in the research life cycle: Bio- and nanoscientists’ motivations, information-sharing and communication practices, and barriers to collaboration. J. Assoc. Inf. Sci. Technol. 2016, 67, 1836–1848. [Google Scholar] [CrossRef]
  61. Schneider, C. Fences and competition in patent races. Int. J. Ind. Organ. 2008, 26, 1348–1364. [Google Scholar] [CrossRef] [Green Version]
  62. Ziedonis, R.H. Don’t fence me in: Fragmented markets for technology and the patent acquisition strategies of firms. Manag. Sci. 2004, 50, 804–820. [Google Scholar] [CrossRef] [Green Version]
  63. Galvao, A.; Mascarenhas, C.; Marques, C.; Ferreira, J.; Ratten, V. Triple helix and its evolution: A systematic literature review. J. Sci. Technol. Policy Manag. 2019, 10, 812–833. [Google Scholar] [CrossRef]
  64. Holgersson, M.; Aaboen, L. A literature review of intellectual property management in technology transfer offices: From appropriation to utilization. Technol. Soc. 2019, 59, 101132. [Google Scholar] [CrossRef]
  65. Dykeman, D.J.; Abramson, D.T. Patent strategies for life sciences companies to navigate the changing patent landscape. J. Commer. Biotechnol. 2011, 17, 358–364. [Google Scholar] [CrossRef]
  66. Cao, Y.; Zhao, L. Analysis of patent management effects on technological innovation performance. Balt. J. Manag. 2013, 8, 286–305. [Google Scholar] [CrossRef]
  67. Cary, M.; Rockwell, T. International collaboration in open access publications: How income shapes international collaboration. Publications 2020, 8, 13. [Google Scholar] [CrossRef] [Green Version]
  68. Etzkowitz, H. Incubation of incubators: Innovation as a triple helix of university-industry-government networks. Sci. Public Policy 2002, 29, 115–128. [Google Scholar] [CrossRef]
  69. Kongsoontornkijkul, K.; Pichyangkura, R.; Vadhanasindhu, P.; Vanichbuncha, K. Developing A mobile web for innovative university assessment system: Thailand talent mobility programme. Int. J. Interact. Mob. Technol. 2019, 13, 34–50. [Google Scholar] [CrossRef]
  70. Qiao, P.-H.; Ju, X.-F.; Fung, H.-G. Industry association networks, innovations, and firm performance in Chinese small and medium-sized enterprises. China Econ. Rev. 2014, 29, 213–228. [Google Scholar] [CrossRef]
  71. Choi, Y.; Park, S.; Lee, S. Identifying emerging technologies to envision a future innovation ecosystem: A machine learning approach to patent data. Scientometrics 2021, 126, 5431–5476. [Google Scholar] [CrossRef]
Figure 1. The framework of scientometric analysis.
Publications 09 00057 g001
Figure 2. Technology life cycle of shelf-life extension technology with respect to chronological development.
Publications 09 00057 g002
Figure 3. IPC codes derived from patents database.
Publications 09 00057 g003
Figure 4. Patent publications for top five countries from Table 4 (CN = China, RU = Russia, US = The United States, AU = Australia, and IN = India).
Publications 09 00057 g004
Figure 5. Top five countries in terms of numbers of patents categorized into five clusters in which the same color refers to the same country (Note: CN = China, RU = Russia, US = The United States, AU = Australia, IN = India, CA = Canada, DE = Germany, and TW = Taiwan).
Publications 09 00057 g005
Figure 6. Four types of assignees in view of the technology life cycle.
Publications 09 00057 g006
Figure 7. Top ten registered applicants for shelf-life extension technology according to technology sectors (Number one to ten is based on ranking in terms of number of patents). Note: CN = China, US = The United States, ES = Spain, and IL = Israel.
Publications 09 00057 g007
Figure 8. Collaboration mapping of groups of assignees.
Publications 09 00057 g008
Figure 9. A multi-layered network within an innovation ecosystem.
Publications 09 00057 g009
Table 1. Descriptive analysis of patents at different TLC stages.
TLC StageNumber of PatentsMean Value of the Duration (years)Standard DeviationStandard Error Mean
Emerging3283.182.070.11
Growth21882.391.970.04
Table 2. Statistical testing between TLC stages.
Variance AssumptionLevene’s Testt-Test
F-Valuep-Valuetp-Value
Equal variances
assumed
12.436.0006.708.000
Equal variances
not assumed
--6.459.000
Table 3. Five technology sectors based on K-means clustering algorithm.
ClusterTechnology SectorTechnology FieldIPC Subclass Codes
1ChemistryFood chemistryA01H, A21D, A23B, A23C, A23D, A23F, A23G, A23K, A23L, C12C, C12G, C12H, C12J
Basic materials chemistryA01N, A01P, C05B, C05D, C05F, C05G, C09D, C09J, C09K, C10M, C11B, C11D, C99Z
PharmaceuticalsA61K, A61P
Organic fine chemistryA61K, A61Q, C07C, C07D, C07F, C07H
Chemical engineeringB01D, B01J, B07B, B07C, B08B, D06B, F26B
Environmental
technology
B01D, B09B, B09C, C02F
Surface and coatingB05D, B32B
Micro-structural and nanotechnologyB82Y
Materials and
metallurgy
C01B, C01F
BiotechnologyC07G, C07K, C12N, C12P, C12Q, C12R, C12S
Macromolecular chemistry and polymersC08B, C08F, C08G, C08K, C08L
2Mechanical
engineering
Other special
machines
A01C, A01D, A01F, A01G, A01K, A22C, A23N, A23P, B29B, B29C, B29D, C08J
Machine toolsA62D, B23K, B26D
Engines, pumps,
turbines
B31B, B41J, D01D, D01F, D06M, D21B, D21H
TransportB60H, B60P, B60S, B61B, B61K, B62B, B62D
HandlingB65B, B65D
Thermal processes
and apparatus
F24F, F24J, F24S, F25B, F25C, F28D
3InstrumentsMedical technologyA61H, A61J, A61L, G16H
MeasurementG01D, G01K, G01N
Analysis of biological materialsG01N
ControlG05B, G05D, G07F
4Electrical
engineering
Electrical machineryF21K, F21S, F21V, F21Y, H01H, H02J, H05B
Computer technologyG06F, G06K, G06N, G06T
IT methods for
management
G06Q
TelecommunicationsH04H
Digital communicationH04L, H04W
Audio-visual technologyH04N, H04R
5Other fieldsOther consumer goodsA24B, A24C, A24D, A99Z, D06N, D07B, F25D
FurnitureA47B, A47C, A47F, A47G, A47J
Civil engineeringE04H
Table 4. Top ten countries in terms of number of patents *.
No.CountryOverallEmerging StageGrowth Stage
NP% ShareNP% ShareNP% Share
1China141356.2%4714.3%136662.4%
2Russia1596.3%185.5%1416.4%
3US1475.8%4212.8%1054.8%
4Australia803.2%3310.1%472.1%
5India642.5%103.0%542.5%
6Canada532.1%134.0%401.8%
7Korea451.8%103.0%351.6%
8Mexico371.5%72.1%301.4%
9Brazil311.2%51.5%261.2%
10Japan261.0%103.0%160.7%
Note: NP = Number of patents. * The results were obtained and analyzed based on data retrieved from the database.
Table 5. Numbers of patents applied for by country.
Original CountriesTarget Countries, Regions, or Organizations
CNUSWOPCRUINGBAUEPILCATotal
CN1368292725--426311465
RU-56-151---1-1164
US11193533-125361206
AU3466611-1715-6-155
IN-653-4941---68
CA-314646--222310142
KR1141513--2131-50
MX-17228----1-250
BR-202011---113-56
JP11919---122--44
Total1374306261150151512229192215-
Note: CN = China, RU = Russia, US = The United States, AU = Australia, IN = India, CA = Canada, KR = Korea, MX = Mexico, BR = Brazil, JP = Japan, WO = WIPO, PC = Pacific Islands, GB = United Kingdom, EP = EPO, and IL = Israel.
Table 6. Top ten forward citing patents.
No.AssigneeOrigin CountryPatent Number
1China Agricultural UniversityChinaCN105941601A
2Guangxi Shenlong Agriculture and Animal Husbandry Food Group Co., Ltd.ChinaCN105613724A
3Yangzhou UniversityChinaCN107183150A
4Zhejiang UniversityChinaCN103583675A
5Zhejiang UniversityChinaCN103583675B
6Chinese Academy of Agricultural SciencesChinaCN104886233A
7Jiangsu Academy of Agricultural SciencesChinaCN106165720A
8NatureSeal, Inc.USCN106998716A
9Hefei Huiminghan Ecological Agriculture Technology Co., Ltd.ChinaCN107047749A
10Maruha Nichiro CorporationJapanCN107529769A
Publisher’s Note: MDPI stays neutral with regard to jurisdictional claims in published maps and institutional affiliations.

