1. Introduction
A seminal contribution to the measure of scientific impact is the one proposed by Eugene Garfield, who noted that the best way to follow the life cycle of a scientific article is through its citations. He claims that a relevant article for a community is frequently cited, so by tracking its citations, we can measure its impact [
1]. Garfield extended the notion of impact of an article to the impact of a journal, introducing the journal impact factor (IF). Despite their wide use in research evaluation, metrics based on citations have criticisms and limitations. Moed highlighted the importance of the use of more complex measures that consider differences in citation patterns and dynamics between disciplines [
2]. The problem with the use of a unique index that will not consider the specificities of each discipline produces distortions at different levels of research evaluation, both for projects, people, and even institutions [
3].
When evaluating individuals, citation-based indices at the researchers level take an even greater role [
4]. Hirsch [
5] introduced the H-index. An H-index equal to
h indicates that the researcher authored
h papers with at least
h citations. The H-index avoids the evaluation of long lists of uncited articles, determining which of these papers have had an impact on the scientific community. However, since citation patterns between disciplines are different, in some disciplines, the evolution of citations is much slower than in others [
6]. Accordingly, to make a fair comparison, citation-based indices as the H-index [
5] should be observed in very long time windows. These delays in citation patterns discouraged their use in the evaluation of young researchers.
One of the crucial points in the criticism of the scientific impact indicators is if they have predictive capacity [
7]. Robien [
8] showed that several of the most relevant works in Chemistry did not come from journals with the highest impact factor. The same observation was made in entrepreneurship journals [
9]. Finardi [
10] also observed something similar in a study that covered more disciplines. Vanclay [
11] showed that the IF is based on a sample that may represent half the whole-of-life citations to some journals and a small fraction of the citations accruing to other journals. Since citation patterns across disciplines have different dynamics, the IF negatively impacts disciplines with slow dynamics. Other factors, such as the impact of self-citations, have also shown that some journals show abrupt changes in their IF [
12]. In addition, journals that publish reviews tend to be highly cited. In contrast, journals that publish in very specific topics often have low citation impacts [
13].
Variants of the IF or H-index have been proposed to overcome their limitations. For example, Braun et al. [
14] proposed weighting the effect of citations on the H-index computation, incorporating the journal’s IF, giving high weight to citations that come from journals with a more significant impact. Balaban [
15] proposed the opposite, giving high weight to citations that come from low IF journals since there would be more exceptional merit in receiving citations. Bergstrom [
16] introduced the eigenfactor score, which homologates the concept of prestige with the stationary probability of a random walk in a citation graph. An extension of the eigenfactor is the Article Influence Score (AIS), which calculates the average impact of articles in a given journal, measuring impact in terms of eigenfactors. To infer prestige, agnostically at the scale of a community, González-Pereira et al. [
17] introduced the Scimago Journal Research indicator (SJR), which ranks journals based on citation weighting schemes and eigenfactor centrality. Moed [
18] introduced SNIP (Source Normalized Impact per Paper), which is a ratio of a journal’s citation impact and the citation potential in its subject field. Liu and Fang [
19] detected the differences between citation-based indicators, comparing IF with 2-year windows (IF2) with IF over five years (IF5). The research shows that IF2 has much more significant changes in terms of quartiles than IF5. IF5 was also found to have a strong correlation with AIS, having a better predictive ability of paper influence than IF2.
Whatever the metric used to evaluate, it is essential to get citations [
20]. The need to have a recognized track record is a crucial element to access competitive funds and promote scholars [
21]. The scientific environment is becoming increasingly competitive. In this context, delays in a publication, measured as the time elapsed between reviews, acceptance, and definitive publication, affect research evaluation [
22].
We introduce a citation-based study that elucidates differences between areas, types of publications, and researchers’ age groups. This article expands the scope of previous studies, measuring the cross effect of citations patterns between areas and types of publications. In addition, we study differences in citation patters in terms of age groups of researchers. By extending the domain of analysis, we will find new citation patterns that have not been clearly evidenced in the related work. Our primary focus is to study the evolution of citation patterns in a wide observation window on a massive amount of citations recorded in different areas. We pay attention to differences between areas and publication types, focusing on finding evidence about the importance of journals and conference proceedings between classical areas of knowledge and newer areas, such as Computer Science. As we will show in
Section 2, related work shows the existence of these differences but in collections that compare few areas with each other or in studies with smaller observation windows. Our study covers a wide range of knowledge areas, analyzing the evolution of citation patterns with data spanning almost five decades. We also pay attention to differences across age groups of researchers, which is less explored in related work. To achieve this goal, we conducted a data collection process in Scopus, including different types of publications by researchers from a broad spectrum of areas. The study will elucidate the existence of differences in citation patterns between areas, conditioned by the type of media considered for publication. We will show that these patterns have clear differences according to the age of the researchers. The conclusions of the study will indicate the need for indicators that consider different media of publication incorporating the age factor when evaluating the scientific outputs of a researcher.
The contributions of this article are:
- –
We study differences in citation patterns considering a large volume of data that covers different areas, types of publications and age group of researchers.
- –
We detect differences in citation patterns conditioned on areas and types of publications.
- –
We detect differences in citation patterns between areas conditioned on age groups of researchers.
The article is organized as follows. Related work is discussed in
Section 2. In
Section 3, we present the materials and methods used in this study.
Section 4 presents differences in citations patterns between areas and types of publications. In
Section 5, we study differences in citation patters across areas and age groups of researchers. In
Section 6, we discuss results, implications and limitations of this study. Finally,
Section 7 highlights findings and future work.
2. Related Work
Lariviere et al. [
23] evaluated the concentration of papers and funding resources at the researchers’ level, showing the existence of differences between areas. The study highlights a higher concentration of research funds, publications, and citations in Social Sciences and Humanities than in other fields. Nederhof et al. [
24] detected that the publications in Space-Life Physical Sciences are cited initially much lower than similar ones of ground-based research, showing that the use of short-citation window (1–4 years) is detrimental in impact assessment. The study states that bibliometric indicators should be calibrated to provide optimal monitoring of the impact. Prins et al. [
25] detected that some areas had a greater diversity of media in which they produced scientific outputs. In these areas, the use of Google Scholar could be beneficial to improve the coverage of publications, offering advantages over databases such as WoS, which offer a lower diversity of publication media.
Studies of differences in citation patterns according to type of publication have strongly focused on measuring the impact of conferences in Computer Science. Freyne et al. [
26] shows that Computer Science emphasis on publishing in conference proceedings hurt research evaluation when this evaluation is based on WoS indices. Vrettas and Sanderson [
27] corroborates that Computer Scientists value conferences as a publication venue more than any other area. The analysis also shows that only a few conferences attract many citations, while the mean rate per paper is higher in articles than in conferences. Glänzel et al. [
28] shows that conference proceedings are a valuable source of information for research evaluation in Computer Science. Furthermore, the study shows interesting international collaboration patterns triggered by these types of events not observed in other areas. Meho [
29] assesses the quality of Computer Science conferences matching the citescore ranges of the top quantile journals. The study shows that top conferences make up 30% of top-quartile publications. Thelwall [
30] compares Scopus citations with Mendeley reader counts for conference papers and journal articles in eleven computing subfields showing high correlations between both counts. Kochetkov et al. [
31] applies a methodology similar to that of SJR to rank conferences in Computer Science. The study shows that the top conferences have similar SJR values to those reached by the top journals in the area. Li et al. [
32] study the impact of conference rankings in Computer Science using regression analysis. The study determines how these rankings have generated changes in the citation patterns of Australia and China. The study shows that the researchers align themselves with the rankings used in their country, modifying their publication patterns to fit these rankings better. However, Qian et al. [
33] shows that journals and conferences’ relative status varies significantly between different areas of Computer Science. Recently, Yang and Qi [
34] showed that book publications are more relevant than conference publications in most areas. They also show that productivity indicators based on citations fail to capture these types of publications’ relevance.
The skewness of citation distributions between areas has also received much attention from the community. Ruiz-Castillo and Costas [
35] study the skewness of citations per area, comparing 27 different areas. The study shows that skewness is very similar across areas, and only a small part of the authors of each area are responsible for the production in this area. The most prolific authors dominate citation skewness. Radicchi et al. [
36] study how the probability of citing an article
c times varies between areas. However, it shows that by rescaling the distributions by the average number of citations per article, a universal distribution of citations with high skewness emerges. Based on this index, the study introduces a variant of the h index that allows scientists from different areas to be compared. Albarrán et al. [
37] show that citation distributions based on 5-year observation windows are highly skewed. Rescaling these distributions, the level of skewness across areas is quite similar, showing that 10% of the most cited articles concentrate more than 40% of the total citations. By reproducing the study incorporating subfields, Crespo et al. [
38] show that the differences between areas increase. At a finer granularity, more differences are detected between areas in terms of citation distributions. Bensman et al. [
39] study the mean citation rate per article in Mathematics. The study shows that the citation rate is highly skewed. Many of the publications that explain this phenomenon are due to citations captured by Reviews. The study also analyzes the bibliometric structure of the area, detecting a weak central core of journals. The study hypothesizes that these differences with other areas would explain why methods based on citations do not apply to this particular area.
3. Materials and Methods
To build the data repository we used for this study, we accessed information provided by Scopus. Scopus provides access to researcher profiles, in which lists of publications are displayed. To have a significant number of profiles of researchers, we built a profile crawler using the rscopus library
1. This library makes available functionalities that allow using the Scopus API, from which data can be accessed. Our crawler was built on top of rscopus, which invokes the Scopus API to get the data. The crawler uses a set of seed profiles from which it retrieves its collaborators, which in turn are used as seeds by the crawler. Iteratively, the crawler builds a repository of researcher profiles along with its publication lists.
Our crawler stores the profiles in a relational database, on which it asks if a profile is already stored. If it is not stored, it indexes it. It does the same with publications, avoiding duplicates. Scopus marks the areas of knowledge of the publishing media. A method of imputation maintains a system of classification of areas at the researchers’ level. Our crawler downloaded all this data.
Each author’s list includes descriptive fields such as the title, author names, name of the media, doi, publication date, and some descriptive keywords. An author id is stored for each author, provided by Scopus. The identifier of each publication is the Scopus id. A key method used in this study allows us to retrieve the references of each publication. This method establishes the relationship between the Scopus id of the publication and that of each of its references. We use these data records to count citations between the papers of the repository.
We conducted the data collection process from a set of profiles for each of the disciplines considered in the taxonomy of areas maintained by Scopus. This taxonomy considers 27 areas of knowledge. In each of them, we fed the crawler with a list of top cited authors. To determine the seeds of each area, we looked for the most reputable journals by field, according to the impact factor, and in them, we looked for the most cited papers. From these works, we selected the top ten most-cited authors. The crawler ran for about three months collecting profiles from 111,813 researchers. We stored a total of 4,504,779 citable document records in our repository. Our collection spans the years 1970 to 2018. A summary of our collection’s basic statistics is shown in
Appendix A.
Each publication media declares a list of related areas, in which Scopus maps 27 areas of knowledge. Then, Scopus classifies authors in knowledge areas, according to the journals and conferences in which they publish. These areas are attributed to researchers, accounting for the proportion of publications in each field. Accordingly, each investigator is classified in the area in which they record more publications. We discarded for this study areas with too few authors. We picked the areas with at least 3000 authors in our repository. Accordingly, the dataset used for this study comprises data records for ten areas from 95,668 different authors, as it is shown in
Table 1.
Scopus classifies the documents into 15 different types of publications. Four publication types (Conference Review, Report, Abstract Report, and Business Article) have too few documents in our dataset, totaling less than 600 documents. We discarded these publication types from the study. Accordingly, the resulting dataset has 4,102,168 documents classified into 11 types of publications. We show the number of documents per publication type in
Table 2.
Citations are verified relationships of references between citable documents in our collection. This track of citations is a sample of the total citations of Scopus since it corresponds to citations between documents in our repository. Our collection totals more than eight and a half million citations among citable documents. We discarded citations from or to areas not considered in this study to pay attention to the main areas covered in our dataset. In total, we discarded 976,349 citations, focusing the analysis into the 7,534,371 citations recorded between documents of the top-ten most salient areas of our repository.
4. Differences in Citations Patterns across Areas and Publication Types
An essential factor in this study is to conduct an analysis that distinguishes between the type of media in which the publications are made. We consider eleven types of publications, among which articles and conference papers are the ones with the most documents (see
Table 2). Several of the other types of publications are related to journals. Review, letter, editorial, note, short survey, and erratum are types of publications included within journals. We decided to report them separately to distinguish the differences between these specific types of publications and regular articles. Something similar happens with chapter and book, two related types since chapter is a type of publication included within a book. We decided to report these types separately to distinguish the differences between them.
The number of documents according to each type of publication varies between areas.
Table 3 shows that Reviews and Letters are more frequent in Medicine than in other areas, while Chapters and Books are more frequent in Social Sciences. A significant difference is observed in Computer Science, where conference papers are much more frequent than in other areas, totaling more than 60% of the publications in that area.
Table 3 shows significant differences between areas. Articles are a majority in all areas except Computer Science, in which they cover 31% of the sample. On the other hand, conference papers cover 61% of Computer Science production, surpassing the coverage shown in other areas. Conference papers are also relevant in other areas, with 38% in Engineering and 19% in Physics. However, in the other areas its incidence is very low, with around 3% or even less.
Citations according to each type of publication vary between areas.
Table 4 shows that Reviews, Letters, and Editorials receive more citations in Medicine than in other areas, while Chapters and Books are more cited in Social Sciences. This fact is explained because these types of publications are more frequent in these areas than in other areas. Articles receive more citations than the other types of publications, which is valid in all areas, even in Computer Science, where these publications are not the majority.
Articles capture the majority of the citations recorded in our dataset. For example, in Mathematics, articles capture 95% of citations, while in Physics, they capture 92%. Something similar occurs in Biochemistry, and Agricultural and Biological Sciences. Psychology shows a similar pattern, with 89% of citations captured in articles. In Engineering, the incidence of citations in articles is 70%, showing that 25% of citations go to conference papers. This difference is most important in Computer Science. In this area, 51% of citations go to articles and 43% to conference papers.
Table 5 shows citations across areas. The quantities are shown as a fraction of the total amount of citations produced by a given area. For instance, entry 0.12 from Medicine to Biochemistry indicates that 12% of the citations produced by Medicine go to Biochemistry.
Table 5 shows that citations within the same area are a majority. We show a high prevalence of within citations in red and a small preponderance of this pattern in blue. Second majorities, indicated with underlines, are essential to understand which areas are strongly related to others. Medicine and Biochemistry are firmly related, with the volume of citations from Biochemistry to Medicine being higher than the other way. Other strong relationships occur between Psychology and Medicine and between Agricultural and Biological Sciences and Psychology. The most substantial connection is from Social Sciences to Psychology, which delivers 35% of its citations to publications in this area. Curiously, this relationship is not symmetric since only 2% of Psychology citations go to Social Sciences.
Table 6 shows the average number of citations per paper according to the type of publication and area. These results show that the expected number of citations per paper varies across areas, while the largest amount is observed in Physics Reviews, other types of publications show great relevance for other areas. For example, Letters have an expected number of citations per paper close to 4 in Chemistry, followed by Physics, with 3.4. This type of publication has a much lower quantity in other areas. Other types of publications with a high number of citations per document are Books in Chemistry and Engineering. The amounts of publications of this type are very low, as shown in
Table 3. Despite this fact, this type of publication captures a great deal of attention in these areas, reflected in a high average number of citations. The average number of citations per article varies between areas, obtaining its highest value in Physics, with 4.2 average citations, followed by Biochemistry with 3.4. These numbers are very low in Agricultural and Biological Sciences, with only 0.29 citations per paper. In this area, the expected number of citations is higher in reviews. In general, the expected number of citations per paper in Agricultural and Biological Sciences is low, which is explained because many citations go to other areas.
Interestingly, in Computer Science, the expected number of citations in conference papers reaches only 0.72, less than half of what the index for articles shows. This finding suggests that many conference papers receive very few citations, a fact that can be corroborated from the Zipfians that show the distributions of citations per paper, as was illustrated in Brzezinski [
40], Moreira et al. [
41]. In this area, reviews also have a high average number of citations, with 3.32 citations per review. In general, the results show that the attention provided to each type of publication strongly depends on each area. In general, reviews receive more citations than other types of publications, and both conference papers and articles have very different indicators between areas. It is also striking that in Biochemistry, the expected number of citations in conference papers is very high, with 1.65 per paper, which is the highest in the repository. This fact occurs even though there are very few conference papers in Biochemistry (just over 1% of the total number of Biochemistry papers, see
Table 3), which indicates that although conference papers’ production is small, these papers attract much attention from the community.
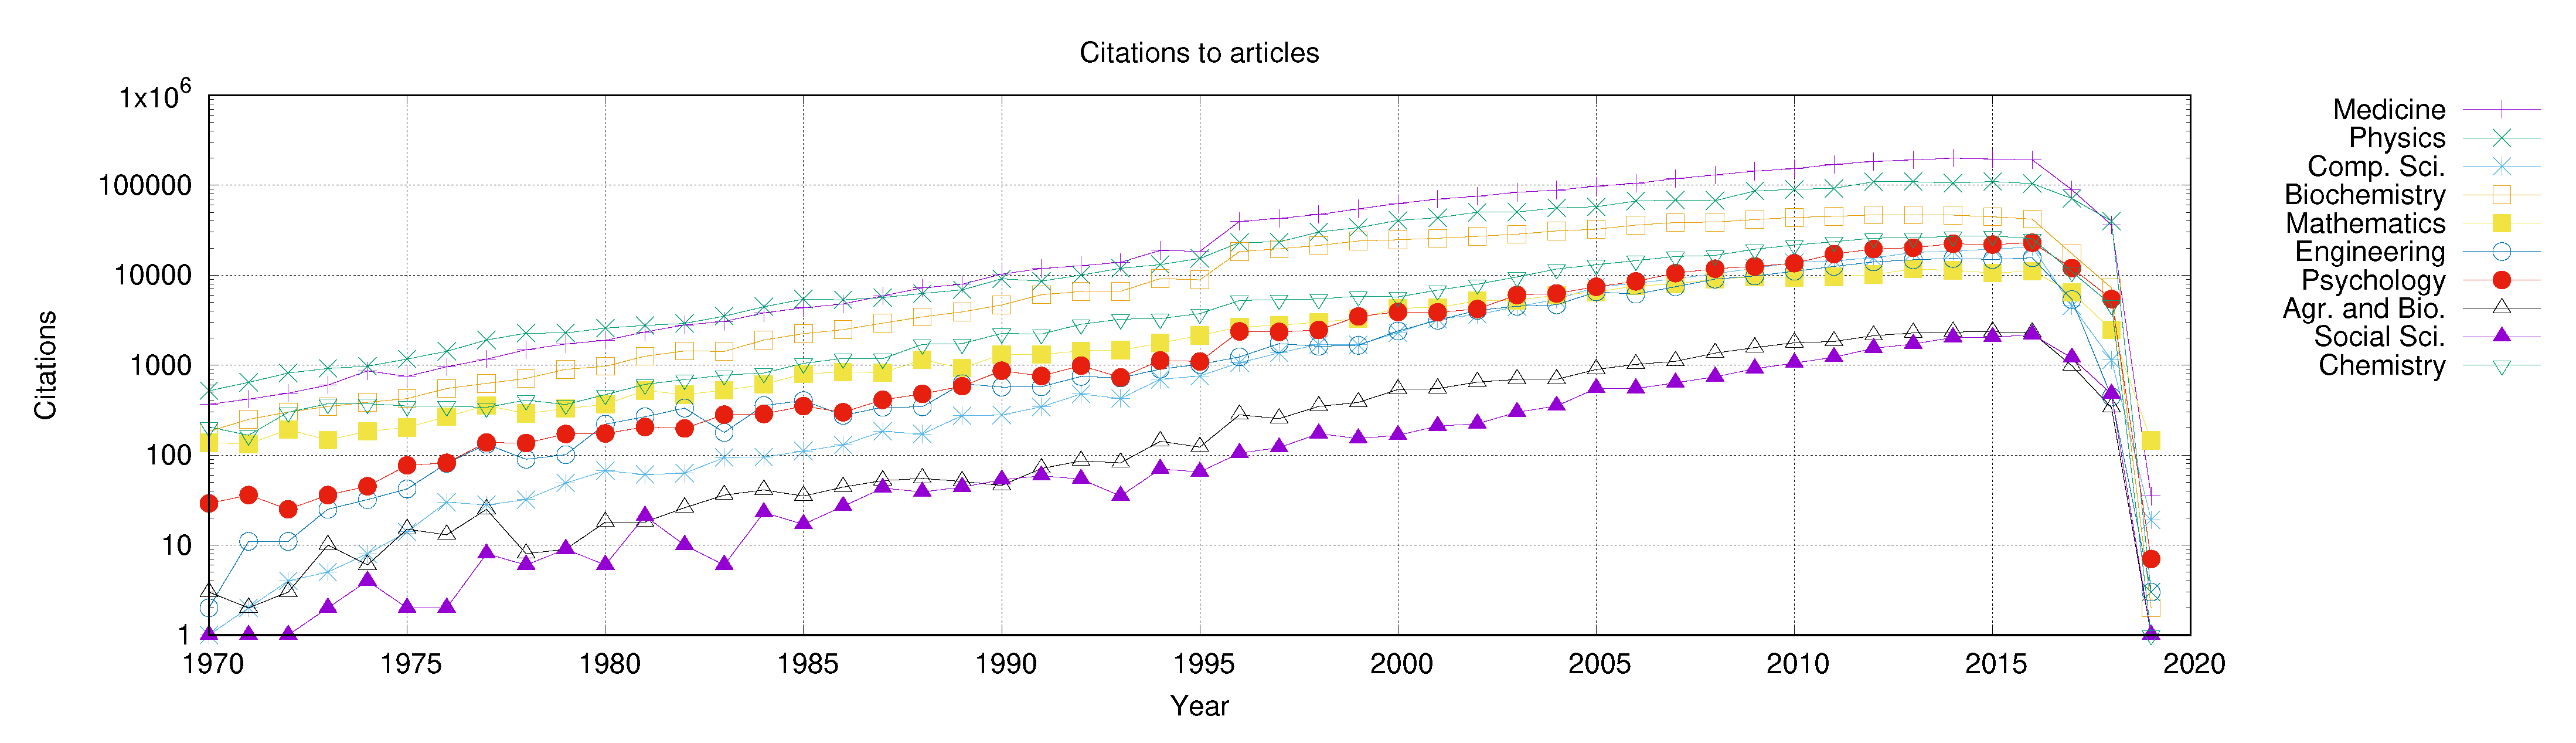
Our repository records documents between the years 1970 to 2018. In this period, the volume of citations to articles has grown in all areas, as shown in
Figure 1. However, the volume of citations between areas is very different, while Physics, Medicine, and Biochemistry show explosive growth in citations since the 1980s, growth in Social Sciences and Agricultural and Biological Sciences has been slower. The differences in volumes are noticeable. The gap between the most cited areas and the rest is in one to two orders of magnitude (note that the figure uses a logarithmic scale). We can see that
Figure 1 shows a decrease in citation growth from the year 2013 onwards. This fact is due to the delay produced by the dynamics of citations. As the sample ended in 2018, citation growth is captured up to five years earlier. This observation indicates that many papers’ life span is more extensive than five years, on average, corroborating the recent finding of Liu and Fang [
19].
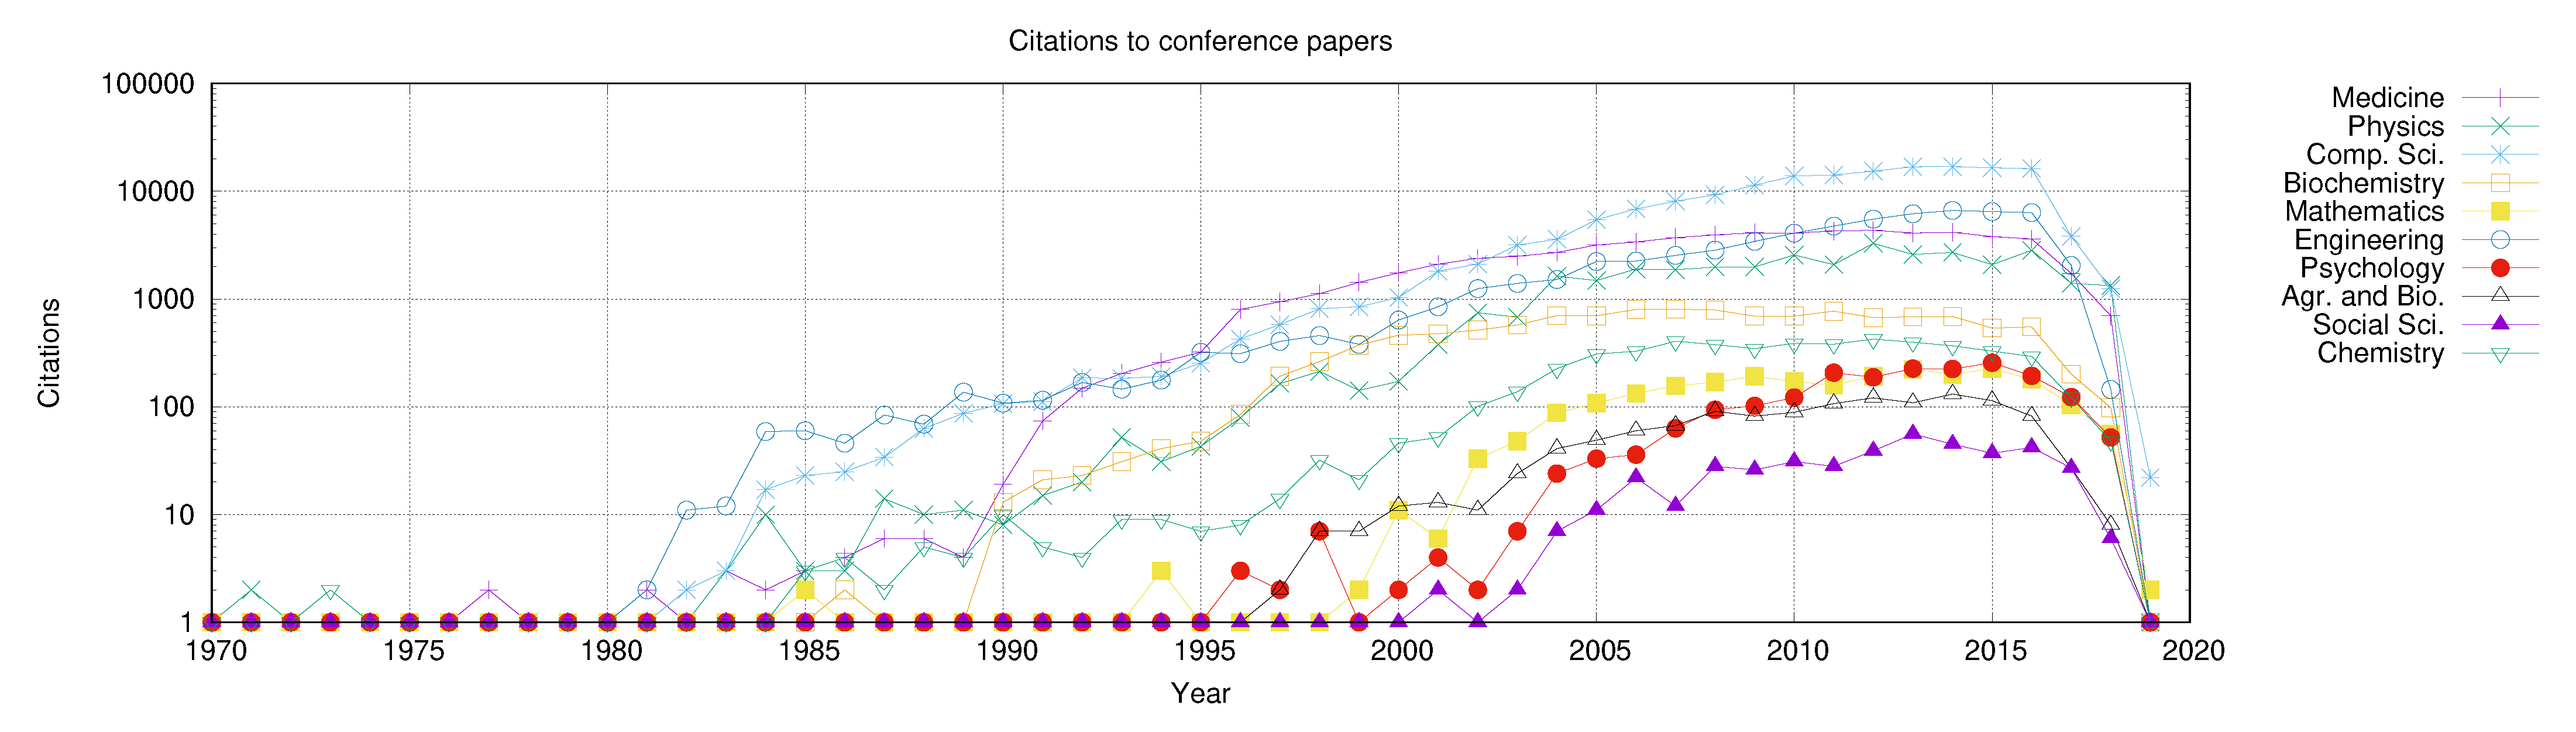
Figure 2 shows that citations to conference papers have grown since the 1980s. This growth begins in Engineering and Computer Science. Other areas show slow growth in the volume of citations to conference papers. For example, Medicine started growth in the late 1980s, as did Biochemistry and Physics. Even later is the growth in this type of citation in Chemistry (the 1990s). In the other areas, this growth has been prolonged or, for all practical purposes, it is non-existent.
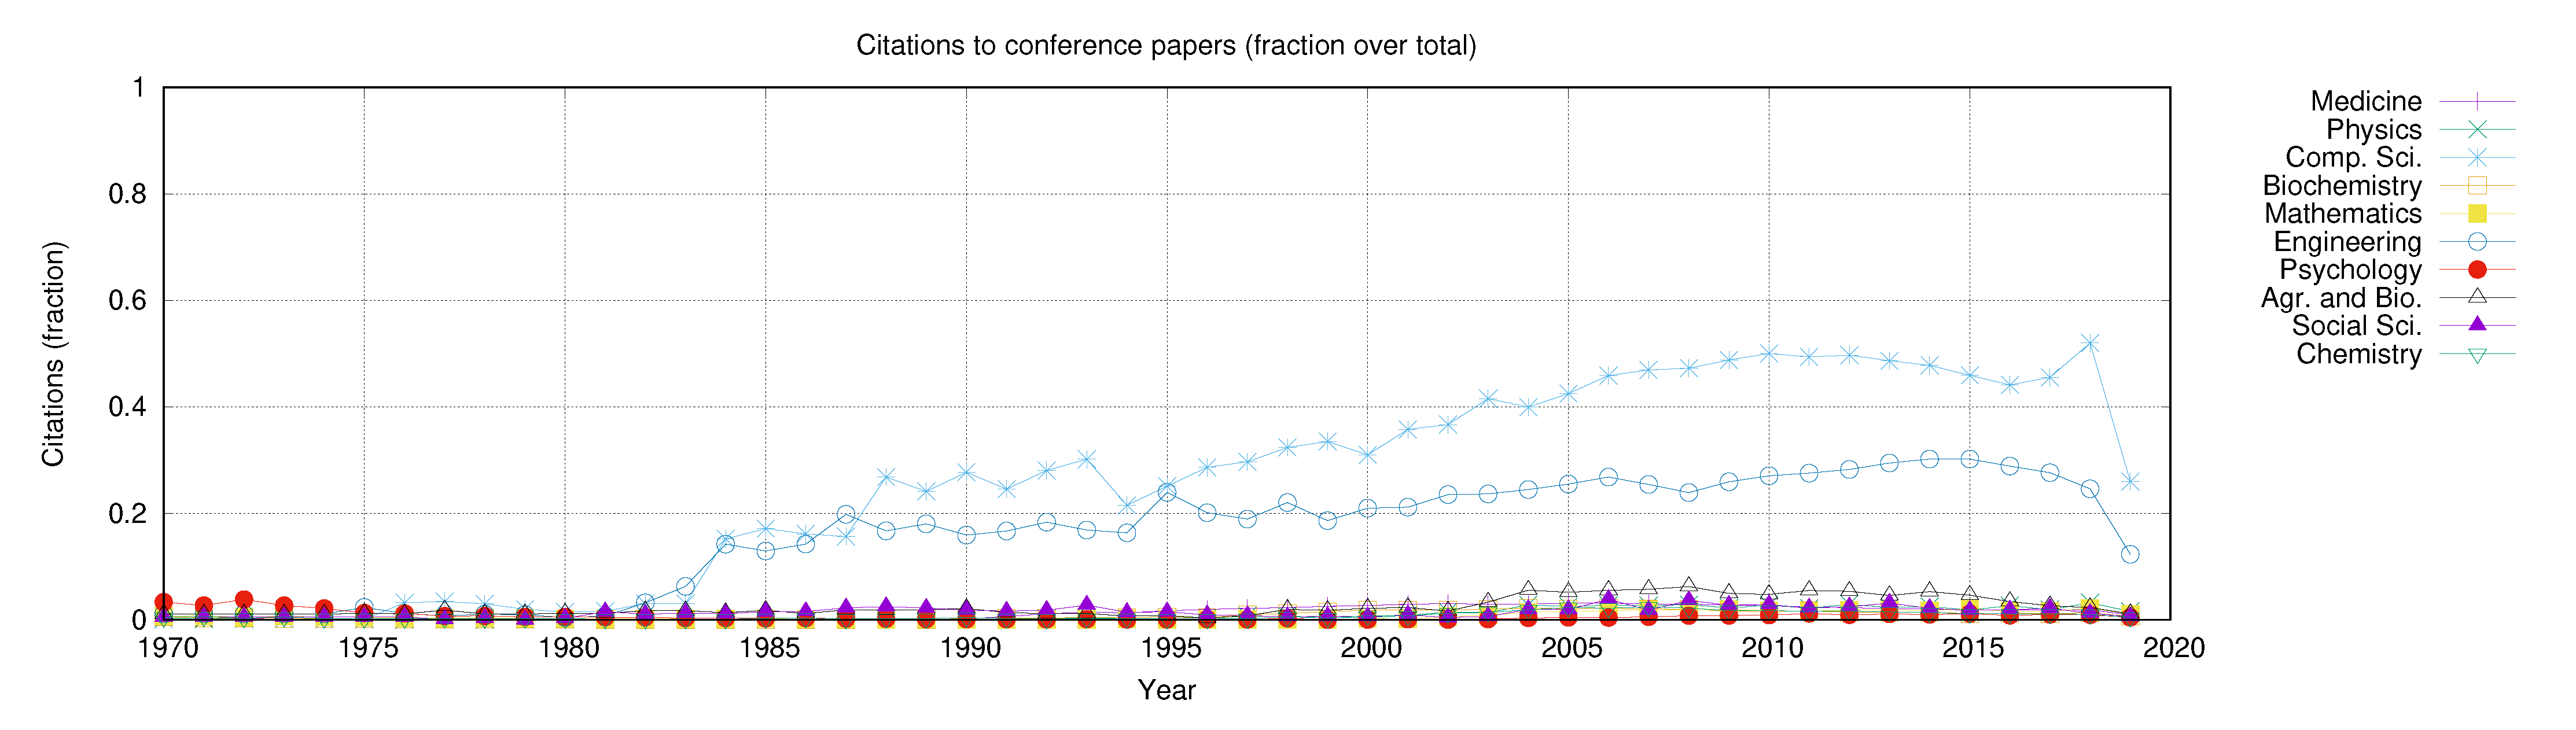
The growths on the curves in
Figure 3 represent different events, while in Engineering and Computer Science, this dynamic represents a significant volume of the total citations, in the other areas, these quantities are much lower. We observe this fact in
Figure 3, where we show the fraction of citations to conference papers over the total number of citations per area and year. The figure clearly shows that citations’ dynamics to conference papers are part of a phenomenon in Engineering and Computer Science. In contrast, in the other areas, this phenomenon is practically non-existent. The curves show slower growth in Engineering than in Computer Science. In this area, citations to conference papers reached almost half of the total citations in 2010.
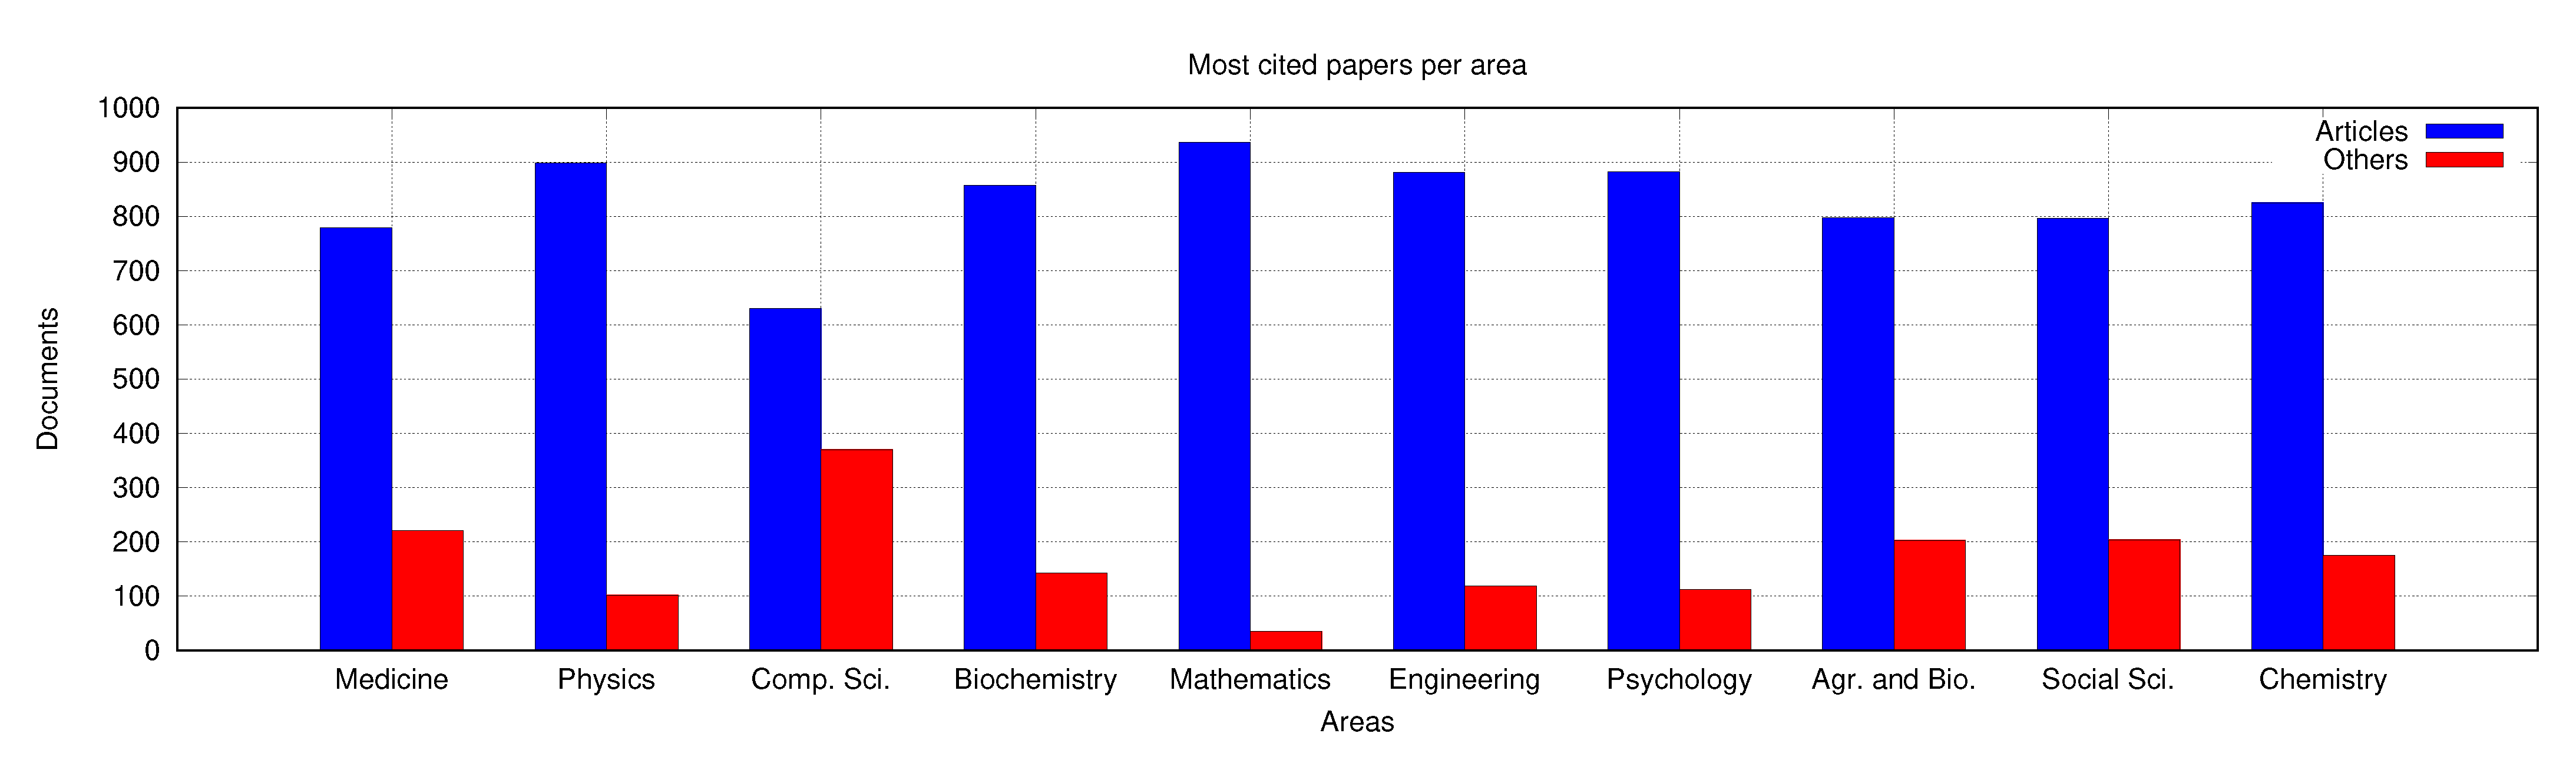
We analyze citation patterns in the top 1000 most cited papers per area.
Figure 4 shows that many of these papers are articles. The figure also shows that some of these papers belong to other types of publications. For example, more than 200 highly cited papers in Medicine belong to other types of publication. Something similar appears in other areas such as Physics and Chemistry. This fact is explained by the high prevalence in these areas of citations to reviews and letters. Agricultural and Biological Sciences and Social Sciences also show highly cited papers in other types of publications, which is explained by the high prevalence of citations to letters, books, and chapters. The area with the least highly cited papers in other types of publications is Mathematics, where more than 900 highly cited papers are articles. On the other hand, Computer Science shows that several highly cited papers are conference papers, reaching almost the 400 top papers. This quantity is the largest amount in this category in the entire repository. Curiously, the Engineering conference papers that are not articles are very few, indicating that even though there is a growth in the number of citations to conference papers, the most cited papers in Engineering continue to belong to journals.
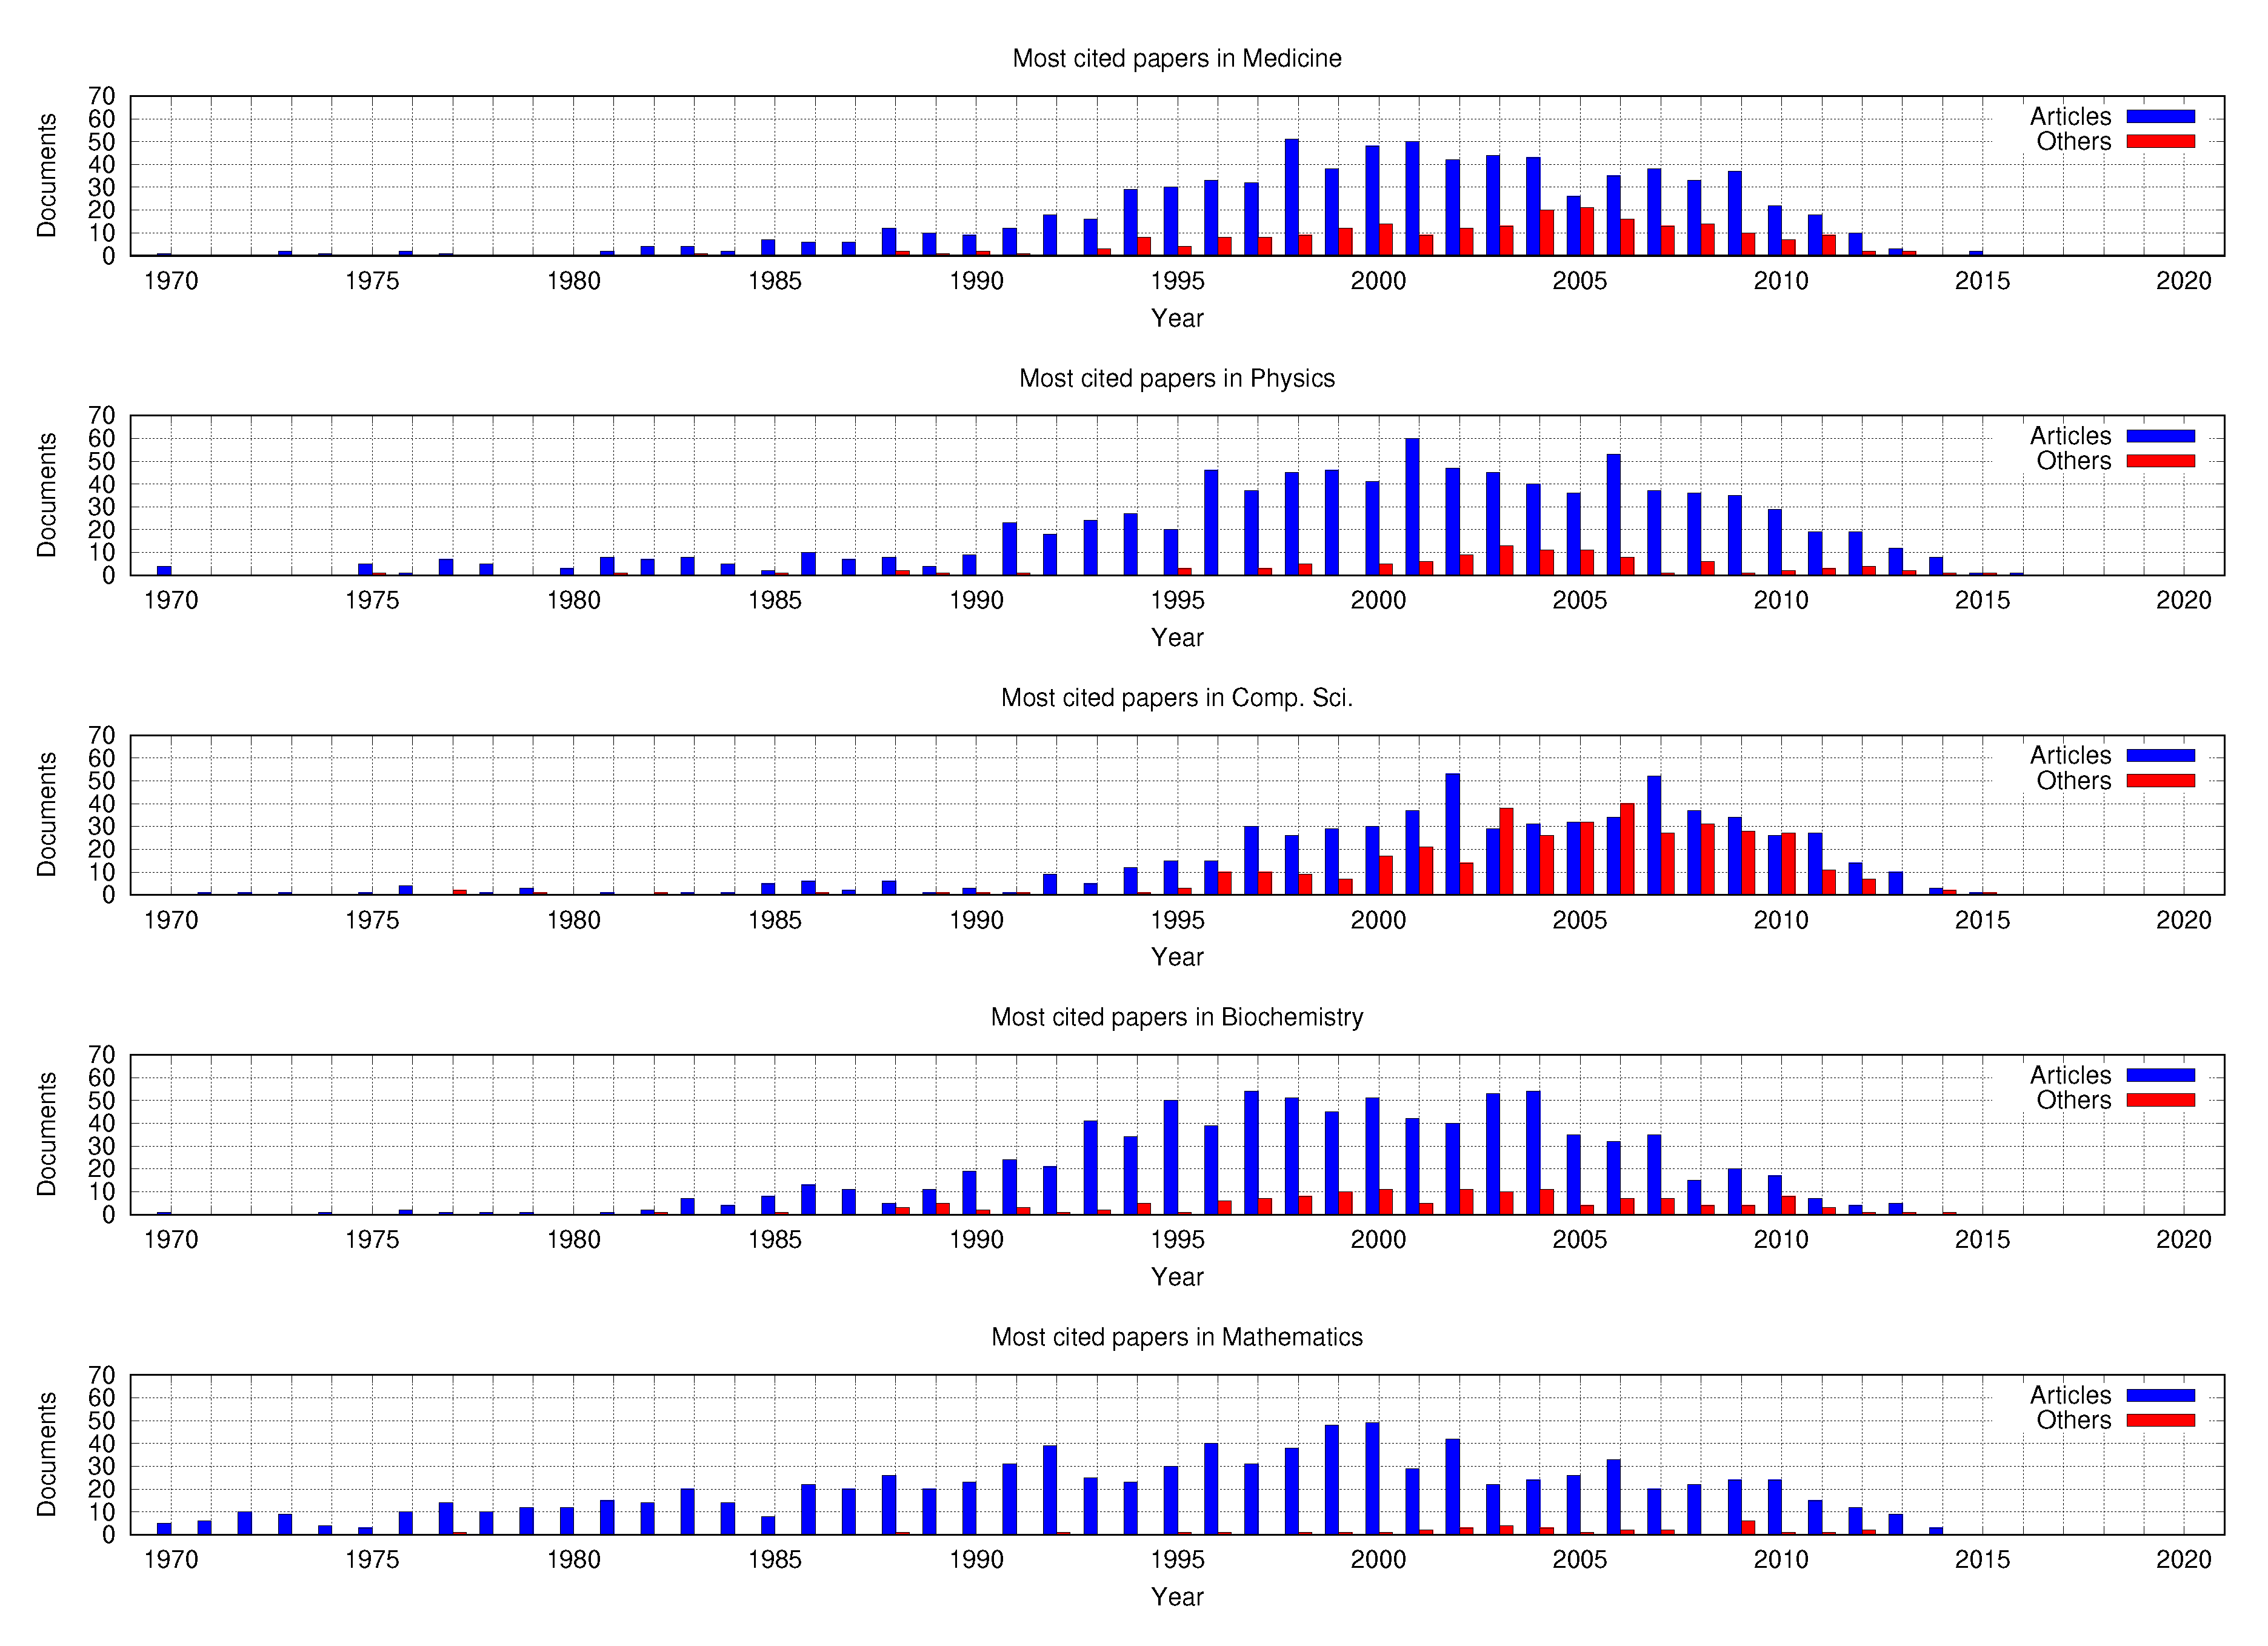
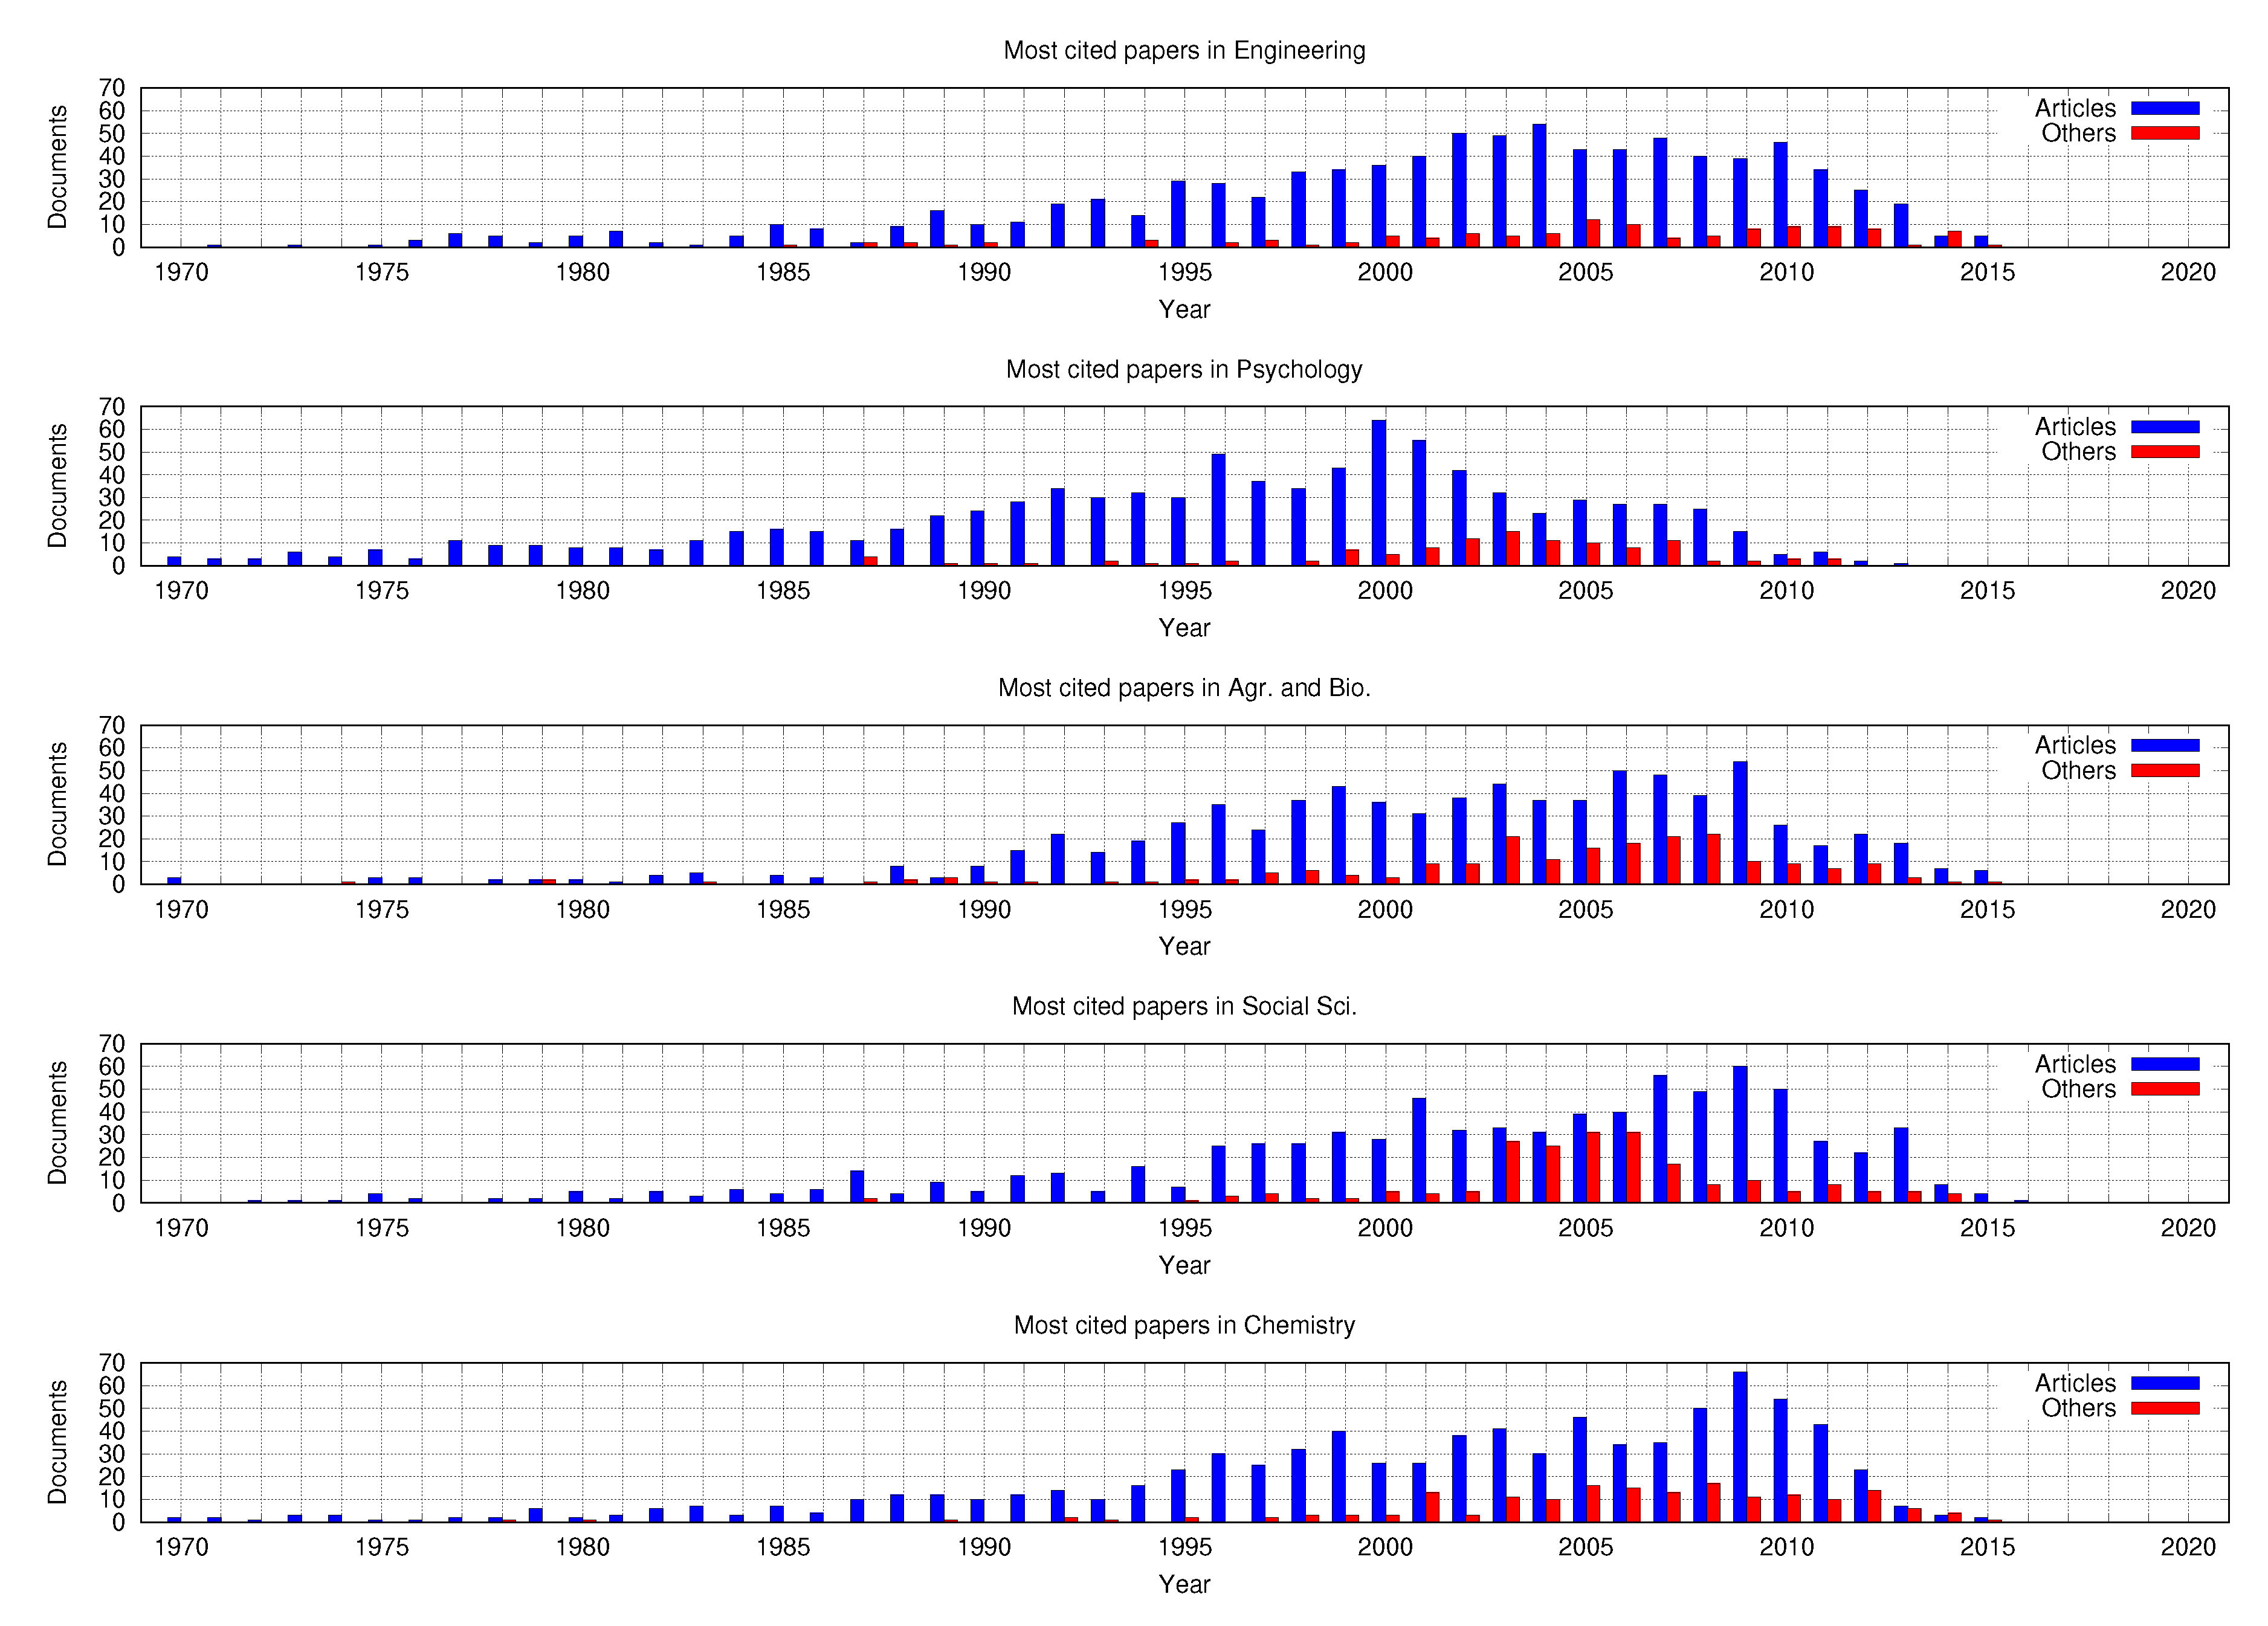
The top 1000 papers per area span many years of the timeline.
Figure 5 and
Figure 6 shows that in Medicine, many of the top-cited articles were published in the 1990s and 2000s, with a distribution very similar to that exhibited by Physics, Biochemistry, and Chemistry. Mathematics and Psychology papers span along more years, ranging from the 1970s to the 2000s. Computer Science is the area in which top papers are located in a shorter timeline. The bulk of these papers were published from the late 1990s and until the early 2010s. This distribution is similar to Engineering, even though its first most cited papers are young. Psychology shows two periods with many highly cited papers, around the years 96 and 2000. The distributions of Social Sciences and Agricultural and Biological Sciences are similar. As for the highly cited papers of another type, such as conference papers, letters, and reviews, these show to be relevant in Medicine and to a lesser extent in Physics and Biochemistry. In Engineering, the impact of this type of paper is much lower. It is striking that these papers acquired a little more relevance in Social Sciences in the mid-2000s and to a lesser extent around the same time in Chemistry and Agricultural and Biological Sciences. The area where conference papers have had the most impact is Computer Science. In this area, its relevance from 2005 onwards is significant, surpassing even the articles. This trend is only observed in Computer Science, illustrating that this reality is unique to this area.
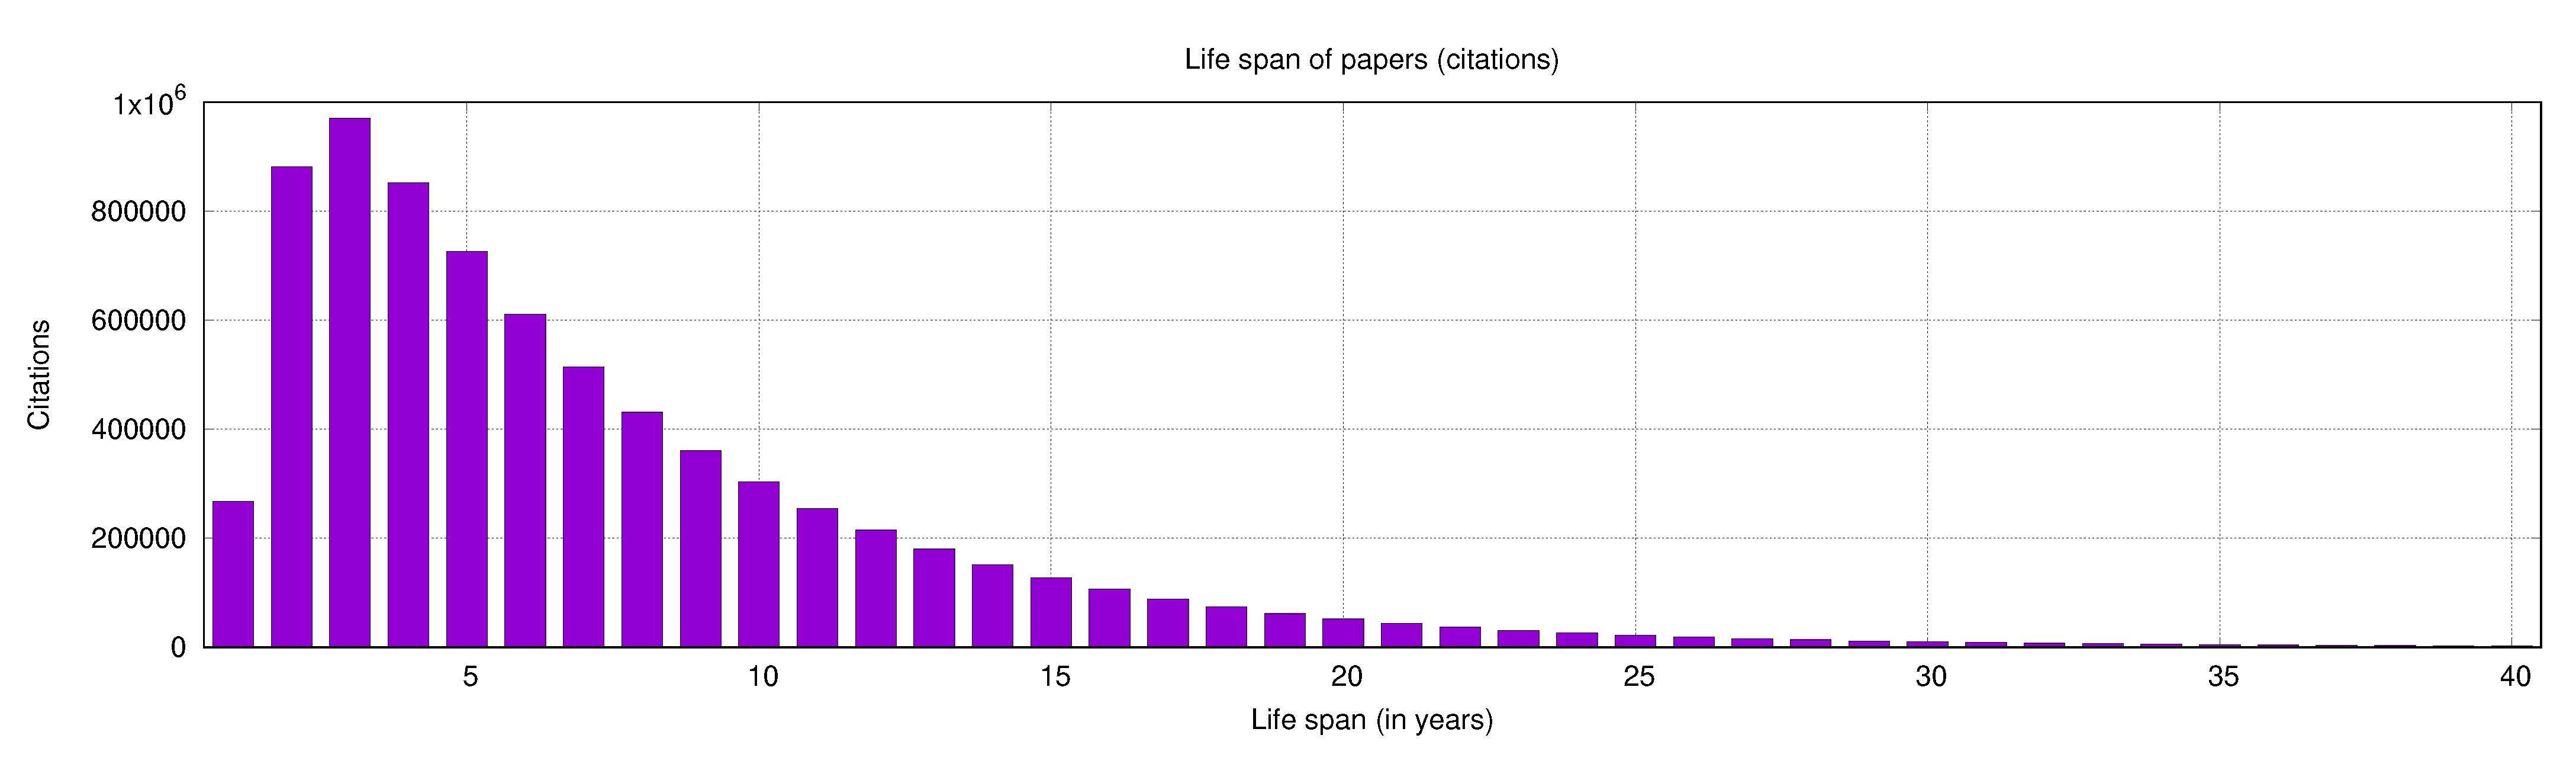
We also analyze if there are differences between areas regarding the papers’ life span, according to their activity in terms of citations. To do this analysis, we counted the number of citations received for each paper in our repository since its year of publication. Our repository spans almost 50 years. In
Figure 7, we show the average life span of all the papers in our repository. These results show that the average life span of a paper begins in the same year in which it is published and acquires its most significant relevance in its third year of life. Then, its impact progressively wanes. Very few papers have a life span of more than 20 years, and as time progresses, the citations that most papers receive diminish until they are almost entirely extinct.
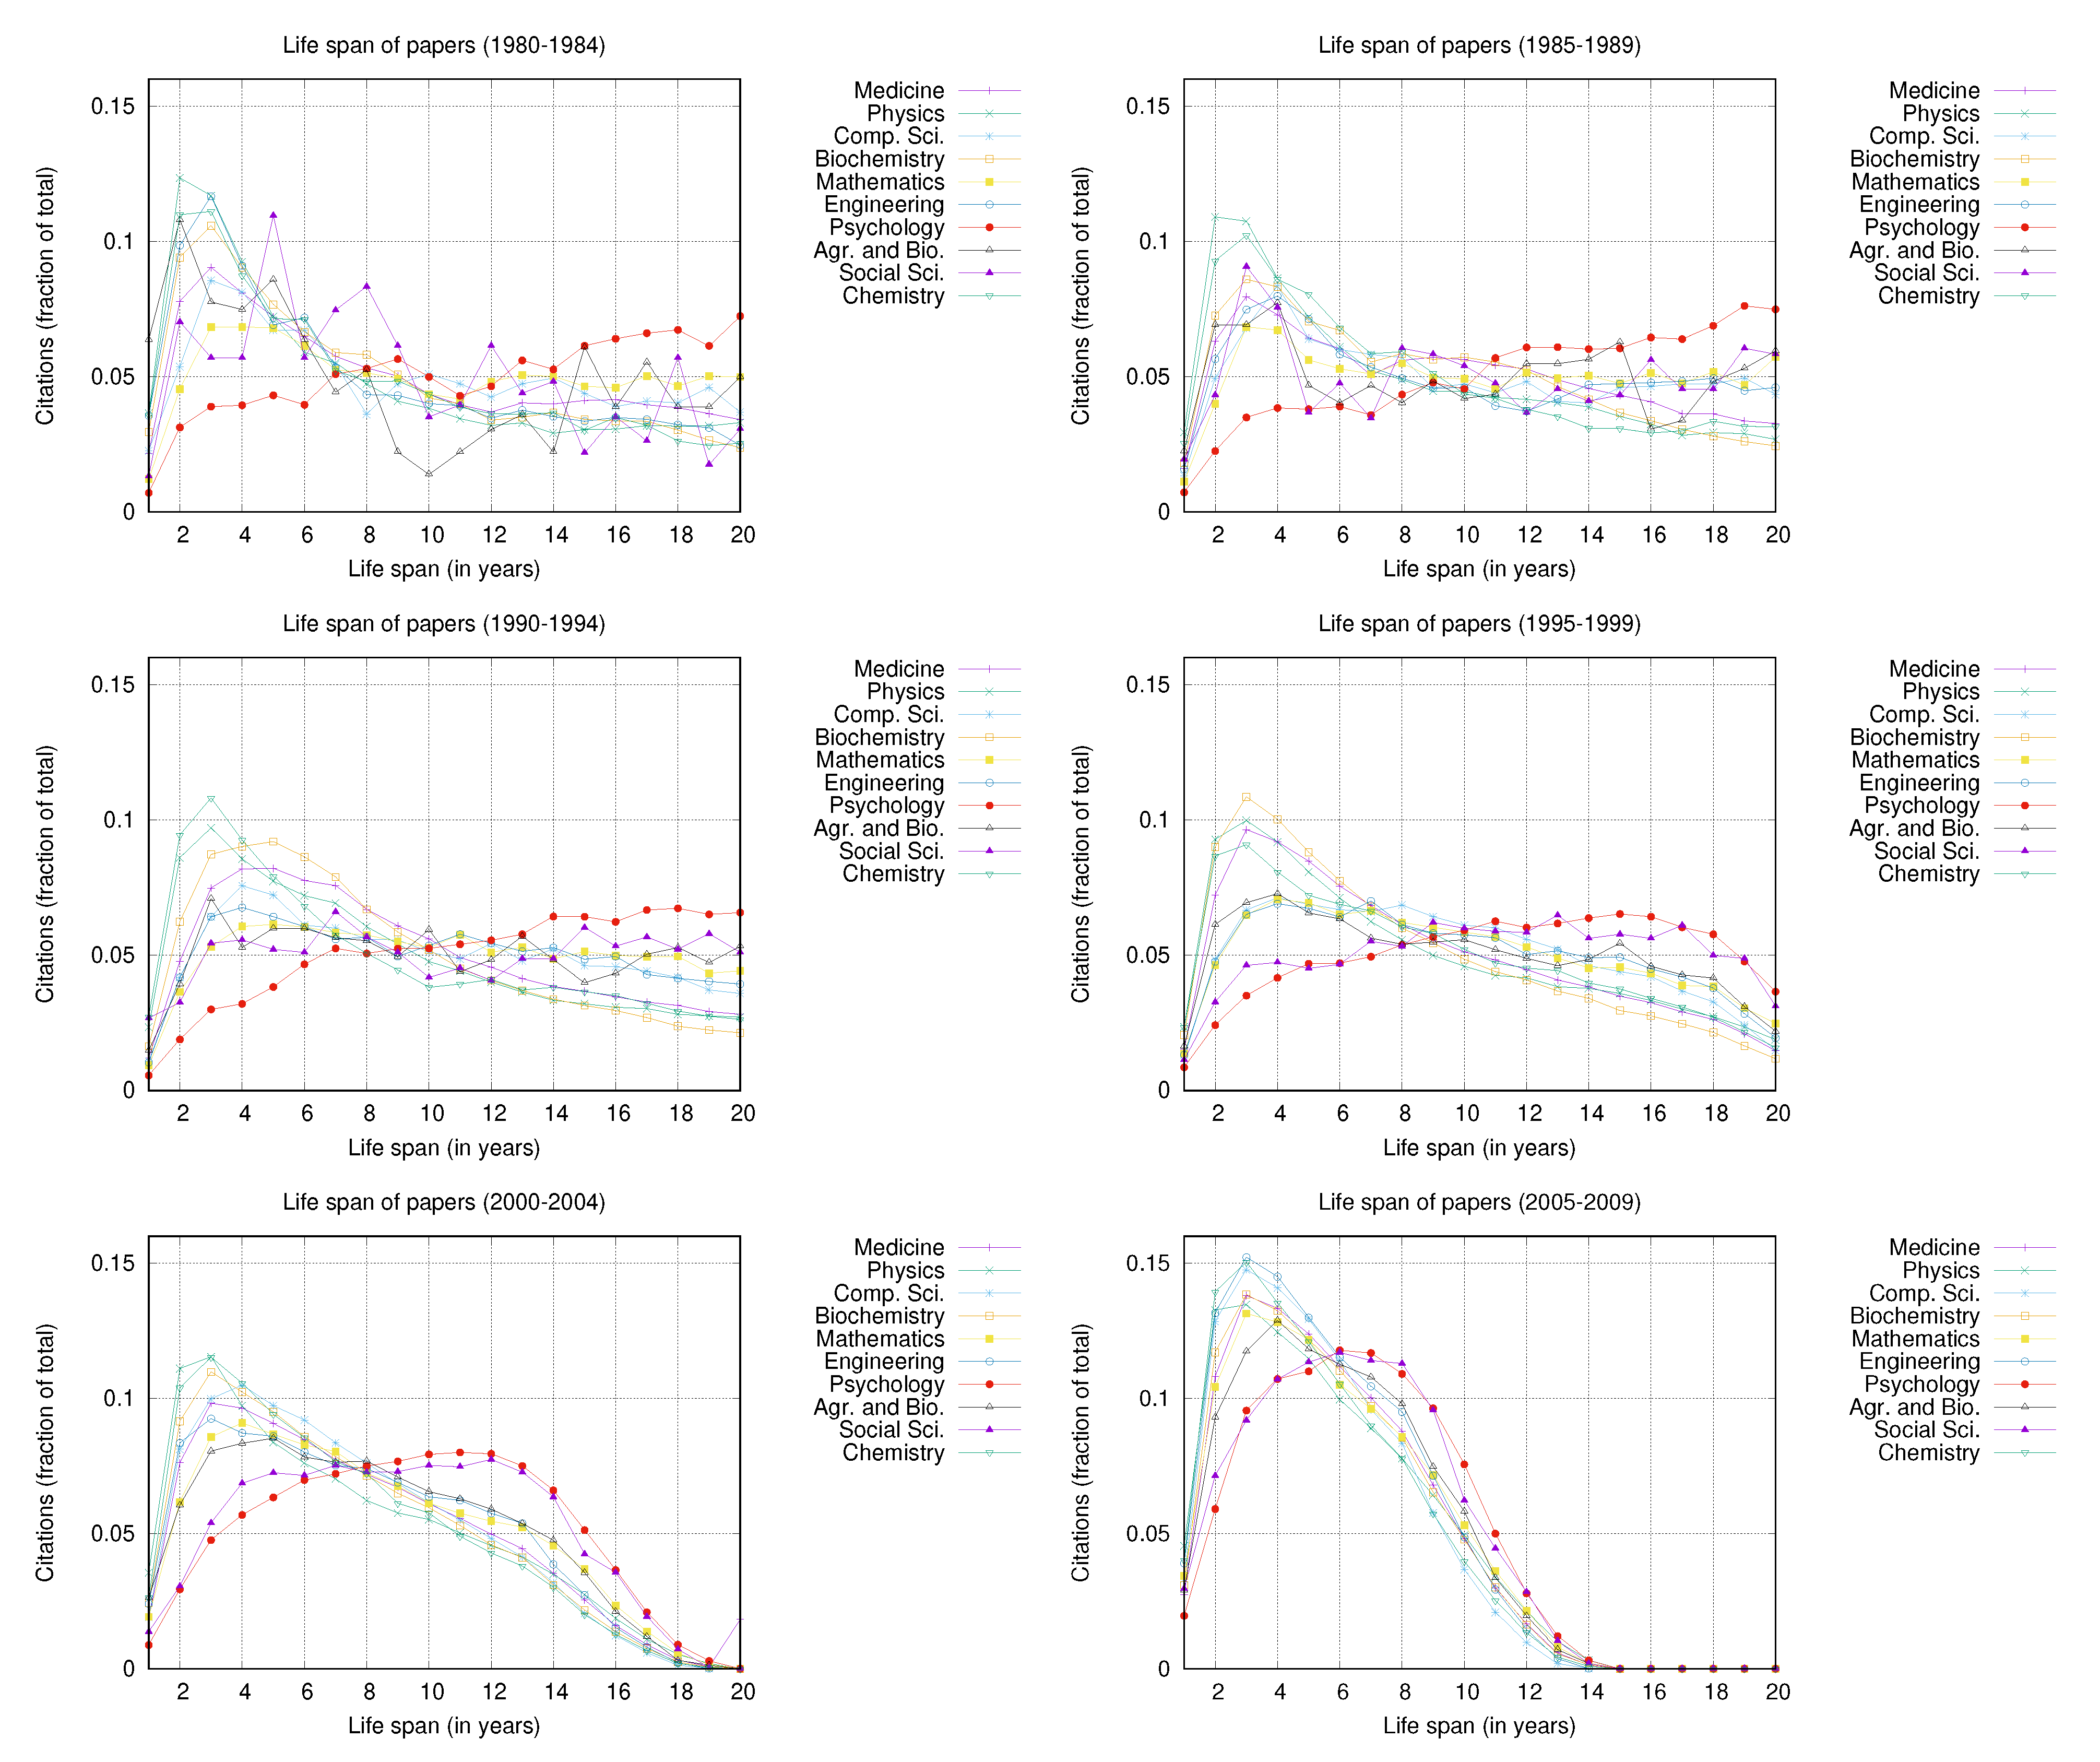
To study the differences in life span according to citations between areas, we split the timeline into six five-year periods to compare papers published in close years in each plot. These results are shown in
Figure 8, which shows the 20-year life spans of papers published in 6 different five-year periods, from the 1980s to the end of the 2000s.
Figure 8 shows some interesting dynamics, while various areas in the 1980s followed a similar life span to
Figure 7, showing a performance peak in the third year, Psychology and Social Sciences show a much slower growth curve. This effect becomes more noticeable in the 1990s, where the curves of these two areas show growth during the 20 years of the life span while the rest of the areas’ curves begin to decline after the third year of life. This finding suggests that the papers cited in Psychology and Social Sciences have a longer life span than other areas. This difference is also noticeable in the 2000s. Most of the areas show their peak of citation in the third year, followed by a substantial decline, while Psychology and Social Sciences have a slower growth but a long life.
5. Differences in Citation Patterns across Areas and Age Groups of Researchers
We analyze the differences in citation patterns by comparing groups of researchers of different ages. For this purpose, we calculate each researcher’s academic birth, defined as the year in which the author published their first work. Authors span many years of the timeline, beginning in 1970.
Figure 9 shows that many authors recorded their academic birth after the 1990s. Most of the academic births are located in the decade of the 2000s.
We separate the authors into three groups according to their academic birth. Seniors are those researchers whose birth is before the year 2000. Mid-age researchers are those born between the years 2000 and 2009. Young researchers are those born after 2009. The sizes of these groups do not have significant differences, which facilitates the comparison between them. The senior group has 42,417 (44%) researchers; the mid-age group has 29,923 (31%) and the young group 23,321 (25%).
For each of these groups, we compute authors’ life span, defined as the track of citations recorded over time. Each citation track records the total number of citations received by an author per year. We compute a life span of ten years for young researchers since these authors were academically born after 2009. The other two groups are analyzed using 20-year life spans.
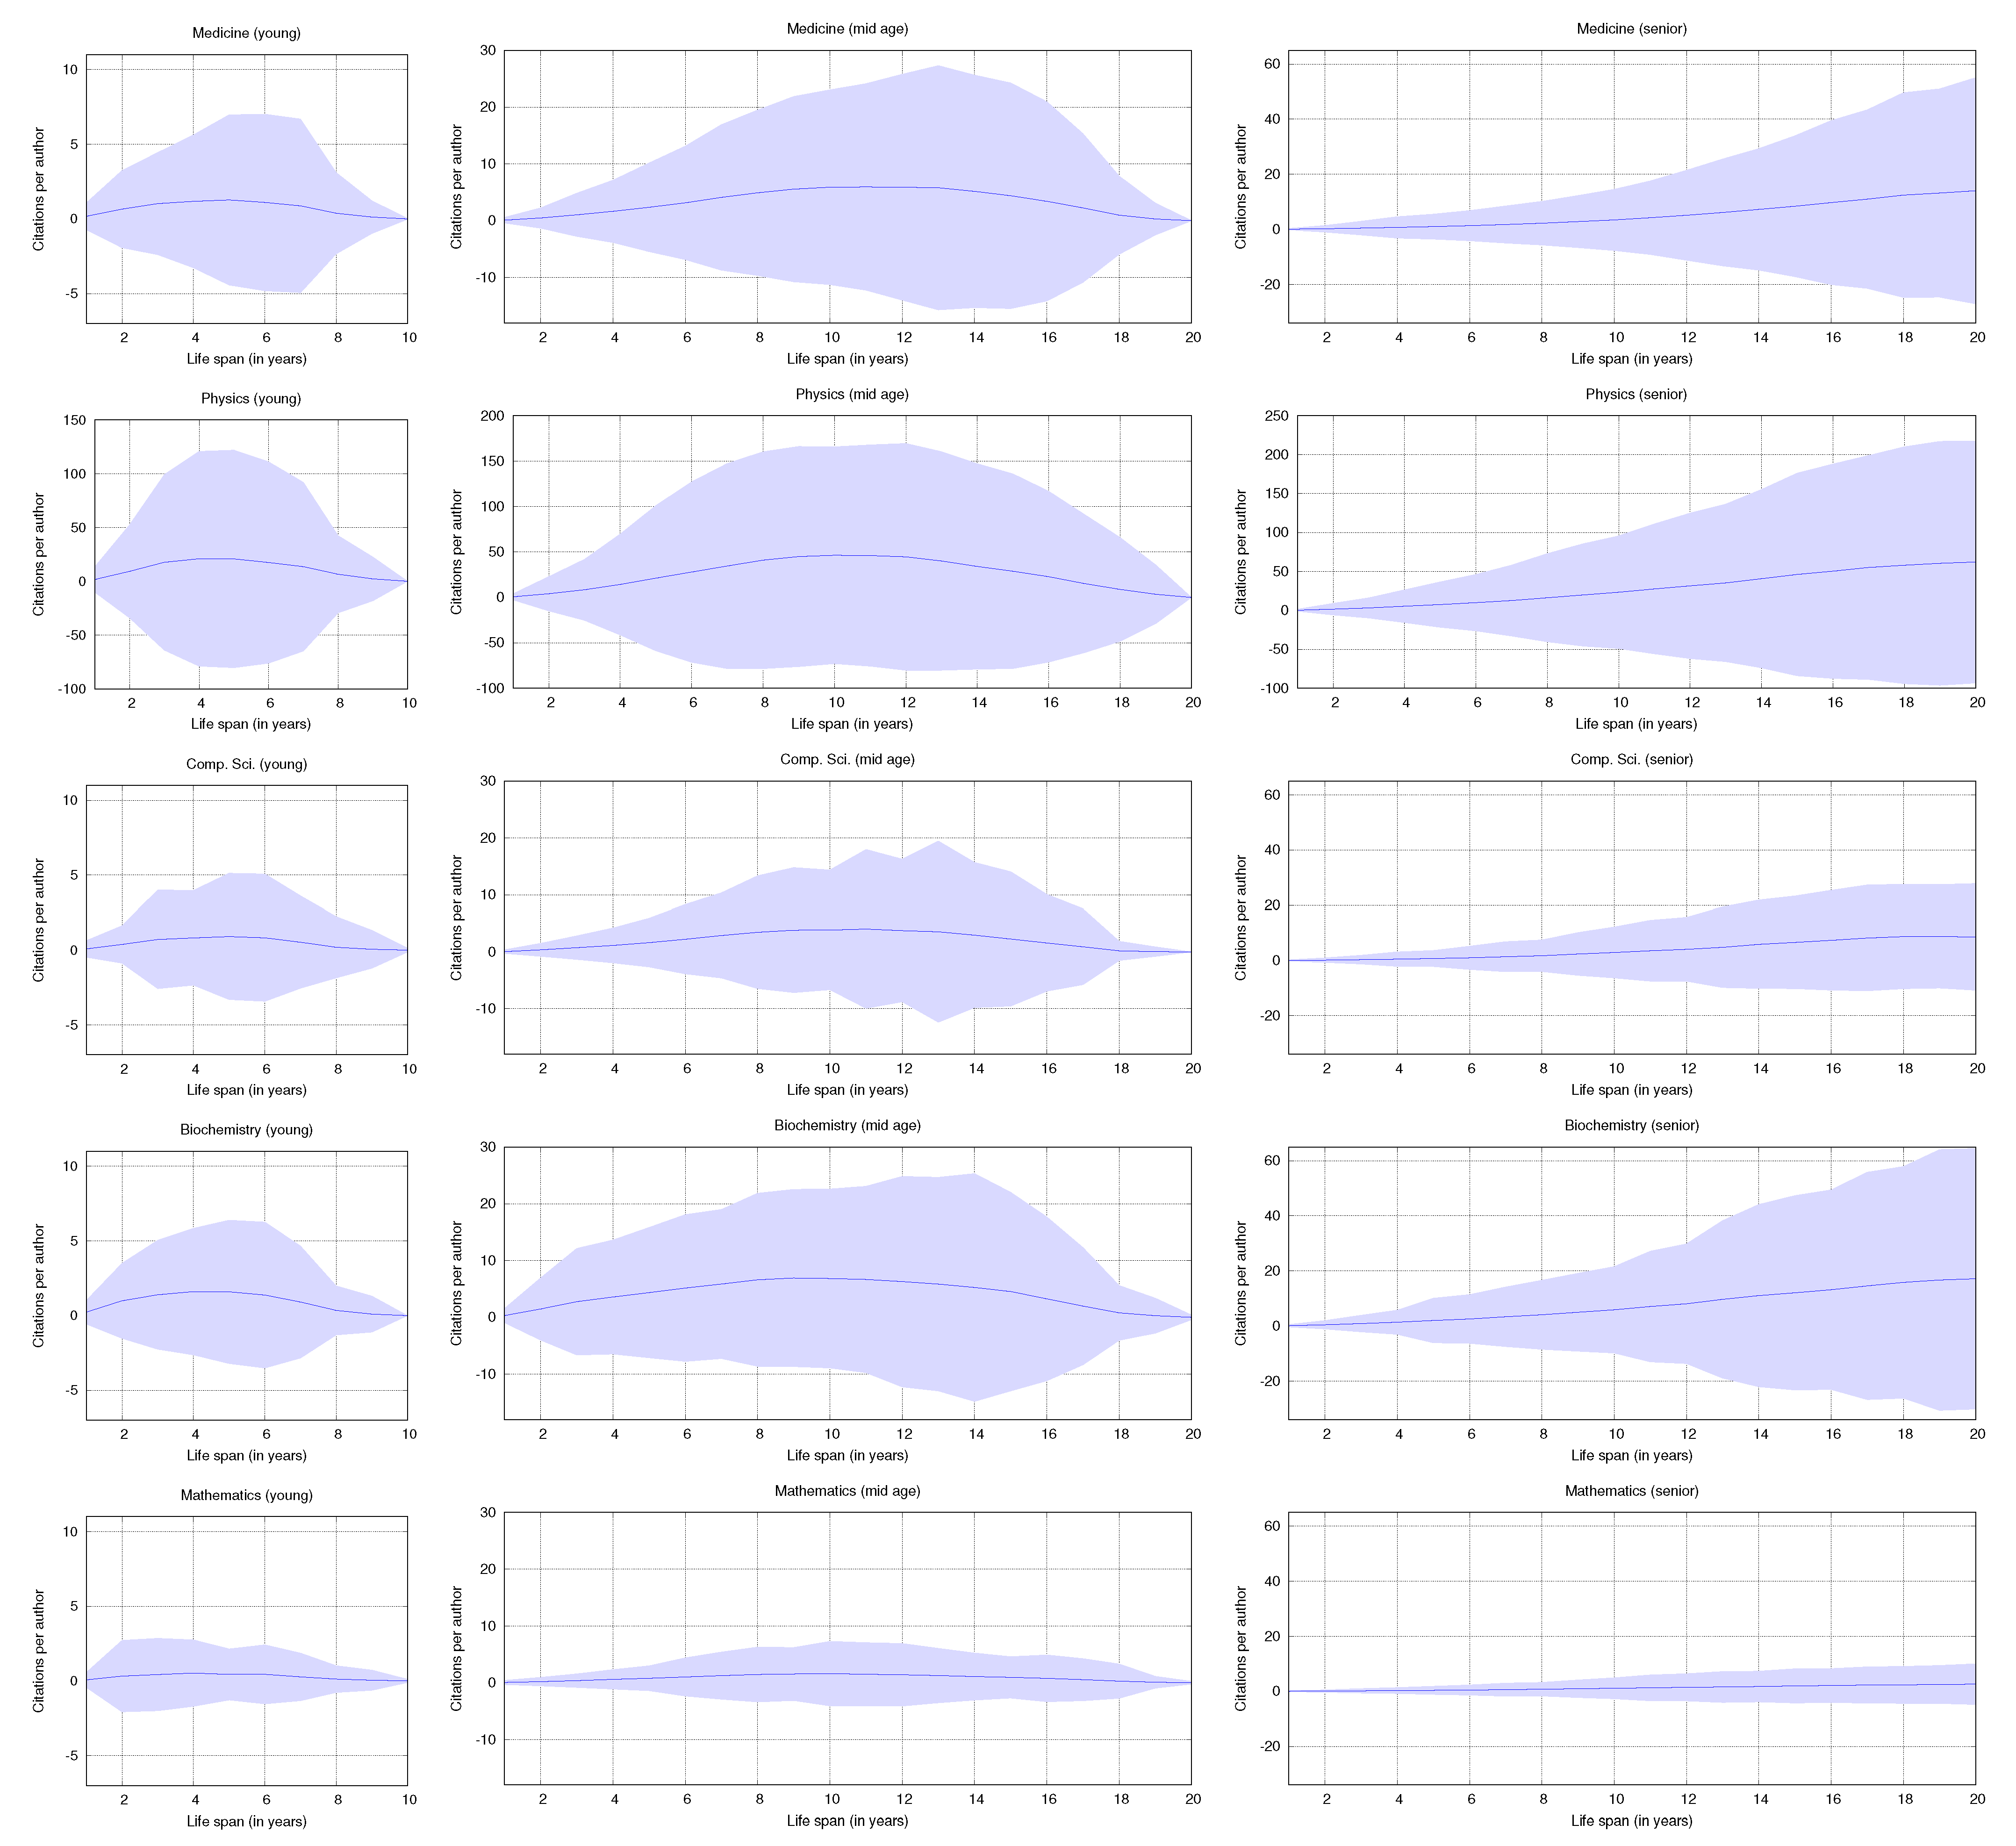
Figure 10 and
Figure 11 show the life span per area and age group. The solid line shows the mean life span, while the colored area indicates the standard deviation around the mean. The axes use the same scales for each age group to facilitate comparison between areas. The only area in which it was not possible to scale was Physics, which receives many more citations per author than the rest of the groups.
Authors’ life spans vary widely between areas and age groups, while the young and mid-age life spans decrease towards the end of the timeline, the seniors show growth towards the year 20. This fact is attributable to the cut-off year in data acquisition. Some comparisons between groups are very interesting. Physics shows rapid growth in authors’ life span, with an average of citations in young authors of more than 20 citations by the third year of life. This effect is observed in the other age groups, with a peak in mean citations in the tenth year of life in mid-age researchers and a sustained growth that exceeds 50 citations on average by year 20 in seniors. Physics is out of scale in this comparison because the volumes of citations in the area records are much higher than in the other areas. On the other hand, the other areas record comparable amounts of citations, which allows the comparison between areas on the same scale. It can be seen that the axes used in these figures are the same for each age group (except Physics).
Mathematics shows a strong fit to the mean, with a low standard deviation (see
Figure 10). This effect is maintained in the three age groups, indicating that very few authors have rapid growth in citations in this area. It is also noteworthy that the mean life span in Mathematics is very low, which indicates that most authors concentrate few citations. This fact is due to two factors. First, the volume of citations in Mathematics is low (see
Table 4). Furthermore, the average number of citations per paper is also very low (see
Table 6).
Figure 10 shows that the life spans of Medicine and Biochemistry are similar, which may be because these two areas have a high volume of cross-citations. The Computer Science standard deviation indicates that some authors receive many citations and others receive very few. In this area, the fit to the mean is more significant than in Medicine and Biochemistry, indicating that authors with rapid growth in citations are scarcer than in these other areas.
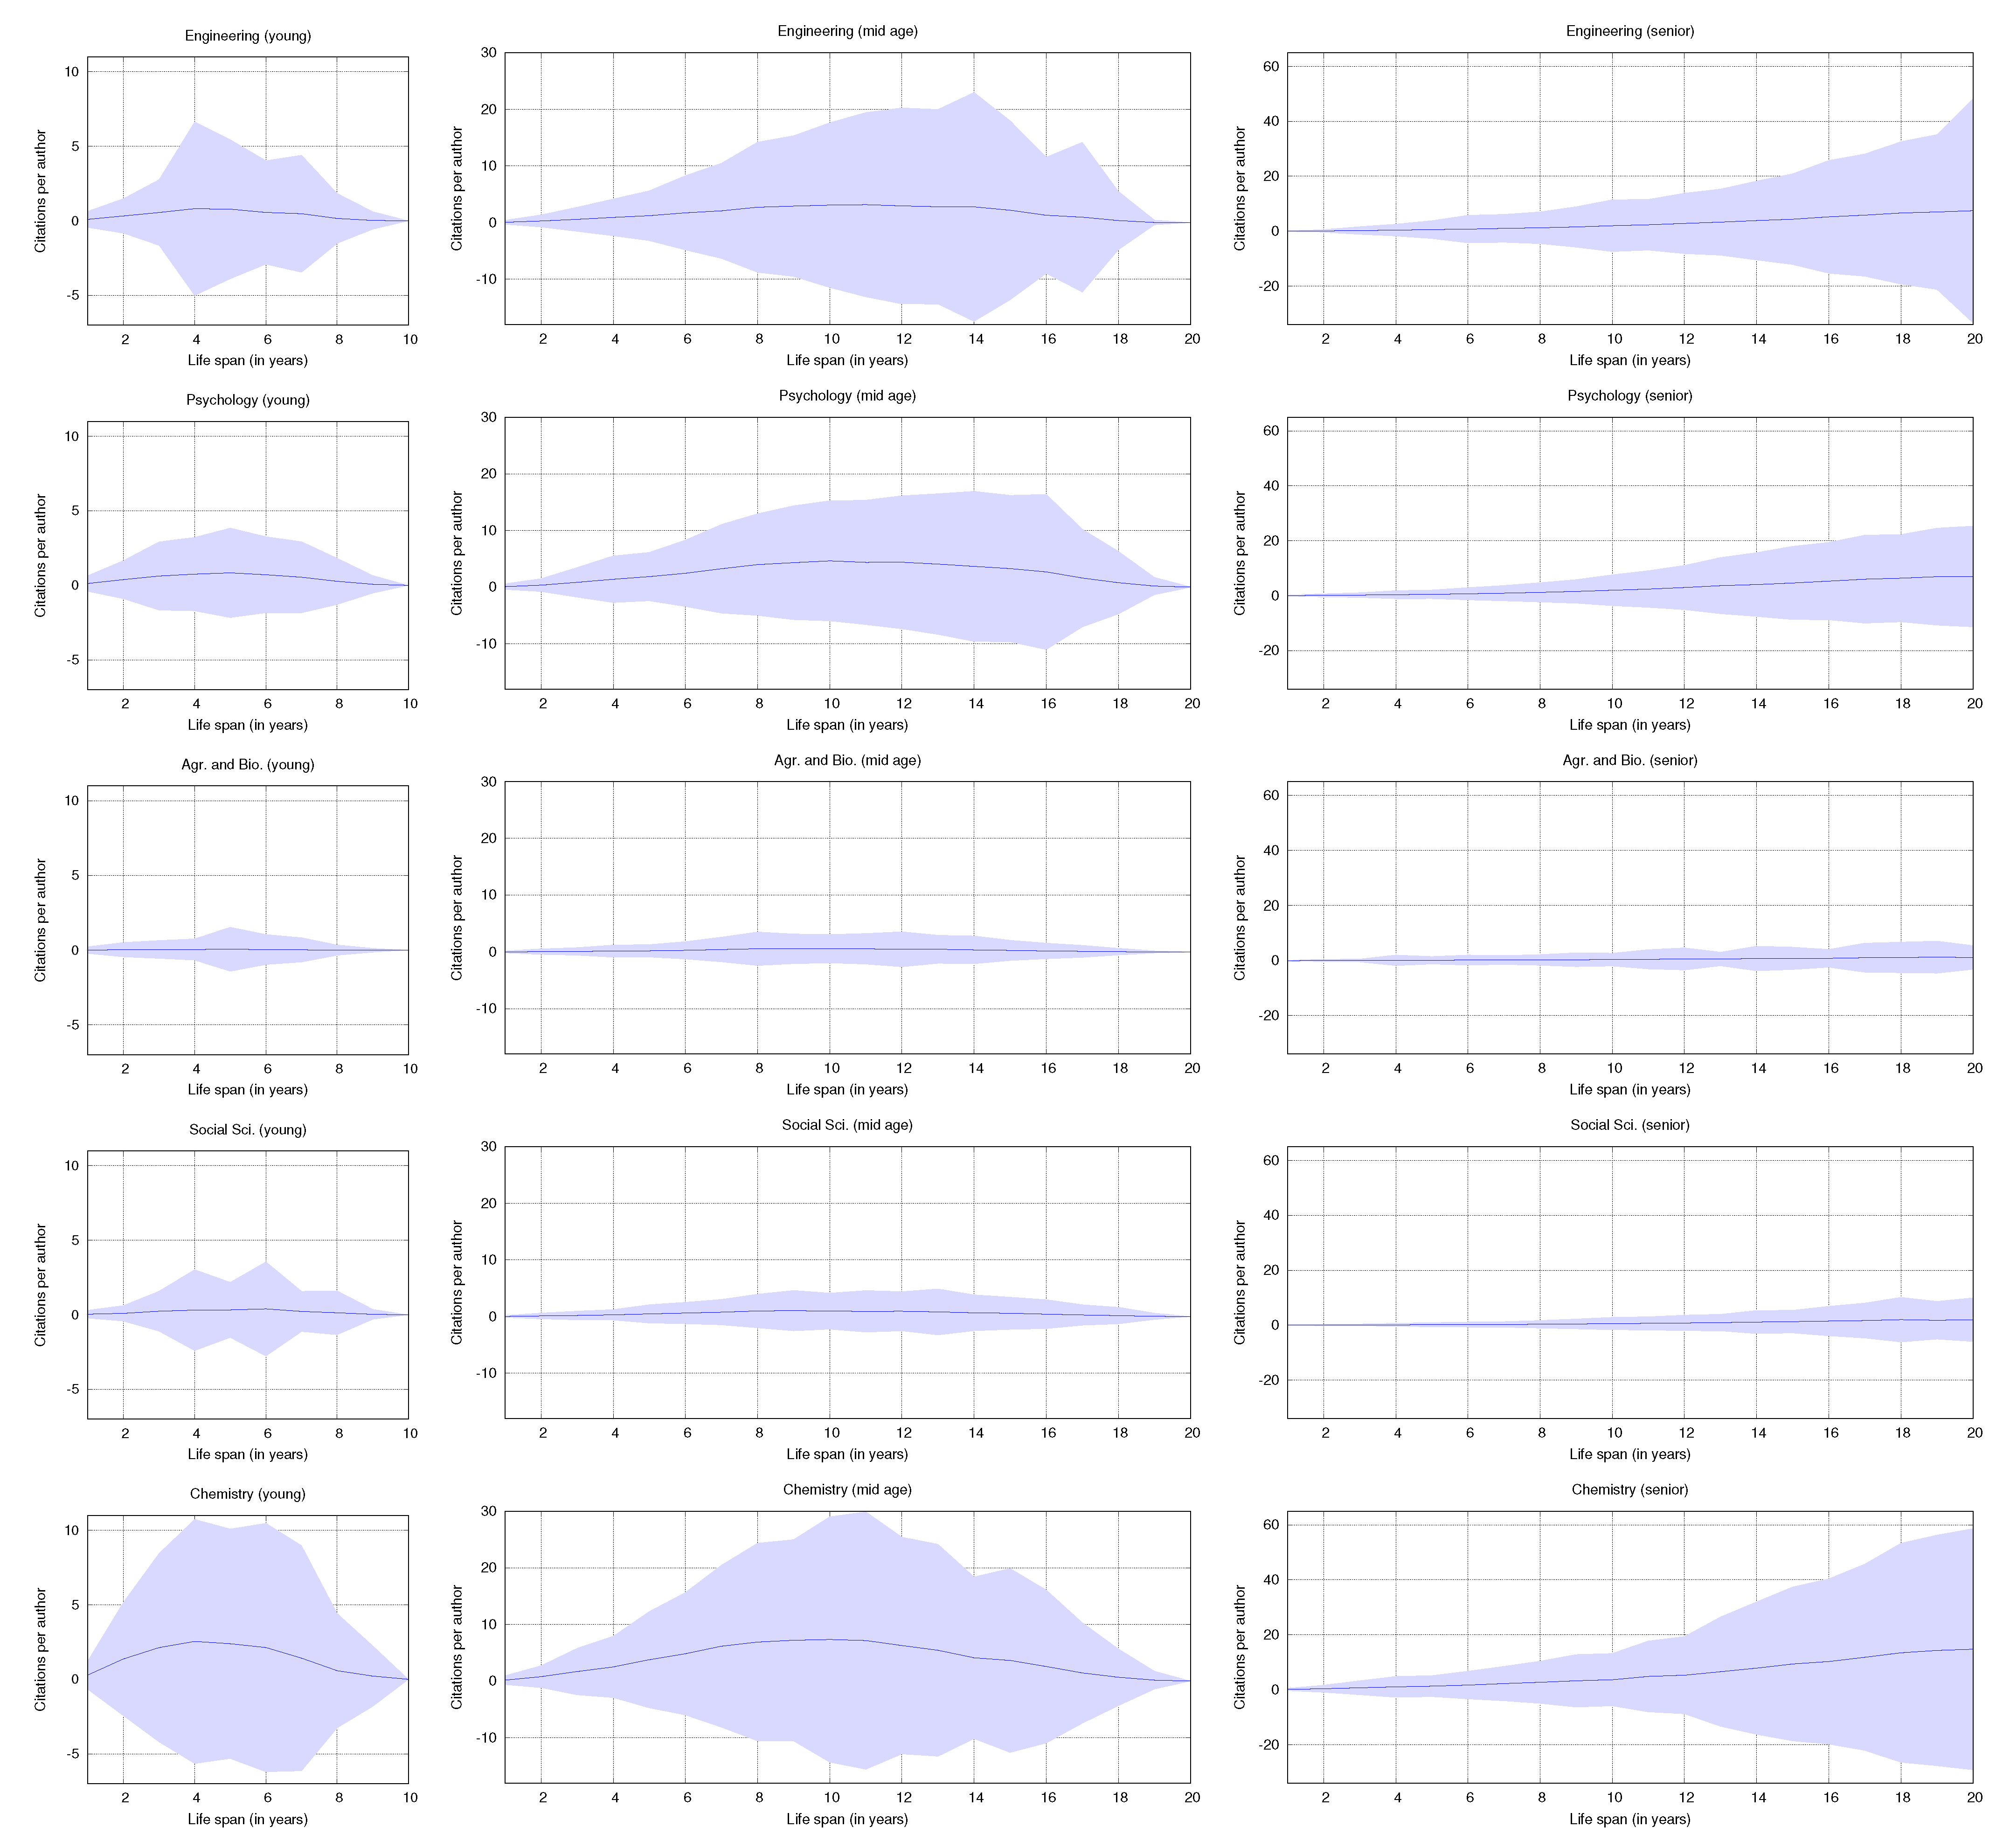
Figure 11 shows that Agricultural and Biological Sciences and Social Sciences also show a strong fit to the mean, with many authors receiving very few citations. The authors’ low mean life span is because the volume of citations in these areas is very low (see
Table 4) and because many of their citations go to other areas (see
Table 5). In the case of Agricultural and Social Sciences, only 0.3868 of its citations remain in the area, while in Social Sciences, the fraction of within citations is 0.429. The other areas show a weaker fit to the mean. Both Engineering, Psychology, and Chemistry show the existence of separate author tracks from the media. Chemistry shows more careers with a high volume of citations, with consolidation in mid-age around year 10 of the life span. In young researchers, the peak of citations is observed at year 4. The mean of citations in Engineering has a slower growth, which indicates that many authors receive few citations in this area. Psychology has a higher growth curve than Engineering, with a peak of citations around year 10 for mid-age researchers.
A key question in citation-based research is whether citations do indeed have predictive power. The ground on which citation-based evaluation is based is that citations received in the past are a good indicator of future citations. A question for this study is whether the citation data has the same predictive capacity in different areas. One possible scenario is that citation data has better predictive capabilities in some areas than in others. If this is the case, we may conclude that evaluation based on citations is more informative in some areas than in others.
We analyze the correlation of citations in each age group. A strong correlation indicates that the volume of past citations is a good indicator of future citations. To do this, and following the guidelines discussed by Liu and Fang [
19], we add each author’s total citations for five years. In the group of young researchers, we compare the correlation between the first and second five-year periods. We measure the correlation between the second and third five years of the life span for mid-age researchers. Finally, in the senior group, we measure the correlation between the third five-year and the fourth five-year period. Spearman’s correlation coefficients are shown in
Table 7.
Table 7 shows that the correlation increases as the authors become more experienced. For the senior group, all areas show a correlation factor close to 0.8. The strong correlation in this group indicates that the careers of these researchers are already consolidated. Therefore, authors with low productivity will have low productivity in the future, and authors with high productivity will maintain their productivity. The academic assessment based on citations in this segment is very informative. This correlation decreases in the mid-age group in all areas. It is striking that this segment is where the correlations are lower, even lower than in young researchers. A plausible explanation is that many authors stop researching between the second and third five years of the life span, which causes the correlation between past and future citation to decline. In young researchers, the correlation between the first five years and the second five years of the life span is more significant than in the mid-age. In some areas, the correlations are much lower than in others. For example, in young researchers at Mathematics, the correlation is only 0.31, the lowest in the entire study. This fact indicates that the first five years of the academic life of mathematicians is very uninformative. In other areas, this life span period provides much more information. For example, in Social Sciences and Chemistry, the correlation exceeds 0.7. The reasons why these areas reach this value are different, while in Social Sciences, young researchers have a slow growth (cold start phenomenon), which explains the high correlation; in Chemistry, the first years of activity show rapid growth with a peak of citations between years 4 and 6.
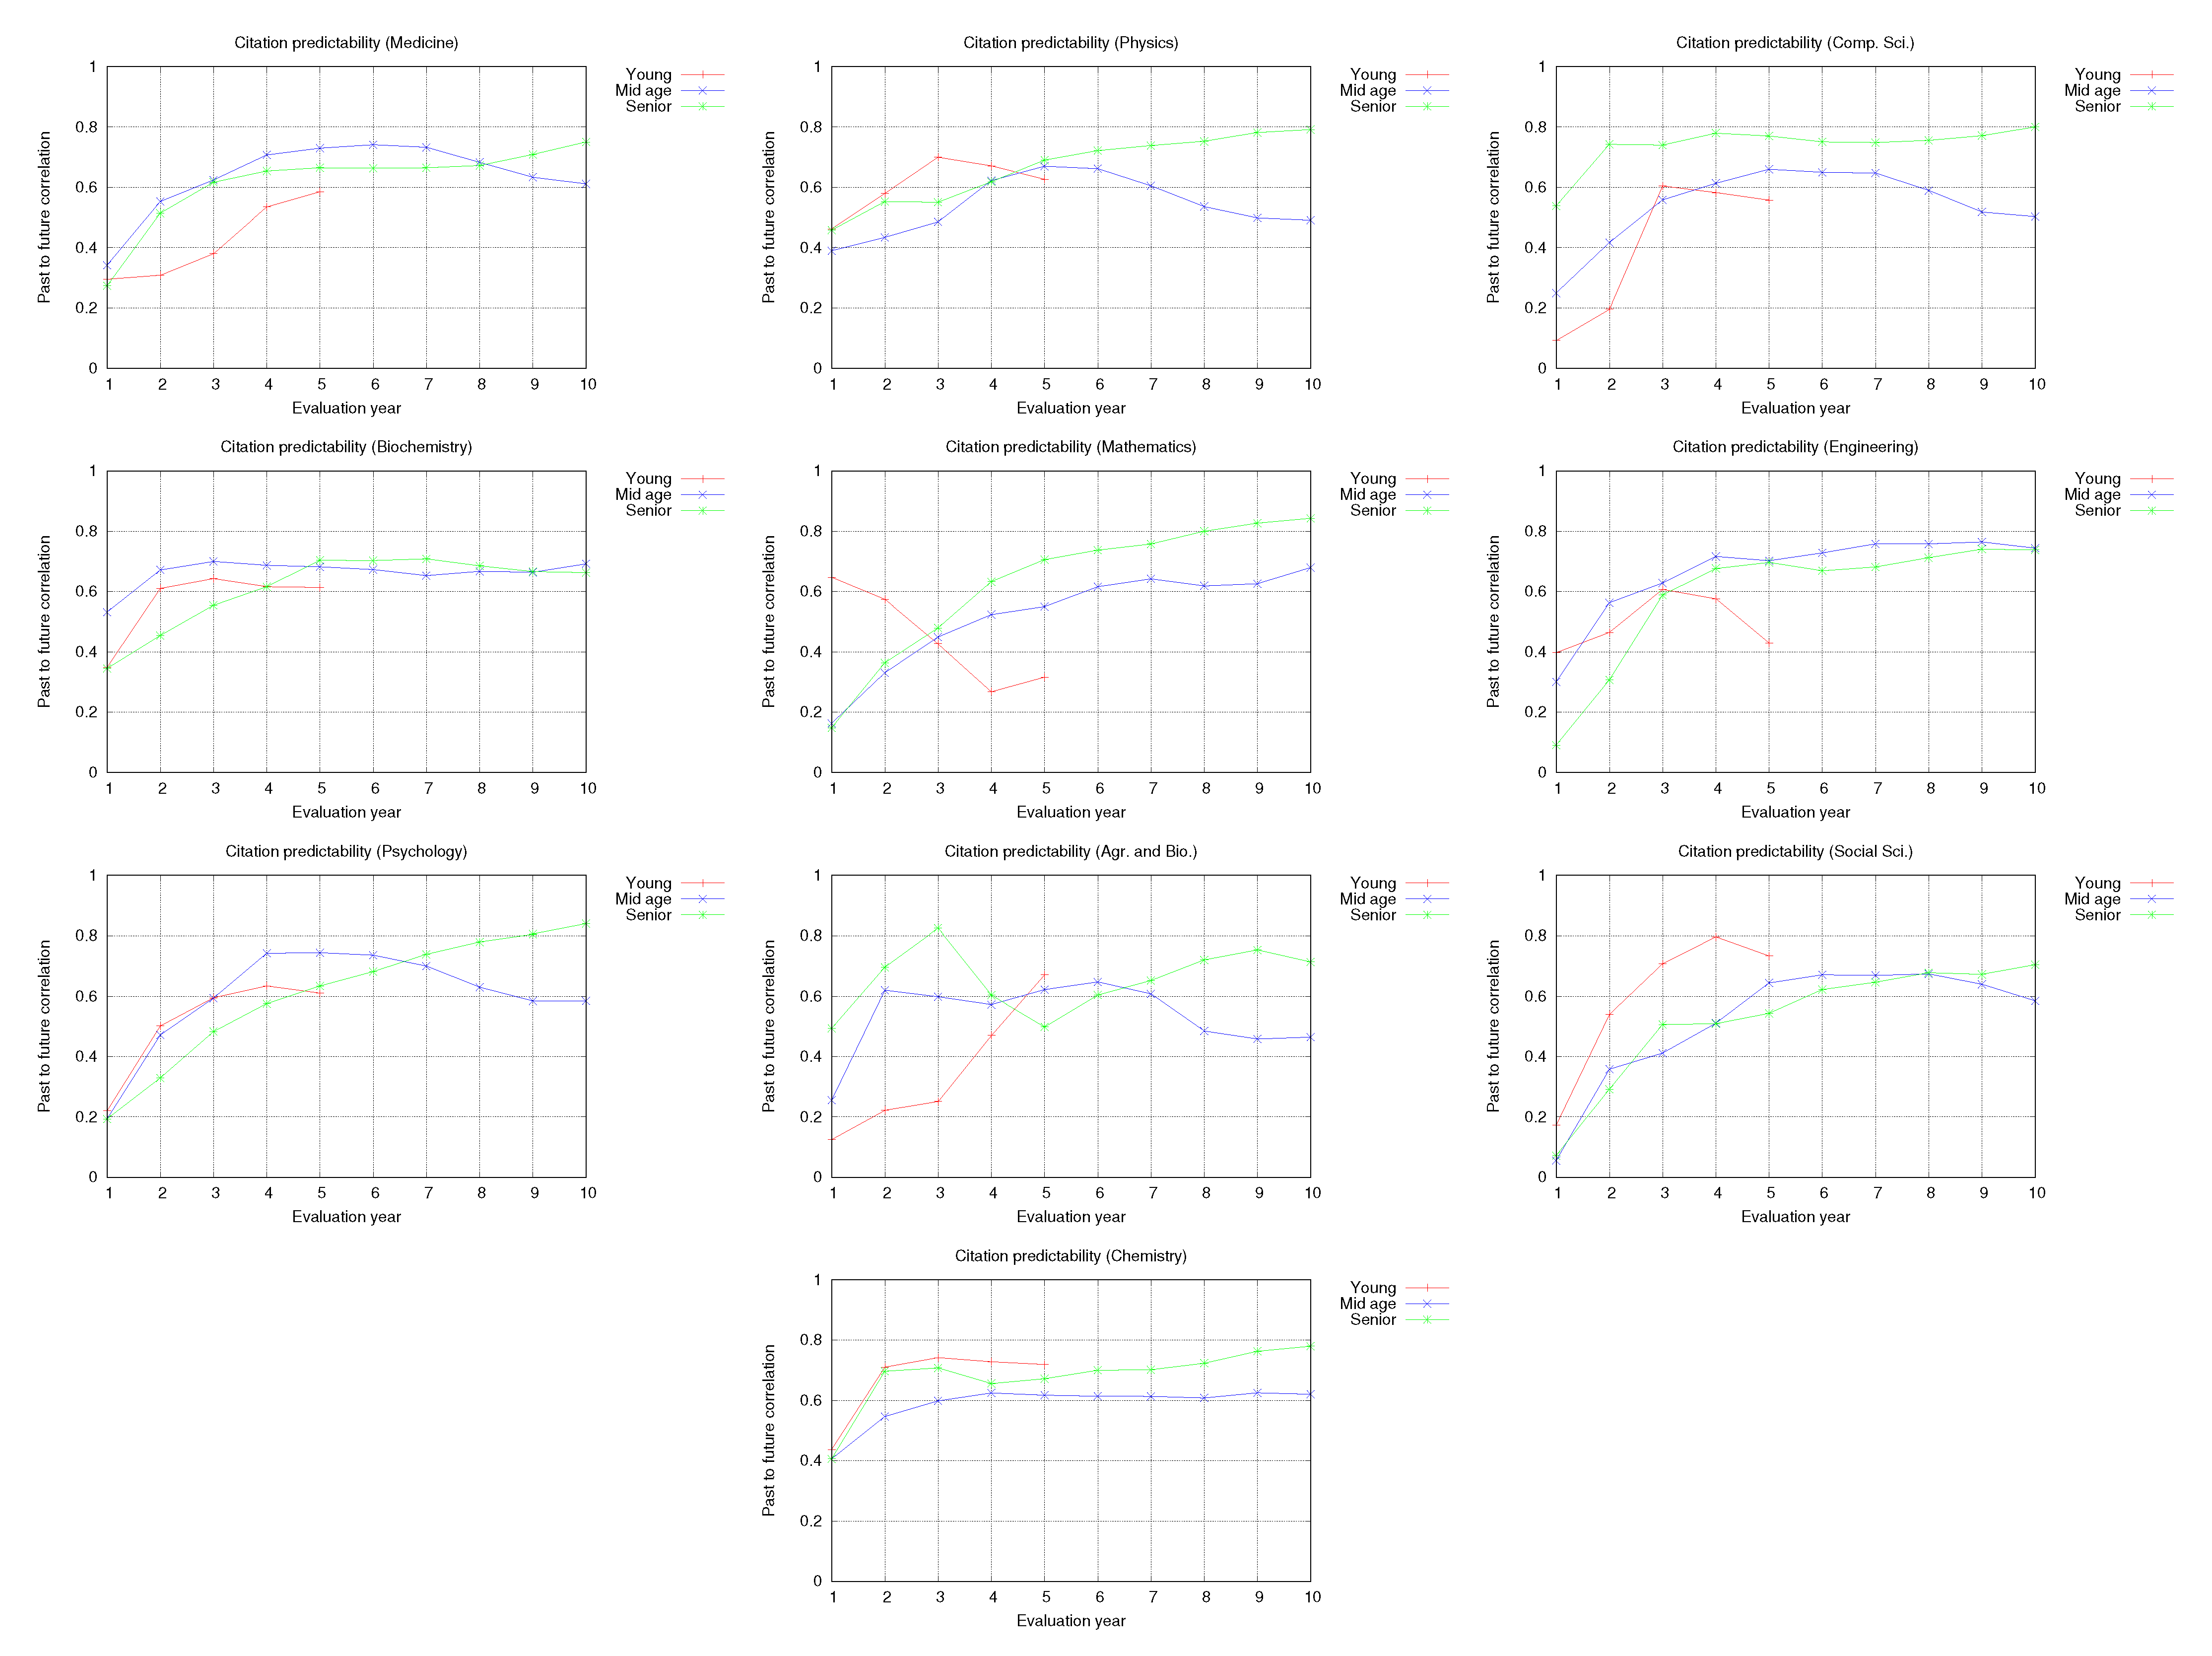
To analyze how sensitive the evaluation is concerning the year of the life span in which it is carried out, we repeated the previous analysis using sliding quinquenniums. If the evaluation is carried out in year
i, the five-year sliding period is set five years before and five years after
i. Then we measure the correlation between the sum of citations for both five-year periods. In this experiment, we span the evaluation year through the first ten years of the life span. The results are disaggregated by age group in
Figure 12.
Figure 12 shows that there are differences between areas. Concerning young researchers, Physics, Biochemistry, Engineering, Psychology, and Medicine show that between years 3 and 4, the correlation between past and future citations reaches its maximum value. Computer Science shows that the first two years of the life span are very uninformative for an evaluation, but in the third year, the correlation rises to 0.6. Both Social Sciences and Agricultural and Biological Sciences need a longer time to make a fair evaluation, requiring an observation window of at least four years for a young researcher. In Social Sciences, the fourth year is very informative, with a correlation of 0.8. Chemistry is the area in which the evaluation times could be shorter since high correlations are already observed between past and future citations from the second year. Mathematics is the most challenging area for young researchers, with the lowest correlation values between citations. When analyzing the mid-age and senior groups, all areas show an improvement in the correlation between past and future citations. In fact, in most areas, the correlation increases with the year of evaluation.
6. Discussion of Results
This study corroborates the intuition that there are notable differences in citation patterns between areas of knowledge. For example, the differences in citations to conference proceedings between Computer Science and the other areas are evident, as we showed in
Section 4. As conference proceedings are essential to Computer Science, representing a singularity concerning other fields, we need to discuss why this occurs in Computer Science and not in other areas. Each one of the areas of knowledge has different rationales for evaluating results, while the areas related to Social Sciences value the background knowledge, supporting the research on a solid connection with the theories and classical approaches of the area, Computer Science values much more the novelty and the relevance of a contribution for a given context. The contrast of both valuation rationales, one anchored in the theories tested and studied over decades, and the other with a vital component in technological innovation, makes the different peer review rationales more suitable for certain purposes than others, while a conference proceeding offers fast responses and wide dissemination of results, the review process of an article can be slower, releasing the times of dissemination of results and findings. Although many journals have reduced their response times, this study shows that there is still a high interest in Computer Science for publishing in conference proceedings. Furthermore, this study shows that no signs of diminishing interest are observed in these Computer Science publications.
While much of the effort in bibliometrics aims to establish indexes of scientific productivity with predictive capacity, we hypothesize that in Computer Science, the problem is not related to the productivity index used but to the indexed collection. As journal citation reports are only based on journal citations, the real impact of publications in Computer Science is highly distorted by not including publications in conference proceedings. Top-tier conference proceedings show high impact in Computer Science, and many citations are ruled out by only evaluating researchers’ careers based on journal impact indices. This observation from our study indicates that the effort to develop a single bibliometric index ruling all areas has been unsuccessful, introducing distortions in the analysis of scientific productivity. It seems to us that this approach should also be revised to incorporate the new challenges raised by the advancement of scientific research, which is strongly determined by inter and trans-disciplinary research.
This study covers a long period of observation, ranging almost five decades, in which many practices in the modes of publishing have changed. These almost five decades that the study has spanned reveal some essential facts, such as the invariance of specific publication patterns but the apparent changes these have witnessed. The growing volume of publications registered in the last two decades shows a more active and numerous scientific community, with a growing interest in peer-reviewed publications. However, the sheer volume of publications poses new challenges to young researchers, who must review many papers to identify related work. The bibliometric analysis given to some journals based on their impact indexes makes high-impact journals increase their visibility, revealing a rich get richer phenomenon. Often, the rich get richer phenomenon is reinforced by community practices or even by journal editors, who encourage citing journal articles as a primary source in their studies. As a consequence, a few journals concentrate the majority of citations, to the detriment of a large number of journals with poor visibility. This effect can affect new subspecialties, which publish their findings in new journals and, therefore, have less visibility. The increase in subspecialties has been evident mainly in Medicine and related sub-areas, leading to a massive volume of publications. At the risk of perishing, the need to publish makes many researchers seek to publish quickly, and from their sub-disciplines, publish in emerging journals, which their peers do not consistently recognize. The low visibility of these specialized journals would make many of these publications less likely to be cited.
This study also shows evidence that the life span of some publications is higher than five years. As many bibliometric impact indicators consider observation windows to capture citations less than five years, the actual impact of a publication in a journal may be underestimated. This finding reinforces the idea that current citation windows are extremely short, underestimating the impact of publications in journals from areas with slower publishing dynamics. This study highlights that 5-year windows are recommended to address this deficiency.
Limitations of this study. A study of this type, which covers almost five decades of observation, has some limitations to discuss. First, in nearly 50 years of observation, the study has considered some citation-based measures that can be affected by the passage of time. For example, younger disciplines, such as Computer Science, would have a lower volume of citations when studying citation dynamics over time since their research community is more incipient. Second, in general, the areas are generally compared in different stages of maturity, understanding that some classic areas, such as basic sciences, are in a higher stage of maturity than Computer Science. This fact may affect the comparison between areas, so a seasonally adjusted study according to the level of maturity would be more suitable to carry out a longitudinal comparison like the one in this study. The same observation applies to how the life-spans of researchers were calculated since it is understood that some more consolidated areas could have a more stable career model than emerging areas. A comparison by groups of similar areas according to a level of maturity might be more appropriate in this regard, which is left as future work. Third, as we discarded citations that came from areas not covered by the study, our study may underestimate the volume of citations in some areas. One way to address this limitation is to work on complete Scopus data to characterize the total number of publications and citations recorded in a given observation period. Finally, the construction of the dataset based on established researchers can introduce a bias in the data since the snowball crawling conducted from these authors would be mediated by the citation patterns that these types of authors have. Less established researchers are likely to follow different citation patterns, affecting the type of accounts retrieved by our Scopus account crawler. Despite this limitation and criticism, we believe that our sample represents a relevant and highly visible part of the Scopus data, which makes the study’s conclusions valid.


