Data Science Tools for Monitoring the Global Repository Eco-System and its Lines of Evolution


Abstract
1. Introduction
1.1. BASE as Repository Aggregator System
1.2. BASE and Its Role in the Repository Community
2. Materials and Background
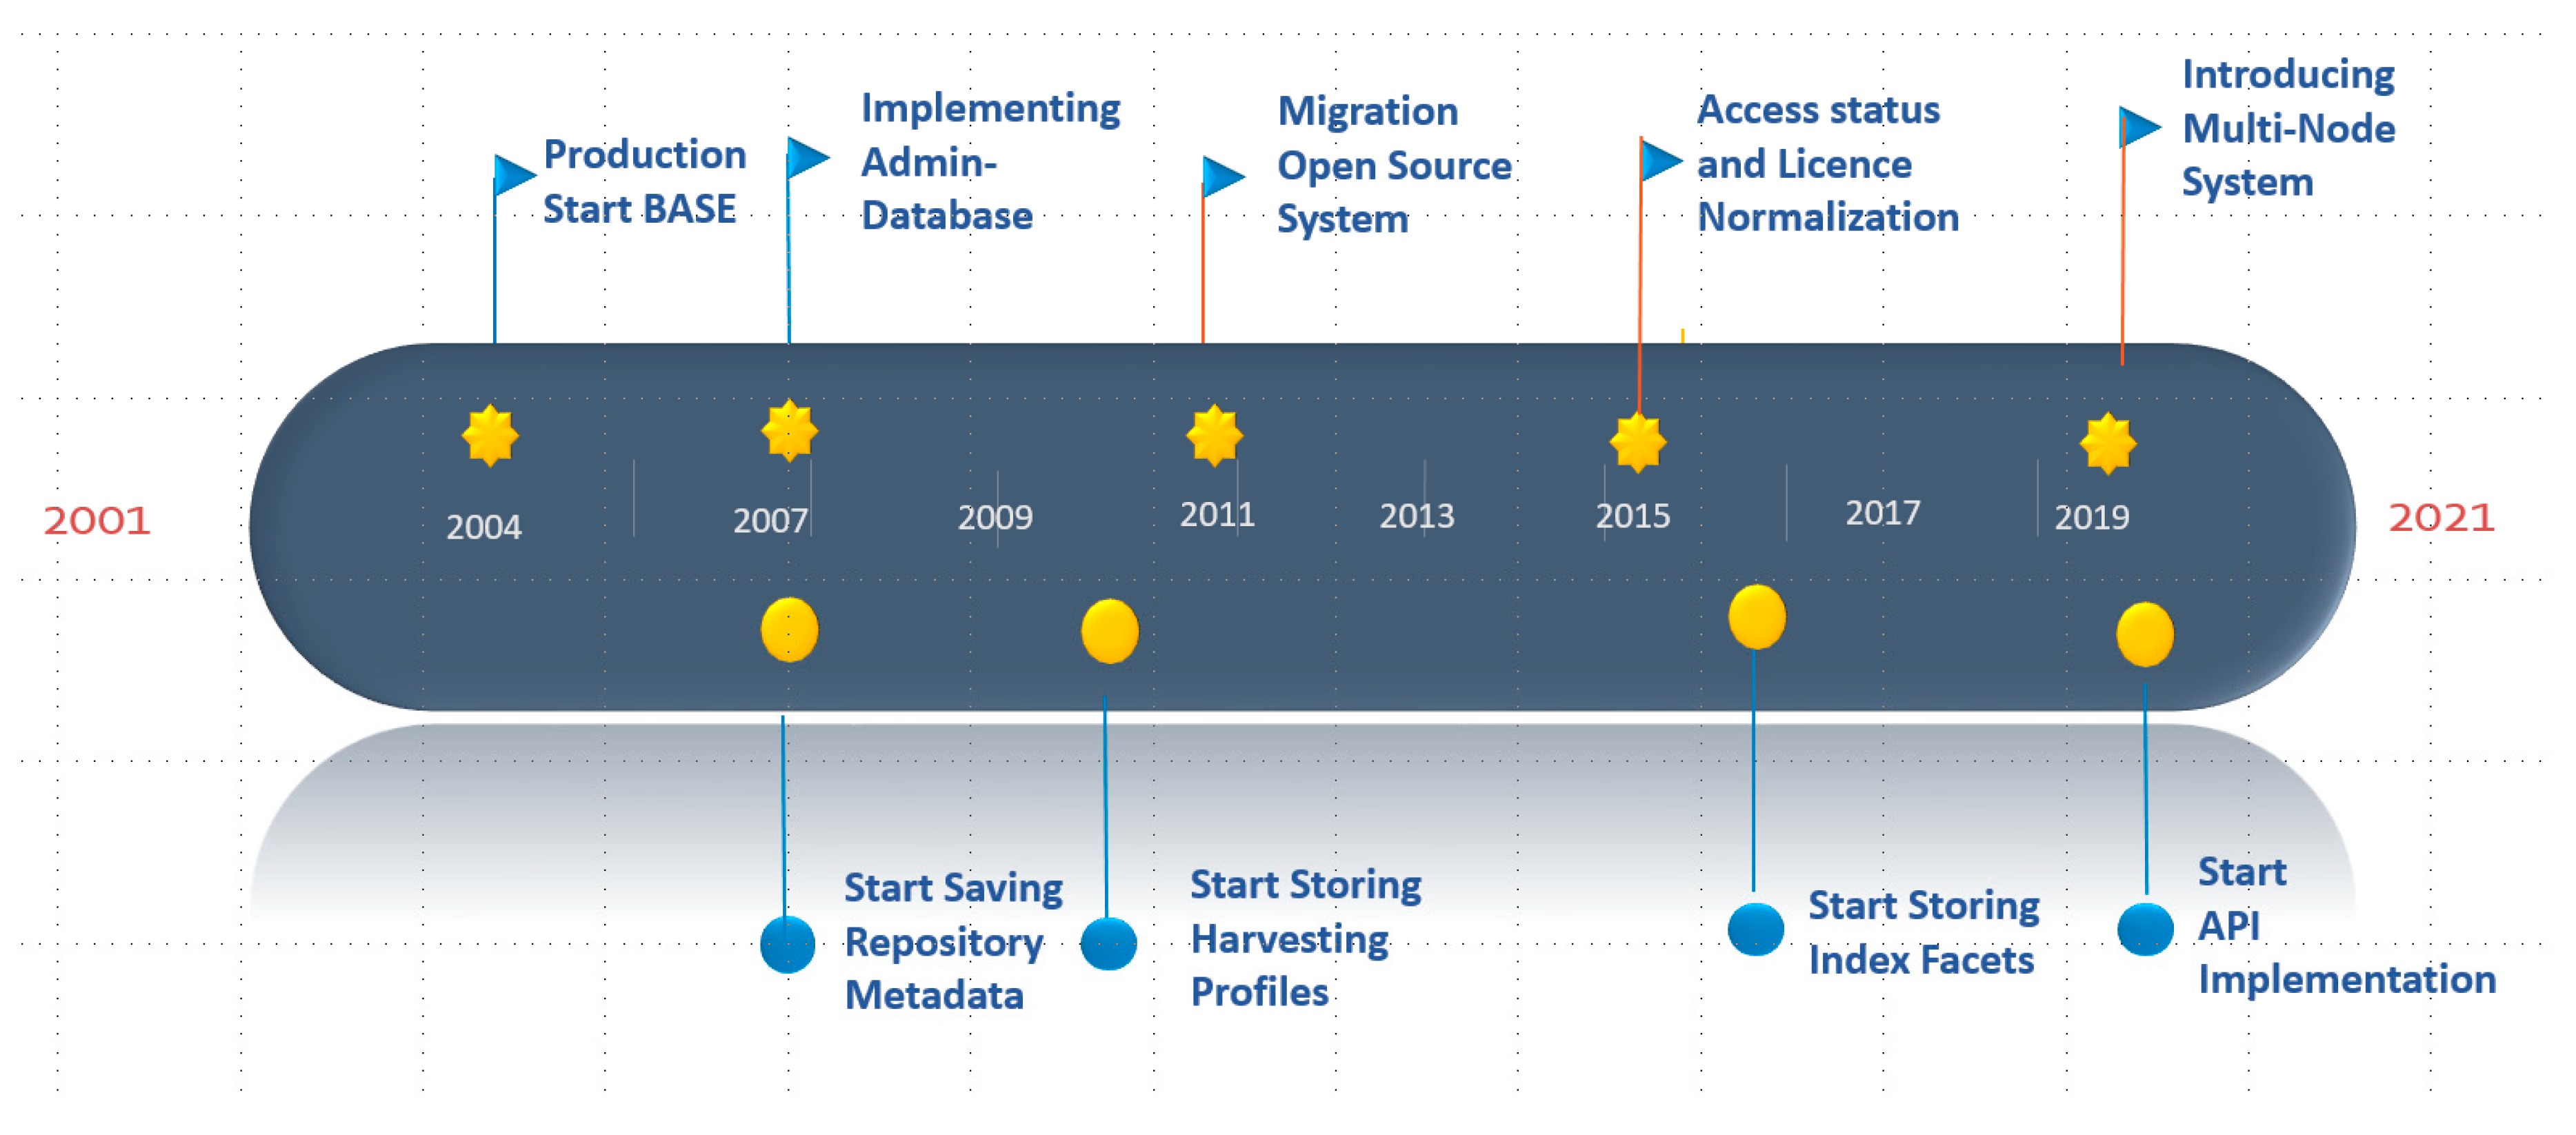
2.1. The Data Basis and its Pre-Processing
- Repository Metadata incl. common resource description;
- Harvested Metadata (for publications and related objects);
- Log Files of the harvesting processes;
- the BASE index.
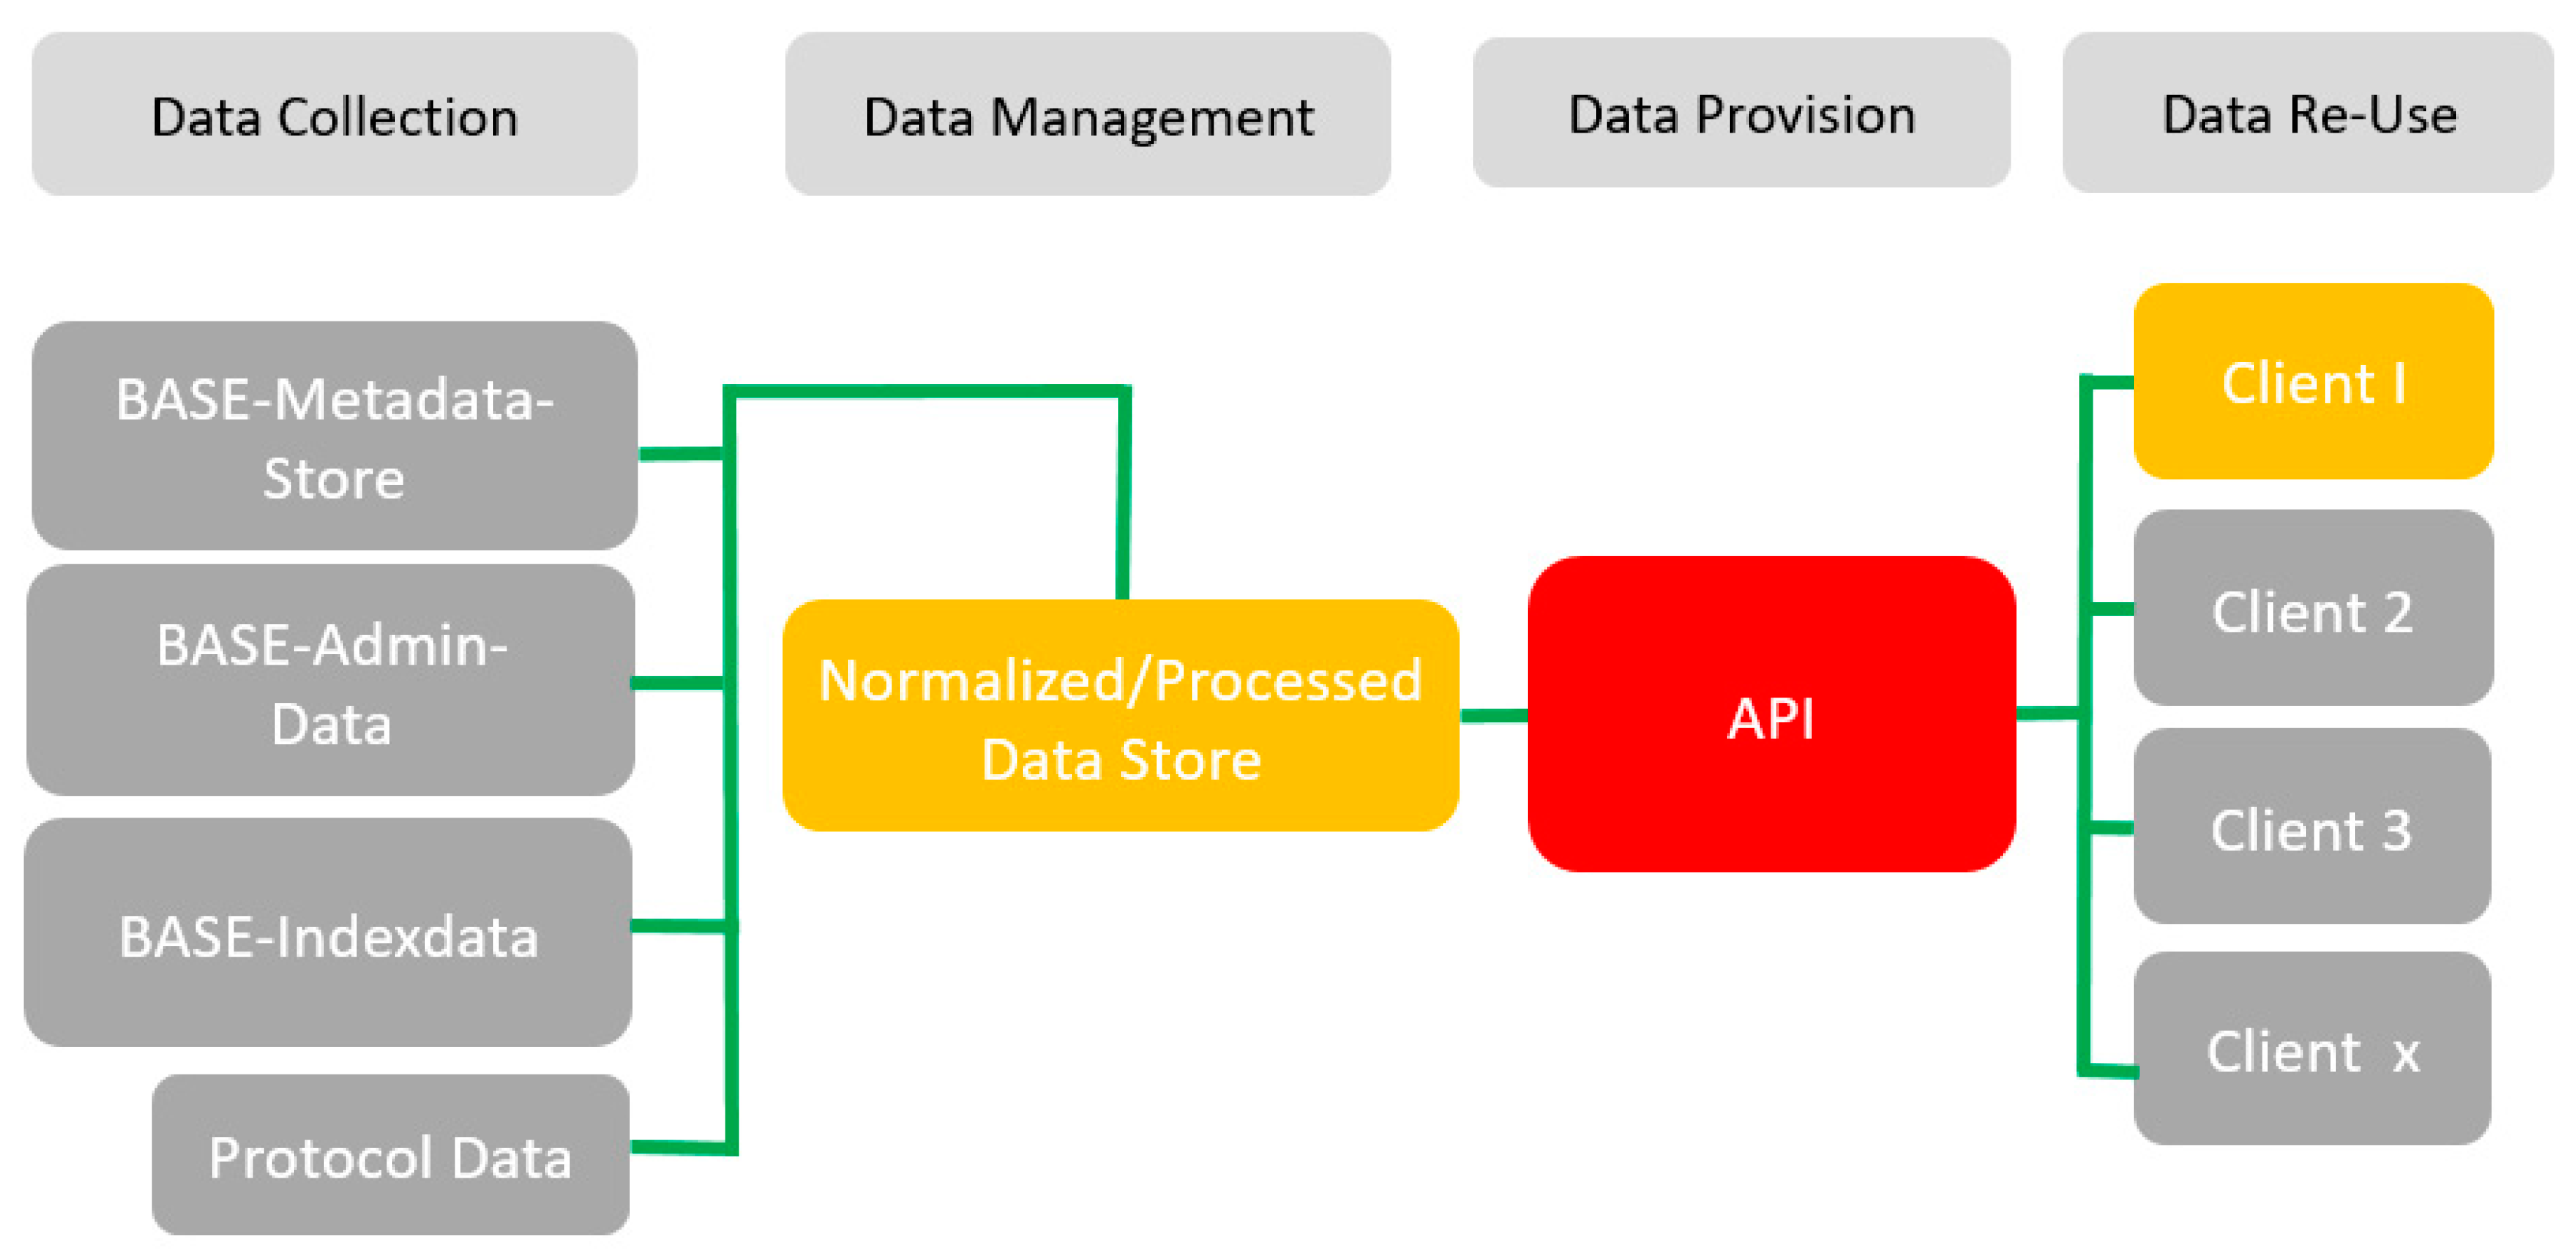
2.2. The Data Store
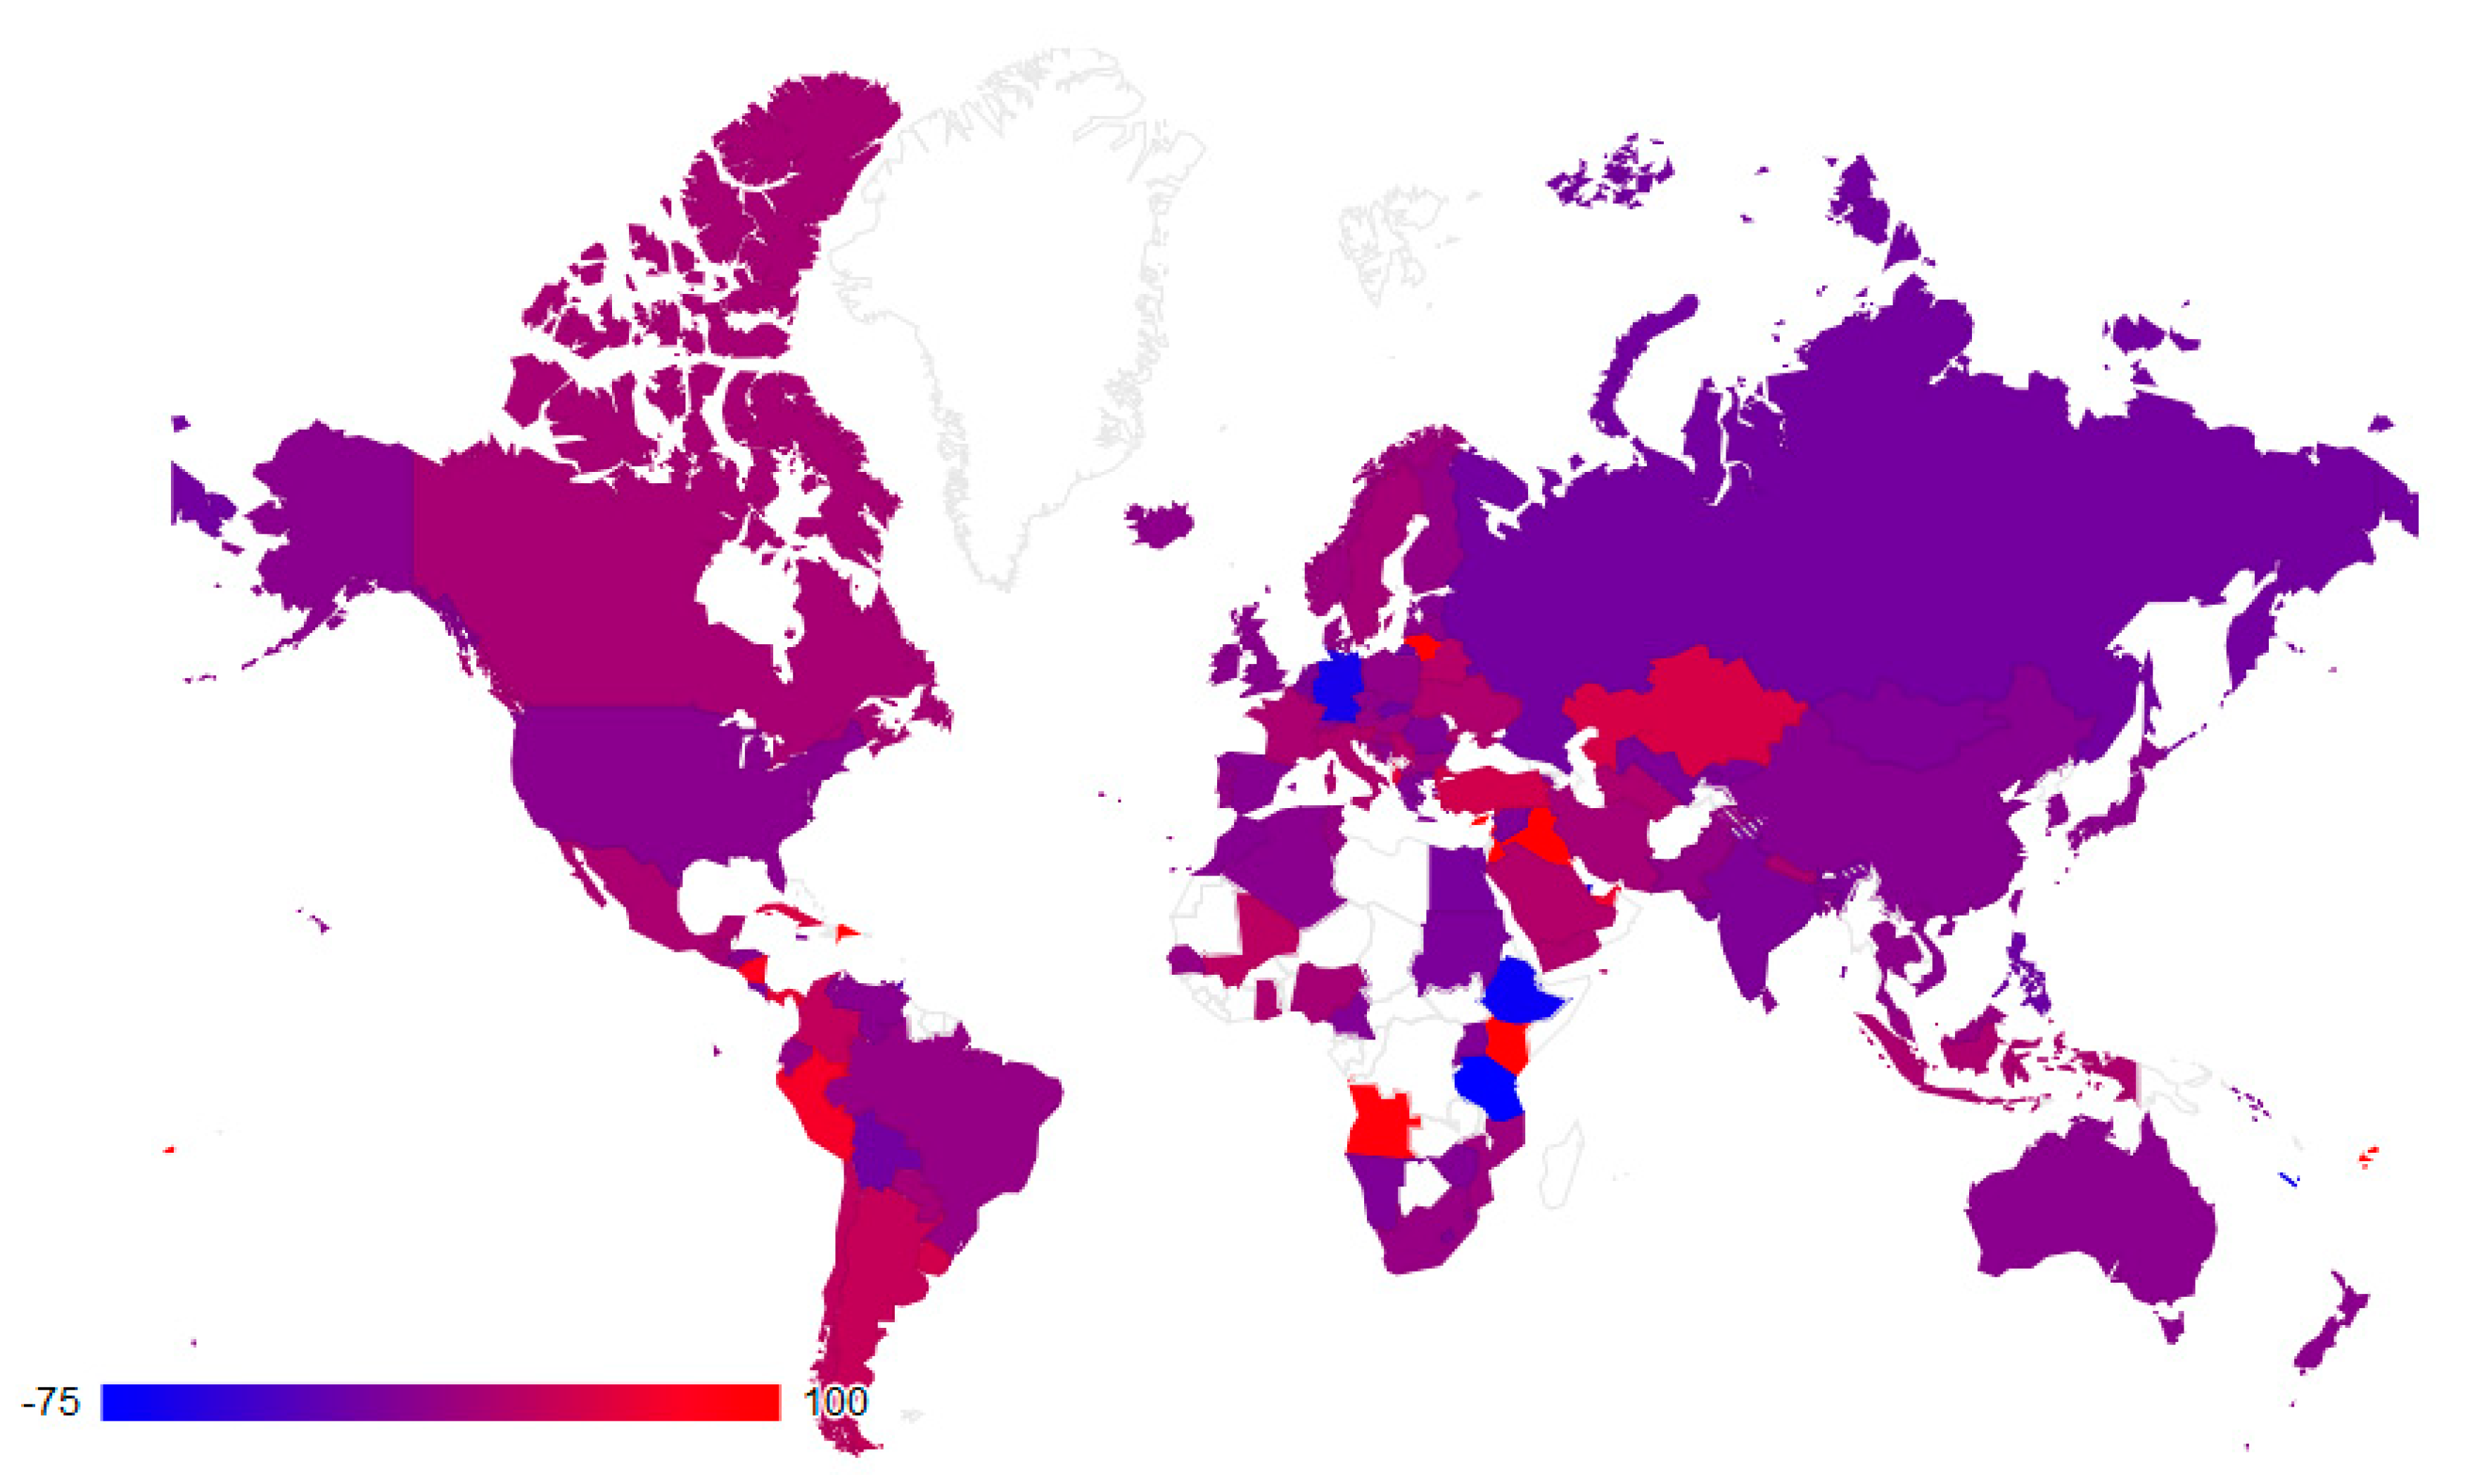
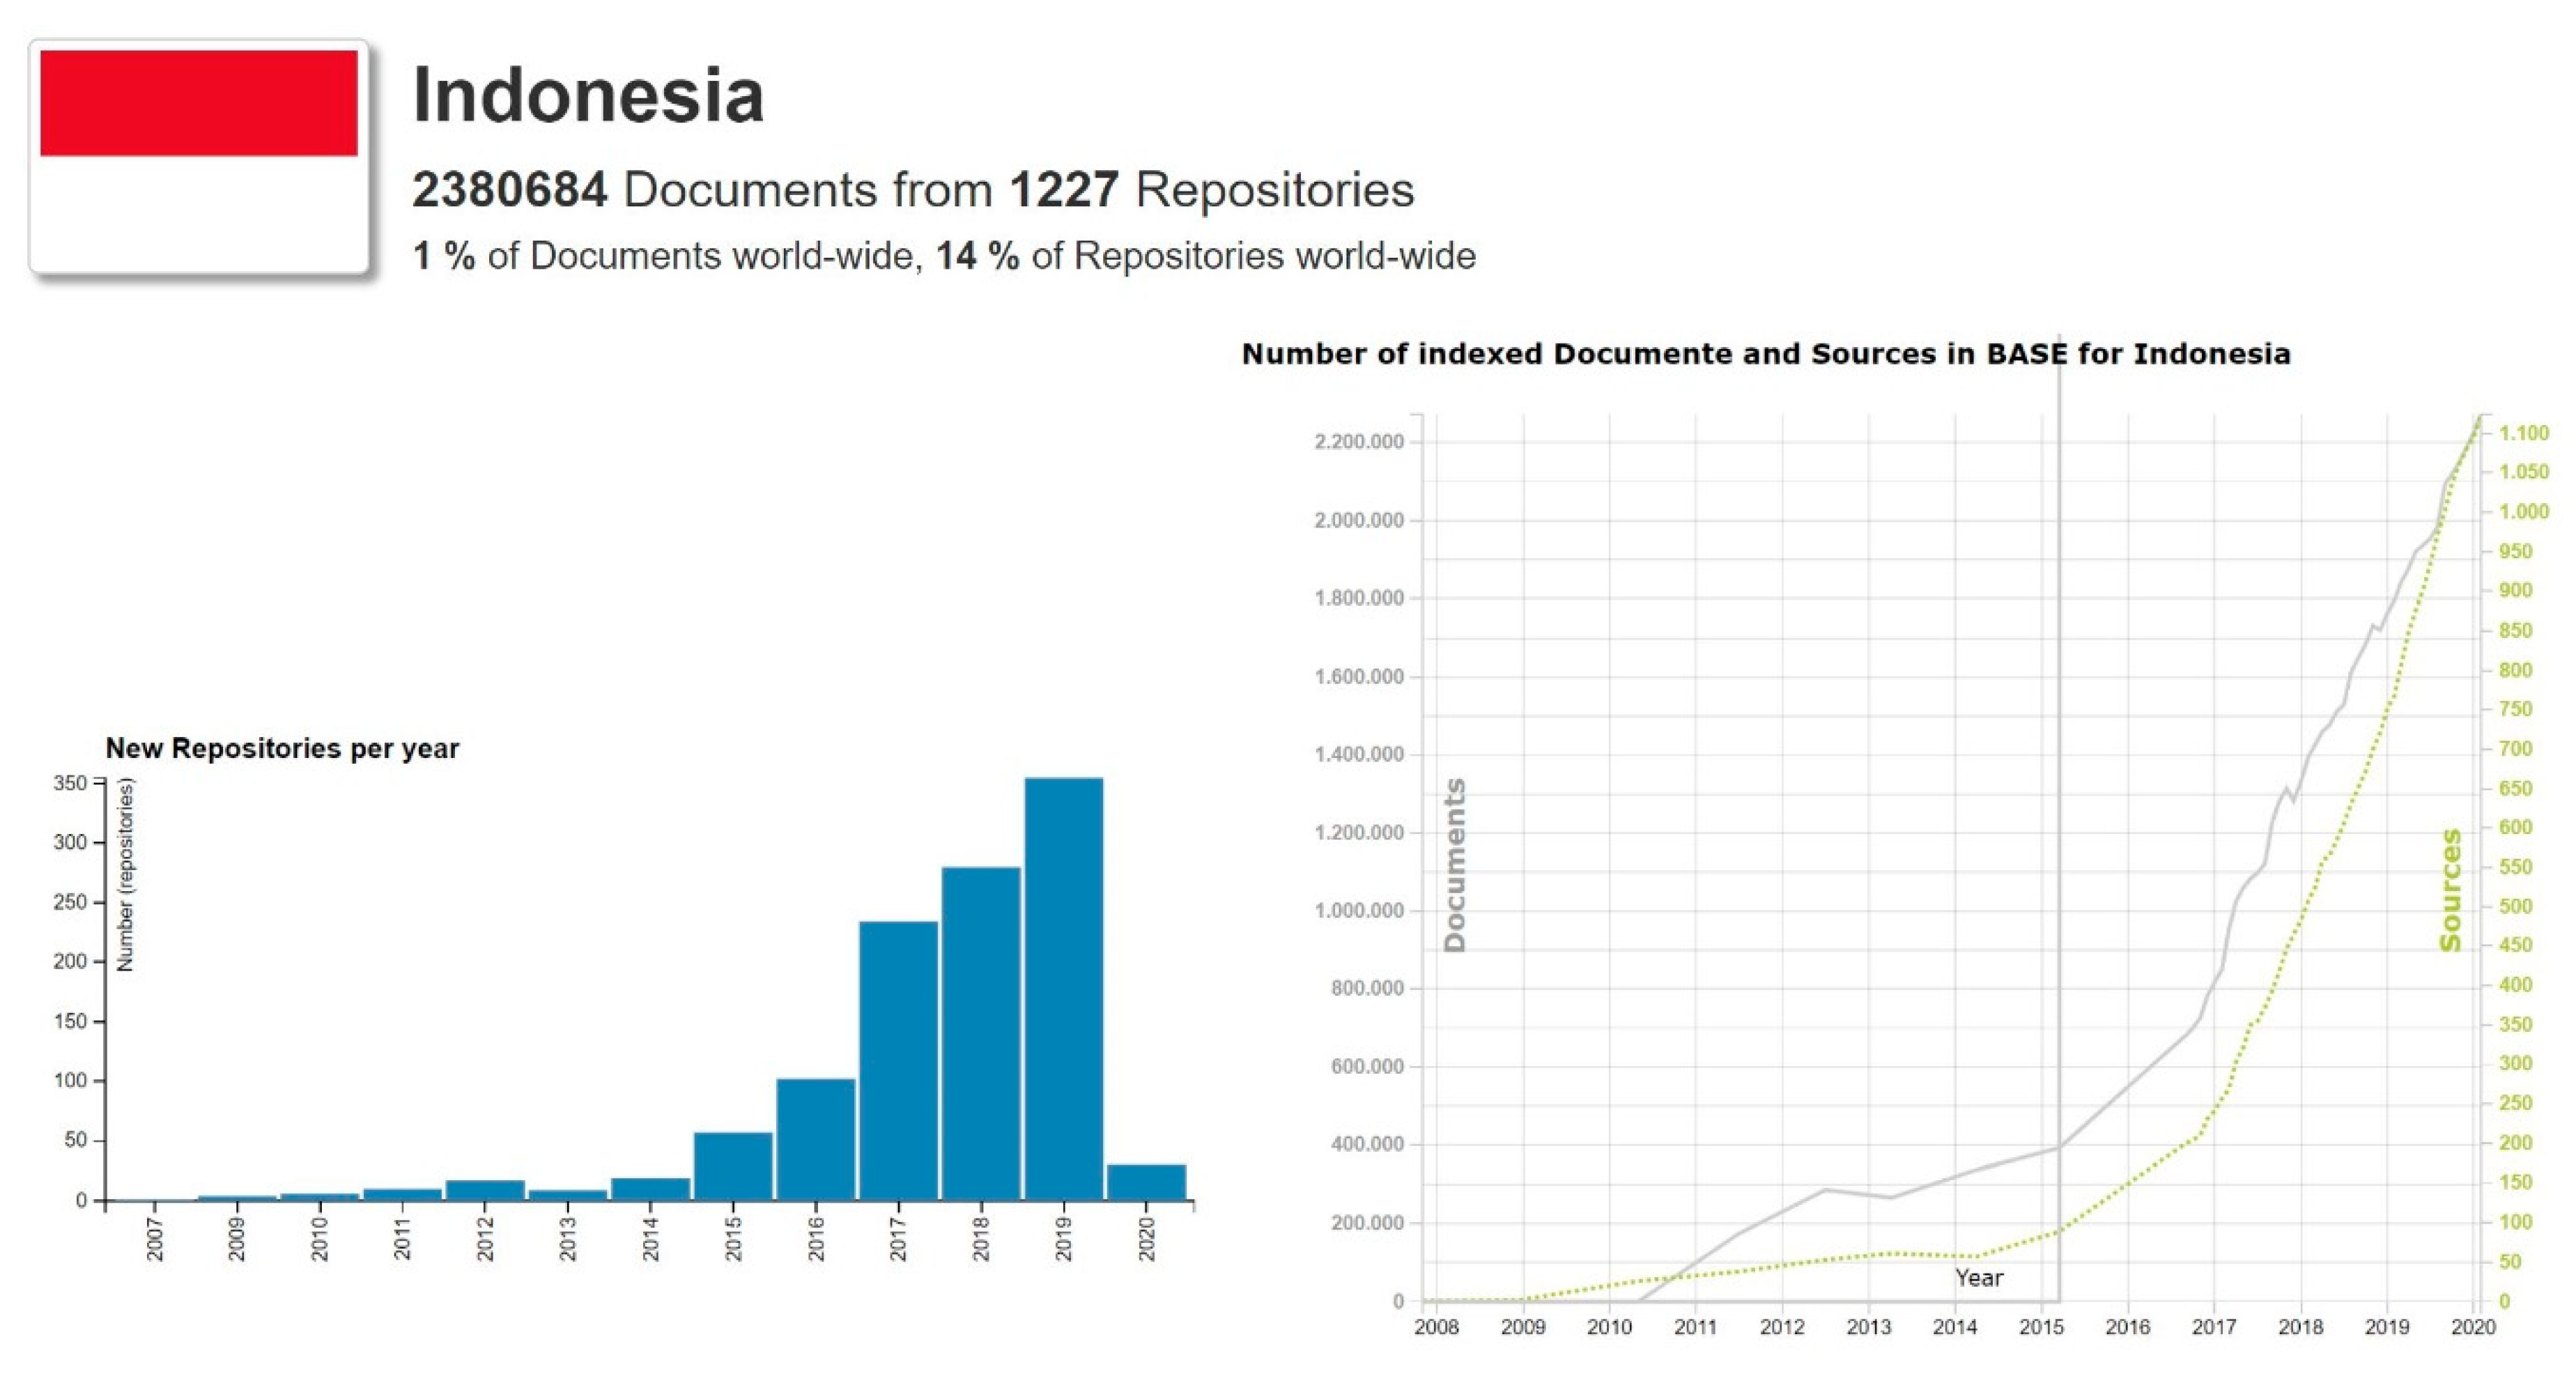
2.3. Visualization Tools
3. Outlook and Refinement of the API Layer
- Institutional/Organization (aggregating the repositories belonging to an institution);
- Country;
- Region (aggregating specific regional networks);
- Continent;
- Global.
4. Conclusions
Author Contributions
Funding
Conflicts of Interest
Abbreviations
| API | Application Programming Interface |
| BASE | Bielefeld Academic Search Engine |
| CC | Creative Commons |
| COAR | Confederation of Open Access Repositories |
| D3 | Data-driven documents |
| DDC | Dewey Decimal Classification |
| DINI | German Initiative for Networked Information |
| DOI | Digital Object Identifier |
| DRIVER | Digital Repository Infrastructure Vision for European Research |
| ISO | International Organization for Standardization |
| OA | Open Access |
| OAI-PMH | Open Archives Initiative Protocol for Metadata Harvesting |
| OECD | Organisation for Economic Co-operation and Development |
| OpenAIRE | Open Access Infrastructure for Research in Europe |
| OpenDOAR | Directory of Open Access Repositories |
| ORCID | Open Researcher and Contributor iD |
| REST | Representational State Transfer |
References
- Open Archives Initiative Protocol for Metadata Harvesting. Available online: http://www.openarchives.org/pmh/ (accessed on 13 February 2020).
- Summann, F.; Lossau, N. Search Engine Technology and Digital Libraries. D Lib Mag. 2004, 10, 10. [Google Scholar] [CrossRef]
- Pieper, D.; Summann, F. Bielefeld Academic Search Engine (BASE) An end-user oriented institutional repository search service. Libr. Hi Tech 2006, 24, 614–619. [Google Scholar] [CrossRef]
- Pieper, D.; Summann, F. 10 years of Bielefeld Academic Search Engine (BASE): Looking at the past and future of the world wide repository landscape from a service providers perspective. In Proceedings of the OR2015, 10th International Conference on Open Repositories, Indianapolis, IN, USA, 8–11 June 2015; Available online: https://pub.uni-bielefeld.de/download/2766308/2766316/or2015_base_unibi.pdf (accessed on 14 February 2020).
- Lösch, M.; Waltinger, U.; Horstmann, W.; Mehler, A. Building a DDC-annotated Corpus from OAI Metadata. J. Digit. Inf. 2011, 12. Available online: https://journals.tdl.org/jodi/index.php/jodi/article/view/1765/1767 (accessed on 20 June 2020).
- Dreyer, B.; Hagemann-Wilholt, S.; Vierkant, P.; Strecker, D.; Glagla-Dietz, S.; Summann, F.; Pampel, H.; Burger, M. Die Rolle der ORCID iD in der Wissenschaftskommunikation: Der Beitrag des ORCID-Deutschland-Konsortiums und das ORCID-DE-Projekt. ABI Tech 2019, 39, 112–121. [Google Scholar] [CrossRef]
- Feijen, M.; Horstmann, W.; Manghi, P.; Robinson, M.; Russell, R. DRIVER: Building the Network for Accessing Digital Repositories across Europe. Ariadne 2007. Available online: http://www.ariadne.ac.uk/issue/53/feijen-et-al/ (accessed on 17 March 2020).
- Europeana Cloud Project. Available online: https://pro.europeana.eu/project/europeana-cloud (accessed on 12 February 2020).
- OpenAIRE, an EC Funded Project, Grant Agreement No 777541. Available online: https://www.openaire.eu (accessed on 27 January 2020).
- Gusenbauer, M. Google Scholar to overshadow them all? Comparing the sizes of 12 academic search engines and bibliographic databases. Scientometrics 2018, 118, 177–214. [Google Scholar] [CrossRef]
- Directory of Open Access Repositories. Available online: https://v2.sherpa.ac.uk/opendoar/ (accessed on 21 January 2020).
- Tennant, R. Bitter Harvest: Problems & Suggested Solutions for OAI-PMH Data & Service Providers. Available online: http://roytennant.com/bitter_harvest.html (accessed on 6 February 2020).
- Tennant, R. Specifications for Metadata Processing Tools. Available online: http://roytennant.com/metadata_tools.pdf (accessed on 6 February 2020).
- Broschinski, C. Rechtenormalisierung in BASE: Ergebnisse aus dem EuropeanaCloud-Projekt. Kolloqu. Wissensinfastruktur 2015. [Google Scholar] [CrossRef]
- Summann, F.; Shearer, K. COAR Roadmap Future Directions for Repository Interoperability. In Proceedings of the COAR Confederation of Open Access Repositories, Göttingen, Germany, 14–16 April 2015. [Google Scholar] [CrossRef]
- Rodrigues, E.M.; Bollini, A.; Cabezas, A. Next Generation Repositories. Behaviours and Technical Recommendations of the COAR Next Generation Repositories Working Group. 2017. Available online: https://doi.org/10.5281/zenodo.1215014 (accessed on 14 February 2020).
- ’Plan S’ and ’cOAlition S’—Accelerating the Transition to Full and Immediate Open Access to Scientific Publications. Available online: https://www.coalition-s.org/ (accessed on 12 February 2020).
- Principles and Implementation|Plan, S. Available online: https://www.coalition-s.org/addendum-to-the-coalition-s-guidance-on-the-implementation-of-plan-s/principles-and-implementation/ (accessed on 12 December 2019).
- Charts|Google Developers. Available online: https://developers.google.com/chart (accessed on 11 February 2020).
- Bostock, M.; Ogievetsky, V.; Heer, J. D³ Data-Driven Documents. IEEE Trans. Vis. Comput. Graph. 2011, 17, 2301–2309. [Google Scholar] [CrossRef] [PubMed]
- Bostock, M. D3.js-Data-Driven Documents. Available online: https://d3js.org/ (accessed on 12 February 2020).
- ISO 639 Code Tables. Available online: https://iso639-3.sil.org/code_tables/639/data (accessed on 14 February 2020).
- Thalheim, B.; Schewe, K.D. Codesign of Web Information Systems. In Book Correct Software in Web Applications; Thalheim, B., Schewe, K.D., Prinz, A., Buchberger, B., Eds.; Springer International Publishing: Cham, Switzerland, 2015; pp. 293–332. [Google Scholar]
- Fielding, R.T.; Taylor, R.N. Architectural Styles and the Design of Network-Based Software Architectures. Ph.D. Thesis, University of California, Irvine, CA, USA, 2000. [Google Scholar]
- Hartig, O.; Pérez, J. Semantics and Complexity of GraphQL. In Proceedings of the 2018 World Wide Web Conference, Lyon, France, 23–27 April 2018; pp. 1155–1164. [Google Scholar]
- DataCite GraphQL API Guide. Available online: https://support.datacite.org/docs/datacite-graphql-api-guide (accessed on 8 April 2020).
- Querying DBpedia with GraphQL. Available online: https://medium.com/@sklarman/querying-linked-data-with-graphql-959e28aa8013 (accessed on 8 April 2020).
- SPARQL 1.1 Query Language for RDF. Available online: https://www.w3.org/TR/sparql11-query/ (accessed on 8 April 2020).


| Size | |
|---|---|
| Indexed Documents | 166.2 mil |
| Open Access Documents | 76.4 mil |
| Documents with CC Licences | 29.6 mil |
| Documents with DOIs | 49.6 mil |
| Documents with ORCID | 0.22 mil |
| Sources | 7888 |
| Countries | 135 |
| Storage Size Index | 2.5 Terabyte |
| Storage Size Metadata Store | 1.2 Terabyte |
© 2020 by the authors. Licensee MDPI, Basel, Switzerland. This article is an open access article distributed under the terms and conditions of the Creative Commons Attribution (CC BY) license (http://creativecommons.org/licenses/by/4.0/).
Share and Cite
Summann, F.; Czerniak, A.; Schirrwagen, J.; Pieper, D. Data Science Tools for Monitoring the Global Repository Eco-System and its Lines of Evolution. Publications 2020, 8, 35. https://doi.org/10.3390/publications8020035
Summann F, Czerniak A, Schirrwagen J, Pieper D. Data Science Tools for Monitoring the Global Repository Eco-System and its Lines of Evolution. Publications. 2020; 8(2):35. https://doi.org/10.3390/publications8020035
Chicago/Turabian StyleSummann, Friedrich, Andreas Czerniak, Jochen Schirrwagen, and Dirk Pieper. 2020. "Data Science Tools for Monitoring the Global Repository Eco-System and its Lines of Evolution" Publications 8, no. 2: 35. https://doi.org/10.3390/publications8020035
APA StyleSummann, F., Czerniak, A., Schirrwagen, J., & Pieper, D. (2020). Data Science Tools for Monitoring the Global Repository Eco-System and its Lines of Evolution. Publications, 8(2), 35. https://doi.org/10.3390/publications8020035