Article

Measuring Time-Dynamics and Time-Stability of Journal Rankings in Mathematics and Physics by Means of Fractional p-Variations

by
Antonia Ferrer-Sapena
1,*,†,
Susana Díaz-Novillo
2,† and
Enrique A. Sánchez-Pérez
3,†
1
Instituto de Diseño y Fabricación, Universitat Politècnica de València, 46022 Valencia, Spain
2
Florida Universitaria, Rey En Jaume I, 2, Catarroja, 46470 Valencia, Spain
3
Instituto Universitario de Matemática Pura y Aplicada, Universitat Politècnica de València, 46022 Valencia, Spain
*
Author to whom correspondence should be addressed.
All the authors contributed equally to this work.
Publications 2017, 5(3), 21; https://doi.org/10.3390/publications5030021
Submission received: 19 August 2017 / Revised: 14 September 2017 / Accepted: 18 September 2017 / Published: 21 September 2017

Abstract

:
Journal rankings of specific research fields are often used for evaluation purposes, both of authors and institutions. These rankings can be defined by means of several methods, as expert assessment, scholarly-based agreements, or by the ordering induced by a numeric index associated to the prestige of the journals. In order to be efficient and accepted by the research community, it must preserve the ordering over time, at least up to a point. Otherwise, the procedure for defining the ranking must be revised to assure that it reflects the presumably stable characteristic “prestige” that it claims to be quantifying. A mathematical model based on fractional p-variations of the values of the order number of each journal in a time series of journal rankings is explained, and its main properties are shown. As an example, we study the evolution of two given ordered lists of journals through an eleven-year series. These journal ranks are defined by using the 2-year Impact Factor of Thomson-Reuters (nowadays Clarivate Analytics) lists for MATHEMATICS and PHYSICS, APPLIED from 2002 to 2013. As an application of our model, we define an index that precludes the use of journal ranks for evaluation purposes when some minimal requirements on the associated fractional p-variations are not satisfied. The final conclusion is that the list of mathematics does not satisfy the requirements on the p-variations, while the list of applied physics does.

Graphical Abstract

1. Introduction

Journal rankings have become a basic tool for research and library management. The way in which they can be established are diverse and range from an agreement among a group of experts to a citation-based journal impact index. In any case, their use is a fundamental resource for committees and professionals in charge of decisions involving research assessment. An example of such issues is the procedure used by the Polish office of institutional research and assessment, whose performance-based research funding system is the so-called Comprehensive Evaluation of Scientific Units (CESU). In this case, the evaluation ranking is elaborated by a mixed procedure taking into account the bibliometric indices and the experts’ assessment (see [1,2]). The discussion of which is the best way to define a rank-based evaluation system is one of the most recurrent topics in information science and its applications to research management. It must be said that the interaction among impact factors, journal rankings, and research policy was inherent at the very beginning of the work of Eugene Garfield and the creation of the fundamental bibliometric tools (see [3,4]). Indeed, the easiest way of defining a journal ranking is by using a numerical index that measures some aspects of the chosen journals. These characteristics of the publications must be related to their scientific prestige. Impact factor type indices are normally used to evaluate the quality of the scientific production of researchers, universities, and research institutes. The advantages and limitations of this practice have been deeply analyzed in many papers (see [5,6,7,8]). Arguments against this use have been expressed from both the professional collective of experts in information science and groups of researchers that are negatively affected by this practice. The reader can find a great deal of literature related to this topic in specialized journals (see [9,10,11,12,13,14,15,16,17,18]). Additionally, some institutions and groups of research analysts have presented reports and conclusions about this topic—generally in the direction of showing the negative effects of the automatic use of bibliometric indicators in research evaluation; see for example the IMU report, San Francisco Declaration on Research Assessment (DORA), the Metric Tide 2015, and the Leiden Manifesto [19,20,21,22]. However, it must be said that some researchers consider that these criticisms on the metric-based systems must be analyzed in national contexts, since the usage of other procedures—such as peer-review-based systems—also has limitations. Indeed, it seems that the adequacy of any system needs to be examined in its national contexts to understand their motivations and design, as suggested in [23].
In general, often scientists do not agree with their use, while politicians and institutions that have to decide on the funding of scientific activity are open to using impact metrics in some cases. In general, as was clearly shown in [23], each country has developed its own method for research assessment, and a considerable effort has been put forth towards finding a convenient system in each national context. For example, the Spanish system for research evaluation is strongly based on impact metrics.
It seems clear that any tool for measuring scientific quality is in a sense arbitrary. However, there are some clear reasons for which this use is convenient, and sometimes necessary. For example, it provides an easy-to-handle criterion for the evaluation and comparison of single journals for library assessment, and of scientists and institutions for research assessment, which is also completely objective since it is based on an ordered list.

1.1. Measuring Stability of Journal Rankings

Consequently, it seems that some control procedure for the reliability of the impact tools must be developed in order to help improve their usage in research assessment. This motivates the present investigation, which has the following objective: to provide a “second-order" mathematical tool for measuring the plausibility of the use of a given (ordered) list of journals for evaluation of the quality of the scientific production. A general and exhaustive work has been recently published by Pajic [24], with the aim of analyzing all the aspects of stability of the more usual bibliometric indices. There, the reader can find a great deal of information on the subject and also the reasons why measures of stability are needed in order to use these indices for the purpose of research assessment and evaluation. An explanation of the previous initiatives regarding this question can be found in Section 3.2 of this quoted paper, where the general scheme of how to perform a mathematical tool for determining the stability is presented.
Pajić’s paper also stresses the need to account for the time dynamics of citation measures. This relevant fact was already evidenced in previous works, and has been remarked in current research papers on the modeling of impact measures for research evaluation, as can be seen in [25,26,27,28].
The order in the list is given by some impact criterion: for example, the Thomson-Reuters 2-year Impact Factor (JCR list), or the Scimago Journal Ranking (SJR list). Comparison of different journal rankings defined by an impact-based order is the topic of many works (see for example [29,30,31,32,33,34]). In particular, the evolution of the 2-year Impact Factor over the years and the stability of the values of single journals in the JCR lists has already been analyzed by several authors. We must mention the papers [35,36], in which the dynamics of the values of this index has been studied, showing its global behavior, including, for example, inflation through a long enough time period as a consequence of the growth of the size of the disciplines. Additionally, from the very beginning of the use of the impact factor for evaluation purposes, some redefinitions of this index have been proposed with the idea of assuring its stability (e.g., [37]).

1.2. A Specific Model for Ensuring the Plausibility of Journal Rankings

In this paper we will define a time-variation-measuring index for ordered lists of scientific publications, and we will show some positive and negative examples extracted from the Thomson-Reuters Impact Factor lists (JCR). We will show—with arguments based on a mathematical model and some statistical arguments—that some of these lists can be used for evaluation and other ones must not be used for this aim. Our mathematical construction concerns the measure of the stability of the time series of lists generated by the impact factor in a given scientific subject. Let us present the main ideas that support our model.
(1)
The prestige of a given journal for a scientific community is supposed to be relatively stable. At least, it must change following a long-term pattern.
(2)
The position of a journal in a prestige-based list may increase or decrease over a long period, but a great amount of fluctuations in it must be understood as an anomalous behavior.
(3)
Consequently, a lot of significant changes in the position of a journal in a list is not a plausible behavior. Such a fact must not be interpreted as a fail in the policy of the journal, but in the measuring tool.
(4)
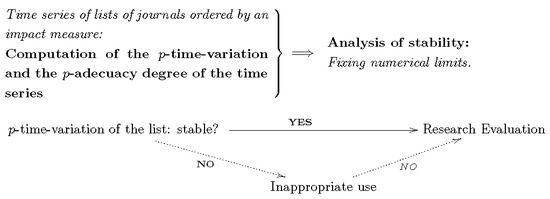
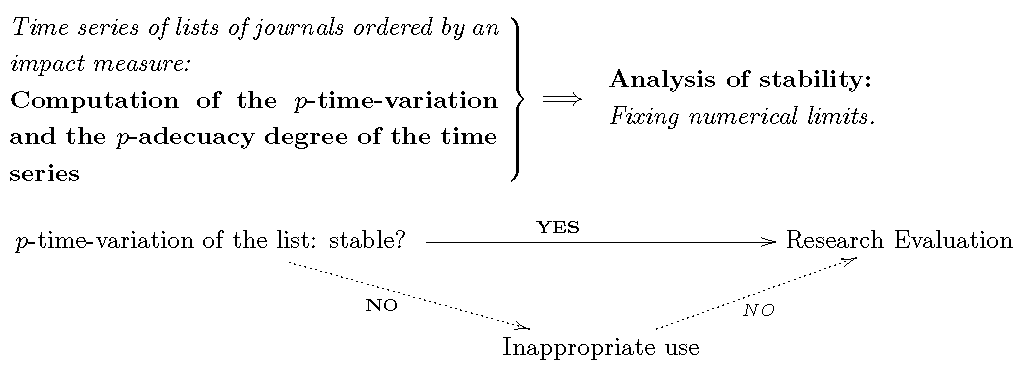
We obtain the following conclusion: an ordered impact list having an excessive rate of fluctuations in the positions of the journals must not be used as a proxy for the prestige of the journals in which the papers are published.
We will explain our ideas and some related examples in the following sections—the next one for the mathematical development and the third section for the applications—and we will finish with some conclusions. Although we will provide a rigorous formal explanation, we will also show concrete examples to help the reader understand our model.

2. Materials and Methods

In this section we introduce the main elements that are needed to define our mathematical model for measuring the time-dependent variation of an ordered list of journals. We will explain the mathematical tools for constructing the model as well as the sources of data for our test/main example. We define and analyze the main properties of an index for measuring the variation in the position of the items through a series of lists of journals that are ordered by an impact measure. In the second part, we present how this index must be used to establish a plausibility criterion for particular impact factor lists. The main examples we are thinking about are the series of the values of the last 11 years of the Clarivate Analytics (formerly Thomson-Reuters) 2-year Impact Factor list in two given scientific subjects—MATHEMATICS and PHYSICS, APPLIED—that will be analyzed in the Discussion section. We will write “mathematics” and “applied physics” in the rest of the paper for readability.
Before presenting our formal development, it must be said that models based on correlation indices or statistical parameters—standard deviation, variance, or other dispersion measures—have been considered in previous works—for example the ones presented in [38,39]. It must be mentioned here that in general these kinds of indices are not always considered to be useful, mainly for two reasons. First, the statistical nature of data in the citation analysis does not satisfy the standard requirements for a safe application of the usual methods. Second, their definitions and the procedure for computing them are too complex to allow an easy-to-handle analysis, which contradicts one of the main requirements for being a good bibliometric index (see [22]): the meaning of such an index must be more or less evident from the mathematical point of view in order to allow a direct bibliometric analysis.

2.1. p-Variations of Ordered Lists: Definition and Fundamental Properties

We use standard mathematical notation. We will write R for the set of the real numbers.
Definition 1.
Consider a list of scientific journals L of a particular scientific area. We say that a non-negative function I : L R is an impact measure if for a given journal j L , I ( j ) is a function of the number of citations that the papers of j receives from articles published in journals in a selected list C in certain fixed period of time.
Definition 2.
We say that the list of journals L is ordered by an impact measure I if given two journals j 1 , j 2 L , j 1 j 2 if and only if I ( j 1 ) I ( j 2 ) . In this case, we will call to the pair ( L ) an impact-ordered list of journals. In this case, we will say that L is an ordered list for short.
In what follows, we will define the p-variation index of a list of journals ordered by an impact measure as the normalized p-variation of a numerical value that indicates the position of a journal in an ordered list. We will use different norms of sequence spaces for doing the definition, producing a different index depending on a value 0 < p . Recall that the p-(quasi)-norm for a sequence ( a n ) n = 1 N is given by
( a n ) n = 1 N p : = n = 1 N | a n | p 1 / p
if 0 < p < , and
( a n ) n = 1 N : = max n = 1 , , N | a n | .
It must be noted that fractional indices for 0 < p 1 (for example p = 1 / 2 ) could be of special interest in the present setting. Let us briefly explain this point. Suppose that a journal accumulates a positional positive variation of 5 points during 6 years. A usual p-variation for p 1 gives a larger value if all of the variation is due to a large positional jump of 5 points in the first year than in the case where it changes one position year by year. Indeed, ( 5 2 + 0 2 + 0 2 + 0 2 + 0 2 ) 1 / 2 = 5 , while ( 1 2 + 1 2 + 1 2 + 1 2 + 1 2 ) 1 / 2 = 5 . However, it seems that the second evolution—one positional change each year—indicates a greater level of instability than the first one, since the position only changed one time in all five years.
In order to represent this, the value p = 1 / 2 gives a better option. In this case, the associated formula does not give a norm but a quasi-norm, and the values are ( 5 1 / 2 + 0 1 / 2 + 0 1 / 2 + 0 1 / 2 + 0 1 / 2 ) 2 = 5 and ( 1 1 / 2 + 1 1 / 2 + 1 1 / 2 + 1 1 / 2 + 1 1 / 2 ) 2 = 25 , following the expected behavior for an index reflecting the time-variation of a list.
It seems natural to use different values of p depending on the particular problem to be analyzed. Figure 1 provides a representation of the behavior of the functions depending on the value of p. We will use the function for p = 1 . However, for example, a natural confidence test of the stability of the order of a list is that the variation of any journal in the list must be smaller than a given value. This corresponds to the case p = .

2.2. The Test Example: Eleven-Year Series in Mathematics and Applied Physics

In order to check our model, we will analyze the time-variation index ( p = 1 ) and the adequacy of the 2-year impact factor series of lists of the subjects mathematics and applied physics. We will show two historical series of Thomson-Reuters (now Clarivate Analytics) 2-year Impact Factor lists of journals of the subjects mathematics and applied physics. It is a well-known fact that the impact factor-based ordering of the list of journals of the series mathematics is particularly unstable; this fact has been quantified and explicitly established in the recent study presented in [18].
We chose the time series from 2002 to 2013. The aim of this particular selection was to choose a series of lists that was already essentially stable. We observed that from 2002 on the set of journals appearing in the lists had no strong changes.
The idea was to compute the ordering number in both lists of the set of journals appearing in the complete historical series from 2002 to 2013. This ordering number is what is called the rank normalized impact factor, defined and studied in [29], and is defined to be the number that the journal occupies in the list, starting from below and normalized to 1.

3. Results

Since our results are both theoretical and experimental in nature, we will present them in two parts: the first one devoted to the mathematical construction and the second one for showing the data collected about our test example.

3.1. The p-Fractional p-Variation and the p-Adequacy Degree of a Time Series

In what follows, we show the main formal development of the paper: the construction of a stability criterion for a series of ordered lists of journals. In fact, we will provide two indices giving information about different aspects of the problem. We explain a concrete way of defining an index measuring the time-variation of a series of ordered lists. We fix 10 changes of year in order to ensure we have a long enough time series. Thus, take an eleven-year series S of related lists of journals ordered by an impact measure ( ( L n , n ) ) n = 1 11 , where each of these lists contains a variable number of journals with a large common subset appearing in all of them. We are thinking, for example, of the case of 11 lists of a fixed Journal Citation Reports subject corresponding to consecutive years.
We define the complete list associated to the series S as
L S = n = 1 11 L n .
From this point on, we consider the lists L n L S , each one with the order inherited from the original list L n . For simplicity, we preserve the notation L n for the new restricted list.
Fix 0 < p . If n { 1 , 2 , , 11 } , for each element j L n , we write j ( n ) 0 for the natural number indicating the position of the journal j in the list L n , starting from the lowest journal, and j ( n ) for its normalized value; that is,
j ( n ) = j ( n ) 0 / N S ,
where N S is the number of journals in L S .
We define the (normalized) fractional p-variation v p ( j ) of a journal j L S ( 0 < p ) by
v p ( j ) : = ( j ( n + 1 ) j ( n ) ) n = 1 10 p ( 10 ) 1 / p .
Definition 3.
We define the p-time-variation index P I p ( j ) of a journal j L S as the fractional p-variation v p ( j ) of j. We define the p-time-variation index P I p ( S ) of an eleven-year series of ordered lists S as the mean of the fractional p-variations of all the journals in L S ; that is,
P I p ( S ) : = j L S v p ( j ) N S ,
where N S is the total number of journals in L S .
As an example, for the aim of accepting or rejecting an eleven-year series of lists S as the ones above, we can consider the (upper) limit 0.1 for the value of this index. This implies that the mean value of the jump in the order index of a journal in the list in a year is smaller than 10 % , which makes it relatively stable as a evaluation tool for research assessment. For simplicity, we will mainly consider the case p = 1 in the examples and applications in further sections of this paper.
Take an ordered based partition { P i : i = 1 , 2 } of the last list of a series S of ordered lists of a given scientific field as considered in the previous section, such as the one given, for example, by the tertiles or the quartiles.
We define the following general suitability criterion, based on a simple relation between the size of the partitions that are chosen for performing an evaluation process and the p-time-variation index. Let T be the natural number in which the final list L 11 is divided for the purpose of evaluation. As we already said, usual partitions are in tertiles ( T = 3 ) or quartiles ( T = 4 ).
The following index gives a measure of how many journals in a given list change their positions with respect to the partition; for example, if T = 3 , the index gives an idea of how many journals jump from a tertile to a different one. We use the corresponding p-time-variation index to define it.
Definition 4.
We say that the p-adequacy degree for a series S of ordered lists for a T-fold partition is
k p , T ( S ) = 100 × 1 ( T 1 ) × P I p ( S ) .
Take p = 1 . The parameter k 1 , T ( S ) is obtained to be a simple estimate of the probability that a given journal jumps to a different element of the partition given by T (tertile, quartile). Since there are T 1 changes of elements of the ordered partition, a uniform distribution of a journal in a position makes it change P I 1 × N S positions in the list as a mean. As a result, for each change, there are P I 1 × N S / 2 journals that go from the element above to the element below, and the same number go from the element below to the one above. Summing up all the changes of elements, it produces a reasonable estimate of the probability of change of ( T 1 ) × P I p ( S ) ; the % of the complementary event gives the p-adequacy degree. Given an eleven-year series of ordered journals, if k 1 , T ( S ) = k , we will say that the last list of the series L 11 is 1-adequate (or simply adequate) for the partition given by T at a level k % .
Example 1.
Let us explain a formal example to show how this concept works. Assume that the partition is defined by the quartiles (i.e., T = 4 ). Consider a standard list of 100 journals with a normalized 1-variation v 1 ( j ) = 0.05 for all of them; this corresponds to a mean of changes of 5 positions in the list for each journal and for each year. If we also assume that all the lists L 1 , L 2 , , L 11 in the series S contain the same journals, this gives a 1-time-variation index
P I 1 ( S ) = j L 11 v 1 ( j ) 100 = 0.05 .
Consequently, we have that
k 1 , 4 ( S ) = 100 × 1 ( T 1 ) × P I 1 ( S ) = 100 × 1 ( 4 1 ) × 0.05 = 85 % .
Therefore, the list L 11 is 1-adequate for quartiles at a level 85 % .
The inverse formula relating k p , T and P I p ( S ) is
1 k p , T 100 1 T 1 = P I p ( S ) ,
and can be used to solve the inverse problem, which is the limit value of the p-time-variation index for having a p-adequacy degree bigger than a given value. For example, if we want a degree k 1 , 4 of at least 90 % for a partition in tertiles ( T = 3 ), we have that the time-variation index P I 1 ( S ) must be smaller than 0.05 , since
1 90 100 1 3 1 = 0.05 .
Remark 1.
Some fundamental properties of the time-variation index are obvious direct consequences of the definition. For instance, it does not depend on the subject that is being considered or the mean citation number in each scientific discipline. The reason is that it is using a rank normalized impact factor, and so the index does not depend on the absolute value of the impact factor, but on the order induced in the list normalized to 1.
Although the time-variation index can be interpreted as a probability (having values from 0 to 1), the adequacy degree is given as a percentage and has a clear meaning as a rate of journals that changes from a subset to the chosen partition to another adjacent subset.
Further developments on the statistical and probabilistic meaning of both parameters defined here would imply a more difficult explanation. However, simplicity is a fundamental property for a bibliometric indicator; see for example point 4 in the Leiden Manifesto ([22]). Actually, our new indices are performed to satisfy most of the requirements presented in the Manifesto for becoming convenient indicators (see also point 6 of the Manifesto).
Example of application to curricula vitae (CV) evaluation. To finish this section, let us explain a different application using the indices presented here to introduce a confidence interval in the evaluation of single curricula vitae. As we have explained in the previous sections, the main application of our results is to provide a criterium for rejecting the use of a particular impact list. However, it can also be used for rejecting the result in case that an automatic evaluation using such a list gives an unreliable result. Assume that such an evaluation procedure based on the use of the 2-year Impact Factor has been chosen by a research institute. In order to simplify the comparison, consider the problem of having just a pair of candidates for a given position in a research institute. Suppose that we have a simple system for evaluating the papers of both candidates consisting of giving 5 t points for each paper published in a journal that is in the quartile t of the list of the last year of a series S (recall that we call the first quartile to be the top one). Suppose that the adequacy degree of the list (for quartiles) is k 1 , 4 = 66.6 % . Let us consider two cases.
(a)
Suppose that Candidate 1 has published three papers in journals that are in the first quartile and one in the fourth, and Candidate 2 has published six in the second quartile. The marks that they get are 13 (Candidate 1) and 12 (Candidate 2), and so the institute will contract Candidate 1. However, using the probabilistic interpretation that we give to the index, we know that the lowest value that Candidate 1 should get is 2 × 4 + 1 × 3 + 1 = 12 , and the upper value for Candidate 2 should be 4 × 2 + 2 × 3 = 14 . Consequently, the institute cannot distinguish among both candidates using this system, and must find another procedure.
(b)
Consider now a different situation. Suppose that Candidate 1 has published six papers in journals that appear in the fourth quartile. The evaluation system gives 6 × 1 = 6 . The value of k 1 , 4 indicates that two of the six papers should be in the third quartile, and so the biggest mark obtained with the evaluation system should be 4 × 1 + 2 × 2 = 8 .
Suppose also that Candidate 2 has published five papers in the second quartile. The system provides a mark equal to 10 for their papers. Then the probabilistic interpretation of k 1 , 4 gives that the lowest mark should be greater than or equal to 3 × 2 + 2 × 1 = 8 . Summing up the comments on the evaluation of both candidates, we obtain that the greatest possible mark for Candidate 1 equals the smallest possible mark for Candidate 2, and so the comparison of the confidence intervals gives that the result can be accepted, since the intersection of both of them is empty. Thus, the institute should propose Candidate 2 for the position. Although this is still an automatic evaluation—and so is by definition against the “good usage” rules for metric tools—at least it agrees with a stronger filter, ensuring a safer result than the one given by the direct comparison of marks.

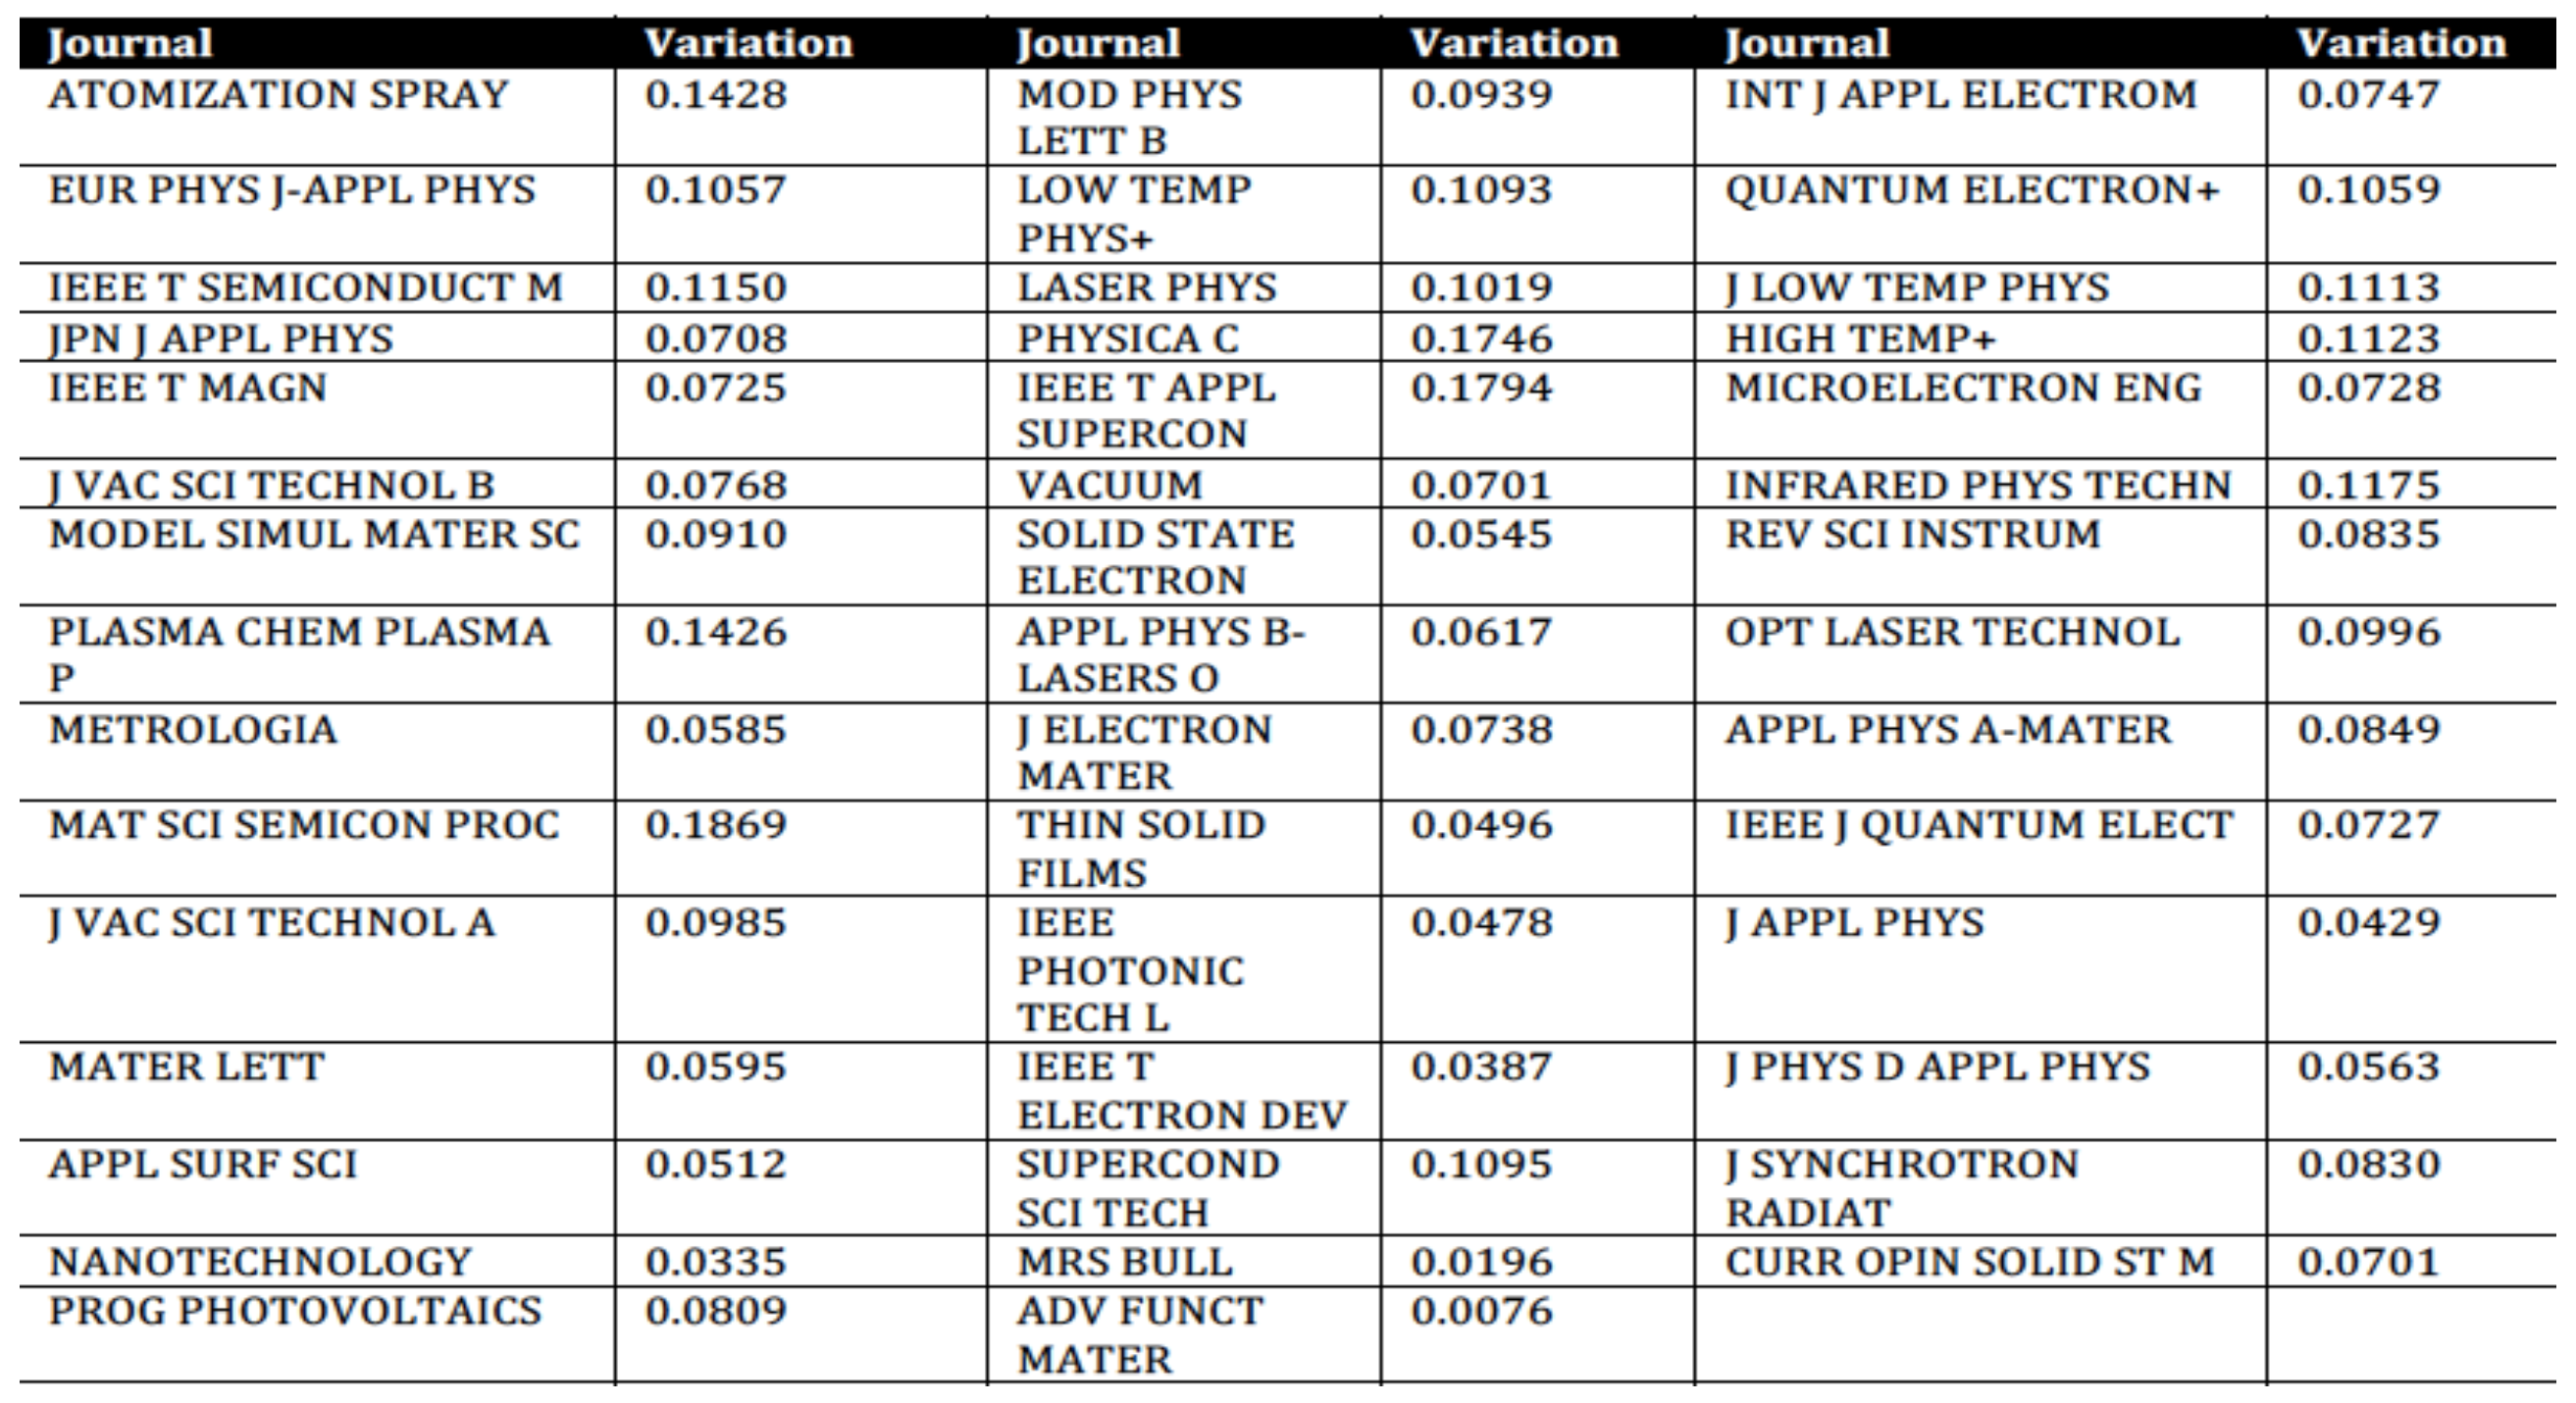
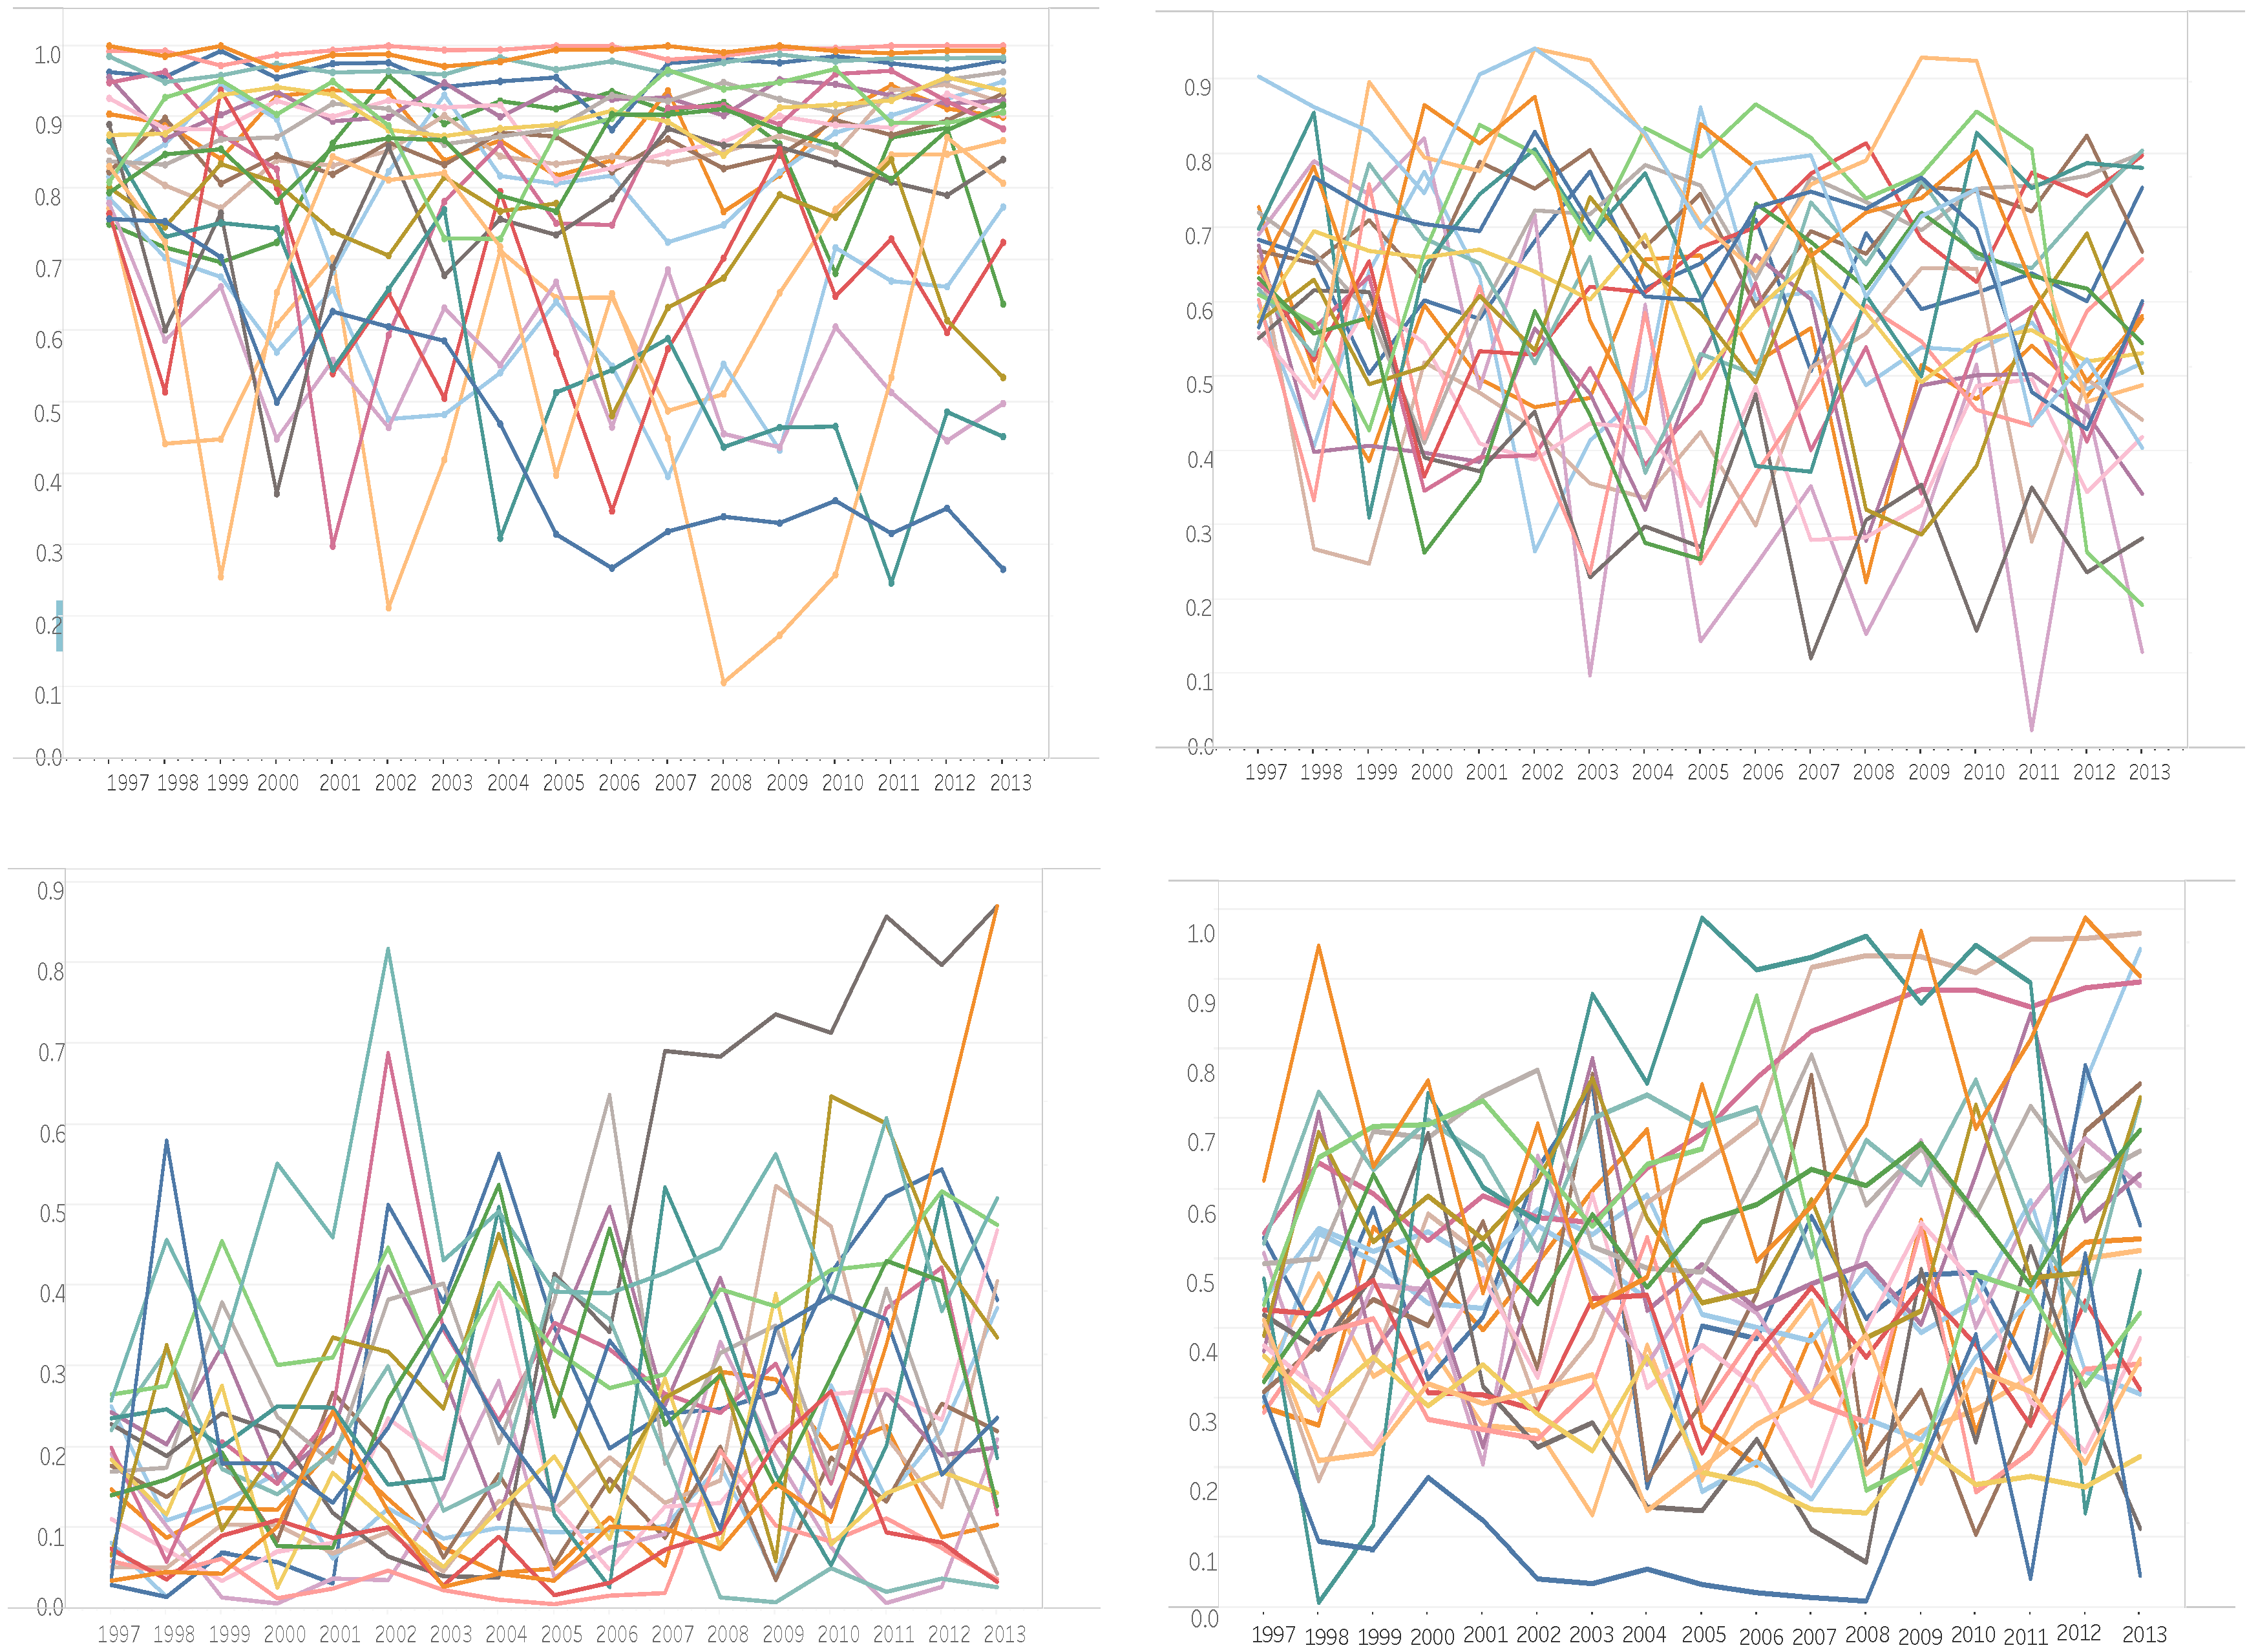
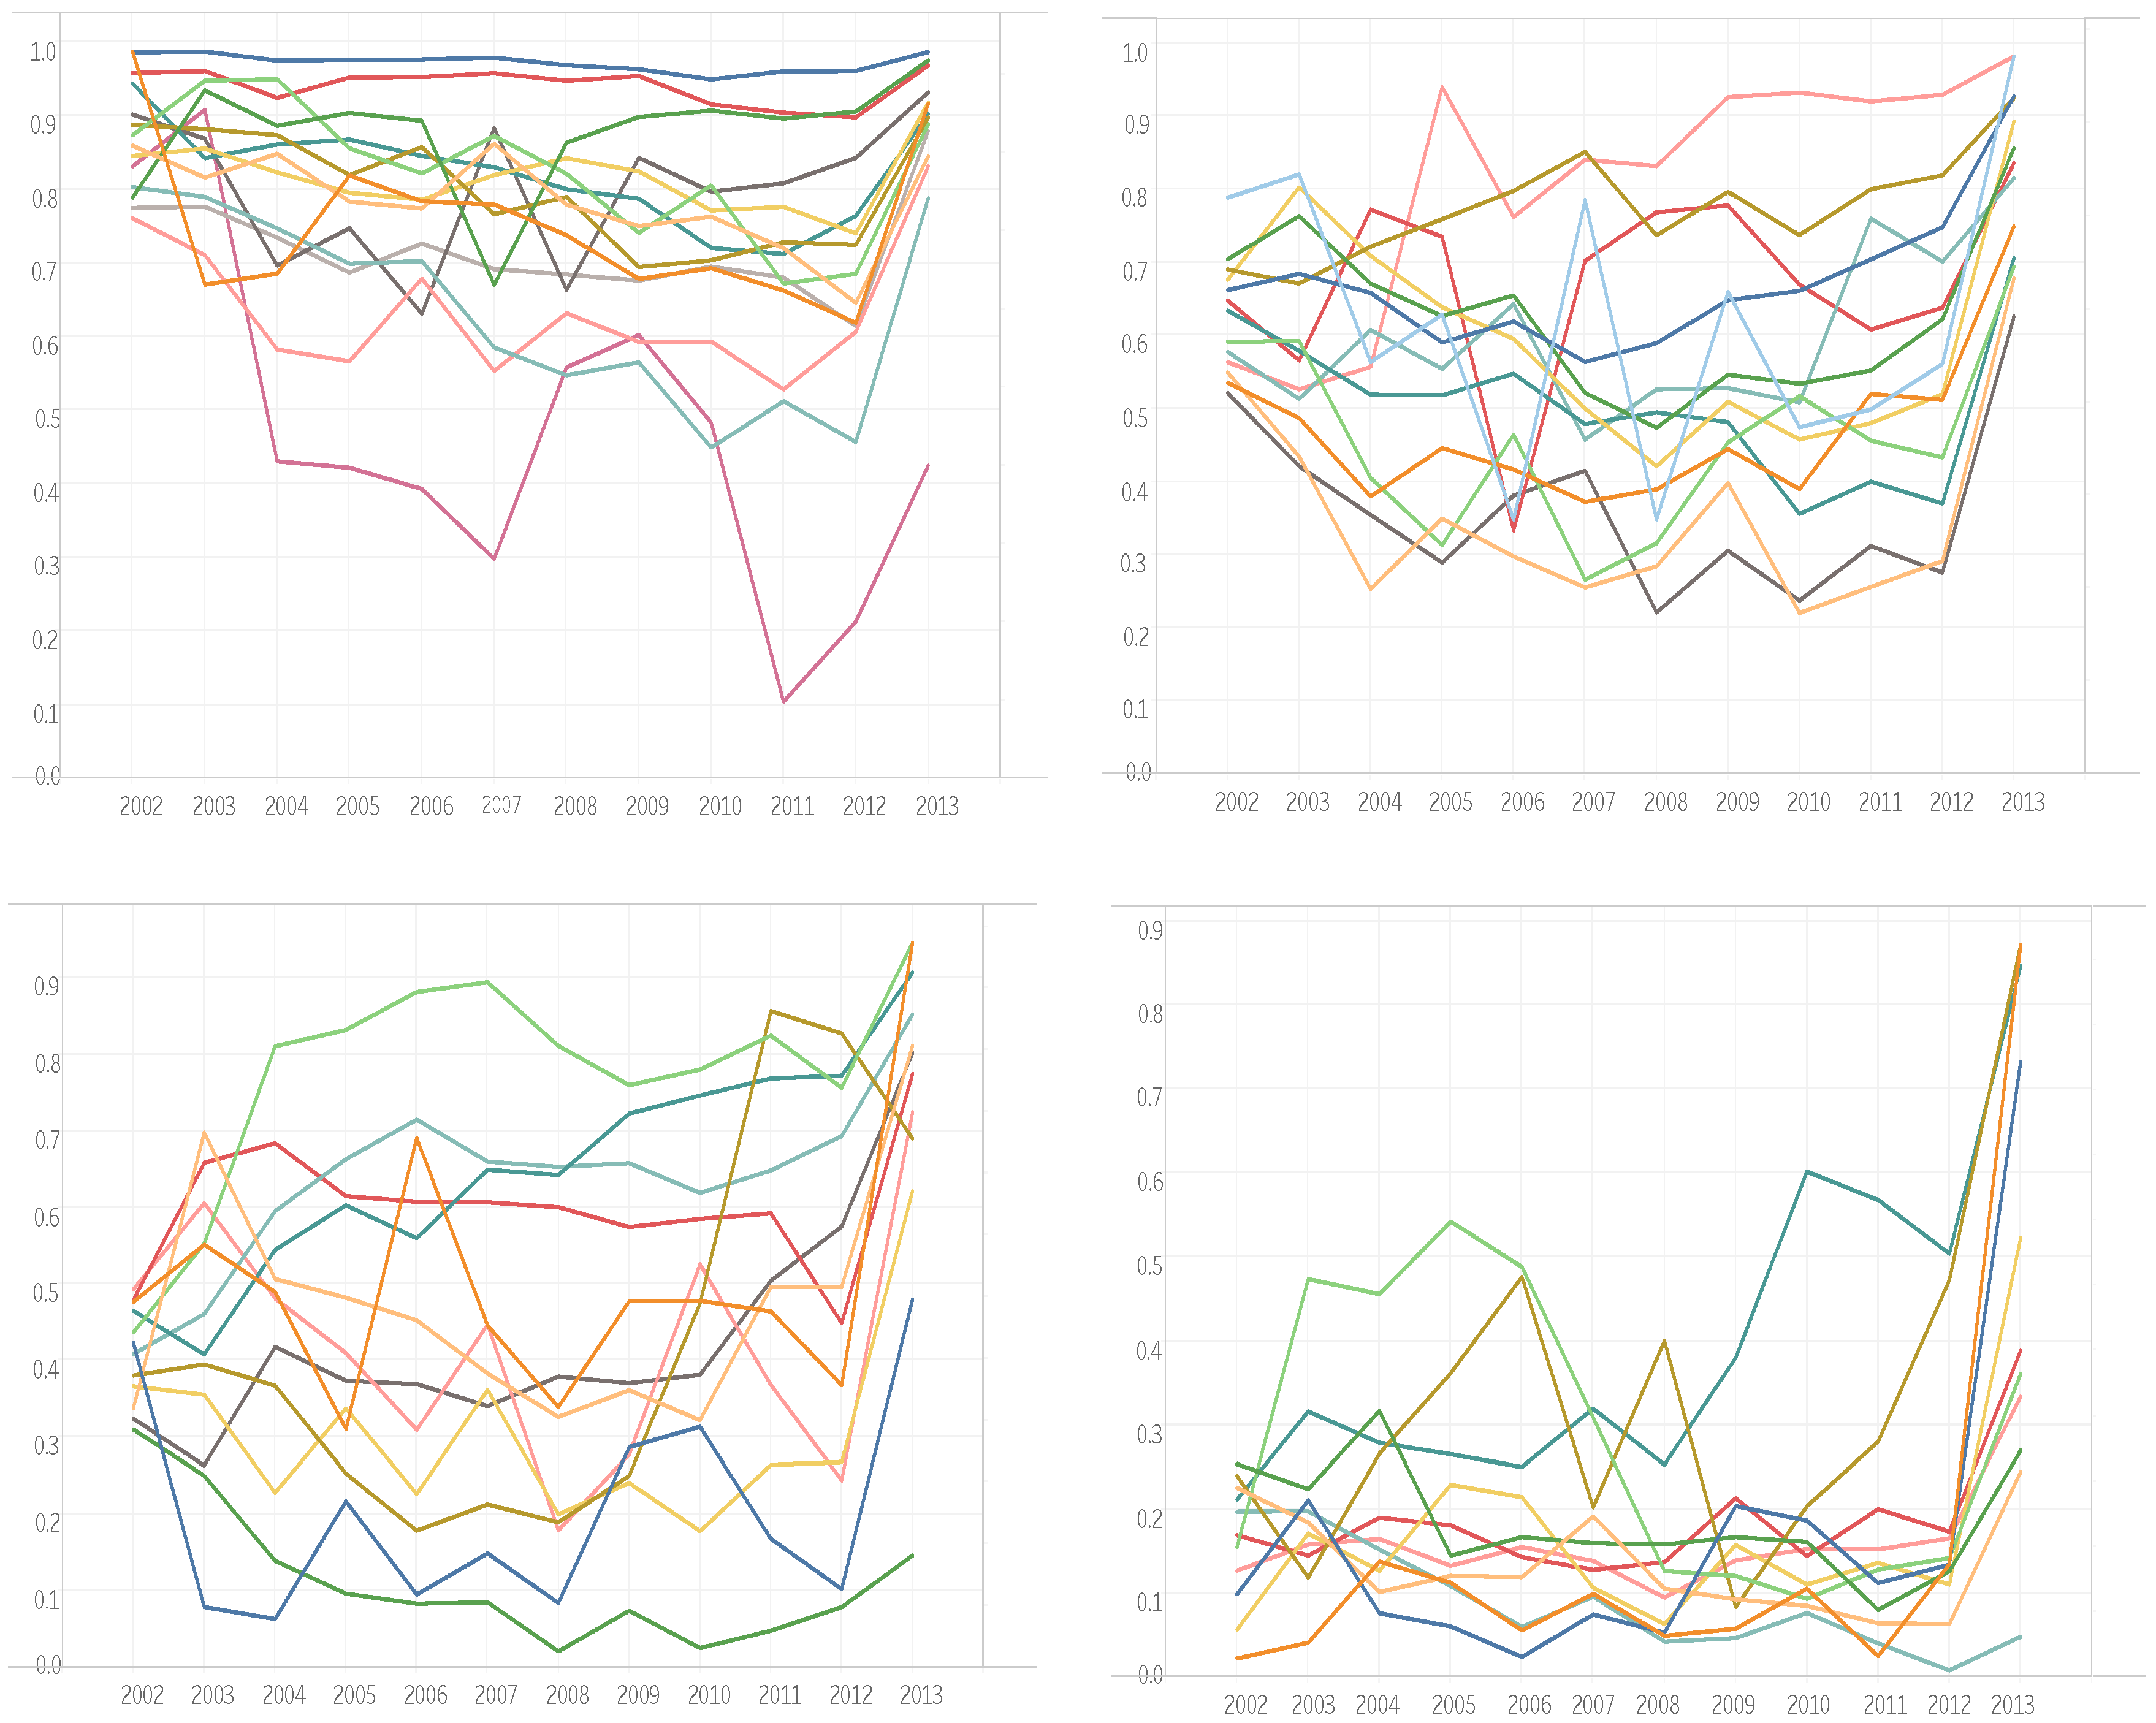
3.2. Time Series of Impact Factor Lists of Mathematics and Applied Physics

As we explained in Section 2.2, using the rank normalized impact factor we have computed the mean of the variation of the journals in the lists of mathematics and applied physics. We present them in Figure 2 and Figure 3. The reader can compare the values of the journals in both lists. These tables are the starting point of our analysis.
Figure 4 shows the behavior of the journals in the list of mathematics divided by quartiles. It is easily seen that the position of the journals changes a lot in all the diagrams, but in quartile 1 (Q1) the top journals are stable. However, these journals are often out of the scope of the publication of research in specialized areas of mathematics, mainly because they are very selective regarding topics and authors, and some of them publish just a small number of articles per year. For example, Acta Mathematica published 15 papers in 2014. This reflects that this journal cannot be considered as a standard way of publishing research in mathematics, since publication in them is in a sense extraordinary. This particular characteristic of the list of mathematics does not affect the list of applied physics. The behavior of the journals in the list of applied physics are shown by quartiles in Figure 5.
Some other properties of both journal rankings are explicitly shown in Figure 4 and Figure 5. Both are affected by a high level of variation. However, in both cases the central quartiles (second and third quartiles) show a chaotic behavior, while the first and the fourth quartiles are a bit more stable. In any case, the behavior shown in Figure 4 clearly indicates the lack of plausibility of an evaluation procedure based on the ranking of journals in the list of mathematics.
The behavior shown by the journals of the first quartile in Figure 4 (top-left) is rather stable, reinforcing the idea that top journals tend to preserve high positions in journal rankings. The same can be said regarding the first quartile of applied physics shown in Figure 5 (top-left). Note that almost all journals in the second and third quartiles of the list of mathematics (Figure 4, top-right and bottom-left) present a rather arbitrary trajectory. Since they constitute a relevant set of research publications, this should be considered a good reason for rejecting the list for evaluation purposes. Again, Figure 4 (bottom-right) represents a more stable set of journals of mathematics. The last part of the list seem to have—as in the case of the first quartile—better properties regarding order preservation: journals having small impact factors tend to preserve their impact factor.
Using this data, we have computed the 1-time-variation index P I 1 of the list of journals in the lists M = mathematics and AP = applied physics. To do this, we have considered the increments of time series from 2002 to 2013 (ten increments).
The 1-time-variation indices P I 1 ( M ) and P I 1 ( A P ) of an eleven-year series of impact-ordered lists S as the mean of the mean 1-variations of all the journals that appear in all the lists of L M : = mathematics and L A P : = applied physics. Then we have
P I 1 ( M ) : = j L M v 1 ( j ) N M = 0.1078 ,
where N M is the total number of journals in L M , and
P I 1 ( A P ) : = j L A P v 1 ( j ) N A P = 0.0827
where N A P is the total number of journals in L A P . However, if we omit from the list five journals with anomalous behavior (in the sense that they have very large changes in the mean variation), the index decreases in a meaningful way. For example, if we omit the journals TOP APPL PHYS, ATOMIZATION SPRAY, PHYSICA C, IEEE T APPL SUPERCON, APPL PHYS A-MATER and MAT SCI SEMICON PROC, the mean value of the variation is 0.0737 .

4. Discussion

The first main fact that can be observed is that for the case of applied physics, the computation of the time-variation index gives a smaller value than the one that holds for the case of mathematics. Obviously, the reason is that the variations in the position of the journals are less relevant: the reader can see this by comparing the representation by quartiles for the case of applied physics, and for the case of mathematics that we presented before.
Concretely, using the complete list, we have obtained that the time-variation indices are 0.1078 for the case of mathematics and 0.0827 for the case of applied physics. Thus, since the original values of the rank index are in the interval [ 0 , 1 ] , we have that in the first case the mean of the jump in the order index for a journal is greater than 10 % . In the case of applied physics, it is smaller than the limit value 10 % . Of course, the limit of the value of the variation index for accepting it for research evaluation is arbitrary. Based on the selection of critical values of similar statistical tests, we would suggest to use 10 % as standard value, although each particular assessment committee should fix it.
Recall that the second index that we have defined (the 1-adequacy degree) provides an estimate of the adequacy of a partition of a list in tertiles or quartiles for the aim of giving a mark for the evaluation of single papers based on their publication in journals in the list. It is given by
k 1 , T ( M ) = 100 × 1 ( T 1 ) × P I 1 ( M ) .
In the case of mathematics, we obtain the following values, where T = 3 in the case of tertiles and T = 4 in the case of quartiles. That is,
k 1 , 3 ( M ) = 100 × 1 2 × 0.1078 = 78.44
and
k 1 , 4 ( M ) = 100 × 1 3 × 0.1078 = 67.66 .
For the list of applied physics, we obtain
k 1 , 3 ( A F ) = 100 × 1 2 × 0.0827 = 83.46
and
k 1 , 4 ( A F ) = 100 × 1 3 × 0.0827 = 75.19 .
As we explained when we defined this index, these values give an estimate of the mean probability of a given journal of staying in the same tertile/quartile in the corresponding list when passing from one year to the next one. The value of the list of mathematics by quartiles shows that—roughly speaking—only two of each three journals remain in the same quartile when we change from one year to the next. Of course, this value is too large to allow a quartile-based evaluation criterion for research evaluation: for example, if this is used for the evaluation of a single researcher, he can only trust to have the expected evaluation for two journals of each three in which he publishes; the reason is that he knows the quartile where the journal is located when he is sending a paper for publication, and only in two of each three times the quartile is preserved when the papers appear in the journals the next year. From this point of view—and following the standard value for the critical variation index proposed above—a reasonable value for the index should be more than 90 % (at least nine stable journals of each ten): none of the four results presented here attains this value. Only the list of applied physics would be close to having this value for the partition of the list in tertiles, especially if some specific journals—TOP APPL PHYS, ATOMIZATION SPRAY, PHYSICA C, IEEE T APPL SUPERCON, APPL PHYS A-MATER and MAT SCI SEMICON PROC—are removed from the list.
Finally, regarding the use of the lists after excluding some journals, it can be observed that the values of the indices change a lot if the top journals of the list are removed, due to the small variation in the position of these journals. Indeed, as can be observed from the figures presented above, top journals are stable, which suggests that they have better editorial policies that allow them to preserve their positions. This would be interpreted as a confirmation that the positive relation among high quality and high impact factor is more believable in the case of top journals. The difference is more relevant in the case of mathematics, in which the following results are obtained.
  • Using the complete list, we obtain P I 1 ( M ) = 0.1078 .
  • If the 20 top journals are removed from the list, we get P I 1 ( M ) = 0.1210 .
  • If the 30 top journals are removed, then P I 1 ( M ) = 0.1306 .
It must be taken into account that the JCR list of mathematics is rather large (currently more than 300 journals), and there are many highly specialized journals that will never have a high impact factor due to the small size of the associated scientific community. Therefore, they cannot be considered as top journals, and so they are affected by a high lack of stability. The numerical values presented above stress this fact. In the case of the list of applied physics, the variations are less relevant.
Summing up, the main result of our analysis is that under the assumption of a critical variation value of 10 % , the ordered list of mathematics is not stable enough to consider it as a reliable assessment tool for research evaluation. In the case of applied physics, the values of the obtained indices show that the corresponding list is still admissible for evaluation.

5. Conclusions

We have defined a time-variation index that allows to quantitatively determine the stability of impact factor for journals in a particular field for the aim of research assessment or library management. For this purpose, a time series of 11 years of the list of journals ordered by the impact factor is necessary. Note that the size of the time interval has been arbitrarily fixed, and may be changed depending on the criteria of the assessment committees. The idea is that impact factor is acceptable for giving a proxy of the prestige of the journals in a list if there are only a small number of changes in the order of the journals in this list. In other words, the series of the corresponding lists must be stable over the 11-year period. Otherwise, the use of the impact factor can disturb the evaluation, since the corresponding ordered list changes greatly from one year to the following one, producing in this way an arbitrary criterion.
Consequently, we define an index for a series of ordered lists and an adequacy criterion for such series. The first one is given by the mean of the variations of the rank normalized indices of the journals (fractional p-variations); the second one uses this value to give a more intuitive parameter that provides a mean percentage of journals that are stable.
Finally, we show as an example that the Thomson-Reuters (currently Clarivate Analytics) JCR list of mathematics is not stable under the assumption of a cut-off value of 10 % —that is, variation index bigger than 10 % . From this point of view, it must not be accepted for research evaluation. However, the list series of applied physics has a better behavior, and it can be considered as adequate, although it is also affected by a rather large instability. Note that the cut-off value has been arbitrarily chosen, since we have provided just two examples. A complete analysis of all JCR lists—which is out of the scope of the present paper—should be done to fix a statistically significant cut-off value. From a different perspective, it can also be argued that the accepted variation rate must be the decision of each particular evaluation committee.

Acknowledgments

The work of the first author was supported by Ministerio de Economí, Industria y Competitividad, Spain, under Research Grant CSO2015-65594-C2-1R Y 2R (MINECO/FEDER, UE). The work of the third author was supported by Ministerio de Economí, Industria y Competitividad, Spain, under Research Grant MTM2016-77054-C2-1-P. We did not receive any funds for covering the costs to publish in open access.

Author Contributions

A.F.-S. and E.A.S.-P. conceived the main elements of the model and designed the experiments; E.A.S.-P. performed the mathematical structure; A.F.-S. and S.D.-N. obtained and analyzed the data.

Conflicts of Interest

The authors declare no conflict of interest. The founding sponsors had no role in the design of the study; in the collection, analyses, or interpretation of data; in the writing of the manuscript, and in the decision to publish the results.

References

  1. Kulczycki, E. Assessing publications through a bibliometric indicator: The case of comprehensive evaluation of scientific units in Poland. Res. Eval. 2017, 26, 41–52. [Google Scholar] [CrossRef]
  2. Kulczycki, E.; Rozkosz, E.A. Does an expert-based evaluation allow us to go beyond the Impact Factor? Experiences from building a ranking of national journals in Poland. Scientometrics 2017, 111, 417–442. [Google Scholar] [CrossRef] [PubMed]
  3. Garfield, E. Citation analysis as a tool in journal evaluation. Science 1972, 178, 471–479. [Google Scholar] [CrossRef] [PubMed]
  4. Garfield, E. The evolution of the Science Citation Index. Int. Microbiol. 2007, 10, 65–69. [Google Scholar] [PubMed]
  5. King, J. A review of bibliometric and other science indicators and their role in research evaluation. J. Inf. Sci. 1987, 13, 261–276. [Google Scholar] [CrossRef]
  6. Bordons, M.; Fernández, M.T.; Gómez, I. Advantages and limitations in the use of impact factor measures for the assessment of research performance. Scientometrics 2002, 53, 195–206. [Google Scholar] [CrossRef]
  7. Moed, H.F. Citation Analysis in Research Evaluation; Springer: Dordrecht, The Netherlands, 2005. [Google Scholar]
  8. Garfield, E. The History and Meaning of the Journal Impact Factor. J. Am. Med. Assoc. 2006, 293, 90–93. [Google Scholar] [CrossRef] [PubMed]
  9. Aleixandre-Benavent, R.; Valderrama Zurián, J.C.; González Alcaide, G. Scientific journals impact factor: Limitations and alternative indicators. Prof. Inf. 2007, 16, 4–11. [Google Scholar]
  10. Archambault, E.; Lariviére, V. History of the journal impact factor: Contingencies and consequences. Scientometrics 2009, 79, 635–649. [Google Scholar] [CrossRef]
  11. Arnold, D.N.; Fowler, K.K. Nefarious Numbers. Not. AMS 2011, 58, 434–437. [Google Scholar]
  12. Hecht, F.; Hecht, B.K.; Sandberg, A.A. The journal “impact factor”: A misnamed, misleading, misused measure. Cancer Genet. Cytogenet. 1998, 104, 77–81. [Google Scholar] [CrossRef]
  13. Rey-Rocha, J.; Martín-Sempere, M.J.; Martínez-Frías, J.; López-Vera, F. Some Misuses of Journal Impact Factor in Research Evaluation. Cortex 2001, 37, 595–597. [Google Scholar] [CrossRef] [Green Version]
  14. Seglen, P.O. How representative is the journal impact factor. Res. Eval. 1992, 2, 143–149. [Google Scholar] [CrossRef]
  15. Seglen, P.O. Why the impact factor of journals should not be used for evaluating research. Br. J. Med. 1997, 314, 498–502. [Google Scholar] [CrossRef]
  16. Van Leeuwen, T.N.; Moed, H.F. Development and application of journal impact measures in the Dutch science system. Scientometrics 2002, 53, 249–266. [Google Scholar] [CrossRef]
  17. Van Leeuwen, T. Discussing some basic critique on Journal Impact Factors: Revision of earlier comment. Scientometrics 2012, 92, 443–455. [Google Scholar] [CrossRef] [PubMed]
  18. Ferrer-Sapena, A.; Sánchez-Pérez, E.A.; González, L.M.; Peset, F.; Aleixandre-Benavent, R. The impact factor as a measuring tool of the prestige of the journals in research assessment in mathematics. Res. Eval. 2016, 25, 306–314. [Google Scholar] [CrossRef]
  19. IMU-Joint Committee on Quantitative Assessment of Research. Citation Statistics: A Report From the International Mathematical Union (IMU) in Cooperation With the International Council of Industrial and Applied Mathematics (ICIAM) and the Institute of Mathematical Statistics (IMS); International Mathematical Union: Berlin, Germany, 2008. [Google Scholar]
  20. San Francisco Declaration on Research Assessment (DORA). Available online: http://www.ascb.org/dora/ (accessed on 19 September 2017).
  21. Wilsdon, J.; Allen, L.; Belfiore, E.; Johnson, B. The Metric Tide: Report of the Independent Review of the Role of Metrics in Research Assessment and Management. Tech. Rep. 2015, 111. [Google Scholar] [CrossRef]
  22. Hicks, D.; Wouters, P.; Waltman, L.; de Rijcke, S.; Rafols, I. The Leiden Manifesto for research metrics. Nature 2015, 520, 429–431. [Google Scholar] [CrossRef] [PubMed]
  23. Sivertsen, G. Unique, but still best practice? The Research Excellence Framework (REF) from an international perspective. Palgrave Commun. 2017, 3. [Google Scholar] [CrossRef]
  24. Pajić, D. On the stability of citation-based journal rankings. J. Informetr. 2015, 9, 990–1006. [Google Scholar] [CrossRef]
  25. Yu, D.; Wang, W.; Zhang, S.; Zhang, W.; Liu, R. A multiple-link, mutually reinforced journal-ranking model to measure the prestige of journals. Scientometrics 2017, 111, 521–542. [Google Scholar] [CrossRef]
  26. Anderson, D.L.; Tressler, J. Researcher rank stability across alternative output measurement schemes in the context of a time limited research evaluation: The New Zealand case. Appl. Econ. 2017, 1–12. [Google Scholar] [CrossRef]
  27. Xu, H.; Martin, E.; Mahidadia, A. Contents and time sensitive document ranking of scientific literature. J. Informetr. 2014, 8, 546–561. [Google Scholar] [CrossRef]
  28. Fiala, D. Time-aware PageRank for bibliographic networks. J. Informetr. 2012, 6, 370–388. [Google Scholar] [CrossRef]
  29. Pudovkin, A.I.; Garfield, E. Rank-normalized impact factor: Away compare journal performance across subject categories. In Proceedings of the 67th Annual Meeting of the American Society for Information Science and Technology, Providence, RI, USA, 12–17 November 2004; Volume 41, pp. 507–515. [Google Scholar]
  30. Mansilla, R.; Köppen, E.; Cocho, G.; Miramontes, P. On the behavior of journal impact factor rank-order distribution. J. Informetr. 2007, 1, 155–160. [Google Scholar] [CrossRef]
  31. Moussa, S.; Touzani, M. Ranking marketing journals using the Google Scholar-based hg-index. J. Informetr. 2010, 4, 107–117. [Google Scholar] [CrossRef]
  32. Sicilia, M.A.; Sánchez-Alonso, S.; García-Barriocanal, E. Comparing impact factors from two different citation databases: The Case of Computer Science. J. Informetr. 2011, 5, 698–704. [Google Scholar] [CrossRef]
  33. Ferrer-Sapena, A.; Sánchez-Pérez, E.A.; González, L.M.; Peset, F.; Aleixandre-Benavent, R. Mathematical properties of weighted impact factors based on measures of prestige of the citing journals. Scientometrics 2015, 105, 2089–2108. [Google Scholar] [CrossRef]
  34. Serenko, A.; Dohan, M. Comparing the expert survey and citation impact journal ranking methods: Example from the field of Artificial Intelligence. J. Informetr. 2011, 5, 629–648. [Google Scholar] [CrossRef]
  35. Haghdoost, A.; Zare, M.; Bazrafshan, A. How variable are the journal impact measures? Online Inf. Rev. 2014, 38, 723–737. [Google Scholar] [CrossRef]
  36. Althouse, B.M.; West, J.D.; Bergstrom, C.T.; Bergstrom, T. Differences in impact factor across fields and over time. J. Assoc. Inf. Sci. Technol. 2009, 60, 27–34. [Google Scholar] [CrossRef]
  37. Aguillo, I. Increasing the between-year stability of the impact factor in the Science Citation Index. Scientometrics 1996, 35, 279–282. [Google Scholar] [CrossRef]
  38. Nieuwenhuysen, P.; Rousseau, R. A quick and easy method to estimate the random effect on citation measures. Scientometrics 1988, 13, 45–52. [Google Scholar] [CrossRef]
  39. Black, S. How much do core journals change over a decade? Libr. Resour. Tech. Serv. 2012, 56, 80–93. [Google Scholar] [CrossRef]
Figure 1. p-variation of the points ( t , 1 t ) for: (left) p = 2 ; (middle) p = 1 ; and (right) p = 1 / 2 .
Publications 05 00021 g001
Figure 2. Mean variations of the journals in the list of mathematics.
Publications 05 00021 g002
Figure 3. Mean variations of the journals in the list of applied physics.
Publications 05 00021 g003
Figure 4. Behavior of the journals by quartiles (Q) in the list of mathematics. (top-left) Q1; (top-right) Q2; (bottom-left) Q3; and (bottom-right) Q4.
Publications 05 00021 g004
Figure 5. Behavior of the journals by quartiles (Q) in the list of applied physics. (top-left) Q1; (top-right) Q2; (bottom-left) Q3; and (bottom-right) Q4.
Publications 05 00021 g005

