1. Introduction
In the current landscape of higher education, universities face growing pressure to demonstrate their research capacity, report to regulatory bodies, and make strategic decisions based on reliable and timely data. This trend is particularly salient in Peru, where the enactment of University Law No. 30220 (2014) marked a turning point in the conception of research as a core university function. Under this legislation, research ceased to be an optional activity and became a mandatory pillar of academic life, overseen by the National Superintendency of Higher University Education (SUNEDU) and aligned with the guidelines of the National Council of Science, Technology and Technological Innovation (CONCYTEC).
The institutional licensing process driven by SUNEDU requires universities to certify the existence of mechanisms for tracking research outcomes (
SUNEDU, 2015,
2020). In parallel, CONCYTEC administers the National Registry of Researchers in Science, Technology and Technological Innovation (RENACYT), which evaluates and classifies Peruvian researchers according to their indexed scientific output, funded projects, and training of specialized human resources (
CONCYTEC, 2020). This dual regulatory mandate generates a significant demand for organized, up-to-date, and easily accessible research data that higher education institutions must supply systematically.
The reality of many Peruvian universities, however, falls short of meeting this requirement. Scientific information management is frequently carried out in a fragmented manner, through dispersed records or isolated systems that do not communicate with each other (
Sánchez Tarragó et al., 2021). The Universidad Católica de Santa María (UCSM), a private institution with over six decades of academic history located in Arequipa and affiliated with Elsevier Pure, is no exception: dispersed information on publications, projects, and researchers constitutes an obstacle to strategic management and regulatory compliance.
Among the most consolidated solutions to this type of challenge are Current Research Information Systems (CRIS)—also referred to in the literature as Research Information Management Systems (RIMS) or Research Information Systems (RIS)—designed to manage metadata on institutional scientific activity (
Jeffery & Asserson, 2008). Terminology note: for consistency, this article uses CRIS as the primary term throughout; RIMS and RIS are treated as equivalent designations found in the literature for the same class of platform, and RMS is used only as a generic, platform-neutral shorthand where needed. Among the available platforms, Elsevier Pure offers a REST API that enables the construction of customized monitoring solutions adapted to local requirements (
Elsevier, 2026). Despite the growing adoption of such platforms globally, the literature on CRIS/RIMS implementation in Latin American universities remains sparse (
Sánchez Tarragó et al., 2021). In particular, there is limited documented evidence on (a) whether API-based custom monitoring layers can be built upon commercial RIMS to address institution-specific and country-specific regulatory requirements, and (b) how institutional stakeholders in this context perceive the usability and strategic utility of such systems. This study addresses those gaps at UCSM through the following research questions: RQ1: Can an API-based CRIS monitoring solution be implemented on the Elsevier Pure platform to fulfill UCSM’s regulatory reporting requirements under Law No. 30220, SUNEDU, and RENACYT? RQ2: To what extent do UCSM institutional stakeholders perceive the Monitor CRIS UCSM as usable, normatively relevant, and useful for strategic decision-making? This article describes the design, development, and user acceptance evaluation of the Monitor CRIS UCSM, aimed at centralizing institutional scientific information, facilitating regulatory compliance, and supporting strategic decision-making in research.
2. Background
2.1. Current Research Information Systems (CRIS)
CRIS are specialized systems for the storage, management, and exchange of contextual metadata about institutional research activity (
Jeffery & Asserson, 2008). Their purpose is to create a structured representation of the scientific ecosystem, integrating information about people, organizations, projects, funding, and publications (
euroCRIS, 2026). Over the past two decades, CRIS have evolved from administrative repositories into instruments of strategic decision support (
Bryant et al., 2018), increasingly expected to feed real-time dashboards, support accreditation reporting, and enable data-driven research policy (
Guillaumet et al., 2019). Despite this global trend, the adoption of CRIS in Latin American higher education institutions faces persistent challenges: limited institutional technical capacity, insufficient interoperability with regional bibliometric databases, and the need to adapt systems originally designed for European regulatory environments to national regulatory frameworks that are structurally different (
Sánchez Tarragó et al., 2021;
García & Pirela, 2020). This gap between the global maturity of CRIS and the limited documented experience of their adaptation in Latin America is precisely the context in which the present study is situated. Whereas European implementations can rely on established CERIF-compliant infrastructure and shared interoperability standards, Peruvian universities must additionally align their systems with SUNEDU licensing indicators and RENACYT evaluation criteria—requirements with no direct equivalent in the existing CRIS literature. The Monitor CRIS UCSM therefore represents not only a local implementation but also a case of regulatory-context-driven CRIS customization that the literature has not yet documented in comparable detail.
2.2. The CERIF Standard and Interoperability
The data model underlying CRIS is organized around the Common European Research Information Format (CERIF), a standard maintained by euroCRIS (
Jorg, 2010;
Asserson & Jeffery, 2010). CERIF defines the fundamental entities of the research domain and the semantic relationships between them, establishing an interoperability framework that enables information exchange between heterogeneous systems. This interoperability is critical for connecting bibliometric databases, institutional repositories, and scientific visibility platforms.
2.3. Elsevier Pure and Its REST API
Elsevier Pure is the most widely adopted RIMS worldwide, present in over 500 institutions in more than 50 countries (
Elsevier, 2026). It implements the CERIF model and integrates with ORCID through the Certified Service Provider program (
ORCID, 2026). Its REST API enables automated querying, extraction, and integration of research data through standard HTTP requests returning JSON responses. This API-first architecture makes Pure a relevant platform for building institution-specific monitoring layers—a design strategy whose technical feasibility at UCSM is one of the questions this study addresses (RQ1). However, the literature on Pure API implementations is predominantly documented in European contexts (
Guillaumet et al., 2019); whether its outputs can be reliably adapted to address non-European regulatory requirements, such as those imposed by SUNEDU and RENACYT, has not been systematically examined. Studies on the acceptance of RIS/RIMS have shown that data quality and utility for regulatory reporting are the main determinants of acceptance in academic contexts (
Azeroual et al., 2019), which motivates the design of the UAT instrument around normative relevance as a distinct evaluative dimension (RQ2).
2.4. Information Systems Acceptance and Success Models
Two theoretical frameworks jointly inform the research design of this study.
Davis’s (
1989) Technology Acceptance Model (TAM) posits that perceived usefulness and perceived ease of use are the fundamental determinants of behavioral intention to use a technology; it has been extensively validated in university contexts (
Venkatesh et al., 2003;
Legramante et al., 2023). The
DeLone and McLean (
2003) IS Success Model (D&M) evaluates information system success across six dimensions: system quality, information quality, service quality, use, user satisfaction, and net benefits. These two frameworks are operationalized in the UAT instrument as follows: the General Usability dimension (USAB) maps to TAM’s perceived ease of use construct; the Strategic Decision-Making Utility dimension (DECISION) maps to TAM’s perceived usefulness and to the D&M net benefits dimension; the Normative Relevance and Compliance dimension (NORM) maps to the D&M information quality dimension, interpreted in the Peruvian regulatory context (SUNEDU/RENACYT reporting requirements); and the Visualization and Interface Quality dimension (VISUAL) maps to the D&M system quality dimension. This a priori mapping guided item development and grounds the interpretation of results within an established theoretical tradition, rather than treating the models as a post hoc interpretive overlay. It should be emphasized, however, that these frameworks are used here only to inform instrument design and to contextualize the interpretation of descriptive results: the study does not test TAM or the D&M model empirically, and no model-based validation is claimed or should be expected from the results reported below.
2.5. Research Monitoring and Dashboards
Research dashboards have emerged as effective tools for transforming bibliometric data into actionable information for both strategic planning and regulatory reporting (
Costas et al., 2013;
Almasi et al., 2023). The Leiden Manifesto (
Hicks et al., 2015) provides an ethical framework for the responsible use of bibliometric indicators in institutional evaluation, cautioning against reductive uses that reduce complex research trajectories to single metrics. From a strategic perspective, CRIS-integrated dashboards contribute to the formulation of institutional research policies, the identification of high-impact collaborations, and positioning in academic rankings (
Zhang & Kajikawa, 2021). Alignment with the FAIR principles (
Wilkinson et al., 2016) reinforces the interoperability and long-term reusability of the data produced. Critically for the present study, the usability and strategic utility of research dashboards are known to vary significantly by user role and organizational context (
Almasi et al., 2023): what is perceived as a strategically useful visualization by a research vice-rector may not be perceived the same way by a researcher primarily interested in their own bibliometric profile. This role-specificity in dashboard perception reinforces the rationale for including strategic decision-making utility (DECISION) as a distinct UAT dimension alongside general usability (USAB), and points to the importance of subgroup analyses—identified as a limitation and future direction in this study—for a more complete understanding of how different user profiles experience the system.
2.6. Peruvian Regulatory Framework
Law No. 30220 (2014) establishes that research is an essential function of the university. SUNEDU’s Basic Quality Conditions require universities to demonstrate mechanisms for tracking research outcomes (
SUNEDU, 2015,
2020). RENACYT establishes quantitative evaluation criteria based on indexed publications, supervised theses, and intellectual property registrations (
CONCYTEC, 2020). This triple regulatory imperative creates a direct need for systems capable of documenting, tracking, and reporting institutional scientific output in a structured manner.
3. Methodology
This study is best characterized as a single-institution applied case study with a quantitative user acceptance component. It combines four methodological elements: (1) documentary review and semi-structured interviews for regulatory requirements elicitation; (2) technical evaluation of the Elsevier Pure REST API; (3) iterative system design and development following agile principles (
Beck et al., 2001); and (4) a quantitative User Acceptance Test (UAT) as the primary validation instrument. This design is more specific than the label “applied research of a quantitative-descriptive nature with a technological development component” (
Hernández-Sampieri et al., 2014) sometimes used in the Latin American methodological tradition: the study is not a controlled experiment, does not test causal hypotheses, and does not claim generalizable statistical inference beyond the UCSM context. Its epistemological position is that of an instrumental case study (
Stake, 1995) in which the UCSM case is examined in depth to generate insights transferable—with appropriate caution—to similar institutional and regulatory contexts. The study period spanned 2024–2025 at UCSM, an institution licensed by SUNEDU and affiliated with Elsevier Pure as part of its research management strategy.
3.1. Institutional Needs Analysis and Regulatory Requirements
The first phase identified information demands regarding scientific production from three regulatory sources: (a) Law No. 30220 (
Congress of the Republic of Peru, 2014), Articles 48 to 52; (b) SUNEDU licensing indicators, specifically the Basic Quality Conditions related to research (
SUNEDU, 2020); and (c) RENACYT criteria (
CONCYTEC, 2020).
For the institutional needs assessment, a documentary review design was used, complemented by semi-structured interviews (
n = 8) conducted with research institute directors, the Research Vice-Rectorate, and institutional management officers. These interviews served exclusively as a requirements-elicitation instrument—that is, as design inputs rather than as independent research data—and are not presented as a separate results component. Each interview followed a structured protocol covering four thematic axes: (i) frequency and format of current research reports; (ii) indicators most demanded by regulatory bodies (SUNEDU/RENACYT); (iii) difficulties in accessing and interpreting data from the Pure platform; and (iv) gaps in information visualization for strategic decision-making. Interview responses were analyzed through inductive thematic coding (
Braun & Clarke, 2006): each transcript was read in full, recurrent needs were labeled as first-order codes, and codes were grouped into higher-order functional requirement categories. Each higher-order category was then translated into one or more functional or non-functional requirements, and this correspondence was documented in a requirements traceability matrix linking interview-derived needs to specific system functions. The resulting catalog of functional and non-functional requirements guided the system design and served as the basis for the 47 functional test cases executed in the validation phase, each of which is traceable to at least one requirement in the catalog. All interviews were conducted with the prior oral informed consent of participants, who were assured that their responses would be used solely to inform system design and would not be attributed individually in any publication. This traceability matrix is summarized in
Table 1.
3.2. Technical Evaluation of the Elsevier Pure API
The second phase consisted of a systematic evaluation of the Elsevier Pure REST API (version 524+). The API follows REST architectural principles (
Fielding, 2000) and returns JSON responses authenticated via an API key transmitted in the HTTP api-key header. The endpoints/research-outputs, /persons, /organisational-units, /journals, and /external-organisations were evaluated against the UCSM’s Pure instance using Postman and automated PHP scripts.
The filtering capabilities by parameters (size, offset, rendering, fields) were documented, and the following operational limitations were identified: (a) maximum pagination of 1000 records per request, which required implementing iterative pagination logic; (b) absence of webhooks, necessitating the design of an active periodic synchronization mechanism; and (c) variability in field completeness depending on the type of research output registered in the institutional instance.
3.3. System Design
The design followed a three-tier decoupled architecture: a data integration layer (backend API), a relational persistence layer, and a presentation layer (frontend SPA). This separation reflects the principles of high cohesion and low coupling in CRIS system design (
Jeffery & Asserson, 2008;
Asserson & Jeffery, 2010). A relational schema in MySQL was designed with the main entities research_outputs, persons, organisational_units, journals, and external_organisations, with pivot tables for many-to-many relationships and a synchronization control table (pure_sync_log). Information flows under a Backend for Frontend (BFF) pattern that decouples external API latency from the user experience (
Newman, 2015).
3.4. Technology Stack and Implementation
The Monitor CRIS UCSM was implemented with the following technology stack (
Table 2), selected for its maturity, active documentation, and adoption in the Latin American university context:
The system implements role-based access control (RBAC) (
Ferraiolo et al., 2001) with dual verification: a CheckPermission middleware on the backend that intercepts every API request, and a usePermissions composable on the frontend that conditionally controls component visibility based on the authenticated user’s permissions. To mitigate latency on repeated queries, a sessionCache mechanism with a five-minute time to live (TTL) was implemented on the frontend, storing API responses in memory and serving them in successive within-session navigations.
The visualization modules comprise: (a) general research production summary with institutional KPIs; (b) individual bibliometric profile analysis by researcher; (c) exploration by organizational unit; (d) journal analysis and impact metrics; (e) alignment of publications with the 17 SDGs of the 2030 Agenda through thematic classification; and (f) a trends module with temporal evolution analysis. All modules offer interactive filters by year range, publication type, organizational unit, and researcher.
3.5. System Validation
Validation was carried out in two distinct stages that should not be conflated. Stage 1—Technical Verification—comprised 47 functional test cases executed across all system modules, verifying correct data retrieval and transformation from the Pure API, consistency between stored records and dashboard values, and permission system behavior across different access roles. This stage addressed system correctness, not user perception. The 47 test cases were derived from the requirements catalog described in
Section 3.1 and covered five categories: (i) data retrieval and pagination from the Pure API endpoints; (ii) field mapping and transformation into the local relational schema; (iii) consistency between stored records and the values displayed in each dashboard module; (iv) filter and export behavior; and (v) role-based permission enforcement. Each case specified preconditions, input data, expected output, and pass/fail criteria. Compliance-related functions (SUNEDU/RENACYT reporting indicators identified in the requirements phase) were verified by confirming that each indicator could be generated by the corresponding system module and matched the values obtained through manual queries to the institutional Pure instance. In the first execution round, 40 of the 47 test cases (85.1%) passed without issues. The remaining 7 failures fell into three defect classes: pagination handling in the retrieval of large result sets from the Pure API, latency in API response times affecting data-loading steps, and mismatches in the UUID used to link individual researchers to their corresponding research outputs. These defects were corrected—by adjusting the pagination logic, optimizing the data-retrieval calls to reduce response latency, and fixing the UUID-matching routine—and all 47 test cases passed upon re-execution.
Table 3 summarizes the results by test category.
Stage 2—User Acceptance Testing—assessed stakeholder perceptions of usability, normative relevance, visualization quality, and strategic utility through the UAT Monitor CRIS UCSM Questionnaire.
UAT Instrument. The UAT Monitor CRIS UCSM Questionnaire was constructed in two components. The first component is a SUS-adapted usability block (USAB dimension, 10 items): the original SUS items (
Brooke, 1996) were retained with minor lexical adjustments to reference the Monitor CRIS UCSM specifically (e.g., “I think that I would like to use this system frequently” → “I think I would use the Monitor CRIS UCSM regularly in my work”). Scoring followed the standard SUS algorithm: for odd-numbered items, the position value minus 1; for even-numbered items, 5 minus the position value; the sum is multiplied by 2.5 to produce a 0–100 composite score. The second component comprises three additional dimensions (NORM, VISUAL, DECISION) of five items each, rated on a 5-point Likert scale (1 = strongly disagree, 5 = strongly agree), derived from the theoretical framework detailed in
Section 2.4. The complete item list by dimension is provided in
Appendix A. A content validity review was conducted by three academic experts in information systems and research management prior to administration; minor wording revisions were incorporated based on their feedback. A pilot test with 12 users (not included in the final n = 134) confirmed item comprehension and produced a pilot α = 0.87, which informed minor further revisions. Because the USAB block uses the SUS algorithm while the other three dimensions use raw Likert means, scores are not directly comparable across components; they are reported separately throughout. Comparison with published SUS benchmarks (
Bangor et al., 2008,
2009;
Vlachogianni & Tselios, 2022) is offered as a descriptive, contextual reference rather than a statistical claim of equivalence, given the lexical adaptation of the items.
Sampling and participants. The study population comprised all institutional stakeholders with regular access to research management data at UCSM: research faculty, research institute directors, members of the Research Vice-Rectorate, and academic managers. The total eligible population was approximately 210 individuals. Of these, 134 completed the questionnaire (response rate: 63.8%). The sampling procedure is best described as a voluntary census-style survey of a purposively defined population: purposiveness applies to the definition of the target group—all individuals meeting the role-based criteria of regular access to research management data and membership in one of the four stakeholder roles—rather than to the selection of individual respondents, who self-selected by responding voluntarily. The resulting sample covered all four stakeholder roles and all 33 professional schools with recorded research output. The sample profile was: research faculty (most frequent role), 6–10 years of research experience (35.8%), occasional use of Pure (44.0%), and intermediate self-rated digital competence (60.4%). Participation was voluntary and anonymous; the questionnaire was distributed via the institutional intranet with a cover message clarifying that responses were confidential, would not be linked to individual identities, and would be used solely for research purposes. Non-response was not followed up to avoid pressure on participants. Readers should note that because this is an internal evaluation by users of a system developed within their own institution, social desirability and acquiescence biases cannot be fully excluded, and the high mean values reported should be interpreted with this caveat in mind.
Ethics. This study did not involve clinical procedures, sensitive personal data, or vulnerable populations, and was conducted within the standard scope of institutional system evaluation at UCSM. Formal ethics committee review was not required under applicable Peruvian regulations, which restrict mandatory ethics committee review to health research involving human subjects; anonymous, voluntary staff and stakeholder surveys conducted as part of internal institutional system evaluation fall outside that scope. This exemption determination was made under UCSM’s institutional research ethics policy [Reglamento de Ética en Investigación de la UCSM—authors to insert exact regulation name/number], with the concurrence of the Research Vice-Rectorate, based on the anonymous, voluntary, and non-clinical nature of the survey and the absence of vulnerable populations or sensitive personal data; no separate formal exemption certificate was issued, as the applicable institutional policy does not require one for this category of internal evaluation. Informed consent was documented separately for the two data-collection instruments: for the semi-structured requirements-elicitation interviews (n = 8), participants gave prior oral informed consent, recorded in the interviewers’ field notes, after being informed that their responses would be used solely to inform system design and would not be attributed individually in any publication; for the UAT survey (n = 134), the cover message accompanying the intranet-distributed questionnaire informed respondents of the study’s purpose and of the voluntary, anonymous, and confidential nature of participation, and voluntary completion of the questionnaire was treated as implied consent. Anonymity was guaranteed throughout data collection and analysis, and all data were stored in password-protected institutional servers accessible only to the research team. Statistical analysis was conducted in IBM SPSS Statistics (version 27) using descriptive statistics (M, SD, minimum, maximum) and Cronbach’s alpha calculated at the full-instrument level and separately for each of the four dimensions.
4. Modules and Architecture
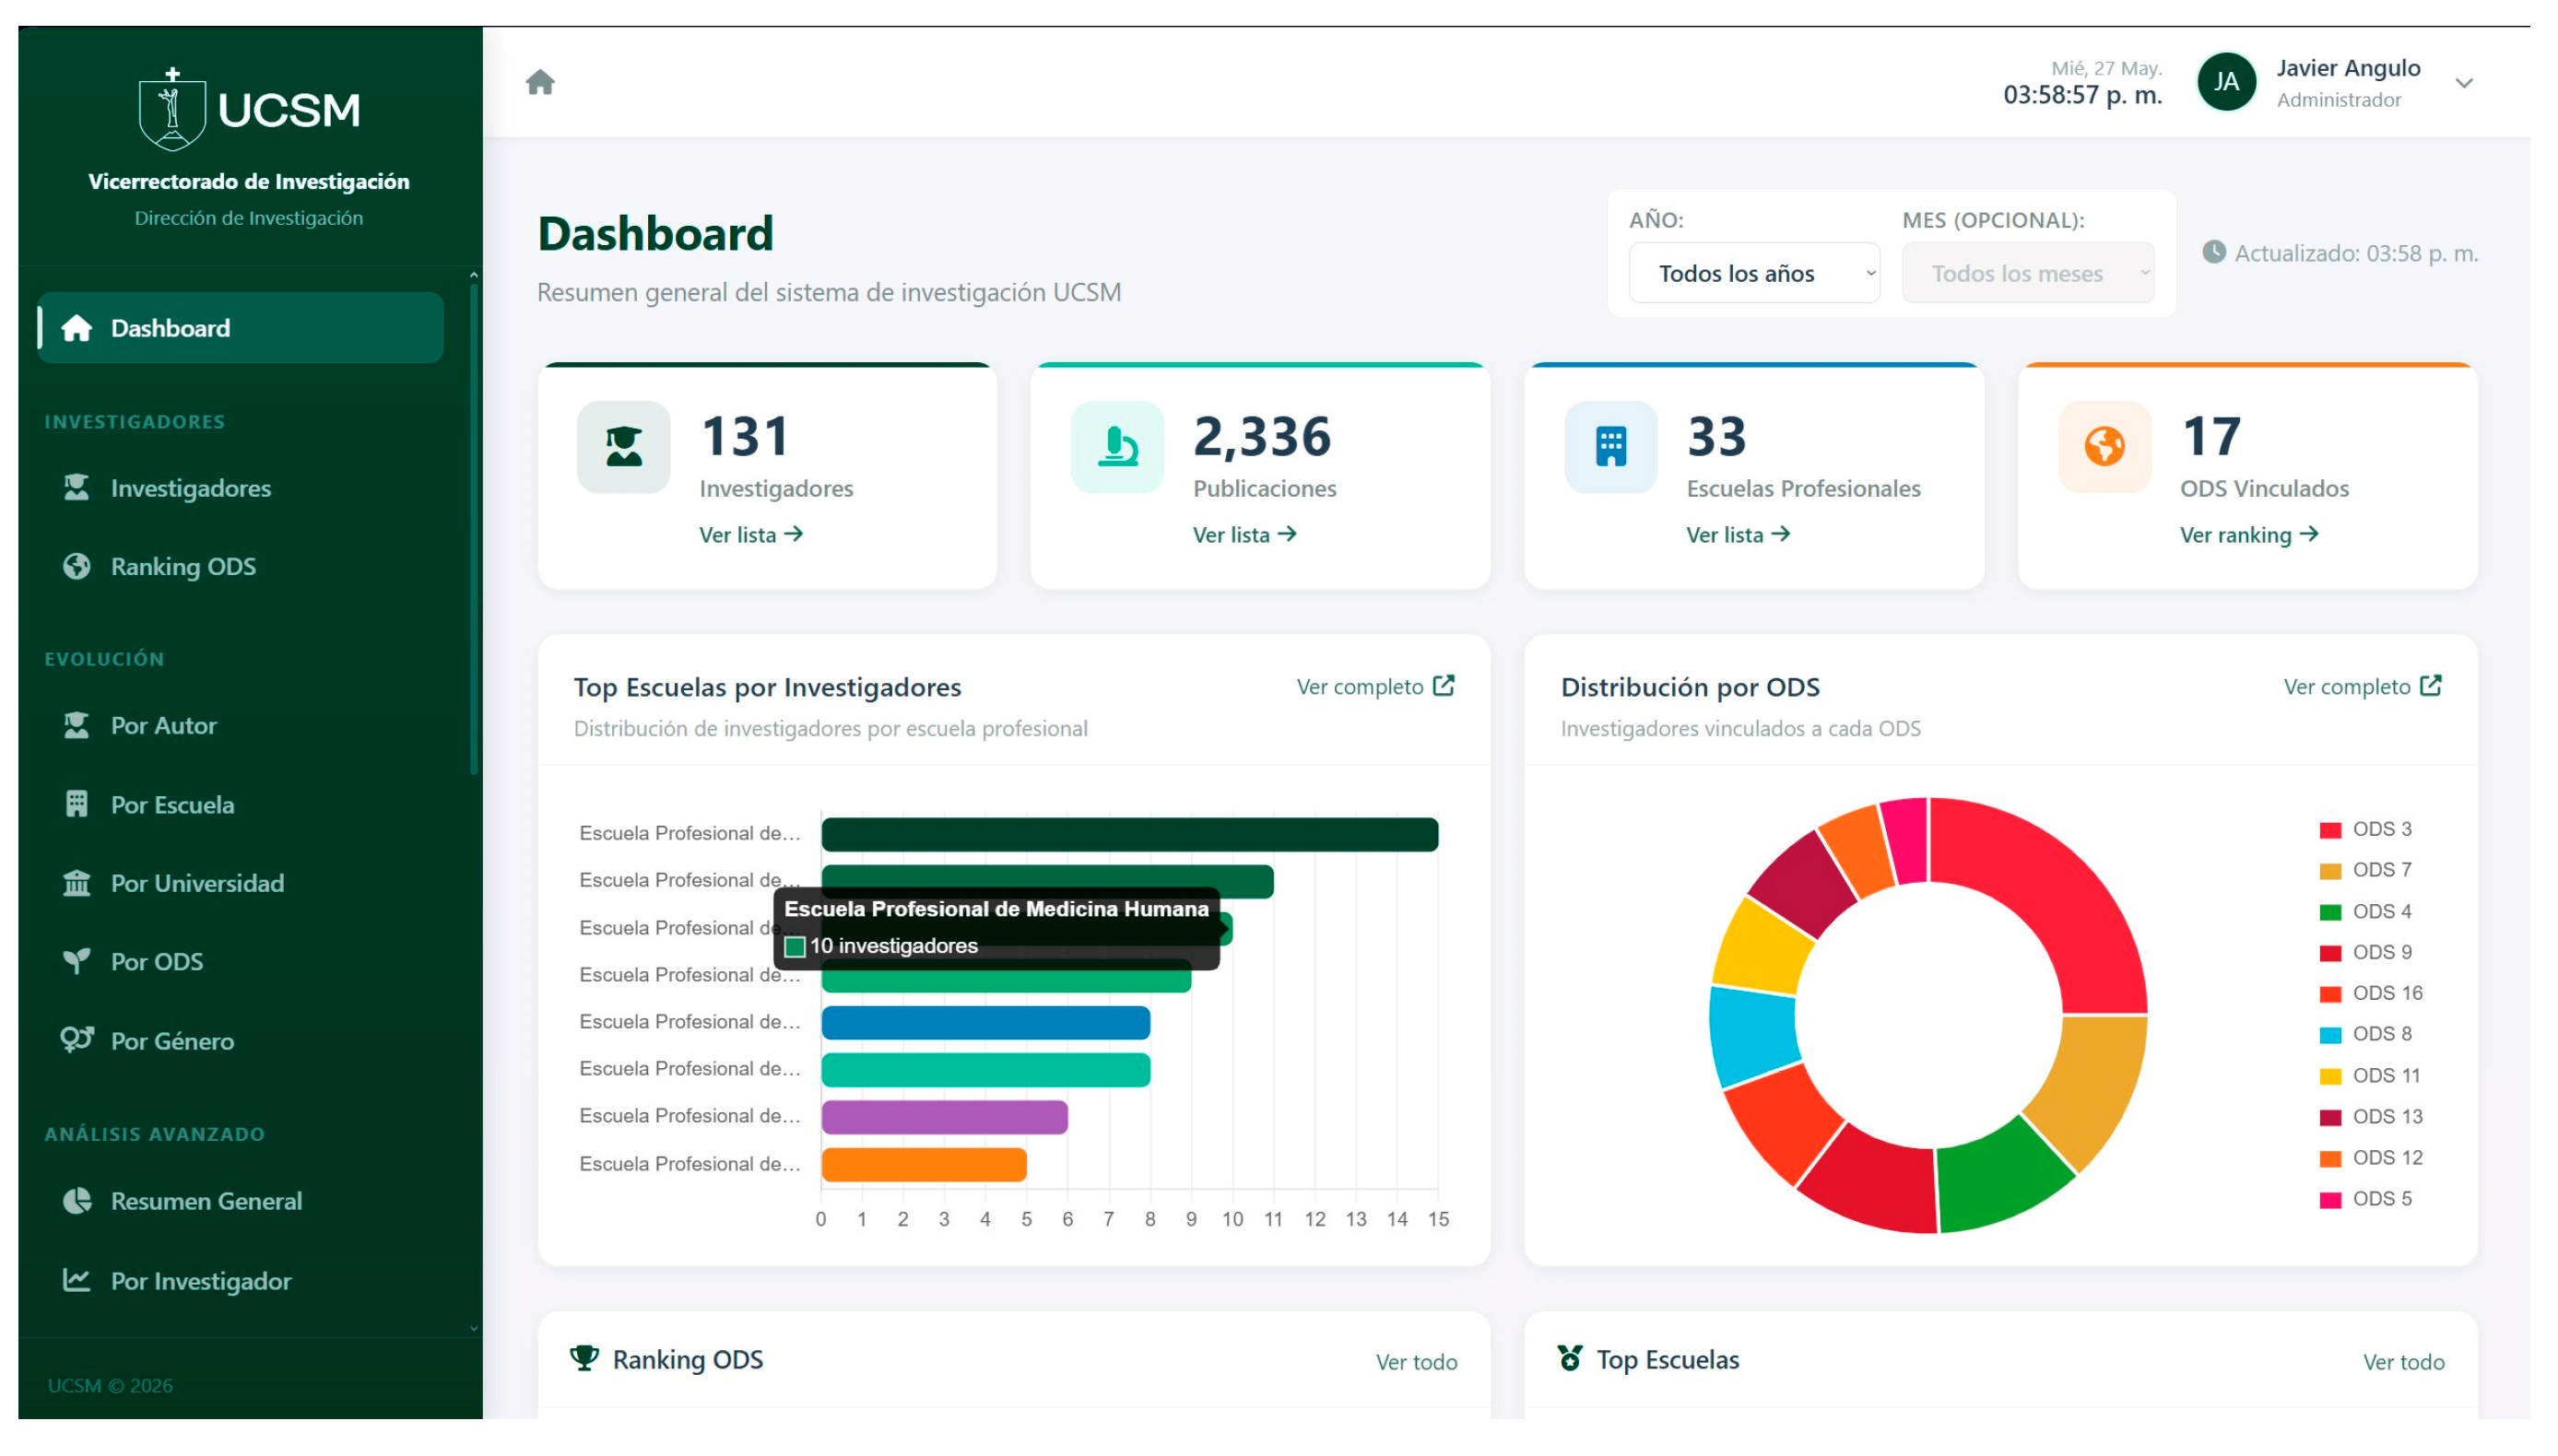
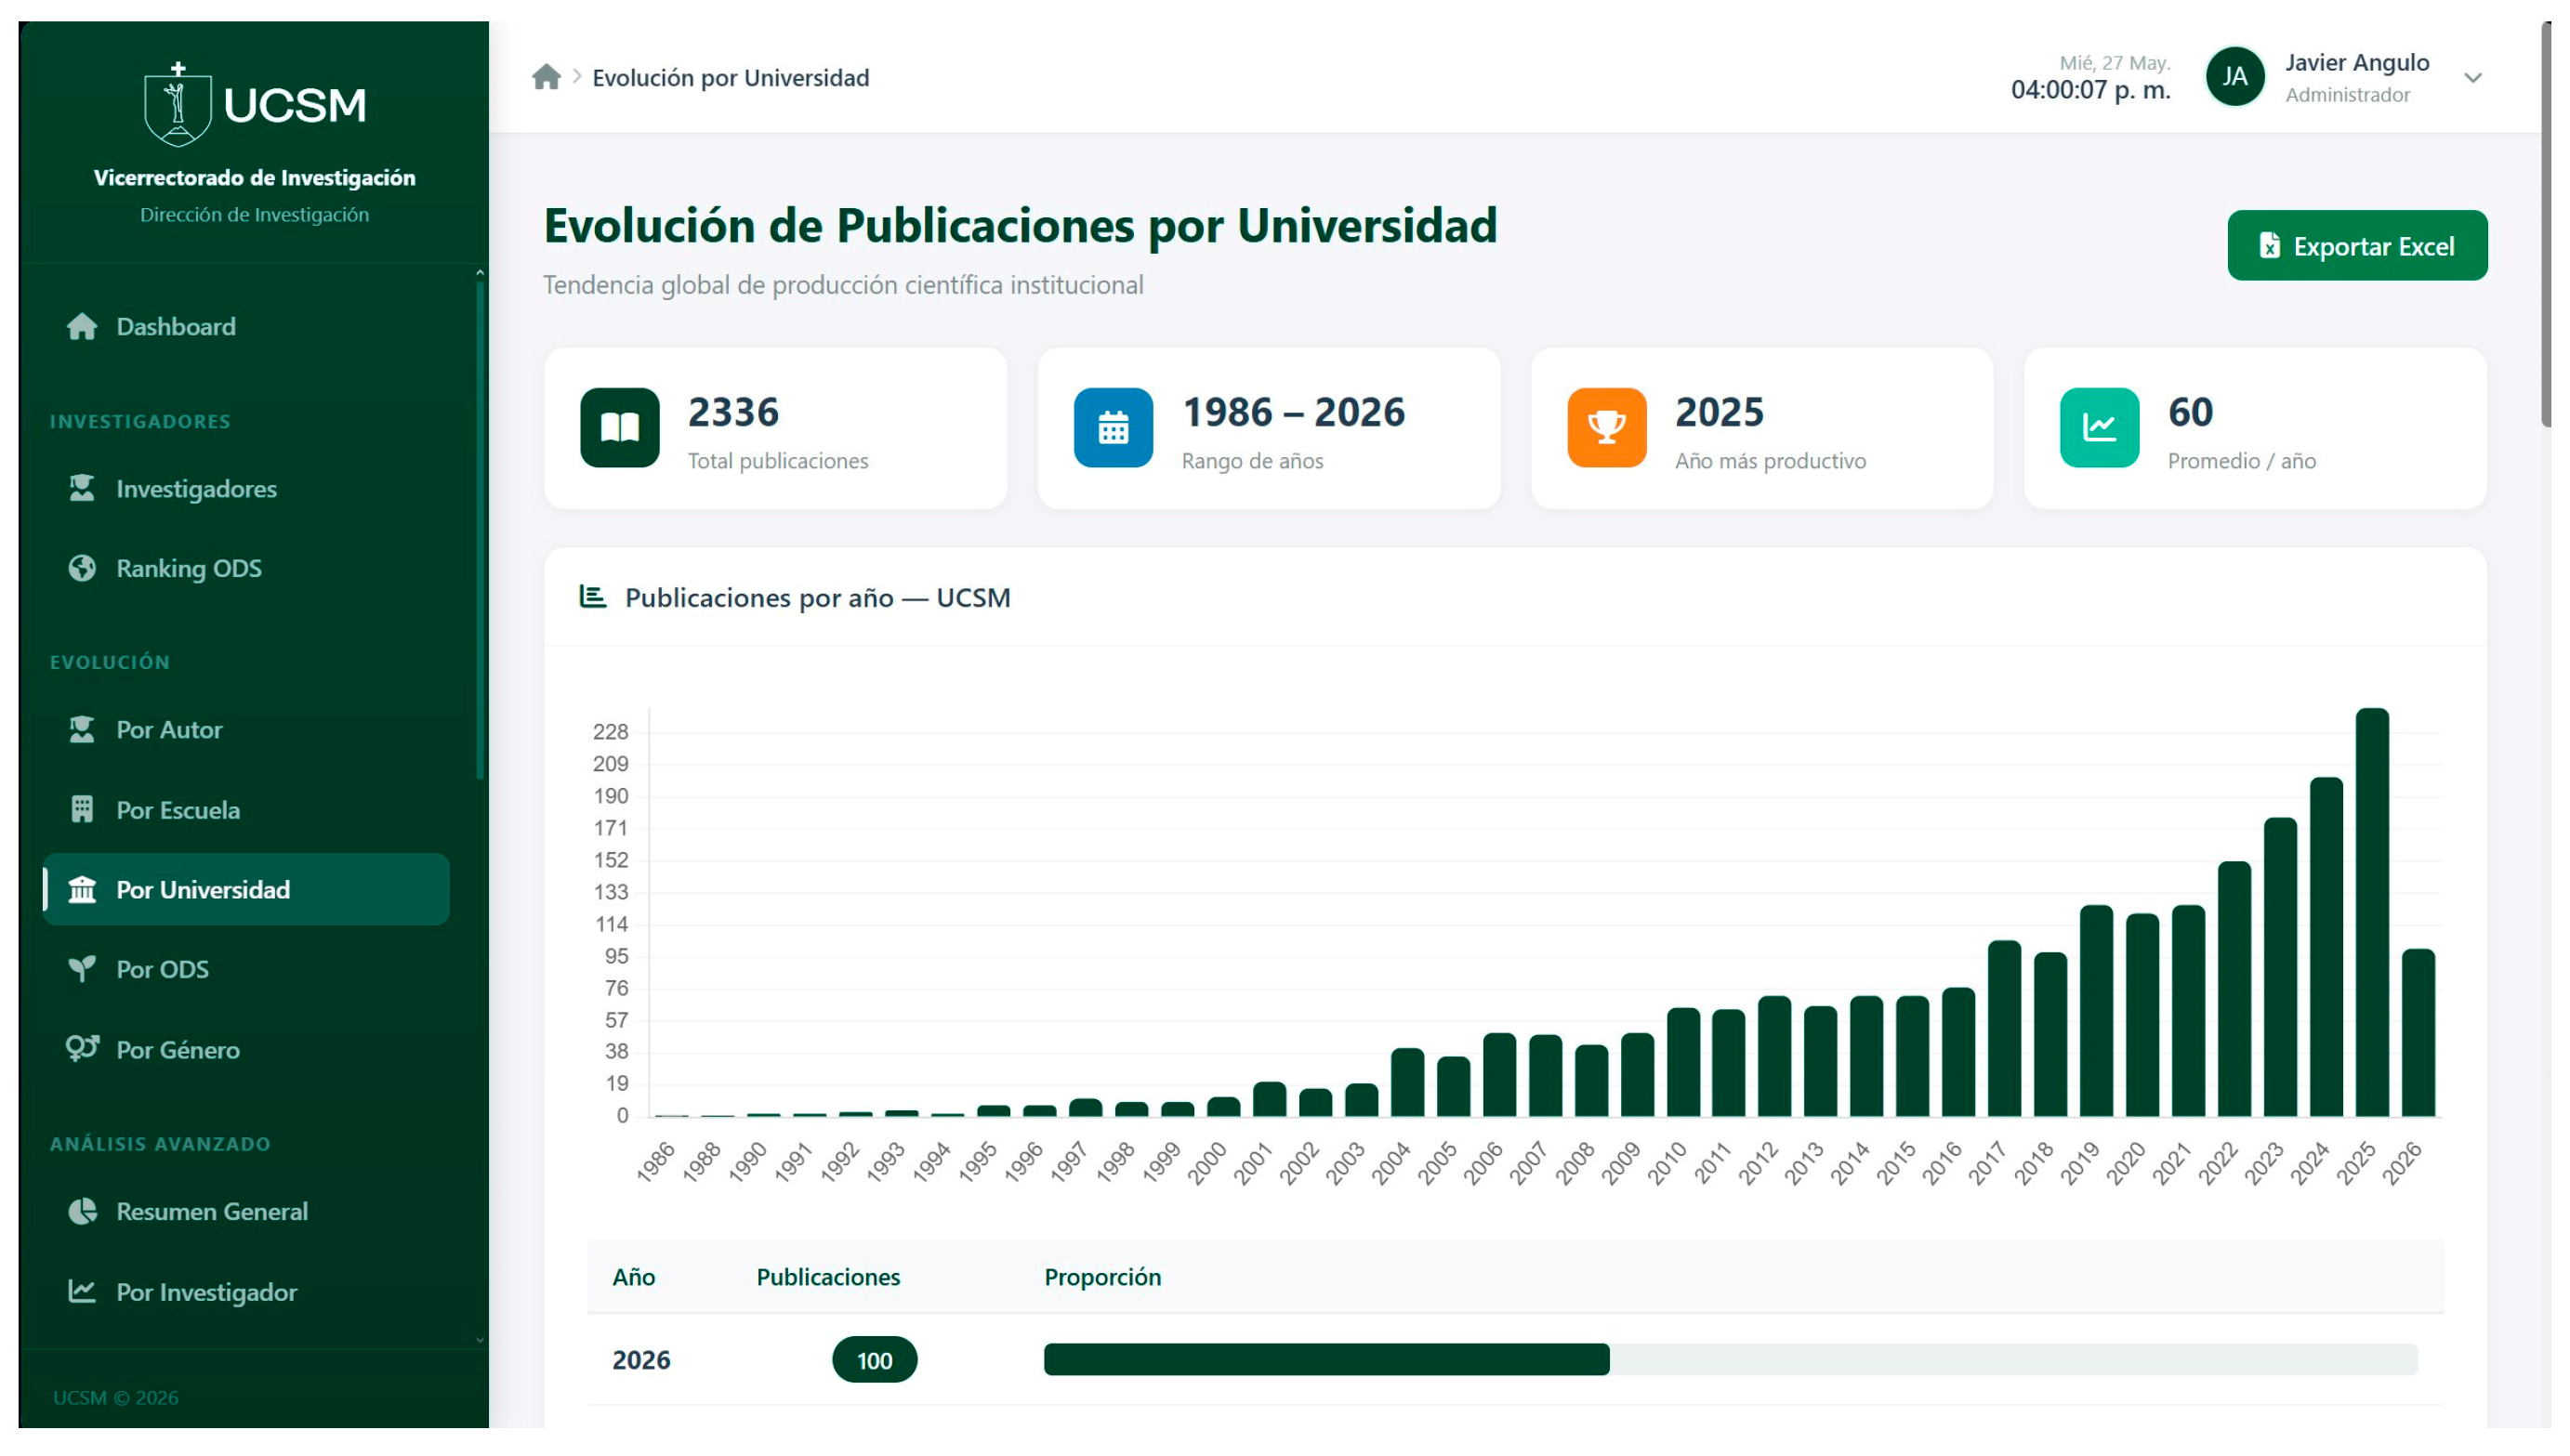
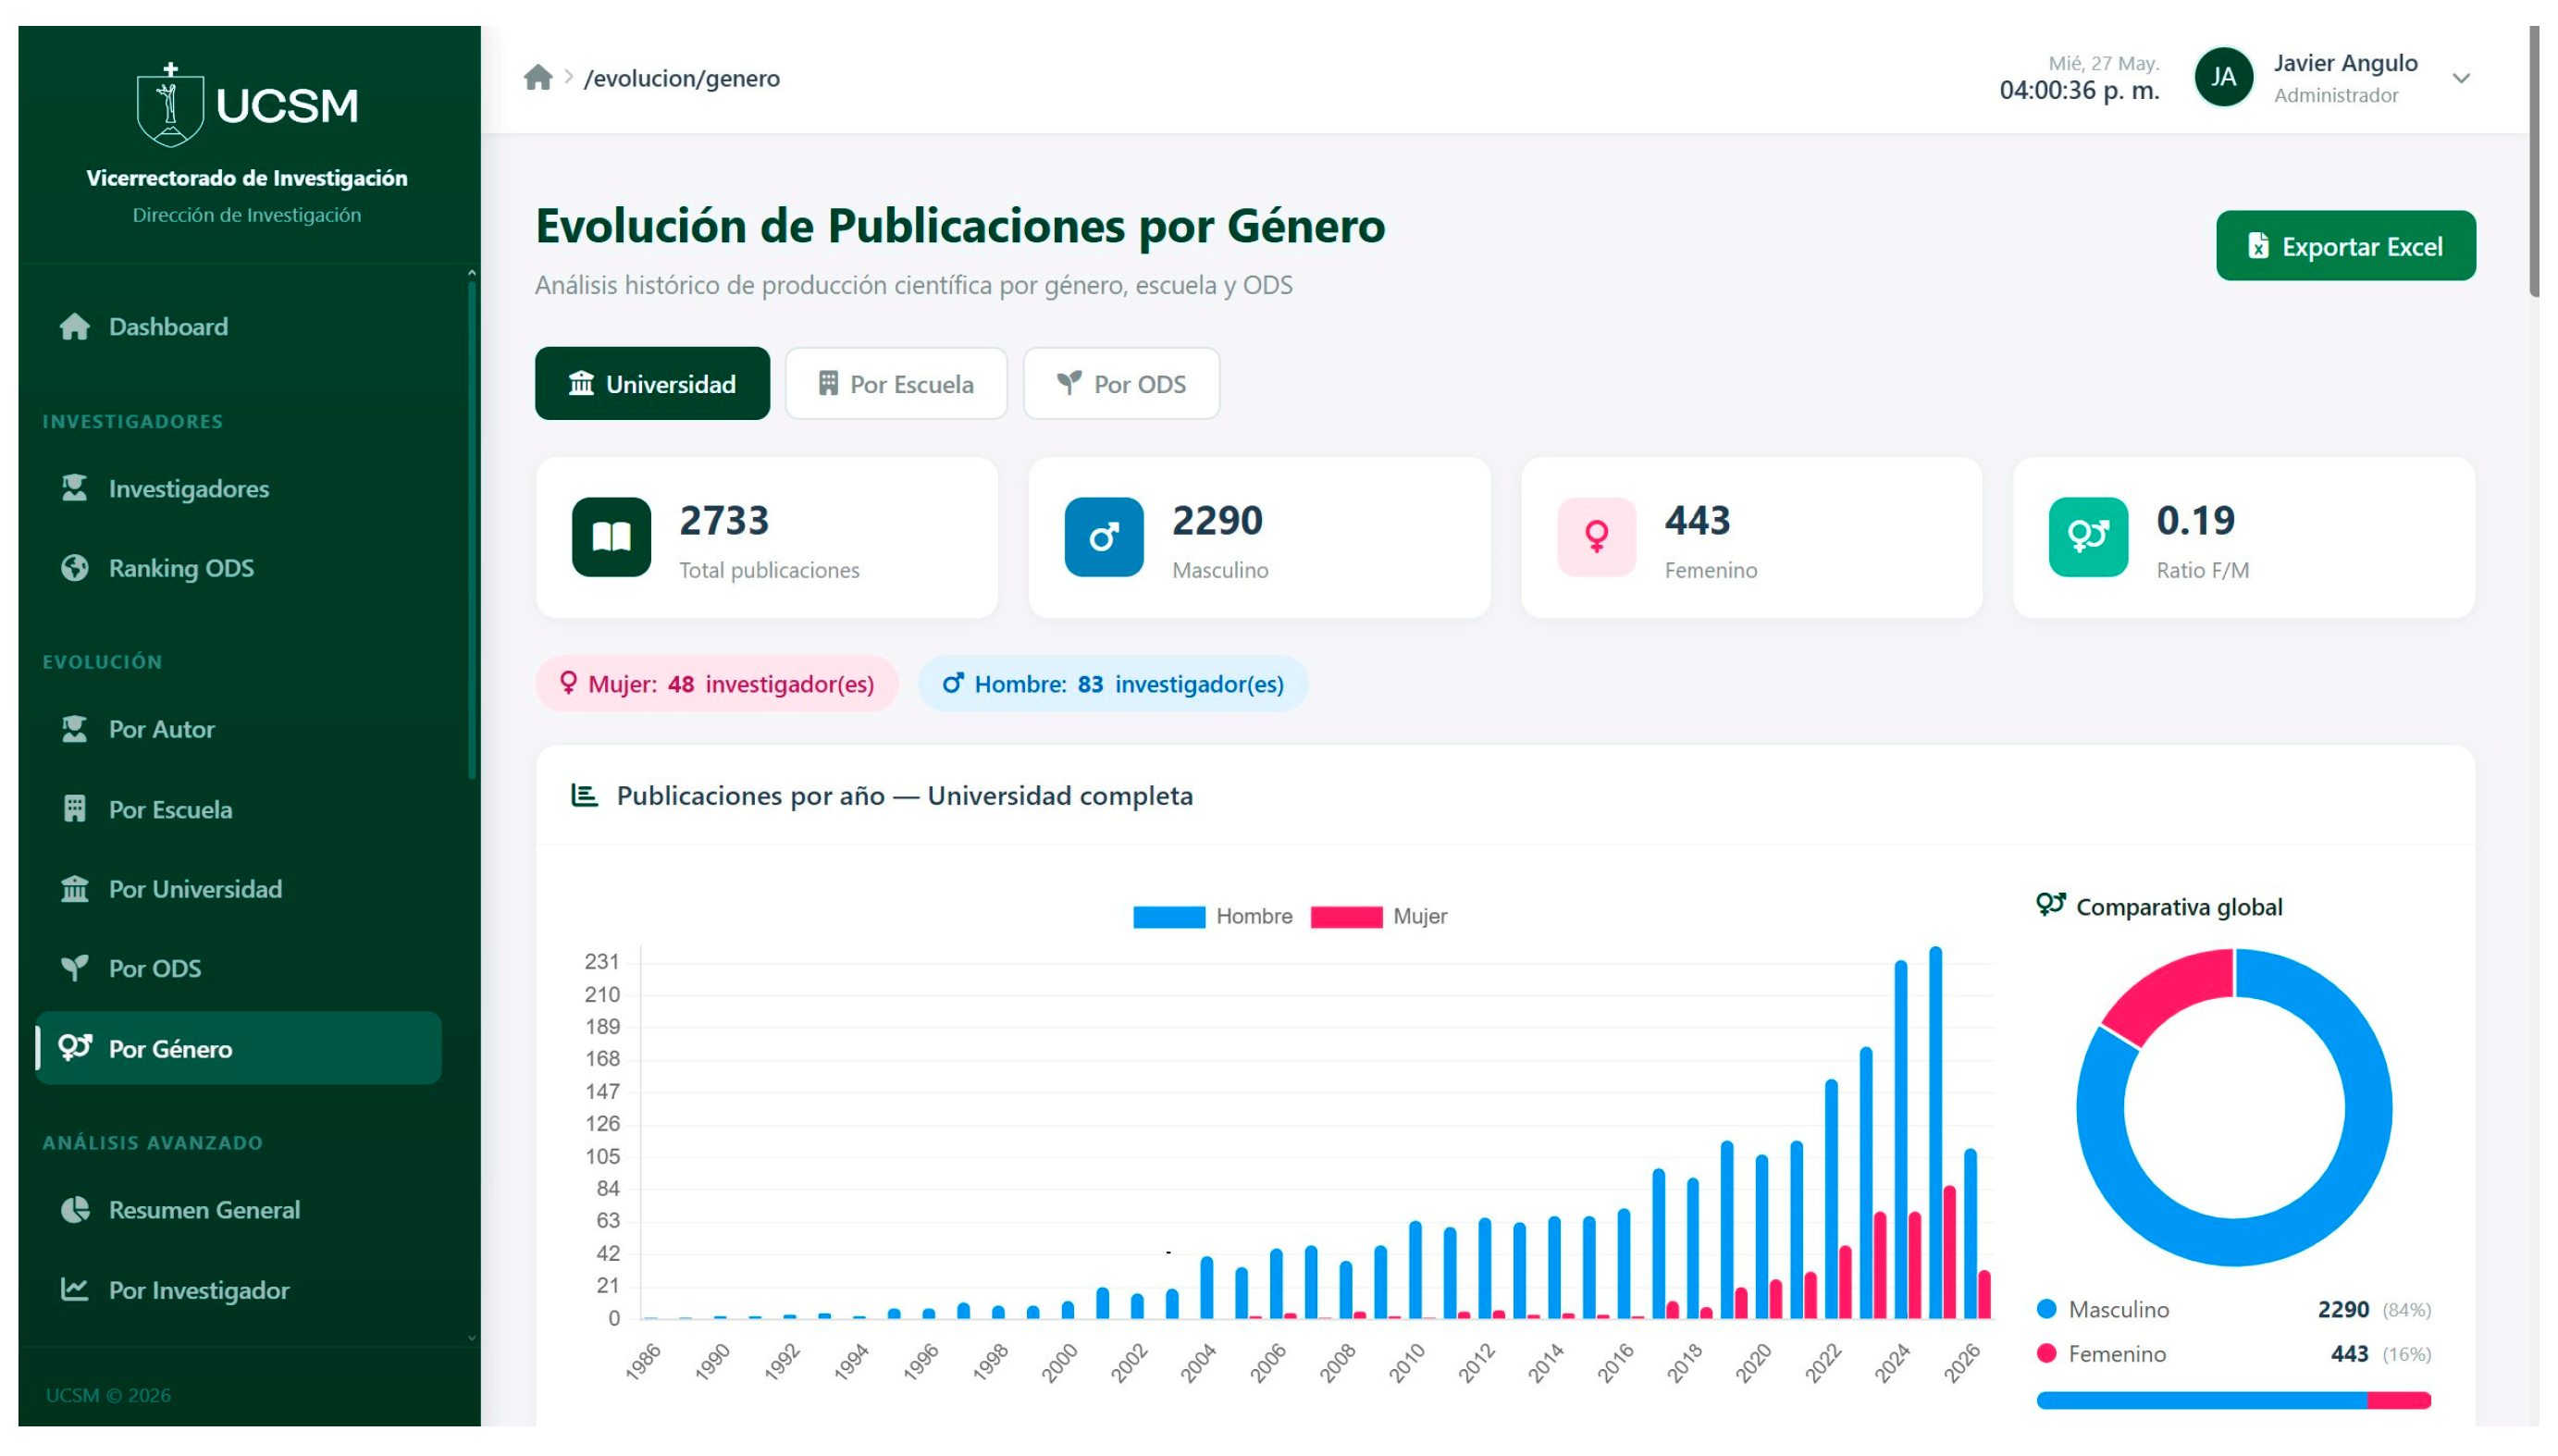
The Monitor CRIS UCSM is a browser-accessible Single Page Application (SPA) organized into two main functional blocks: the Researchers module and the Evolution and Advanced Analysis module. The permanent side navigation allows access to any module in one click, maintaining user context at all times. All modules offer Excel export and interactive filters by year, publication type, organizational unit, and researcher. Note on figures:
Figure 1,
Figure 2 and
Figure 3 present representative screenshots of the system interface, which is deployed in Spanish as the institutional language of UCSM; screenshots of the remaining modules are provided as
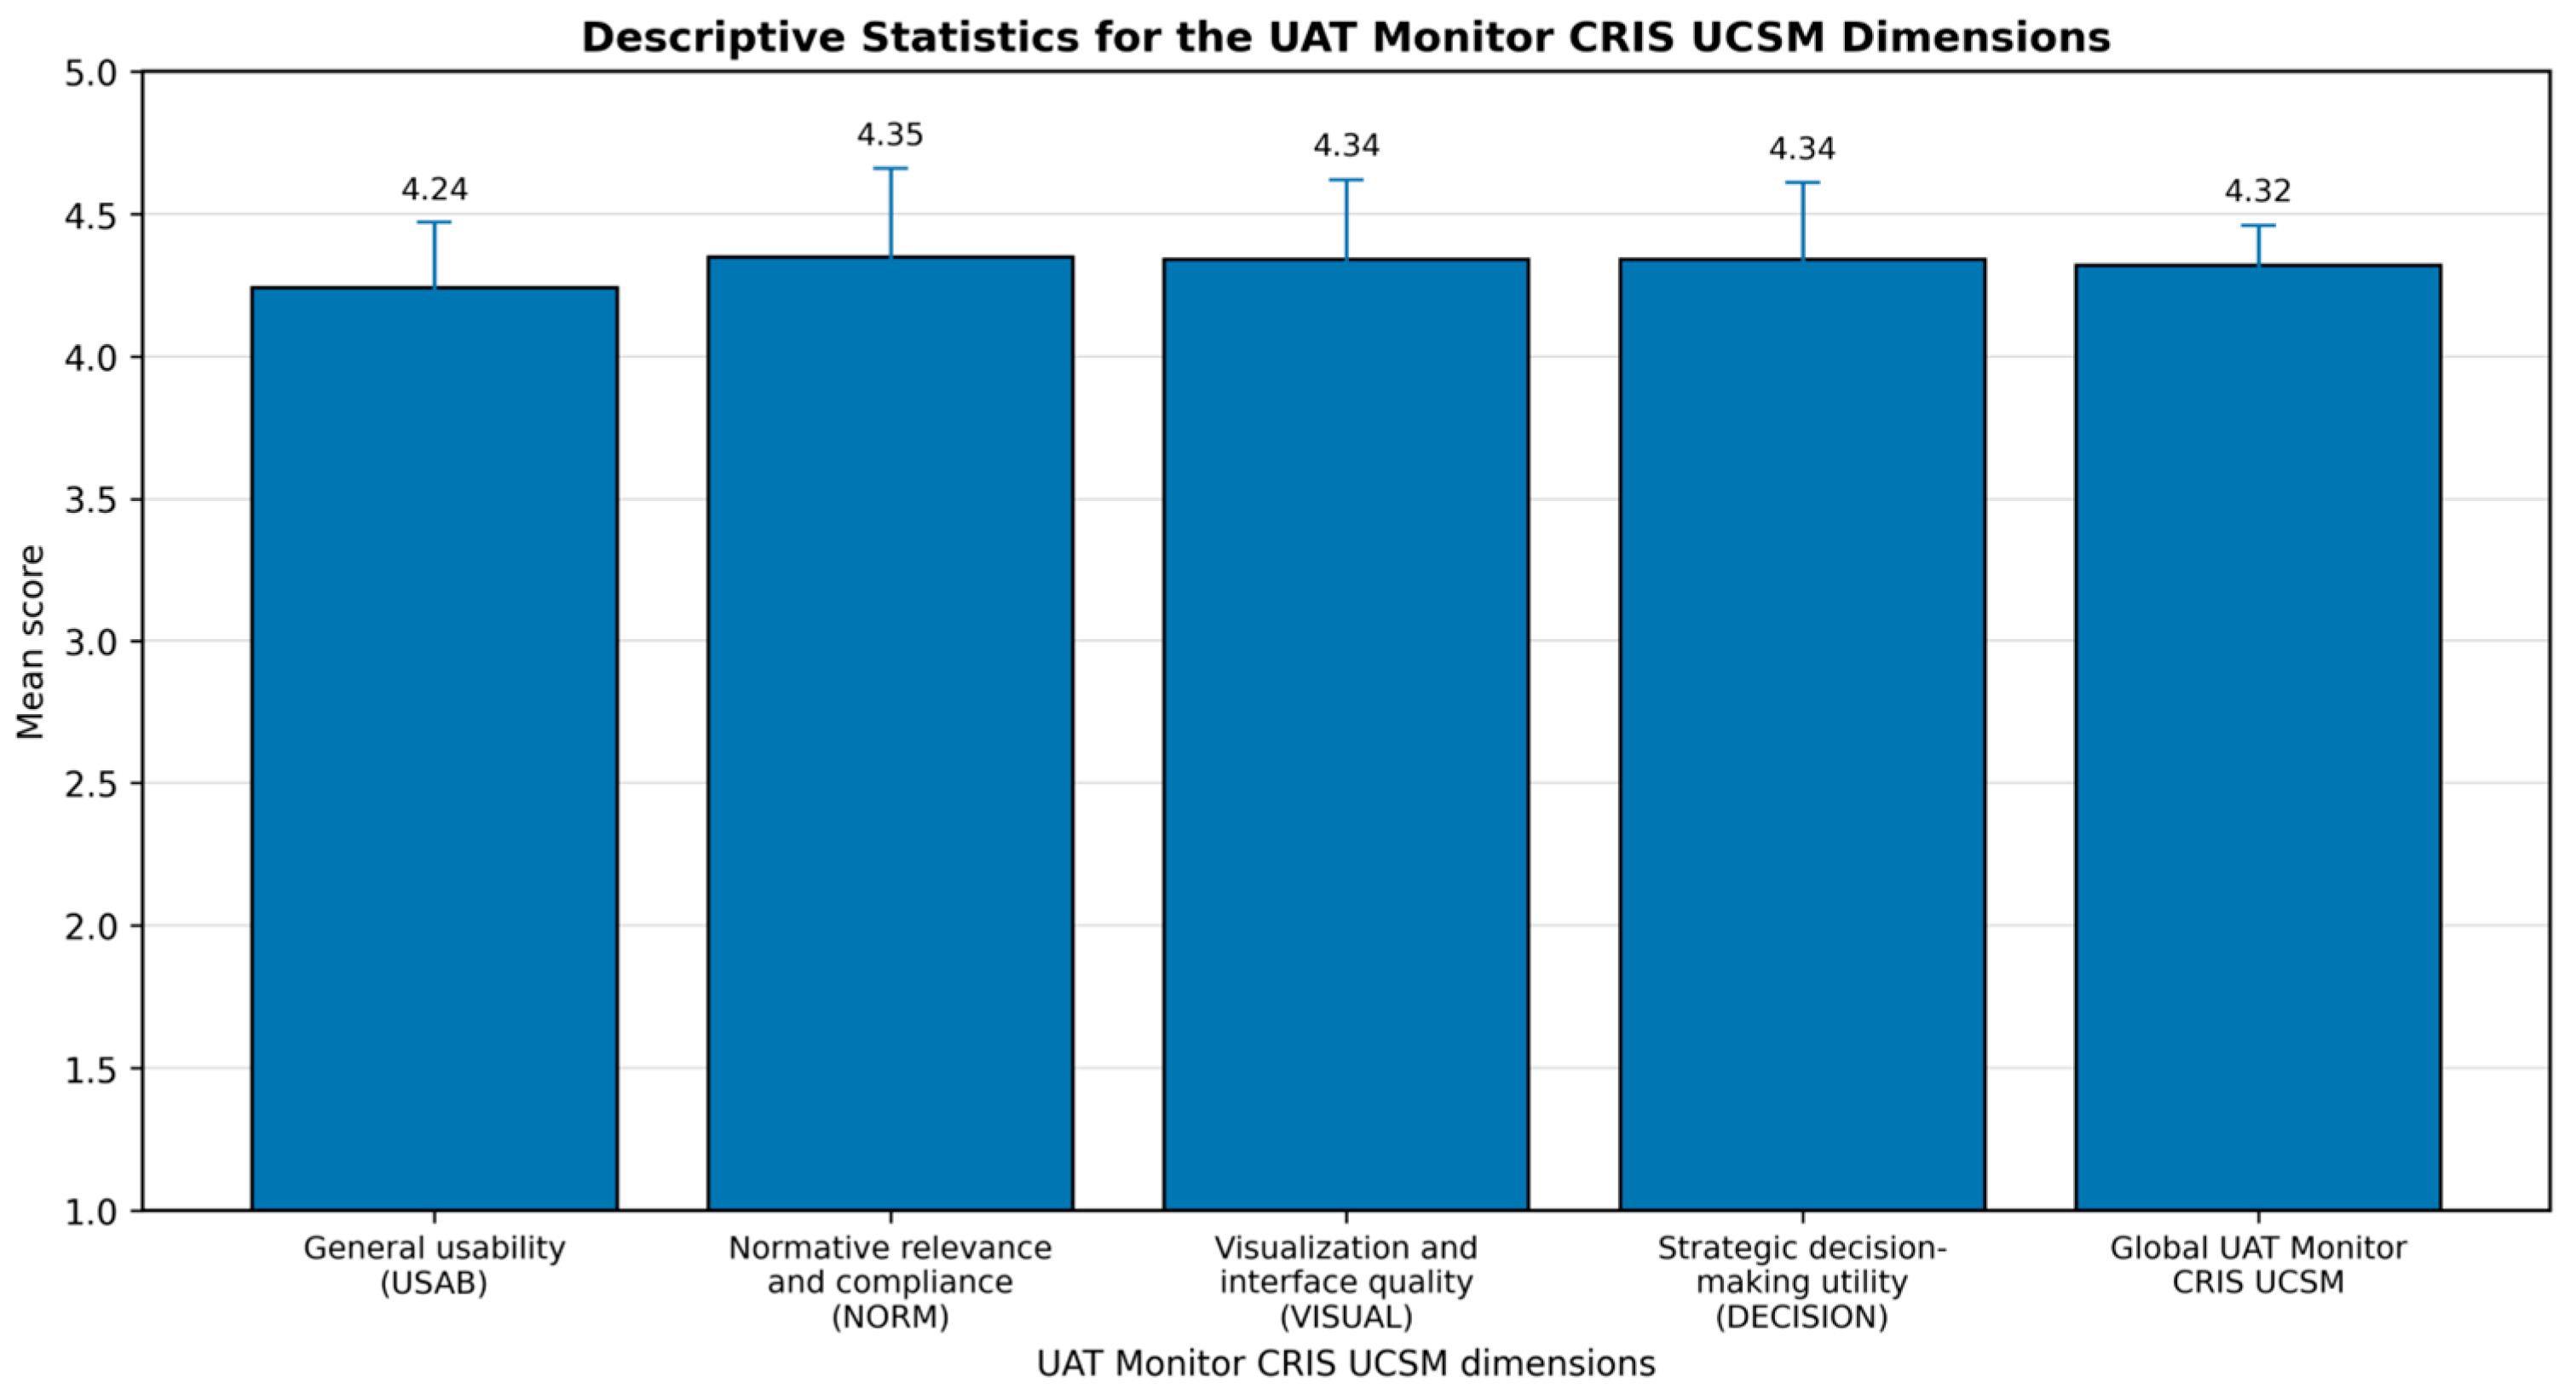
Supplementary Figures S1–S5. Key interface elements are described in the figure captions in English for the benefit of international readers. The screenshots are included to demonstrate the scope and visual design of the implemented system; they are not intended as standalone empirical evidence of user acceptance, which is addressed through the UAT results in
Section 5 and summarized graphically in
Figure 4.
4.1. Main Dashboard
The system’s main view (
Figure 1) presents four key performance indicators (KPIs) as summary cards: total number of researchers registered in Pure (131), total synchronized publications (2336), number of professional schools with recorded output (33), and number of SDGs linked to institutional production (17). Below the KPIs, two complementary visualizations are displayed: a horizontal bar chart showing the distribution of researchers by professional school, and a donut chart showing the percentage distribution of publications by SDG. The dashboard includes year and month filters in the upper right, with dynamic updating of all indicators when the selected period is changed.
4.2. Researchers Module
The Researchers module (
Figure S1) provides a paginated directory of the 131 researchers registered in Pure, with real-time search and filtering by name, ORCID, national ID, and Scopus ID. Each row includes a button to access the researcher’s individual bibliometric profile.
4.3. SDG Ranking Module
The SDG Ranking module (
Figure S2) presents the distribution of institutional scientific output aligned with the 17 Sustainable Development Goals of the UN 2030 Agenda. A vertical bar chart displays the number of researchers linked to each SDG in descending order; below it, an interactive table allows expanding each SDG to view the associated researchers. At UCSM, SDG 3 (Good health and well-being) accounts for the largest number of linked researchers (n = 67), followed by SDG 7 (Affordable and clean energy, n = 35) and SDG 4 (Quality education, n = 30).
4.4. Evolution by Author Module
The Evolution by Author module (
Figure S3) allows selecting a researcher via autocomplete search and visualizing their publication trajectory over time. The individual profile displays four KPIs: total publications, production year range, most productive year, and annual average publications. A vertical bar chart breaks down production year by year. In the illustrated example, the selected researcher has 50 publications in the 2022–2026 period, with 2023 as the most productive year (n = 14) and an average of 10 publications per year.
4.5. Evolution by Professional School Module
The Evolution by Professional School module (
Figure S4) replicates the logic of the previous module at the academic unit level. The user selects a professional school and the system displays collective production KPIs (total publications, year range, most productive year, annual average) alongside the number of active researchers. The example shows the School of Business Administration, with 21 publications in the 2021–2025 period, 2025 as the most productive year, and an average of 4 publications per year.
4.6. Evolution by University Module
The Evolution by University module (
Figure 2) provides the most aggregated view in the system: the complete historical evolution of UCSM’s institutional scientific output from 1986 to 2026. The KPIs show 2336 total publications, with 2025 as the most productive year and an average of 60 publications per year. The vertical bar chart shows a trend of accelerated growth from 2017 onward. This pattern coincides temporally with the implementation of SUNEDU’s licensing policies and the promotion of RENACYT researcher qualification; however, this study did not test the effect of those policies on publication output, so the association should be read as a descriptive observation rather than a causal claim.
4.7. Evolution by SDG Module
The Evolution by SDG module (
Figure S5) allows selecting one of the 17 SDGs and visualizing the temporal evolution of publications aligned to that goal. The KPIs show total publications, active year range, most productive year, and annual average. In the example, SDG 1 (No poverty) records 52 publications in the 2024–2026 period, with 2025 as the most productive year and an average of 17 publications per year. This module serves as a direct tool for preparing strategic alignment reports required in international institutional accreditation processes.
4.8. Evolution by Gender Module
The Evolution by Gender module (
Figure 3) analyzes the distribution of institutional scientific output by author gender, with views available by full university, professional school, and SDG. The global KPIs show 2733 total publication-author records, with 2290 attributed to male researchers (84%) and 443 to female researchers (16%), yielding an F/M ratio of 0.19. This figure differs from the 2336 unique publications reported in the main dashboard because the gender module counts publication-author pairs rather than unique publications: a single publication co-authored by three researchers generates three records in this module (one per author), so co-authored works are counted multiple times. The main dashboard (2336) counts unique publication records regardless of number of authors; the gender module (2733) counts the total number of individual author contributions. These are two distinct metrics serving different analytical purposes. A stacked bar chart by year and a global comparison donut chart allow visualizing the evolution of the gender gap in UCSM’s scientific output over time. The F/M ratio of 0.19 is a descriptive finding from the institutional data; gender attribution is based on Pure metadata as registered by authors themselves and has not been independently verified.
5. Results
This section reports only the closed-ended results of the UAT Monitor CRIS UCSM Questionnaire (reliability, SUS score, and the four Likert-based dimensions). The instrument also included six open-ended questions; those qualitative responses were not analyzed for this article and are reserved for future work, as noted in
Section 6 and
Section 7.
5.1. Instrument Reliability
The reliability analysis on the 134 valid cases yielded a global Cronbach’s alpha of α = 0.90, well above the threshold of 0.70 recommended for social science instruments (
Nunnally, 1978), indicating excellent internal consistency for the full instrument. Per-dimension reliability was as follows: General Usability/USAB (α = 0.86), Normative Relevance and Compliance/NORM (α = 0.88), Visualization and Interface Quality/VISUAL (α = 0.87), and Strategic Decision-Making Utility/DECISION (α = 0.89). All four dimensions exceeded the 0.70 threshold, confirming that each subscale exhibits satisfactory internal consistency independently of the others. These results indicate that the items within each dimension respond in a coherent and homogeneous manner at both the full-instrument and dimension level. Throughout this article, accordingly, the four dimensions are treated as theoretically informed descriptive subscales; internal consistency alone does not establish them as distinct, psychometrically validated latent constructs, which would require the factor-analytic evidence identified as a direction for future work.
5.2. Perceived Usability: SUS Score
Perceived usability was measured using the adapted version of the SUS, expressed on a scale from 0 to 100. Descriptive statistics for the total score are presented in
Table 4.
The mean was M = 81.12 (SD = 5.83), with a minimum of 67.50 and a maximum of 95.00, placing the system in the Good category and close to the Excellent threshold. As a descriptive reference, this value is approximately 11 points above the global mean of M = 70.09 reported by
Vlachogianni and Tselios (
2022) in their systematic review of 104 SUS studies on educational technology; however, this comparison is offered as contextual information rather than as a statistical claim, given that the adapted items and the specific institutional context differ from those of the benchmark studies. The relatively low dispersion (SD = 5.83) indicates that ratings were broadly consistent across respondents, although low dispersion alone does not rule out subgroup effects or institutional response tendencies—no subgroup analysis was conducted in this study and such effects cannot be excluded.
5.3. Dimension Ratings of the UAT Monitor CRIS UCSM
The four questionnaire dimensions and the global average are presented in
Table 5 and summarized graphically in
Figure 4.
Table 5.
Descriptive statistics for the UAT Monitor CRIS UCSM dimensions.
Table 5.
Descriptive statistics for the UAT Monitor CRIS UCSM dimensions.
| Dimension | N | Min. | Max. | M | SD |
|---|
| General usability (USAB) | 134 | 3.70 | 4.80 | 4.24 | 0.23 |
| Normative relevance and compliance (NORM) | 134 | 3.40 | 5.00 | 4.35 | 0.31 |
| Visualization and interface quality (VISUAL) | 134 | 3.50 | 5.00 | 4.34 | 0.28 |
| Strategic decision-making utility (DECISION) | 134 | 3.60 | 5.00 | 4.34 | 0.27 |
| Global UAT Monitor CRIS UCSM | 134 | 3.93 | 4.66 | 4.32 | 0.14 |
All dimensions reached means above 4.20, placing them uniformly in the very favorable category. The NORM dimension obtained the highest mean (M = 4.35; SD = 0.31), reflecting the high perceived relevance of the system for meeting Peruvian regulatory requirements (SUNEDU/RENACYT). VISUAL (M = 4.34; SD = 0.28) and DECISION (M = 4.34; SD = 0.27) obtained virtually identical values, indicating that interface quality and strategic management utility are perceived as equally valuable by respondents. USAB (M = 4.24; SD = 0.23) showed the lowest standard deviation of all dimensions, suggesting that ease of use is perceived relatively homogeneously across respondent profiles. The global average (M = 4.32; SD = 0.14) reflects a balanced rating profile, with no dimension falling markedly below the others. It should be noted that this consistency across dimensions does not in itself constitute evidence of convergent validity in the psychometric sense, which would require factor-analytic support not reported in this study; the pattern is best interpreted descriptively as indicating a coherent and uniformly positive user experience in this institutional context. Item-level descriptive statistics for all 26 questionnaire items (
Table S1) are provided as
Supplementary Material so that readers can assess whether the favorable dimension means are driven uniformly across items or by a subset of items.
6. Discussion
The SUS-adapted score of 81.12 is descriptively above the means typically reported for restricted-access institutional information systems (68–75 according to
Sauro & Lewis, 2016) and the global mean for university platforms (70.09) documented by
Vlachogianni and Tselios (
2022). These comparisons should be treated as contextual reference points rather than as statistically significant differences, since no inferential test was conducted and the adapted instrument differs from the original SUS. With that caveat, the result is meaningfully favorable, and it is particularly notable that it was obtained from a sample predominantly composed of occasional users with intermediate digital competence. In previous studies of academic management systems, frequency of use is a significant predictor of usability perception (
Davis, 1989;
Venkatesh et al., 2003); achieving a score of 81.12 among predominantly occasional users is encouraging and is compatible with a low barrier to initial use, in line with the TAM construct of perceived ease of use. However, the learning curve was not measured directly in this study, so this interpretation should be regarded as tentative. More generally, given the internal evaluation context described in
Section 3.5, the uniformly high ratings with low dispersion are best read as encouraging but potentially inflated perception-based outcomes, rather than as definitive evidence of usability or strategic utility.
The highest score obtained by the NORM dimension (M = 4.35) has a specific reading in the Peruvian context: the regulatory pressure from SUNEDU licensing and RENACYT criteria creates a real and immediate demand for organized and auditable scientific information that CRISs are well positioned to meet. The fact that those responsible for producing institutional reports value this dimension above general usability or visual quality suggests that functional relevance—the capacity to resolve concrete problems within the regulatory environment—is the primary driver of acceptance in this context. This finding is consistent with the results of
Azeroual et al. (
2019), who identified utility for research reporting and evaluation as the most influential determinant of RIS acceptance in European academic settings. Because all results in this study are reported at the aggregate level, these interpretations cannot be differentiated by stakeholder role; as argued in
Section 2.5, dashboard perceptions may vary substantially across roles, so role-specific conclusions are not warranted by the present data.
The results across the four dimensions are consistent with the theoretical frameworks that informed the instrument design. The very favorable rating for USAB (M = 4.24) is consistent with the TAM construct of perceived ease of use (
Davis, 1989); the DECISION rating (M = 4.34) aligns with the perceived usefulness construct and the net benefits dimension of the D&M model (
DeLone & McLean, 2003); and the VISUAL rating (M = 4.34) parallels the system quality dimension of the same model. The broadly consistent ratings across the four dimensions—reflected in the low global dispersion (SD = 0.14)—suggest that the evaluated constructs together describe a coherent user experience. It should be noted, however, that demonstrating convergent validity in the psychometric sense would require factor-analytic evidence (e.g., factor loadings, AVE values) not reported in this study; the theoretical alignment described here is therefore an interpretive observation, not a validated measurement claim.
Within the UCSM case, the results support the technical feasibility of building institutional monitoring systems on Elsevier Pure’s REST API, adapting its outputs to local regulatory requirements without additional infrastructure; whether this approach transfers to other institutions remains an empirical question that this study cannot answer. The selected stack (Laravel 11/Vue.js 3/MySQL 8.0) offers a combination of technical maturity, active documentation, and moderate learning curve, factors particularly relevant for Latin American university development teams with limited resources. The BFF architecture and session cache system implemented demonstrate that acceptable performance is achievable despite the inherent latency of calls to external APIs such as Pure.
The study has limitations that must be considered when interpreting its results and that directly constrain several of the interpretive claims made above. (a) Single-institution design: all findings are specific to UCSM and its particular regulatory, cultural, and organizational context; generalization to other Peruvian or Latin American universities cannot be asserted on the basis of this study alone. (b) Cross-sectional design: the UAT was administered at a single point in time after system deployment, preventing assessment of whether positive perceptions are sustained with continued use. (c) Absence of subgroup analyses: no comparisons were conducted across role types, professional schools, years of experience, or Pure usage frequency; meaningful differences among these groups may exist and cannot be excluded given the current data. (d) Potential for social desirability and acquiescence bias: participants evaluated a system developed within their own institution, and some respondents may have had collegial or hierarchical relationships with the development team; the high mean values and relatively high floor values reported are consistent with this risk. (e) Instrument validation: the UAT questionnaire demonstrated strong internal consistency but has not yet been subjected to factor-analytic validation; claims of convergent validity are therefore not yet empirically supported. (f) Absence of outcome data: the study measured perceived acceptance and usability, not actual decision-making behavior, institutional performance, or regulatory compliance outcomes; conclusions about strategic governance impact go beyond what was measured. (g) Qualitative data: the open-ended responses were not analyzed in this study and represent an opportunity for richer interpretation in future work.
The results open several research directions: (a) comparative subgroup analyses by position, unit, experience, and digital competence; (b) longitudinal study of use retention and acceptance at 6 and 12 months; (c) thematic analysis of open-ended questionnaire responses; and (d) replication of the methodology at other Peruvian universities with access to Elsevier Pure, to build comparative evidence on CRIS adoption factors in the region.
7. Conclusions
This article has described the design, development, and user acceptance validation of the Monitor CRIS UCSM, a research monitoring system built on the Elsevier Pure REST API for the Universidad Católica de Santa María in Arequipa. The validation results with 134 institutional stakeholders provide favorable evidence—within the boundaries of a single-institution case based on perception data—that the study objectives were addressed.
Three main findings synthesize the contribution of the work. First, the system was developed with a three-tier decoupled architecture (Laravel 11/Vue.js 3/MySQL 8.0) featuring a BFF pattern, RBAC, and six visualization modules, integrating the complete cycle from Pure API synchronization to interactive dashboard presentation. Second, the UAT instrument designed specifically for this context showed excellent internal consistency (α = 0.90) and the system achieved a SUS score of M = 81.12—rated Good, approaching Excellent—descriptively above comparative benchmarks reported in the literature (no inferential test was conducted). Third, the four UAT questionnaire dimensions received very favorable ratings (global M = 4.32; SD = 0.14), with the normative relevance dimension as the most highly rated (M = 4.35), reflecting the high pertinence of the system for meeting the requirements of the Peruvian regulatory framework (Law No. 30220, SUNEDU, CONCYTEC-RENACYT).
The original contribution of this work to the CRIS field in Latin American contexts is twofold. On one hand, it demonstrates, within the UCSM case, the technical feasibility of building monitoring solutions on the API of a commercial RIMS platform and adapting its outputs to a specific local regulatory framework (Law No. 30220, SUNEDU, RENACYT) using a technology stack accessible to university development teams with moderate resources—answering RQ1 affirmatively within the UCSM institutional context. On the other hand, addressing RQ2, it shows that UCSM stakeholders perceived the system as usable, normatively relevant, and useful for strategic decision-making, with consistently favorable ratings across all four UAT dimensions. The UAT Monitor CRIS UCSM Questionnaire—showing adequate internal consistency (α = 0.90 overall; α range 0.86–0.89 per dimension) across 134 participants—is offered as a context-specific evaluation tool with encouraging reliability, available for adaptation and further validation by other institutions operating in similar regulatory environments. Until such evidence is available, the questionnaire should be regarded as a context-specific evaluation instrument with good internal reliability rather than as a validated measurement scale. Broader psychometric validation—in particular, exploratory factor analysis followed by confirmatory factor analysis to examine construct validity—is a recommended direction for future work before the instrument is used in comparative studies.
The study’s limitations—single-institution case, cross-sectional design, absence of subgroup analyses, potential social desirability bias, and pending qualitative analysis of open-ended responses—must be kept in view when interpreting these findings. In particular, this study did not assess objective organizational outcomes, external adoption, cross-institutional portability, or longitudinal use; its evidence is limited to technical implementation within one institution and to favorable perceptions among internal users. Conclusions about strategic impact, downstream decision-making outcomes, or institutional performance improvement go beyond what this study has measured and should not be inferred from the acceptance results. In summary, the Monitor CRIS UCSM is shown to be a technically functional, normatively relevant, and well-received system within the UCSM context. Whether similar systems would achieve comparable acceptance in other Peruvian or Latin American universities is an empirical question that future multi-institutional replication studies should address.
Supplementary Materials
The following supporting information can be downloaded at:
https://www.mdpi.com/article/10.3390/publications14030046/s1. Figure S1: Researchers Module; Figure S2: SDG Ranking Module; Figure S3: Evolution by Author Module; Figure S4: Evolution by Professional School Module; Figure S5: Evolution by SDG Module; Table S1: Item-level descriptive statistics (mean, SD, minimum, maximum) for all 26 UAT questionnaire items, by dimension.
Author Contributions
Conceptualization, J.F.A.-O. and C.D.V.-P.; methodology, J.F.A.-O. and C.D.V.-P.; software, J.F.A.-O., K.R.-P. and G.E.R.-F.; validation, J.F.A.-O., K.R.-P. and G.E.R.-F.; formal analysis, J.F.A.-O. and C.D.V.-P.; investigation, J.F.A.-O., C.D.V.-P. and D.F.A.A.-O.; resources, J.F.A.-O.; data curation, J.F.A.-O. and K.R.-P.; writing—original draft preparation, J.F.A.-O.; writing—review and editing, J.F.A.-O., C.D.V.-P., K.R.-P., D.F.A.A.-O. and G.E.R.-F.; visualization, J.F.A.-O. and G.E.R.-F.; supervision, C.D.V.-P.; project administration, J.F.A.-O. All authors have read and agreed to the published version of the manuscript.
Funding
This research received no external funding.
Data Availability Statement
The data supporting the findings of this study were obtained from the Elsevier Pure institutional repository of the Universidad Católica de Santa María (UCSM), accessed via the institution’s public CRIS portal. The raw survey data (UAT responses) are not publicly available due to participant confidentiality agreements; however, the aggregate statistical outputs reported in this study are fully presented within the article. The complete bilingual questionnaire (
Appendix A), the item-level codebook, and a non-identifiable aggregate summary dataset of the UAT responses are available from the corresponding author upon reasonable request, together with technical documentation of the system’s API integration layer. Requests for further information may be directed to the corresponding author.
Acknowledgments
During the preparation of this manuscript, the authors used GenAI exclusively for language editing and style corrections. The authors have reviewed and edited the output and take full responsibility for the content of this publication.
Conflicts of Interest
The authors declare no conflicts of interest.
Appendix A. UAT Monitor CRIS UCSM Questionnaire—Full Item List
The instrument comprises four dimensions. Dimension 1 (USAB—General Usability, SUS-adapted, 10 items) uses the standard SUS scoring algorithm (
Brooke, 1996): items 1, 3, 5, 7, 9 are positively worded (score = position − 1); items 2, 4, 6, 8, 10 are negatively worded (score = 5 − position); the composite SUS score = sum of 10 scores × 2.5 (range 0–100). Dimensions 2–4 (NORM, VISUAL, DECISION, 5 items each, plus one additional global item) use a 5-point Likert scale (1 = strongly disagree, 5 = strongly agree); the dimension score is the arithmetic mean of its items. The instrument was administered in Spanish; English translations are provided below for international readers.
Dimension 1: General Usability (USAB)—SUS-adapted (10 items)
USAB1. [ES] Creo que me gustaría usar el Monitor CRIS UCSM con frecuencia en mi actividad profesional. [EN] I think I would like to use the Monitor CRIS UCSM frequently in my professional work. [positive] USAB2. [ES] Encuentro el sistema innecesariamente complejo para las tareas que realizo. [EN] I find the system unnecessarily complex for the tasks I perform. [negative] USAB3. [ES] Pienso que el sistema es fácil de usar sin necesidad de asistencia técnica. [EN] I think the system is easy to use without technical assistance. [positive] USAB4. [ES] Necesitaría el apoyo de un especialista técnico para poder utilizar el sistema de forma autónoma. [EN] I would need the support of a technical specialist to use the system independently. [negative] USAB5. [ES] Las distintas funciones y módulos del sistema están bien integrados entre sí. [EN] The different functions and modules of the system are well integrated with each other. [positive] USAB6. [ES] Percibo que el sistema presenta inconsistencias en la forma en que presenta la información. [EN] I perceive that the system presents inconsistencies in the way it displays information. [negative] USAB7. [ES] La mayoría de los usuarios de la UCSM aprenderían a usar este sistema rápidamente. [EN] Most UCSM users would learn to use this system quickly. [positive] USAB8. [ES] El sistema resulta muy complicado de operar para el personal no técnico. [EN] The system is very complicated to operate for non-technical staff. [negative] USAB9. [ES] Me siento seguro y confiado al navegar y consultar información en el sistema. [EN] I feel confident and assured when navigating and querying information in the system. [positive] USAB10. [ES] Tuve que aprender demasiadas cosas nuevas antes de poder empezar a usar el sistema con fluidez. [EN] I had to learn too many new things before I could start using the system fluently. [negative]
Dimension 2: Normative Relevance and Compliance (NORM)—5 items (Likert 1–5)
NORM1. [ES] El sistema facilita la generación de información requerida por SUNEDU en el marco del licenciamiento institucional y las Condiciones Básicas de Calidad. [EN] The system facilitates the generation of information required by SUNEDU within the framework of institutional licensing and the Basic Quality Conditions. NORM2. [ES] El monitor permite identificar rápidamente a los investigadores calificados en el RENACYT del CONCYTEC y su nivel de producción. [EN] The monitor allows quick identification of researchers qualified in CONCYTEC’s RENACYT registry and their level of output. NORM3. [ES] La información provista por el sistema es suficiente para elaborar reportes de investigación exigidos por la Ley Universitaria N.° 30220. [EN] The information provided by the system is sufficient to produce research reports required by University Law No. 30220. NORM4. [ES] El sistema permite hacer seguimiento a los indicadores de producción científica requeridos para el proceso de acreditación institucional. [EN] The system enables tracking of scientific production indicators required for the institutional accreditation process. NORM5. [ES] Los datos consolidados en el monitor reducen el tiempo dedicado a la elaboración de informes normativos de investigación. [EN] The data consolidated in the monitor reduces the time devoted to preparing normative research reports.
Dimension 3: Visualization and Interface Quality (VISUAL)—5 items (Likert 1–5)
VISUAL1. [ES] Los gráficos y dashboards presentan la información de investigación de manera clara y comprensible. [EN] The charts and dashboards present research information in a clear and understandable way. VISUAL2. [ES] Los filtros disponibles, como año, tipo de publicación, unidad organizativa e investigador, son suficientes para mis necesidades de consulta. [EN] The available filters, such as year, publication type, organizational unit, and researcher, are sufficient for my query needs. VISUAL3. [ES] La organización de los módulos del sistema es lógica e intuitiva. [EN] The organization of the system’s modules is logical and intuitive. VISUAL4. [ES] Los indicadores clave, KPIs, mostrados en el resumen general son relevantes para la gestión de investigación de la UCSM. [EN] The key indicators (KPIs) shown in the general summary are relevant to UCSM’s research management. VISUAL5. [ES] La visualización de la alineación de publicaciones con los Objetivos de Desarrollo Sostenible, ODS, es útil para la toma de decisiones institucionales. [EN] The visualization of the alignment of publications with the Sustainable Development Goals (SDGs) is useful for institutional decision-making.
Dimension 4: Strategic Decision-Making Utility (DECISION)—5 items (Likert 1–5)
DECISION1. [ES] El sistema carga y responde a las consultas en un tiempo razonable. [EN] The system loads and responds to queries in a reasonable time. DECISION2. [ES] El sistema proporciona información útil para planificar estrategias de investigación a nivel institucional. [EN] The system provides useful information for planning research strategies at the institutional level. DECISION3. [ES] Los perfiles bibliométricos individuales por investigador son útiles para la asignación de roles y responsabilidades en proyectos. [EN] The individual bibliometric profiles by researcher are useful for assigning roles and responsibilities in projects. DECISION4. [ES] El análisis de producción científica por unidad organizativa permite identificar fortalezas y áreas de mejora en la investigación de la UCSM. [EN] The analysis of scientific output by organizational unit allows identification of strengths and areas for improvement in UCSM’s research. DECISION5. [ES] La información del sistema apoyaría la formulación de solicitudes de financiamiento ante organismos como CONCYTEC o fuentes internacionales. [EN] The system’s information would support the formulation of funding applications to bodies such as CONCYTEC or international sources.
Note: A global item (item 26) was included after the four dimensions as an overall recommendation indicator: [ES] Recomendaría el uso de este sistema a otros gestores o directivos de investigación de la institución. [EN] I would recommend the use of this system to other research managers or directors at the institution. This item was not included in the computation of any dimension score and served as a global satisfaction indicator. The instrument with six open-ended questions inviting qualitative feedback on system strengths, areas for improvement, and suggestions. These responses were not analyzed in the current study and are reserved for future qualitative research. The complete bilingual (Spanish/English) questionnaire is available from the corresponding author upon reasonable request.
References
- Almasi, S., Bahaadinbeigy, K., Ahmadi, H., Sohrabei, S., & Rabiei, R. (2023). Usability evaluation of dashboards: A systematic literature review of tools. BioMed Research International, 2023, 9990933. [Google Scholar] [CrossRef] [PubMed]
- Asserson, A., & Jeffery, K. (2010). CRIS and institutional repositories. Data Science Journal, 9, CRIS14–CRIS23. [Google Scholar] [CrossRef]
- Azeroual, O., Schöpfel, J., & Saake, G. (2019). Implementation and user acceptance of research information systems. Data Technologies and Applications, 54, 1–15. [Google Scholar] [CrossRef]
- Bangor, A., Kortum, P., & Miller, J. (2008). An empirical evaluation of the System Usability Scale. International Journal of Human–Computer Interaction, 24, 574–594. [Google Scholar] [CrossRef]
- Bangor, A., Kortum, P., & Miller, J. (2009). Determining what individual SUS scores mean: Adding an adjective rating scale. Journal of Usability Studies, 4, 114–123. [Google Scholar]
- Beck, K., Beedle, M., van Bennekum, A., Cockburn, A., Cunningham, W., Fowler, M., Grenning, J., Highsmith, J., Hunt, A., Jeffries, R., Kern, J., Marick, B., Martin, R. C., Mellor, S., Schwaber, K., Sutherland, J., & Thomas, D. (2001). Manifesto for agile software development. Available online: https://agilemanifesto.org (accessed on 27 May 2026).
- Braun, V., & Clarke, V. (2006). Using thematic analysis in psychology. Qualitative Research in Psychology, 3, 77–101. [Google Scholar] [CrossRef]
- Brooke, J. (1996). SUS: A ‘quick and dirty’ usability scale. In P. W. Jordan, B. Thomas, B. A. Weerdmeester, & I. L. McClelland (Eds.), Usability evaluation in industry (pp. 189–194). Taylor & Francis. [Google Scholar]
- Bryant, R., Clements, A., de Castro, P., Cantrell, J., Dortmund, A., Fransen, J., Gallagher, P., & Mennielli, M. (2018). Practices and patterns in research information management: Findings from a global survey. OCLC Research. [Google Scholar] [CrossRef]
- CONCYTEC. (2020). Reglamento de calificación, clasificación y registro de los investigadores del sistema nacional de ciencia, tecnología e innovación tecnológica—Reglamento RENACYT (Presidential Resolution No. 023-2020-CONCYTEC-P). Consejo Nacional de Ciencia, Tecnología e Innovación Tecnológica.
- Costas, R., Meijer, I., Zahedi, Z., & Wouters, P. (2013). The value of research data: Metrics for datasets from a cultural and technical point of view. Knowledge Exchange. Available online: https://hdl.handle.net/1887/23586 (accessed on 27 May 2026).
- Davis, F. D. (1989). Perceived usefulness, perceived ease of use, and user acceptance of information technology. MIS Quarterly, 13, 319–340. [Google Scholar] [CrossRef] [PubMed]
- DeLone, W. H., & McLean, E. R. (2003). The DeLone and McLean model of information systems success: A ten-year update. Journal of Management Information Systems, 19, 9–30. [Google Scholar] [CrossRef]
- Elsevier. (2026). Pure—research information management system. Available online: https://www.elsevier.com/products/pure (accessed on 27 May 2026).
- euroCRIS. (2026). What is euroCRIS? Available online: https://eurocris.org/what-eurocris (accessed on 27 May 2026).
- Ferraiolo, D. F., Sandhu, R., Gavrila, S., Kuhn, D. R., & Chandramouli, R. (2001). Proposed NIST standard for role-based access control. ACM Transactions on Information and System Security, 4, 224–274. [Google Scholar] [CrossRef]
- Fielding, R. T. (2000). Architectural styles and the design of network-based software architectures [Ph.D. thesis, University of California]. [Google Scholar]
- García, M., & Pirela, J. (2020). University management and research management: Conceptual approaches. Revista Venezolana de Gerencia, 25, 668–682. [Google Scholar] [CrossRef]
- Guillaumet, A., García, F., & Cuadrón, O. (2019). Analyzing a CRIS: From data to insight in university research. Procedia Computer Science, 146, 230–240. [Google Scholar] [CrossRef]
- Hernández-Sampieri, R., Fernández-Collado, C., & Baptista-Lucio, P. (2014). Metodología de la investigación (6th ed.). McGraw-Hill. [Google Scholar]
- Hicks, D., Wouters, P., Waltman, L., De Rijcke, S., & Rafols, I. (2015). Bibliometrics: The Leiden Manifesto for research metrics. Nature, 520, 429–431. [Google Scholar] [CrossRef] [PubMed]
- Jeffery, K., & Asserson, A. (2008). Institutional repositories and CRIS. New Review of Information Networking, 14, 71–83. [Google Scholar] [CrossRef]
- Jorg, B. (2010). CERIF: The common European research information format model. Data Science Journal, 9, CRIS24–CRIS31. [Google Scholar] [CrossRef]
- Legramante, D., Azevedo, A., & Azevedo, J. M. (2023). Integration of the technology acceptance model and the information systems success model in the analysis of Moodle’s satisfaction and continuity of use. International Journal of Information and Learning Technology, 40, 467–484. [Google Scholar] [CrossRef]
- Ley Universitaria. (2014, July 9). Ley N.° 30220 (university act). Diario oficial el peruano. Available online: https://www.gob.pe/institucion/minedu/normas-legales/118482-30220 (accessed on 27 May 2026).
- Newman, S. (2015). Building microservices: Designing fine-grained systems. O’Reilly Media. [Google Scholar]
- Nunnally, J. C. (1978). Psychometric theory (2nd ed.). McGraw-Hill. [Google Scholar]
- ORCID. (2026). Enabling value featuring pure. Available online: https://info.orcid.org/enabling-value-featuring-pure/ (accessed on 27 May 2026).
- Sauro, J., & Lewis, J. R. (2016). Quantifying the user experience: Practical statistics for user research (2nd ed.). Morgan Kaufmann. [Google Scholar]
- Sánchez Tarragó, N., de Medeiros Neves, M. F., & Alcain Partearroyo, M. D. (2021). Information systems in Latin American universities: Their impact on international rankings. Investigación Bibliotecológica, 35, 23–44. [Google Scholar]
- Stake, R. E. (1995). The art of case study research. Sage Publications. [Google Scholar]
- SUNEDU. (2015). Condiciones básicas de calidad para el procedimiento de licenciamiento de universidades [Basic quality conditions for the university licensing procedure]. Superintendencia Nacional de Educación Superior Universitaria.
- SUNEDU. (2020). Modelo de licenciamiento y su implementación en el sistema Universitario Peruano [Licensing model and its implementation in the Peruvian University system], 2nd ed.; Superintendencia Nacional de Educación Superior Universitaria.
- Venkatesh, V., Morris, M. G., Davis, G. B., & Davis, F. D. (2003). User acceptance of information technology: Toward a unified theory. MIS Quarterly, 27, 425–478. [Google Scholar] [CrossRef]
- Vlachogianni, P., & Tselios, N. (2022). Perceived usability evaluation of educational technology using the system usability scale (SUS): A systematic review. Journal of Research on Technology in Education, 54, 392–409. [Google Scholar] [CrossRef]
- Wilkinson, M. D., Dumontier, M., Aalbersberg, I. J., Appleton, G., Axton, M., Baak, A., Blomberg, N., Boiten, J., Santos, L. B. d. S., Bourne, P. E., Bouwman, J., Brookes, A. J., Clark, T., Crosas, M., Dillo, I., Dumon, O., Edmunds, S., Evelo, C. T., Finkers, R., … Mons, B. (2016). The FAIR Guiding Principles for scientific data management and stewardship. Scientific Data, 3, 160018. [Google Scholar] [CrossRef] [PubMed]
- Zhang, Y., & Kajikawa, Y. (2021). Editorial: Advanced analytics and decision making for research policy and strategic management. Frontiers in Research Metrics and Analytics, 6, 778622. [Google Scholar] [CrossRef] [PubMed]
| Disclaimer/Publisher’s Note: The statements, opinions and data contained in all publications are solely those of the individual author(s) and contributor(s) and not of MDPI and/or the editor(s). MDPI and/or the editor(s) disclaim responsibility for any injury to people or property resulting from any ideas, methods, instructions or products referred to in the content. |




 ,
,