Abstract
The volume of scientific publications has increased exponentially over the past decades across virtually all academic disciplines. In this landscape of information overload, objective criteria are needed to identify high-impact research. Citation counts have traditionally served as a primary indicator of scientific relevance; however, questions remain as to whether they truly reflect the intrinsic quality of a publication. This study investigates the relationship between citation frequency and a wide range of editorial, authorship, and contextual variables. A dataset of 339,609 articles indexed in Scopus was analyzed, retrieved using the search query TITLE-ABS-KEY (management) AND LIMIT-TO (subarea, “Busi”). The research employed a descriptive analysis followed by two predictive modeling approaches: a Random Forest algorithm to assess variable importance, and a binary logistic regression to estimate the probability of a paper being cited. Results indicate that factors such as journal quartile, country of affiliation, number of authors, open access availability, and keyword usage significantly influence citation outcomes. The Random Forest model explained 94.9% of the variance, while the logistic model achieved an AUC of 0.669, allowing the formulation of a predictive citation equation. Findings suggest that multiple determinants beyond content quality drive citation behavior, and that citation probability can be predicted with reasonable accuracy, though inherent model limitations must be acknowledged.
1. Introduction
The historical origins of scientific publishing can be traced back to the dawn of modern science in the 17th century, a period that marked a fundamental transformation in how knowledge was produced and disseminated before the emergence of scientific journals. Scholars and natural philosophers shared their discoveries through personal correspondence—a network known as the Republic of Letters. This informal intellectual community exchanged ideas, findings, and observations via handwritten letters. Prominent figures such as Galileo Galilei, Johannes Kepler, and Isaac Newton actively participated in this epistolary system (Grafton, 2009).
However, this mode of communication was limited in reach, slow in transmission, and lacked standardized mechanisms for verification. There was no formal peer review process, and knowledge circulated within closed intellectual circles. As a result, disputes over the priority of discoveries were common, and the dissemination of scientific advances was significantly constrained (Biagioli, 1993).
The need to establish more efficient means for sharing and documenting knowledge led to the emergence of the first scientific journals. In 1665, two foundational publications appeared almost simultaneously: Philosophical Transactions of the Royal Society of London, which aimed to publicly and chronologically record scientific discoveries—thereby reducing disputes over authorship and creating a collective memory of knowledge (Fyfe, 2015); and Journal des Sçavans in France, which included book reviews, scientific reports, and philosophical discussions. Although the latter had a broader scope than Philosophical Transactions, both journals marked the beginning of modern scientific communication (Kronick, 1976).
Throughout the 18th and 19th centuries, scientific journals proliferated in tandem with the expansion of specialized disciplines. Scientific academies and universities began sponsoring periodic publications that served not only to disseminate knowledge but also to evaluate it. The structure of scientific articles also evolved during this period, moving from narrative reports to more standardized formats. By the early 20th century, the IMRaD model (Introduction, Methods, Results, and Discussion) had become established, and it continues to dominate scientific writing, particularly in the experimental sciences (Day & Gastel, 2011).
Alongside this evolution, evaluation systems such as peer review began to emerge and gradually became institutionalized to ensure the quality and validity of published content. Although peer review was practiced informally as early as the 18th century, it became a central component of the editorial process only in the 20th century (Spier, 2002).
During the 20th century, scientific publishing became the cornerstone of a complex system linking academic production to institutional evaluation. This process transformed scientific articles into key indicators of educational and professional prestige. Moreover, the development of bibliographic databases, citation tracking systems, and bibliometric indicators—such as the impact factor—contributed to the institutionalization of scientific publishing as a metric of productivity, quality, and influence (Garfield, 1972, 1979; Donthu et al., 2020).
In the 21st century, the open access movement and the rise of digital platforms have introduced new challenges and opportunities in scholarly publishing. Traditional closed-access models have come under scrutiny, giving way to calls for a more transparent, collaborative, and accessible scientific enterprise (Suber, 2012). This evolutionary process has driven the exponential growth of scientific publications, leading to the emergence of bibliometrics as a distinct field of study (Ramos-Rodríguez & Ruíz-Navarro, 2004; Baas et al., 2020).
Mongeon and Paul-Hus (2016) reported that between 2005 and 2019, the number of documents indexed in Scopus grew at an average annual rate of 5%. Similarly, Larivière et al. (2015) analyzed data from the Web of Science and found an average growth rate of approximately 3–4% per year in indexed publications between 1980 and 2012. More recently, Martín-Martín et al. (2021a) confirmed this trend with comparable figures.
In this context of exponential growth—where thousands of new publications emerge each year across all scientific fields—researchers face increasing difficulty in identifying the most relevant and impactful studies. Citation-based indicators are commonly used as a proxy to assess a publication’s value, under the assumption that a higher citation count reflects higher quality. While this criterion appears intuitively valid, it raises a critical question: Is content quality the only factor that drives citations?
This study aims to explore the existence of an underlying model that captures the influence of additional variables on citation frequency, specifically within the field of business and management sciences. The analysis considers a range of potentially influential factors, including: the country of origin of the publication, the number of countries involved in each study, the volume of scientific output by country, the number of contributing authors, the academic productivity of those authors, the quartile ranking of the journal, the keywords used to describe the study, and the specific subarea of knowledge in which the research is situated.
2. Literature Review
Although bibliometrics has its roots in documentation and bibliographic studies of the 19th century, it was not until the 20th century that it consolidated as a scientific field. The term was first introduced by Otlet (1934). Still, its formal development is attributed to Pritchard (1969), who defined bibliometrics as the application of statistical and mathematical methods to analyze books, articles, and other forms of communication.
Initially, bibliometric research focused on the quantitative analysis of scientific publications to identify patterns of productivity and collaboration. With the rise of bibliographic databases such as the Science Citation Index (SCI), created by Eugene Garfield in 1964, the scope and depth of bibliometric studies expanded significantly. Bibliometrics evolved from a purely descriptive tool into a strategic resource for decision-making in science, technology, and academic policy.
The development of bibliometric studies has led to the widespread use of various indicators designed to evaluate key aspects of scientific output. These include measures of productivity (e.g., number of publications), visibility (e.g., citation count), and collaboration (e.g., number of co-authors or countries involved). The most prominent bibliometric indicators can be grouped into three main categories:
- Productivity Indicators
- Number of publications: This is the most basic and direct metric, used to quantify the scientific output of an author, institution, or country.
- Lotka’s (1926) Law: Proposed by Alfred J. Lotka, this law states that the number of authors publishing n papers is inversely proportional to n2, revealing an unequal distribution of productivity among researchers.
- 2.
- Dispersion and Concentration Indicators
- Bradford’s (1934) Law: Introduced by Samuel C. Bradford, it suggests that a small number of journals account for the majority of relevant articles on a given topic, allowing researchers to identify “core” sources of knowledge.
- Zipf’s (1949) Law: Although originally developed in the field of linguistics, Zipf’s Law has been adapted for bibliometric analysis to examine the frequency distribution of keywords and terms.
- 3.
- Impact Indicators (Citation-Based)
- Number of citations: This reflects how often a publication has been cited by others. While useful, this metric can be influenced by disciplinary norms, language, and other contextual factors.
- h-index: Proposed by Hirsch (2005), the h-index combines productivity and impact. A scholar has an h-index of n if they have published n papers, each of which has been cited at least n times. It is widely used in academic evaluations.
- g-index: Introduced by Egghe (2006), the g-index builds on the h-index by giving more weight to highly cited papers, thus providing a more comprehensive measure of influence.
Citation indices have gained considerable relevance as tools for assessing the quality of scientific output. Databases such as Web of Science, Scopus, and Google Scholar provide metrics that quantify the influence of journals, authors, and institutions. Among the most widely used citation-based indicators are:
- Impact Factor (IF): Developed by Eugene Garfield, the IF measures the average number of citations received by articles published in a journal over the previous two years. While extensively used in research evaluation, it has been criticized for its susceptibility to editorial manipulation and for not necessarily reflecting the quality of individual articles.
- SCImago Journal Rank (SJR): Based on Scopus data, SJR accounts for the quality of journals that cite a given publication, assigning greater weight to citations from more prestigious sources. This metric offers a refined view of journal influence beyond raw citation counts.
- Eigenfactor Score: Similarly to SJR, the Eigenfactor Score evaluates the influence of academic journals by considering both the origin and context of citations. It incorporates network-based algorithms to capture the broader impact of journals within the scientific community.
Despite their widespread use, citation indices have notable limitations. Citation practices vary significantly across disciplines—for instance, natural sciences typically exhibit higher citation rates than the humanities. Moreover, citations do not always indicate positive recognition; some works are cited in the context of critique, correction, or even refutation.
As of June 2025, Scopus reported a total of 33,280 publications related to bibliometric studies. Of these, more than 12,539 focused specifically on the analysis of citation behavior within Scopus-indexed content.
Citation analysis remains a fundamental tool for assessing the impact and visibility of scientific publications within the academic community. The number of times an article is cited can be influenced by a wide range of factors, including the year of publication, the prestige or ranking of the journal, the availability of open access, the institutional or geographic affiliation of the authors, and the thematic relevance of the keywords used to describe the study.
First, journal ranking plays a significant role in determining the visibility of published articles. Papers appearing in Scopus-indexed journals with a high impact factor or top-quartile rankings (Q1 or Q2) tend to have broader circulation, thereby increasing their likelihood of being cited (Bornmann & Daniel, 2008; Tahamtan & Bornmann, 2019). Complementarily, open-access publishing has been shown to enhance global accessibility to scientific content, particularly in regions with limited financial resources, thereby increasing the likelihood of citations (Piwowar et al., 2018).
Publication year is another critical temporal factor. Older articles have had more time to be discovered and cited. However, in rapidly evolving fields, recent publications can quickly gain visibility—primarily when they address emerging or highly relevant topics. It is not uncommon for newer articles to accumulate substantial citation counts within a short time.
The geographic origin of authors also affects the circulation and impact of knowledge. Studies have shown that articles originating from countries with greater investment in research and development tend to receive more attention (Moya-Anegón et al., 2004). Nonetheless, international collaboration can mitigate this geographic bias, as co-authorship across borders enhances the dissemination and visibility of scholarly work (Glänzel & Schubert, 2004).
The use of relevant and up-to-date keywords also plays a crucial role in citation frequency, as it enhances article discoverability through database search algorithms and thematic matching. Keywords act as semantic bridges between the content of an article and the information retrieval needs of other researchers.
Moreover, the type of document significantly influences citation patterns. Review articles, due to their integrative nature, are typically cited more frequently than empirical studies (Sedira et al., 2024).
The adoption of tools such as bibliometrix has revolutionized bibliometric research by enabling more comprehensive analyses and complex visualizations (Aria & Cuccurullo, 2017). Additionally, bibliometric methods have become firmly established in organizational research, reflecting the maturity of these techniques in mapping scientific networks and knowledge structures (Zupic & Čater, 2015).
Comparisons between databases such as Scopus and Web of Science have revealed significant differences in journal coverage, which in turn affect the visibility and citation metrics of articles depending on the database consulted (Mongeon & Paul-Hus, 2016). Systematic studies have also examined the evolution of scientific output over time, evaluating both the volume and impact of scholarly publications (Ellegaard & Wallin, 2015).
More recent research has compared the performance of Google Scholar against Scopus and Web of Science in terms of coverage and citation counts, concluding that results can vary substantially depending on the database used (Martín-Martín et al., 2018). At the same time, the rise of altmetrics as alternative indicators of impact have sparked debate regarding their correlation with traditional citation-based metrics (Costas et al., 2015).
3. Materials and Methods
The study began with a search in the Scopus database using the following query: TITLE-ABS-KEY (management) AND LIMIT-TO (subarea, “Busi”), which retrieved all articles related to the field of management, restricted to the subject area of business, administration, and accounting. This search yielded a total of 477,316 records. However, only 418,918 documents were accessible for download due to Scopus’s limit of 20,000 records per session for export. In earlier years, complete downloads were possible; however, starting in 2016, the number of articles per year exceeded the platform’s export limit (e.g., 20,214 in 2016), and this trend continued in subsequent years.
To remain within the export threshold, the dataset was filtered: for years exceeding the limit, only journal articles were retained, excluding other document types such as books, editorials, corrections, conference proceedings, and notes. From the exported records, an additional 79,309 documents were excluded due to missing data, duplication, or similarities with records already discarded in later years.
The final sample consisted of 199,235 documents, all of which contained complete data across the variables analyzed. This represents 47.55% of the total documents available under the search criteria as of 1 May 2025. Figure 1 illustrates the filtering and selection process.
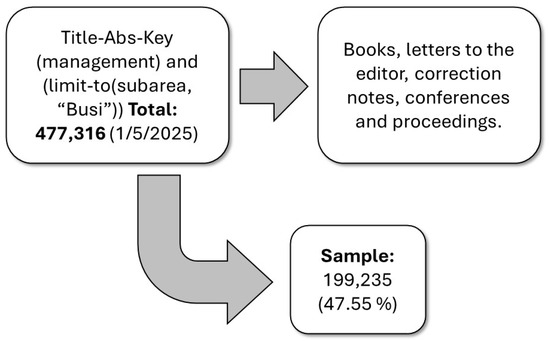
Figure 1.
Composition of the Sample.
Once the sample was defined, a descriptive analysis was conducted to examine the behavior of the main variables that characterized the dataset. These variables included:
- Publication age: Number of years since the article was published.
- Journals: The total number of journals in which the articles appeared was analyzed, along with each journal’s contribution to the dataset. Journals were categorized by quartile ranking (Q1–Q4), coded in the conventional order (Q1 = 1, Q2 = 2, Q3 = 3, Q4 = 4). A value of 5 was assigned to emerging journals that are indexed in Scopus but not yet classified into predefined quartiles. Additionally, journals were categorized based on their open-access status. In this study, the term “affiliation” refers exclusively to the institutions of the article authors, as reported in Scopus; the country of the publisher (e.g., Elsevier, Springer) was not considered.
- Authors: Author-related variables included the number of authors per publication, the number of articles published by each author, the number of authors per article, and the degree of co-authorship observed among contributors.
- Country or countries of origin: Countries associated with each article were identified based on metadata reported in Scopus.
- Keywords: Keywords were initially grouped by combining both author-provided terms and journal-assigned indexing terms, resulting in a total of 295,839 unique keywords. A one-step hierarchical classification method was applied to identify overarching themes, such as: the sector to which the research was applied; territorial scope (global, international, regional, national, or local); theoretical or empirical methods or techniques used; disciplinary or subdisciplinary domain within business and management sciences; and qualitative descriptors reflecting the nature of the study.Additional keyword-related variables were also recorded, including: the total number of keywords used, the number of keywords provided by the author, the number listed in the journal’s index, and the number of classification fields assigned to each set of keywords (i.e., territory, sector, method, quality, discipline, and subdiscipline).
- Citation count: The total number of citations received by each article.
Subsequently, a general characterization of the previously described categories was conducted to facilitate a predictive analysis of academic citation behavior using a machine learning approach—specifically, the Random Forest algorithm. Data processing was conducted in R (version 4.5.1) utilizing the following packages: readxl, dplyr, caret, ranger, openxlsx, and ggplot2. The original dataset was imported from an Excel (.xlsx) file and included all the declared variables.
A sample size control procedure was applied based on the total number of records available. Since the dataset exceeded 10,000 observations, a simple random sample of 10% (19,923 records) was selected to ensure efficient use of computational resources and avoid bottlenecks during model training. This decision preserved model robustness while maintaining reproducibility on mid-range computing systems.
Variable names were standardized to avoid syntactic conflicts. Text-based variables were converted into factors, and the dependent variable was defined as “Cited by”.
The Random Forest model was trained using 3-fold cross-validation (cv = 3) and a simplified hyperparameter grid to optimize the trade-off between accuracy and computational efficiency. For this purpose, the dataset was split into a training set (80%) and a test set (20%). All available predictor variables in the dataset were initially included during the model’s training phase. Subsequently, variable importance was assessed using the permutation importance method, and a refined version of the model was developed based on the 12 most influential variables.
Model performance was evaluated using the coefficient of determination (R2) and root mean square error (RMSE), along with graphical analysis of prediction errors (i.e., the differences between actual and predicted values).
In a second phase, for exploratory purposes and to generate an interpretable equation describing the relationships between variables, a binary logistic regression model was applied. In this model, the dependent variable was a dichotomized version of the Cited by column (0 = not cited, 1 = cited).
4. Results
The dataset under analysis comprised articles published in 6316 different journals. Of these, 60 journals had published more than 1000 articles each, accounting for a total of 104,472 records—over 30% of the entire sample. In contrast, 4077 journals contained fewer than 10 publications each. The distribution of journals by quartile was as follows: Q1 (2848 journals; 45.09%), Q2 (1113; 17.62%), Q3 (1506; 23.84%), and Q4 (849; 13.44%). Only 23% of the analyzed publications were published in an open-access format. The average publication age was 9.6 years.
Regarding the dependent variable—citation count—after excluding records with incomplete information, 87.3% of the publications had received at least one citation. The mean number of citations per article was 26, and the most cited publication reached a total of 11,296 citations.
Figure 2 illustrates the distribution of articles across journals. As shown, the vast majority of journals report a relatively low number of publications, while a few journals contribute a disproportionately high volume of publications. The journals with the highest number of articles in the dataset are Journal of Cleaner Production (9210 articles), International Journal of Production Research (3167 articles), International Journal of Production Economics (3141 articles), and Lecture Notes in Business Information Processing (3024 articles).
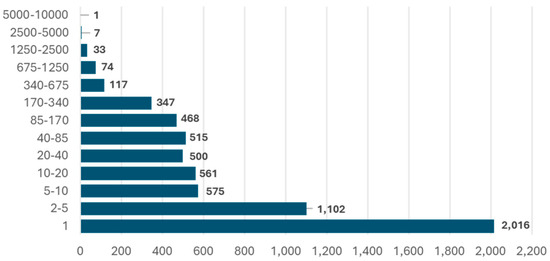
Figure 2.
Distribution of Articles by Journal.
The journals included in the dataset are affiliated with institutions from 120 countries. However, as shown in Figure 3, just nine countries account for approximately 72% of the total number of publications.
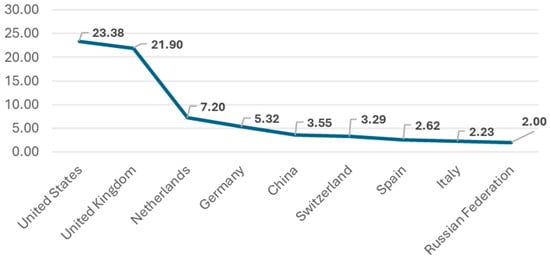
Figure 3.
Concentration of Journals by the Most Represented Countries.
A total of 432,592 authors were identified across the dataset, although they did not all appear with the same frequency. The number of authors per article varied considerably, with an average of 2.51 authors per article and a mode of 2. Figure 4 provides a general overview of the distribution of authorship per publication.
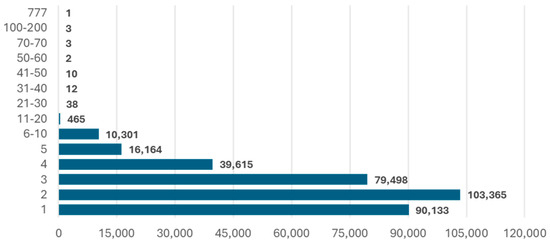
Figure 4.
Distribution of Authors per Publication.
Several articles stand out due to their exceptionally high number of authors: 738 (Fišar et al., 2024), 194 (Wang et al., 2024), 111 (Wojtczuk-Turek et al., 2024), 77 (Van der Aalst et al., 2012), 75 (Congio et al., 2021), and 73 (Dwivedi et al., 2023). These publications typically result from large-scale diagnostic studies replicated across multiple countries. After filtering and removing duplicate author entries, the total number of unique authors was reduced to 60,591. Figure 5 presents the distribution of author counts per article.
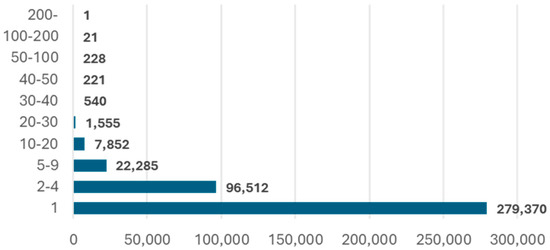
Figure 5.
Distribution of Author Counts per Article.
Of the total authors analyzed, 129,215 (30%) had contributed to at least two publications. Among them, 250 authors appeared in 50 or more articles. A co-authorship network was constructed to explore the degree of collaboration among these prolific contributors, revealing a high concentration of co-authorship connections, particularly among the most frequently publishing authors.
To improve visual clarity, the network was refined by selecting the top 30 authors with the highest number of co-authorship links. Within this group, a dense and fully connected collaboration structure was observed.
An analysis of the affiliations reported in the articles revealed that the majority of publications were associated with a single country, although they often involved multiple institutions within that country. Figure 6 shows the distribution of the number of countries participating in each publication. Only four articles involved contributions from more than 30 countries—these were the same articles characterized by an exceptionally high number of authors.
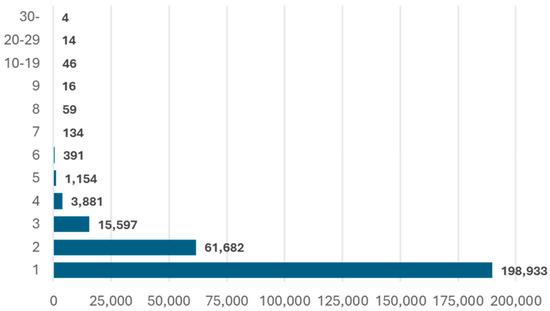
Figure 6.
Number of Countries per Article.
On the other hand, Figure 7 shows that the majority of countries contributed research articles. In total, participation was identified from 170 out of the 195 countries currently recognized worldwide.
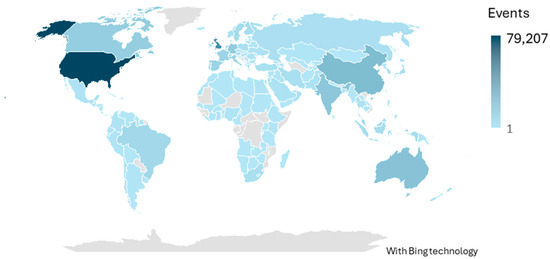
Figure 7.
Number of Articles by Country.
Although most countries contributed research articles, a closer look reveals that just 19 countries account for 73.33% of all publications (see Figure 8), confirming the applicability of the Pareto principle in this context.
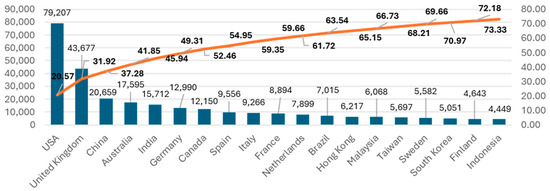
Figure 8.
Countries Concentrating the Largest Share of Publications.
Additionally, a high degree of international collaboration was observed across countries. Out of the total sample, only six countries showed no co-authorship with other nations: Micronesia, the British Virgin Islands, Lesotho, Vanuatu, the Faroe Islands, and Solomon Islands. In contrast, 35 countries engaged in co-publication with 100 or more other nations, highlighting the presence of a dense network of international co-authorship within the dataset.
An analysis of keyword composition revealed that, on average, authors assigned five keywords to their articles, while journals indexed an average of four keywords per publication. The dataset included articles referencing 31 different socio-productive sectors, with communications being the most represented, followed by tourism, education, and healthcare (see Figure 9a–d). In terms of geographic scope, country-level analyses were the most common, followed by global and regional studies. Additionally, some publications focused on specific geographic features such as land areas, rivers, seas, oceans, or islands.
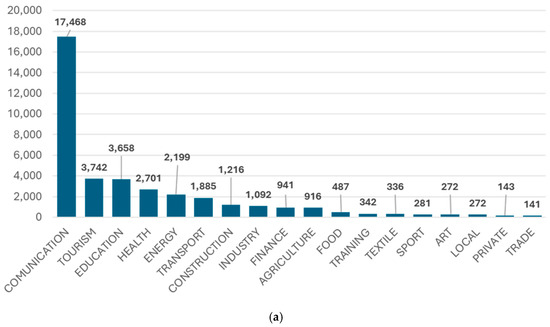
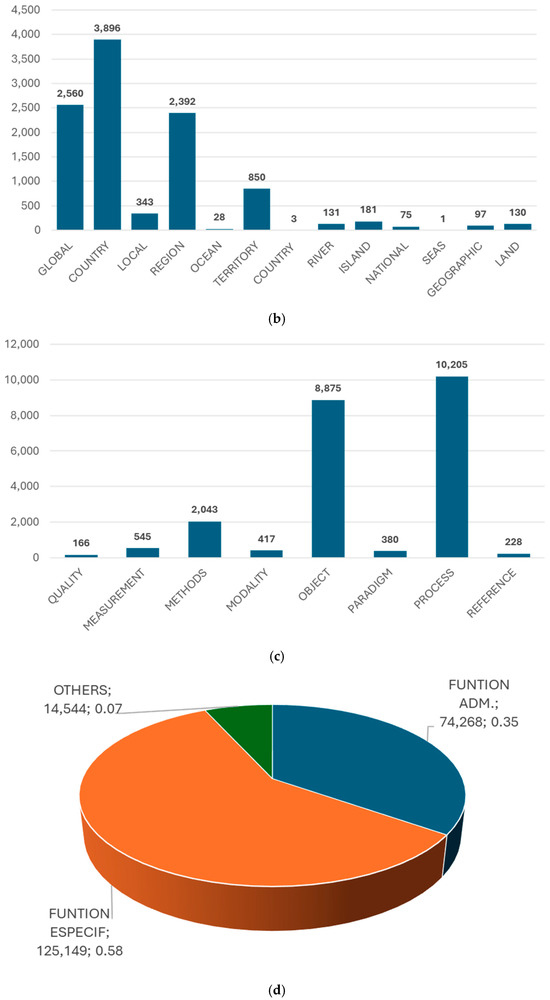
Figure 9.
(a) Distribution of Articles by Socio-Productive Sector. (b) Geographic Scope of Research (Country, Regional, Global). (c) Classification of Research Methods and Paradigms. (d) Disciplinary Focus of Studies in Business and Management.
Regarding research methods, two levels of classification were applied. On one level, keywords were used to describe study quality, measurement approaches, research paradigms (quantitative, qualitative, or mixed), and research modalities (field-based, developmental, or experimental). The most frequently occurring keywords in this category typically describe the type of data analysis performed.
On the disciplinary level, three broad types of studies were identified: those addressing core management functions (planning, organizing, leadership, and control); those specifying business areas under investigation (e.g., production, marketing, innovation); and those focused on specific organizational contexts such as SMEs, projects, entrepreneurship, or public administration.
Of the total articles analyzed, 174,783 (87.3%) had received at least one citation. The most highly cited article accumulated 11,296 citations. Among the cited articles, the average number of citations was 38, with a standard deviation of 114 and a coefficient of variation of 3, which is considered very high.
Among the cited articles, the average number of citations was 38, with a standard deviation of 114 and a coefficient of variation of 3, indicating a very high level of dispersion.
Figure 10 presents a general overview of citation distribution by range, considering only articles that received at least one citation.
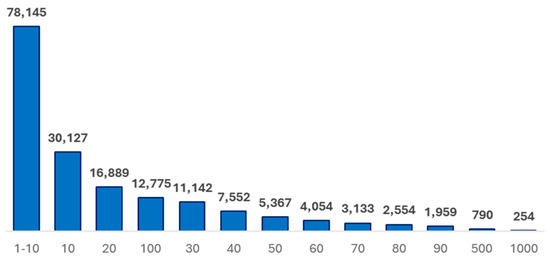
Figure 10.
Citation Distribution by Range.
Following the general characterization of the dataset, the analysis proceeded to explore potential hidden relationships among the defined variables and their influence on citation counts.
The Random Forest regression model explained a substantial proportion of the variance in citation counts (R2 = 0.9499) and achieved a reasonable root mean square error (RMSE = 20.5202), indicating acceptable accuracy in predicting actual citation values.
Of the 15 independent variables initially included in the analysis, the model identified the top 12 as having notable predictive importance (see Table 1). The most influential variable was the country referenced in the study, followed by the number of declared keywords and the presence of specific qualitative descriptors characterizing the research object (e.g., systemic, strategic, holistic, proactive). Other relatively significant predictors included the age of the article, the presence of keywords indexed by the journal, the inclusion of administrative subdisciplines and research methods in the keywords, author-declared keywords, whether the journal was open access, the sector of application, the number of classification fields within the keywords, and the journal quartile ranking.

Table 1.
Significance of the variables.
Three variables were entirely excluded from the final model due to their low importance: the number of authors per article, the primary administrative discipline declared, and the study’s territorial scope.
Figure 11 shows the error frequency distribution. As illustrated, the histogram represents the differences between the actual and predicted values produced by the regression model. The clustering of errors around zero suggests that most predictions were close to the exact values, which is a positive indicator of model accuracy. However, the dispersion at the extreme points to the presence of outliers or high-variability cases that may require further model refinement.
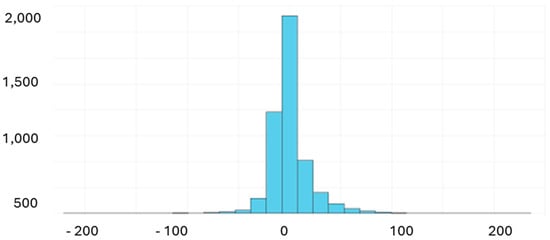
Figure 11.
Error Frequency Distribution.
Finally, the binary logistic regression model produced the quality metrics summarized in Table 2. According to these results, the model demonstrates a moderate ability to predict whether an article will be cited. The AUC value provides an overall measure of the model’s discriminative power, indicating weak but better-than-random predictive performance.

Table 2.
Metrics of the Logistic Regression Model.
Likewise, the model’s predictive ability is illustrated in the receiver operating characteristic (ROC) curve shown in Figure 12. As observed, the blue curve representing model performance lies above the diagonal line, indicating that the model possesses some degree of discriminative capacity, albeit relatively modest.
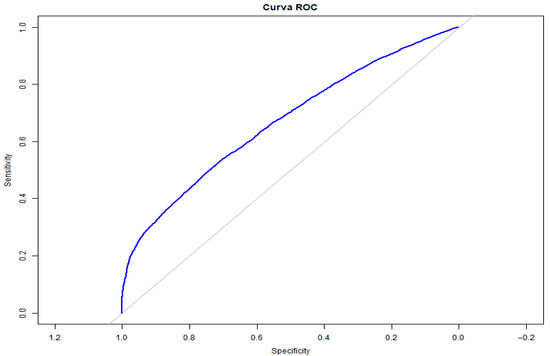
Figure 12.
Model Operating Curve (ROC Curve).
Based on this model, the following predictive equation can be proposed:
Cite by = 3.9072 + (0.8945 × PAIS) + (1.0412 × KW.CANTIDAD) + (−0.6827 × KWCUALIDAD) +(0.626 × EDAD) + (0.3384 × KW.INDEX) + (0.4243 × KWD2) + (0.2601 × KWMETODO) + (0.0322 × KW.AUTOR) + (0.2483 × OA) + (0.5781 × KWSECTOR) + (0.2628 × KWT) + (−5.4752 × CUARTIL)
5. Discussion
The findings of this study are consistent with prior research indicating that the number of citations an article receives is not solely determined by its intrinsic quality, but is also influenced by a variety of contextual and editorial factors. The significance of variables such as the country of focus, the number and type of keywords, journal quartile, and open access status aligns with previous studies (Bornmann & Daniel, 2008; Piwowar et al., 2018), which have demonstrated how these elements affect the visibility—and thus the citation frequency—of scientific publications.
The Random Forest model proved to be highly effective in identifying the most influential predictive variables, yielding a coefficient of determination (R2) of 0.9499. This suggests that the selected combination of factors can explain a substantial portion of citation variability. These results support the value of machine learning approaches in bibliometric analysis (Zupic & Čater, 2015; Aria & Cuccurullo, 2017), especially when working with large and heterogeneous datasets.
However, the logistic regression model exhibited a more modest performance (AUC = 0.669), reflecting the inherent difficulty of predicting citation outcomes as a binary variable. Nonetheless, its implementation allowed for the construction of an interpretable equation that highlights the direction and relative weight of influence for key variables.
The analysis also revealed significant disparities in the distribution of scientific output, supporting the Pareto principle, which states that a small number of countries and journals concentrate the majority of publications. This finding is consistent with the results of Larivière et al. (2015) and Martín-Martín et al. (2021b), who have noted the existence of an editorial oligopoly and geographic concentration in the production of scientific knowledge.
Regarding keywords, their role as a strategic element in article visibility is indisputable. As emphasized by Costas et al. (2015), the appropriate selection of keywords enhances the discoverability of publications in digital environments—a point confirmed in the present study through their high predictive importance.
The results of this study identify associations between certain editorial variables (such as open access) and citation counts, but these do not necessarily imply causality. For instance, studies employing more rigorous designs with instrumental variables find no evidence of a direct causal effect of open access on citations (Gaulé, 2011). Conversely, large-scale analyses report an average citation advantage of approximately 18% for open-access articles. However, they caution that this association may be influenced by selection biases or the underlying quality of the papers (Piwowar et al., 2018). Consequently, our observations should be interpreted as indicative correlations; establishing causal relationships would require future studies with more robust methodologies, such as instrumental variables, natural experiments, or longitudinal designs.
5.1. Study Limitations
The main limitations of this research are related, first, to the volume of data that had to be excluded due to incomplete information. However, the final dataset is considered sufficiently large and representative. Another limitation is that the analysis is restricted exclusively to the field of administrative sciences, which prevents us from ensuring that the results are generalizable to other domains. Likewise, although it was not the object of analysis, some publications included in the dataset may not strictly belong to administrative sciences but were nevertheless captured by the Scopus search criteria applied in the sample selection.
Although the Random Forest model showed a high in-sample fit (R2 ≈ 0.95), the temporal validation carried out with pre-2015 and post-2015 cohorts revealed a strong dependence on temporal variables such as article age and publication year. In the absence of these predictors, the out-of-sample R2 decreased significantly, even reaching negative values in cross-cohort tests. This suggests that the model’s predictive capacity is limited under strict temporal scenarios, and the results should therefore be interpreted as an explanatory fit within the sample rather than as a robust tool for prospective prediction.
The results observed should be understood within the field of administrative sciences and should not be generalized to other disciplines without first evaluating their applicability in different contexts.
5.2. Practical and Policy Implications
Beyond the statistical findings, this study provides insights that can guide editorial practice and research strategy:
- Authors: The evidence suggests that the careful selection of keywords influences visibility and citation potential. We recommend using standardized and specific terms aligned with disciplinary thesauri (e.g., Scopus Thesaurus) to maximize retrieval in databases. Likewise, international and multidisciplinary collaboration was positively associated with citation impact, suggesting the importance of fostering diverse research teams.
- Journals: The results support the importance of open access policies as a mechanism to increase visibility, although without assuming direct causality. Nevertheless, journals can promote transparency and accessibility of content, which broadens their circulation.
- Institutions and funders: Funding for open access publications, as well as incentives for collaborative and international projects, appear as strategies associated with higher citation impact. Investments in databases, institutional repositories, and training for metadata management can further enhance the visibility of scientific output.
Taken together, these recommendations enable the findings of this study to be translated into practical actions that support the dissemination and impact of academic knowledge.
6. Conclusions
This study demonstrates that scientific production in business and management is highly concentrated in a limited number of countries and journals, raising concerns about equity in the dissemination of knowledge. The number of citations received by an article is shaped not only by its intrinsic quality but also by contextual factors such as the country of focus, journal quartile, open-access availability, and the selection of keywords.
The Random Forest model effectively identified the most influential predictors of citation impact, achieving a high explanatory fit (R2 ≈ 0.95) and illustrating the potential of machine learning for large-scale bibliometric analysis. In contrast, the logistic regression model yielded more modest predictive power (AUC = 0.669) but offered interpretive value by indicating the direction and relative influence of key variables.
Beyond methodological contributions, the findings highlight the strategic role of keywords in driving article visibility and impact. Their careful and standardized selection should be a priority for authors. Likewise, open access and international collaboration appear associated with higher citation probability, which has implications for editorial policies and institutional funding strategies.
Future research should extend this approach to other scientific domains to assess whether the observed dynamics are consistent across disciplines or exhibit domain-specific variations. Comparative studies across contexts and the incorporation of causal or longitudinal designs would provide further insights into the complex mechanisms driving academic visibility and citation behavior.
Author Contributions
Conceptualization, R.P.-C.; software, G.G.-V., R.M.-V.; methodology, G.G.-V., M.D.M.-G., and R.P.-C.; validation, G.G.-V., R.P.-C., and M.D.M.-G.; formal analysis, A.S.-R. and R.P.-C.; investigation, G.G.-V., A.S.-R., R.P.-C., M.D.M.-G., and R.M.-V.; data curation, R.P.-C., A.S.-R.; writing—original draft preparation, R.P.-C.; writing—review and editing, R.P.-C. and A.S.-R.; visualization, M.D.M.-G., A.S.-R., and R.P.-C.; supervision, R.M.-V.; project administration, G.G.-V. All authors have read and agreed to the published version of the manuscript.
Funding
This research received no external funding.
Institutional Review Board Statement
Not applicable.
Informed Consent Statement
Not applicable.
Data Availability Statement
The original contributions presented in this study are included in the article. Further inquiries can be directed to the corresponding author.
Acknowledgments
The authors thank the anonymous reviewers of the journal for their constructive suggestions, which significantly improved the quality of the article. The usual disclaimers apply.
Conflicts of Interest
The authors declare that they have no conflicts of interest.
References
- Aria, M., & Cuccurullo, C. (2017). bibliometrix: An R-tool for comprehensive science mapping analysis. Journal of Informetrics, 11(4), 959–975. [Google Scholar] [CrossRef]
- Baas, J., Schotten, M., Plume, A., Côté, G., & Karimi, R. (2020). Scopus as a curated, high-quality bibliometric data source for academic research in quantitative science studies. Quantitative Science Studies, 1(1), 377–386. [Google Scholar] [CrossRef]
- Biagioli, M. (1993). Galileo, courtier: The practice of science in the culture of absolutism. University of Chicago Press. [Google Scholar]
- Bornmann, L., & Daniel, H.-D. (2008). What do citation counts measure? A review of studies on citing behavior. Journal of Documentation, 64(1), 45–80. [Google Scholar] [CrossRef]
- Bradford, S. C. (1934). Sources of information on specific subjects. Engineering: An Illustrated Weekly Journal, 137, 85–86. [Google Scholar]
- Congio, G. F. S., Bannink, A., Mayorga Mogollón, O. L., & Latin America Methane Project Collaborators. (2021). Enteric methane mitigation strategies for ruminant livestock systems in the Latin America and Caribbean region: A meta-analysis. Journal of Cleaner Production, 312, 127495. [Google Scholar] [CrossRef]
- Costas, R., Zahedi, Z., & Wouters, P. (2015). Do “altmetrics” correlate with citations? Extensive comparison of altmetric indicators with citations from a multidisciplinary perspective. Journal of the Association for Information Science and Technology, 66(10), 2003–2019. [Google Scholar] [CrossRef]
- Day, R. A., & Gastel, B. (2011). How to write and publish a scientific paper (7th ed.). Cambridge University Press. [Google Scholar]
- Donthu, N., Kumar, S., & Pattnaik, D. (2020). Forty-five years of Journal of Business Research: A bibliometric analysis. Journal of Business Research, 109, 1–14. [Google Scholar] [CrossRef]
- Dwivedi, Y. K., Kshetri, N., Hughes, L., Slade, E. L., Jeyaraj, A., Kar, A. K., Baabdullah, A. M., Koohang, A., Raghavan, V., Ahuja, M., Albanna, H., Albashrawi, M. A., Al-Busaidi, A. S., Balakrishnan, J., Barlette, Y., Basu, S., Bose, I., Brooks, L., Buhalis, D., … Wright, R. (2023). “So what if ChatGPT wrote it?” Multidisciplinary perspectives on opportunities, challenges and implications of generative conversational AI for research, practice and policy. International Journal of Information Management, 71, 102642. [Google Scholar] [CrossRef]
- Egghe, L. (2006). Theory and practise of the g-index. Scientometrics, 69(1), 131–152. [Google Scholar] [CrossRef]
- Ellegaard, O., & Wallin, J. A. (2015). The bibliometric analysis of scholarly production: How great is the impact? Scientometrics, 105(3), 1809–1831. [Google Scholar] [CrossRef]
- Fišar, M., Greiner, B., Huber, C., Katok, E., & Ozkes, A. I. (2024). & Management Science Reproducibility Collaboration. Reproducibility in management science. Management Science, 70(3), 1343–1356. [Google Scholar] [CrossRef]
- Fyfe, A. (2015). Journals, learned societies and money: Philosophical Transactions ca. 1750–1900. Notes and Records: The Royal Society Journal of the History of Science, 69(3), 277–299. [Google Scholar] [CrossRef][Green Version]
- Garfield, E. (1972). Citation analysis as a tool in journal evaluation. Science, 178(4060), 471–479. [Google Scholar] [CrossRef] [PubMed]
- Garfield, E. (1979). Citation indexing: Its theory and application in science, technology, and humanities. Wiley. [Google Scholar]
- Gaulé, P. (2011). Getting cited: Does open access help? Research Policy, 40(10), 1331–1345. [Google Scholar] [CrossRef]
- Glänzel, W., & Schubert, A. (2004). Analyzing scientific networks through co-authorship. In Handbook of quantitative science and technology research (pp. 257–276). Springer. [Google Scholar] [CrossRef]
- Grafton, A. (2009). Worlds made by words: Scholarship and community in the modern west. Harvard University Press. [Google Scholar]
- Hirsch, J. E. (2005). An index to quantify an individual’s scientific research output. Proceedings of the National Academy of Sciences, 102(46), 16569–16572. [Google Scholar] [CrossRef] [PubMed]
- Kronick, D. A. (1976). A history of scientific and technical periodicals: The origins and development of the scientific and technical press (pp. 1665–1790). Scarecrow Press. [Google Scholar]
- Larivière, V., Haustein, S., & Mongeon, P. (2015). The oligopoly of academic publishers in the digital era. PLoS ONE, 10(6), e0127502. [Google Scholar] [CrossRef] [PubMed]
- Lotka, A. J. (1926). The frequency distribution of scientific productivity. Journal of the Washington Academy of Sciences, 16(12), 317–323. [Google Scholar]
- Martín-Martín, A., Orduna-Malea, E., Thelwall, M., & Delgado López-Cózar, E. (2018). Google Scholar, Web of Science, and Scopus: A systematic comparison of citations in 252 subject categories. Journal of Informetrics, 12(4), 1160–1177. [Google Scholar] [CrossRef]
- Martín-Martín, A., Thelwall, M., Orduna-Malea, E., & Delgado López-Cózar, E. (2021a). Google Scholar, Microsoft Academic, Scopus, Dimensions, Web of Science, and OpenCitations’ COCI: A comparative analysis of coverage and citation counts. Scientometrics, 126(1), 871–906. [Google Scholar] [CrossRef]
- Martín-Martín, A., Thelwall, M., Orduna-Malea, E., & Delgado López-Cózar, E. (2021b). Google Scholar, Microsoft Academic, Scopus, Dimensions, Web of Science, and OpenCitations’ COCI: A multidisciplinary comparison of coverage. Journal of Informetrics, 15(1), 101130. [Google Scholar] [CrossRef]
- Mongeon, P., & Paul-Hus, A. (2016). The journal coverage of Web of Science and Scopus: A comparative analysis. Scientometrics, 106(1), 213–228. [Google Scholar] [CrossRef]
- Moya-Anegón, F., Vargas-Quesada, B., Herrero-Solana, V., Chinchilla-Rodríguez, Z., Corera-Álvarez, E., & Muñoz-Fernández, F. J. (2004). A new technique for building maps of large scientific domains based on the cocitation of classes and categories. Scientometrics, 61(1), 231–246. [Google Scholar] [CrossRef]
- Otlet, P. (1934). Traité de documentation: Le livre sur le livre. Editiones Mundaneum. [Google Scholar]
- Piwowar, H., Priem, J., Larivière, V., Alperin, J. P., Matthias, L., Norlander, B., Farley, A., West, J., & Haustein, S. (2018). The state of OA: A large-scale analysis of the prevalence and impact of Open Access articles. PeerJ, 6, e4375. [Google Scholar] [CrossRef]
- Pritchard, A. (1969). Statistical bibliography or bibliometrics? Journal of Documentation, 25(4), 348–349. [Google Scholar]
- Ramos-Rodríguez, A.-R., & Ruíz-Navarro, J. (2004). Changes in the intellectual structure of strategic management research: A bibliometric study of the Strategic Management Journal, 1980–2000. Strategic Management Journal, 25(10), 981–1004. [Google Scholar] [CrossRef]
- Sedira, N., Pinto, J., Bentes, I., & Pereira, S. (2024). Bibliometric analysis of global research trends on biomimetics, biomimicry, bionics, and bio-inspired concepts in civil engineering using the Scopus database. Bioinspiration & biomimetics, 19(4), 041001. [Google Scholar] [CrossRef]
- Spier, R. (2002). The history of the peer-review process. Trends in Biotechnology, 20(8), 357–358. [Google Scholar] [CrossRef]
- Suber, P. (2012). Open access. MIT Press. [Google Scholar]
- Tahamtan, I., & Bornmann, L. (2019). What do citation counts measure? An updated review of studies on citations in scientific documents published between 2006 and 2018. Scientometrics, 121(3), 1635–1684. [Google Scholar] [CrossRef]
- Van der Aalst, W. M. P., & Dustdar, S. (2012). Process mining put into context. IEEE Internet Computing, 16(1), 82–86. [Google Scholar] [CrossRef]
- Wang, J., Frietsch, R., Neuhäusler, P., & Hooi, R. (2024). International collaboration leading to high citations: Global impact or home country effect? Journal of Informetrics, 18(4), 101565. [Google Scholar] [CrossRef]
- Wojtczuk-Turek, A., Turek, D., Edgar, F., Klein, H. J., Bosak, J., Okay-Somerville, B., Fu, N., Raeder, S., Jurek, P., Lupina-Wegener, A., Dvorakova, Z., Gutiérrez-Crocco, F., Kekkonen, A., Leiva, P. I., Mynaříková, L., Sánchez-Apellániz, M., Shafique, I., Al-Romeedy, B. S., Wee, S., … Karamustafa-Köse, G. (2024). Sustainable human resource management and job satisfaction—Unlocking the power of organizational identification: A cross-cultural perspective from 54 countries. Corporate Social Responsibility and Environmental Management, 31(5), 4910–4932. [Google Scholar] [CrossRef]
- Zipf, G. K. (1949). Human behavior and the principle of least effort: An introduction to human ecology. Addison-Wesley Press. [Google Scholar]
- Zupic, I., & Čater, T. (2015). Bibliometric methods in management and organization. Organizational Research Methods, 18(3), 429–472. [Google Scholar] [CrossRef]
Disclaimer/Publisher’s Note: The statements, opinions and data contained in all publications are solely those of the individual author(s) and contributor(s) and not of MDPI and/or the editor(s). MDPI and/or the editor(s) disclaim responsibility for any injury to people or property resulting from any ideas, methods, instructions or products referred to in the content. |
© 2025 by the authors. Licensee MDPI, Basel, Switzerland. This article is an open access article distributed under the terms and conditions of the Creative Commons Attribution (CC BY) license (https://creativecommons.org/licenses/by/4.0/).