1. Introduction
The continuous development of dental ceramics and ceramic-based restorative materials has changed the design, fabrication, and clinical selection of fixed prosthetic restorations. Among these materials, yttria-stabilized zirconia has become widely used because of its favorable mechanical properties, chemical stability, digital processability, and broad clinical applicability [
1,
2]. The transition from conventionally veneered restorations toward monolithic and digitally manufactured systems has reduced some veneer-related complications, while increasing the need to understand how material architecture, processing route, surface chemistry, and interfacial behavior influence restorative performance [
1,
2,
3].
Monolithic zirconia restorations are clinically attractive because they eliminate the veneer–core interface, a structurally sensitive region in layered ceramic systems [
1,
2]. However, zirconia surface behavior remains influenced by chemical composition, yttria stabilization, phase stability, aging, surface treatment, and interaction with luting or veneering materials [
4,
5,
6,
7]. Surface conditioning and etching strategies may modify zirconia topography and bonding potential [
4,
5,
8], while aging-related changes and yttrium-related stabilization mechanisms may affect long-term surface stability [
6,
7]. Therefore, zirconia requires not only morphological assessment, but also elemental and surface chemical characterization [
6,
7,
8].
Despite the increased use of monolithic zirconia, bilayered zirconia-based restorations remain clinically relevant when improved esthetics are required [
1,
2,
9,
10,
11,
12,
13]. In these systems, feldspathic veneering ceramic is applied over a zirconia core, creating a ceramic–ceramic interface whose integrity is essential for restoration performance [
10,
11,
12,
13]. This interface is influenced by surface treatment, veneering technique, liner application, ceramic composition, firing protocol, and interfacial microstructure. Because limited chemical interaction, mechanical adaptation, and residual stress distribution may contribute to chipping or delamination, detailed microstructural and microchemical assessment remains important [
13,
14,
15].
Cobalt–chromium metal–ceramic restorations also remain clinically relevant because of their mechanical reliability, cost-effectiveness, and established use in fixed prosthodontics [
16,
17]. In contrast to ceramic–ceramic systems, the metal–ceramic interface is influenced by alloy composition, surface preparation, oxidation behavior, fabrication technique, and oxide-associated interfacial regions involved in ceramic bonding [
18,
19,
20,
21]. Modern manufacturing techniques, including selective laser melting, as well as thermal cycling and surface treatments, may further affect the microstructure, surface roughness, chemical composition, ceramic bond strength, and interfacial stability of Co-Cr frameworks [
20,
21,
22,
23,
24].
Although Monolithic ZrO
2, Feldspar/ZrO
2, and Feldspar/Co-Cr systems are all clinically relevant, they are governed by different stabilization and bonding mechanisms. Monolithic zirconia relies mainly on intrinsic ceramic compactness, phase stability, and Zr–O–Y surface chemistry [
1,
4,
6,
7,
8]; Feldspar/ZrO
2 systems depend on ceramic–ceramic adaptation and zirconia–ceramic interfacial integrity [
13,
14,
15]; and Feldspar/Co-Cr systems involve a ceramic–metal interface influenced by alloy composition, manufacturing route, surface preparation, and oxide-associated chemical contributions [
19,
20,
21]. However, direct comparative evaluations integrating scanning electron microscopy, energy-dispersive X-ray spectroscopy, and X-ray photoelectron spectroscopy across these three restorative architectures remain limited.
Therefore, this study aimed to comparatively evaluate the surface morphology, elemental composition, surface chemical signatures, and interfacial transition behavior of Monolithic ZrO2, Feldspar/ZrO2, and Feldspar/Co-Cr restorative systems. The specific scientific advance of the present study is the direct comparison, under standardized experimental conditions, of architecture-dependent interfacial transition behavior across these restorative systems. In particular, the layered systems were evaluated for differences in the spatial extent and elemental overlap of the veneer–substrate transition zones using cross-sectional SEM and spatially resolved EDS line-scan/mapping analysis, while XPS provided complementary surface chemical information. This integrated approach was intended to determine whether ceramic–ceramic and ceramic–metal restorative architectures exhibit measurably distinct interfacial microchemical organization beyond their expected constituent elemental profiles. The null hypothesis was that no significant differences would be observed among the three systems in terms of morphology, elemental distribution, surface chemical signatures, or interfacial transition characteristics.
2. Materials and Methods
2.1. Study Design, Materials, and Experimental Groups
This in vitro study was designed as a comparative microstructural and microchemical investigation of three clinically relevant dental restorative systems, focusing on the relationship between restorative system configuration, surface chemistry, and interfacial behavior. A total of 30 independently fabricated specimens were allocated to three experimental groups according to material configuration, with 10 specimens per group (n = 10/group). The sample size of 10 independent specimens per group was selected to provide specimen-level replication appropriate for the exploratory comparative SEM–EDS–XPS design. No formal prospective power calculation was performed before specimen fabrication. A sensitivity analysis based on n = 10 specimens per group, α = 0.05, and 80% statistical power indicated that the study was primarily capable of detecting large between-group effects, corresponding approximately to Cohen’s d = 1.32 for two-group comparisons and Cohen’s f = 0.60 for three-group comparisons. Accordingly, the study was not designed to reliably detect small or moderate between-group effects.
Group 1, Monolithic ZrO2, consisted of yttria-stabilized tetragonal zirconia polycrystal specimens fabricated from IPS e.max ZirCAD blocks (Ivoclar Vivadent, Schaan, Liechtenstein).
Group 2, Feldspar/ZrO2, consisted of zirconia cores fabricated from the same Y-TZP material and veneered with fluorapatite feldspathic ceramic (IPS e.max Ceram, Ivoclar Vivadent, Schaan, Liechtenstein).
Group 3, Feldspar/Co-Cr, consisted of cobalt–chromium alloy frameworks (Colado CC, Ivoclar Vivadent, Schaan, Liechtenstein) veneered with leucite-containing feldspathic ceramic (IPS InLine, Ivoclar Vivadent, Schaan, Liechtenstein). These groups represented three clinically relevant restorative system configurations used in fixed prosthodontics: monolithic ceramic, ceramic–ceramic layered, and metal–ceramic layered systems.
The experimental groups were designed to represent clinically relevant restorative system configurations rather than to isolate restorative architecture as an independent variable. Accordingly, differences among groups inherently included variations in substrate composition, veneering ceramic, and fabrication workflow. The term “restorative architecture” is therefore used in this study to describe the overall material–structural configuration of each system, rather than a single experimentally isolated factor.
All specimens were fabricated under standardized laboratory conditions as plate-shaped samples with comparable external dimensions. Monolithic ZrO2 specimens had a target final thickness of 1.0–1.5 mm. In the Feldspar/ZrO2 group, the zirconia core was fabricated with a nominal thickness of approximately 0.5 mm, while the fluorapatite feldspathic veneering ceramic was applied to a thickness of approximately 0.7–1.0 mm, resulting in a final specimen thickness of approximately 1.2–1.5 mm. In the Feldspar/Co-Cr group, the Co-Cr framework had a nominal thickness of approximately 0.4–0.5 mm, and the leucite-containing feldspathic veneering ceramic was applied to a thickness of approximately 0.7–1.0 mm, resulting in a final specimen thickness of approximately 1.1–1.5 mm. The individual layer dimensions were maintained consistently within each experimental group to obtain comparable cross-sectional architecture and to minimize geometry-related variability in the subsequent interfacial analyses. Only specimens with intact morphology, preserved marginal integrity, and no visible porosity, cracks, warpage, contamination, incomplete firing, marginal chipping, veneer detachment, or delamination were included. The null hypothesis was that no significant differences would be observed among the three systems in terms of surface morphology, elemental composition, surface chemical signatures, or interfacial transition characteristics.
2.2. Specimen Fabrication Protocol
Monolithic ZrO2 specimens and zirconia cores for the Feldspar/ZrO2 group were milled using a CAD/CAM milling unit (PrograMill PM7, Ivoclar Vivadent, Schaan, Liechtenstein). The milled zirconia specimens were sintered in a zirconia furnace (Programat S1 1600, Ivoclar Vivadent, Schaan, Liechtenstein) using the manufacturer-recommended sintering program for the selected zirconia material. For the Feldspar/ZrO2 group, the sintered zirconia cores were veneered using a standardized layering technique with IPS e.max Ceram and fired in a ceramic furnace (Programat P710, Ivoclar Vivadent, Schaan, Liechtenstein) according to the manufacturer-recommended firing protocol.
For the Feldspar/Co-Cr group, cobalt–chromium frameworks were fabricated by selective laser melting (EOSINT M 270, EOS GmbH, Krailling, Germany) using validated laboratory parameters recommended for the selected Co-Cr alloy system. Before veneering, the Co-Cr frameworks were finished, ultrasonically cleaned, and subjected to a manufacturer-recommended oxidation firing cycle to promote oxide-layer formation before feldspathic ceramic application. The feldspathic ceramic was then applied using the same standardized layering approach with IPS InLine and fired in the Programat P710 furnace according to the manufacturer-recommended firing protocol.
After fabrication, all specimens were visually inspected for defects, ultrasonically cleaned in distilled water for 10 min, rinsed with deionized water, dried with oil-free compressed air, and stored in closed dust-free containers at room temperature until SEM, EDS, and XPS analyses.
2.3. Surface and Cross-Sectional Preparation
Before analysis, all specimens were macroscopically inspected to confirm surface integrity and the absence of visible defects, including cracks, chipping, porosity, delamination, or contamination. For surface analysis, the external restorative surface was evaluated directly. For interfacial analysis, specimens from the layered groups were sectioned perpendicular to the veneer–substrate interface using a low-speed diamond saw under continuous water cooling to minimize heat generation and sectioning-induced damage.
The exposed cross-sections were progressively polished with silicon carbide abrasive papers of 600, 800, 1200, 2000, and 4000 grit, followed by final polishing with 1 µm diamond suspension. To minimize preparation-induced material transfer across the veneer–substrate interface, polishing was performed under low applied pressure, with thorough rinsing between successive abrasive steps. After final polishing, the specimens were ultrasonically cleaned in distilled water to remove residual abrasive particles and loosely adherent debris, rinsed with deionized water, and dried with oil-free compressed air. Before EDS acquisition, the prepared cross-sections were screened by SEM, and areas showing polishing scratches, particulate contamination, edge damage, or visible evidence of material dragging across the interface were excluded from analysis. EDS spectra, line scans, and elemental maps were acquired only from morphologically intact and contamination-free interfacial regions. The prepared cross-sections were then used to assess interfacial morphology and elemental transition patterns between the feldspathic veneer and the underlying zirconia or Co-Cr substrate.
2.4. Scanning Electron Microscopy Analysis
Scanning electron microscopy (SEM) was performed using a Quanta 200 microscope (FEI Company, Hillsboro, OR, USA) in low-vacuum mode under operating conditions adjusted according to the analytical purpose, with a working distance of 10 mm. SEM and EDS analyses were performed on uncoated specimens in low-vacuum mode to reduce charging artifacts while avoiding coating-related interference with elemental analysis. For spatially resolved interfacial EDS analysis, an accelerating voltage of 10 kV was used to limit the electron interaction volume and preserve micrometer-scale spatial resolution during line-scan and elemental mapping measurements. Regional compositional EDS point spectra were acquired separately at 20 kV, as described in
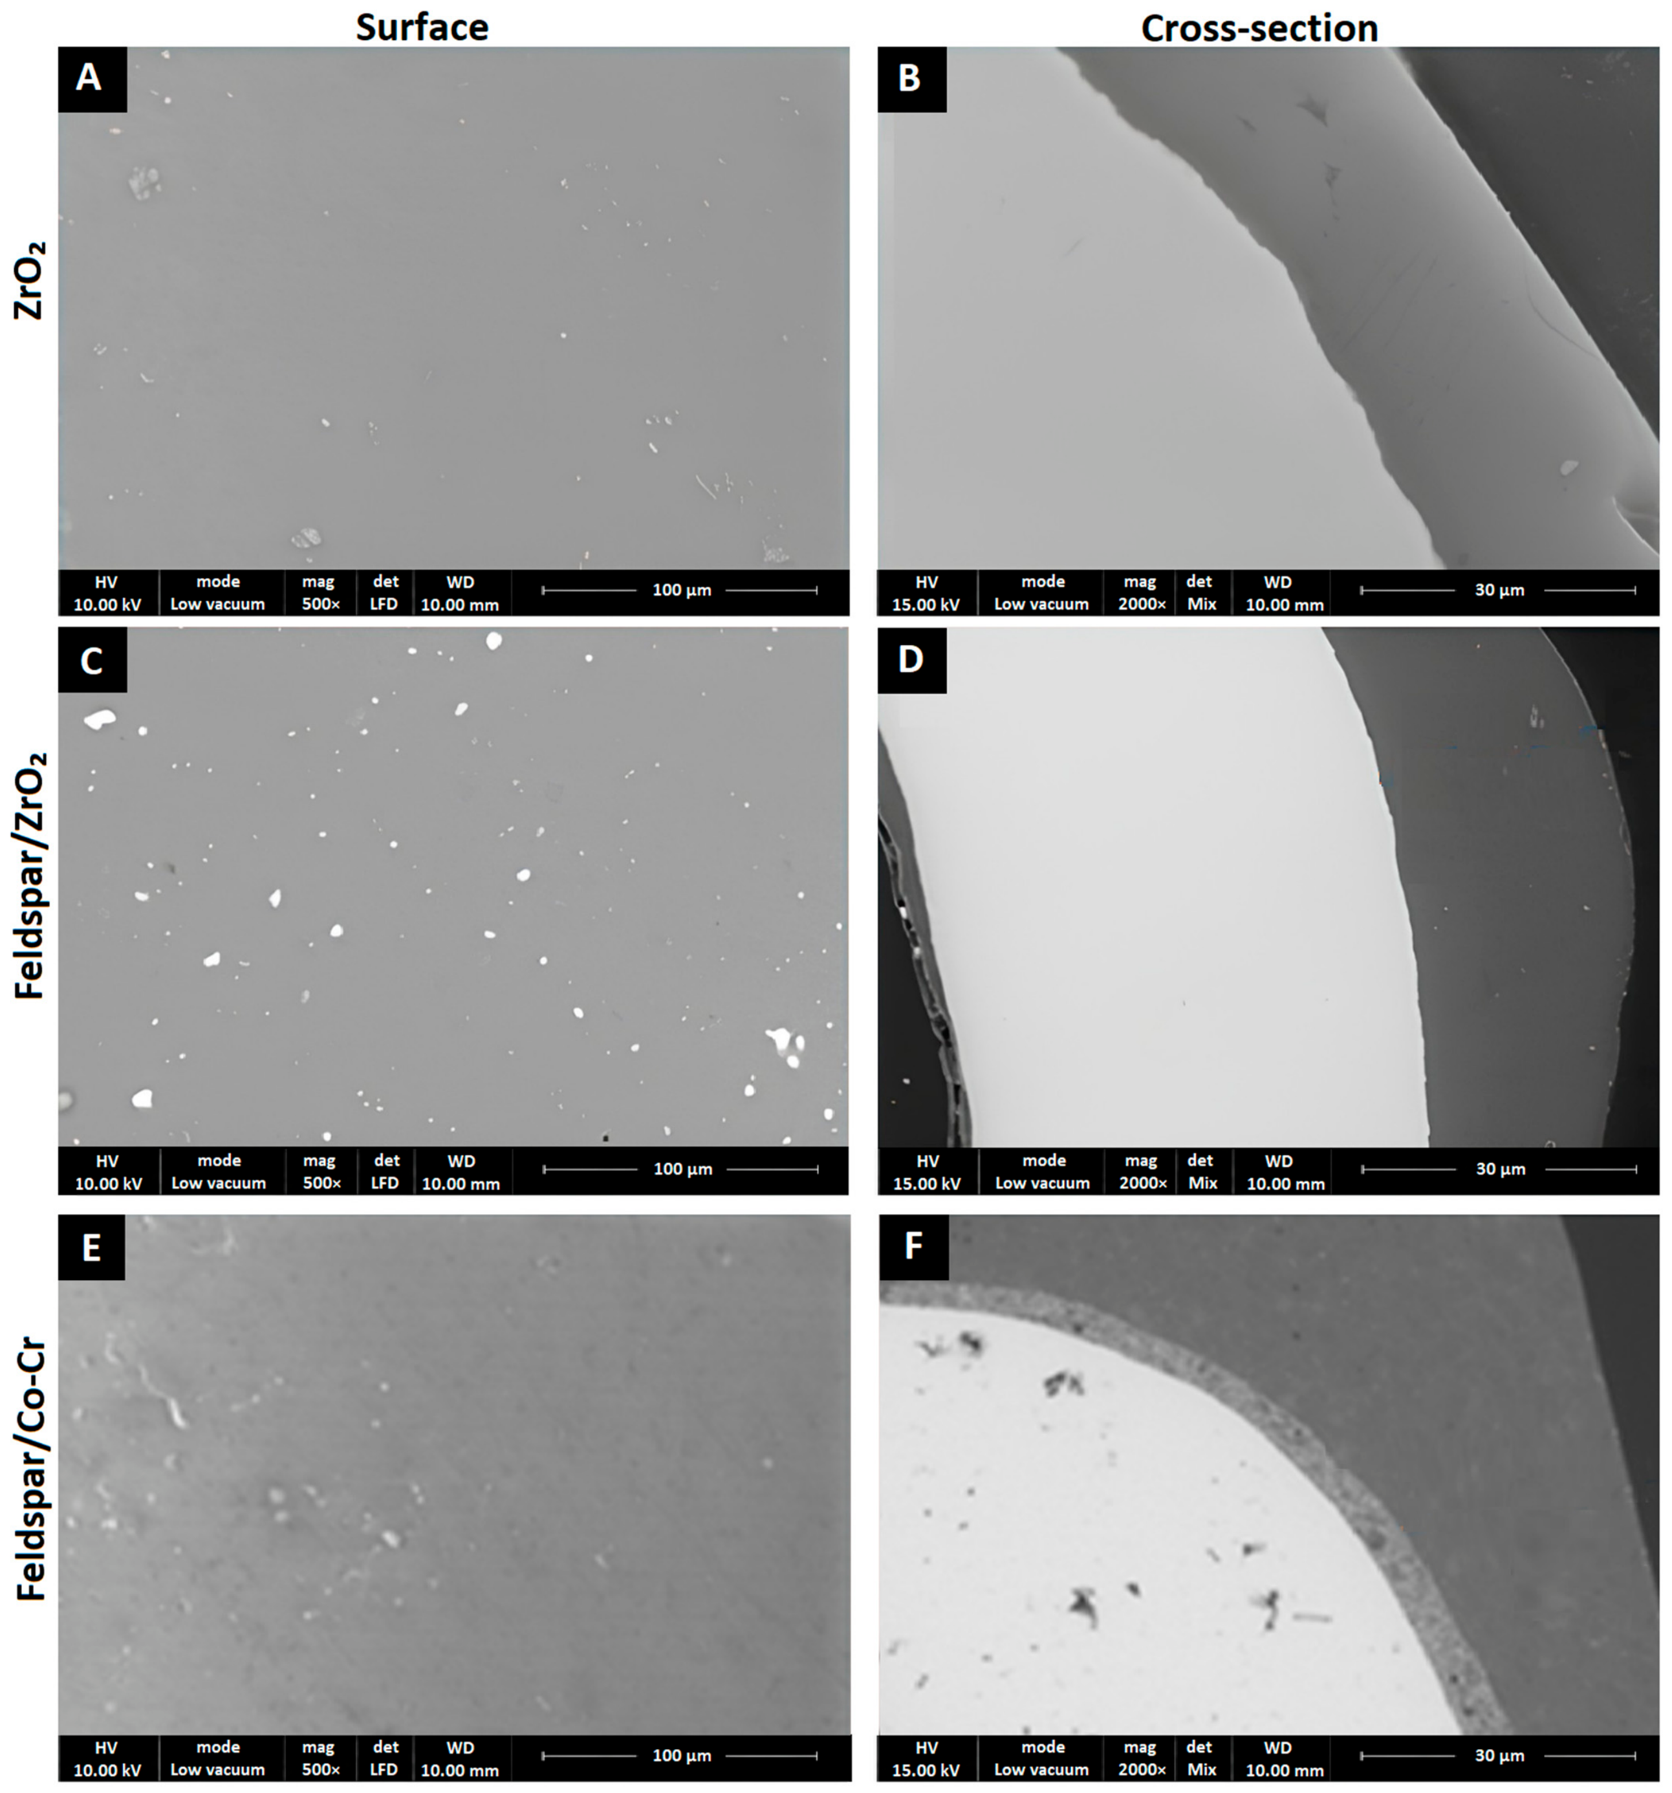
Section 2.5. Representative surface and cross-sectional areas were examined at 500× and 2000× magnification, respectively, and scale bars were included in all representative micrographs. SEM analysis was used to evaluate surface morphology, structural continuity, and interfacial characteristics of the analyzed restorative systems, including homogeneity, compactness, porosity, microcracks, gap formation, delamination, and transition-zone morphology, as applicable.
In the layered groups, particular attention was given to the veneer–substrate interface. Cross-sectional SEM micrographs were used to evaluate interfacial morphology and to support localization of the transition zone, whereas quantitative interfacial transition width was determined according to the combined SEM–EDS line-scan protocol described in
Section 2.7. Image-based measurements were performed using ImageJ v1.54.
SEM-derived morphometric and semi-quantitative parameters were assessed according to predefined criteria. For surface-based measurements, a standardized SEM field was defined as a surface micrograph acquired at 500× magnification under identical acquisition conditions across all experimental groups. Five non-overlapping surface fields were evaluated per specimen. Surface defect density was defined as the number of visible surface discontinuities, including pores, localized irregularities, and other clearly identifiable microstructural defects, recorded within each standardized field. Microcrack count was defined as the number of clearly identifiable linear discontinuities within the same standardized field. Visible porosity was scored for each field using a four-point scale: 0 = absent/negligible, 1 = low, 2 = moderate, and 3 = marked porosity. For each surface parameter, the five field-level observations were averaged to obtain a single specimen-level value, which was subsequently used for group-level statistical analysis. In the layered groups, interfacial continuity was assessed separately on cross-sectional SEM images acquired at 2000× magnification using a five-point scale: 1 = marked discontinuity or gap formation, 2 = partial discontinuity, 3 = moderate continuity with localized irregularities, 4 = good continuity with minor irregularities, and 5 = continuous interface without visible gaps or delamination.
All SEM-derived morphometric and semi-quantitative assessments were performed independently by two calibrated evaluators who were blinded to the experimental group assignment. Before formal analysis, both evaluators underwent a calibration session using a separate set of representative SEM images to standardize the assessment of surface defect density, visible porosity, microcrack count, and interfacial continuity according to the predefined criteria. Each evaluator subsequently assessed all coded images independently. To determine intra-examiner repeatability, 25% of the image set was randomly selected and reassessed independently by each evaluator after a 2-week interval under the same blinded conditions. Disagreements affecting the final classification were resolved by consensus only after completion of the independent assessments.
2.5. Energy-Dispersive X-Ray Spectroscopy Analysis
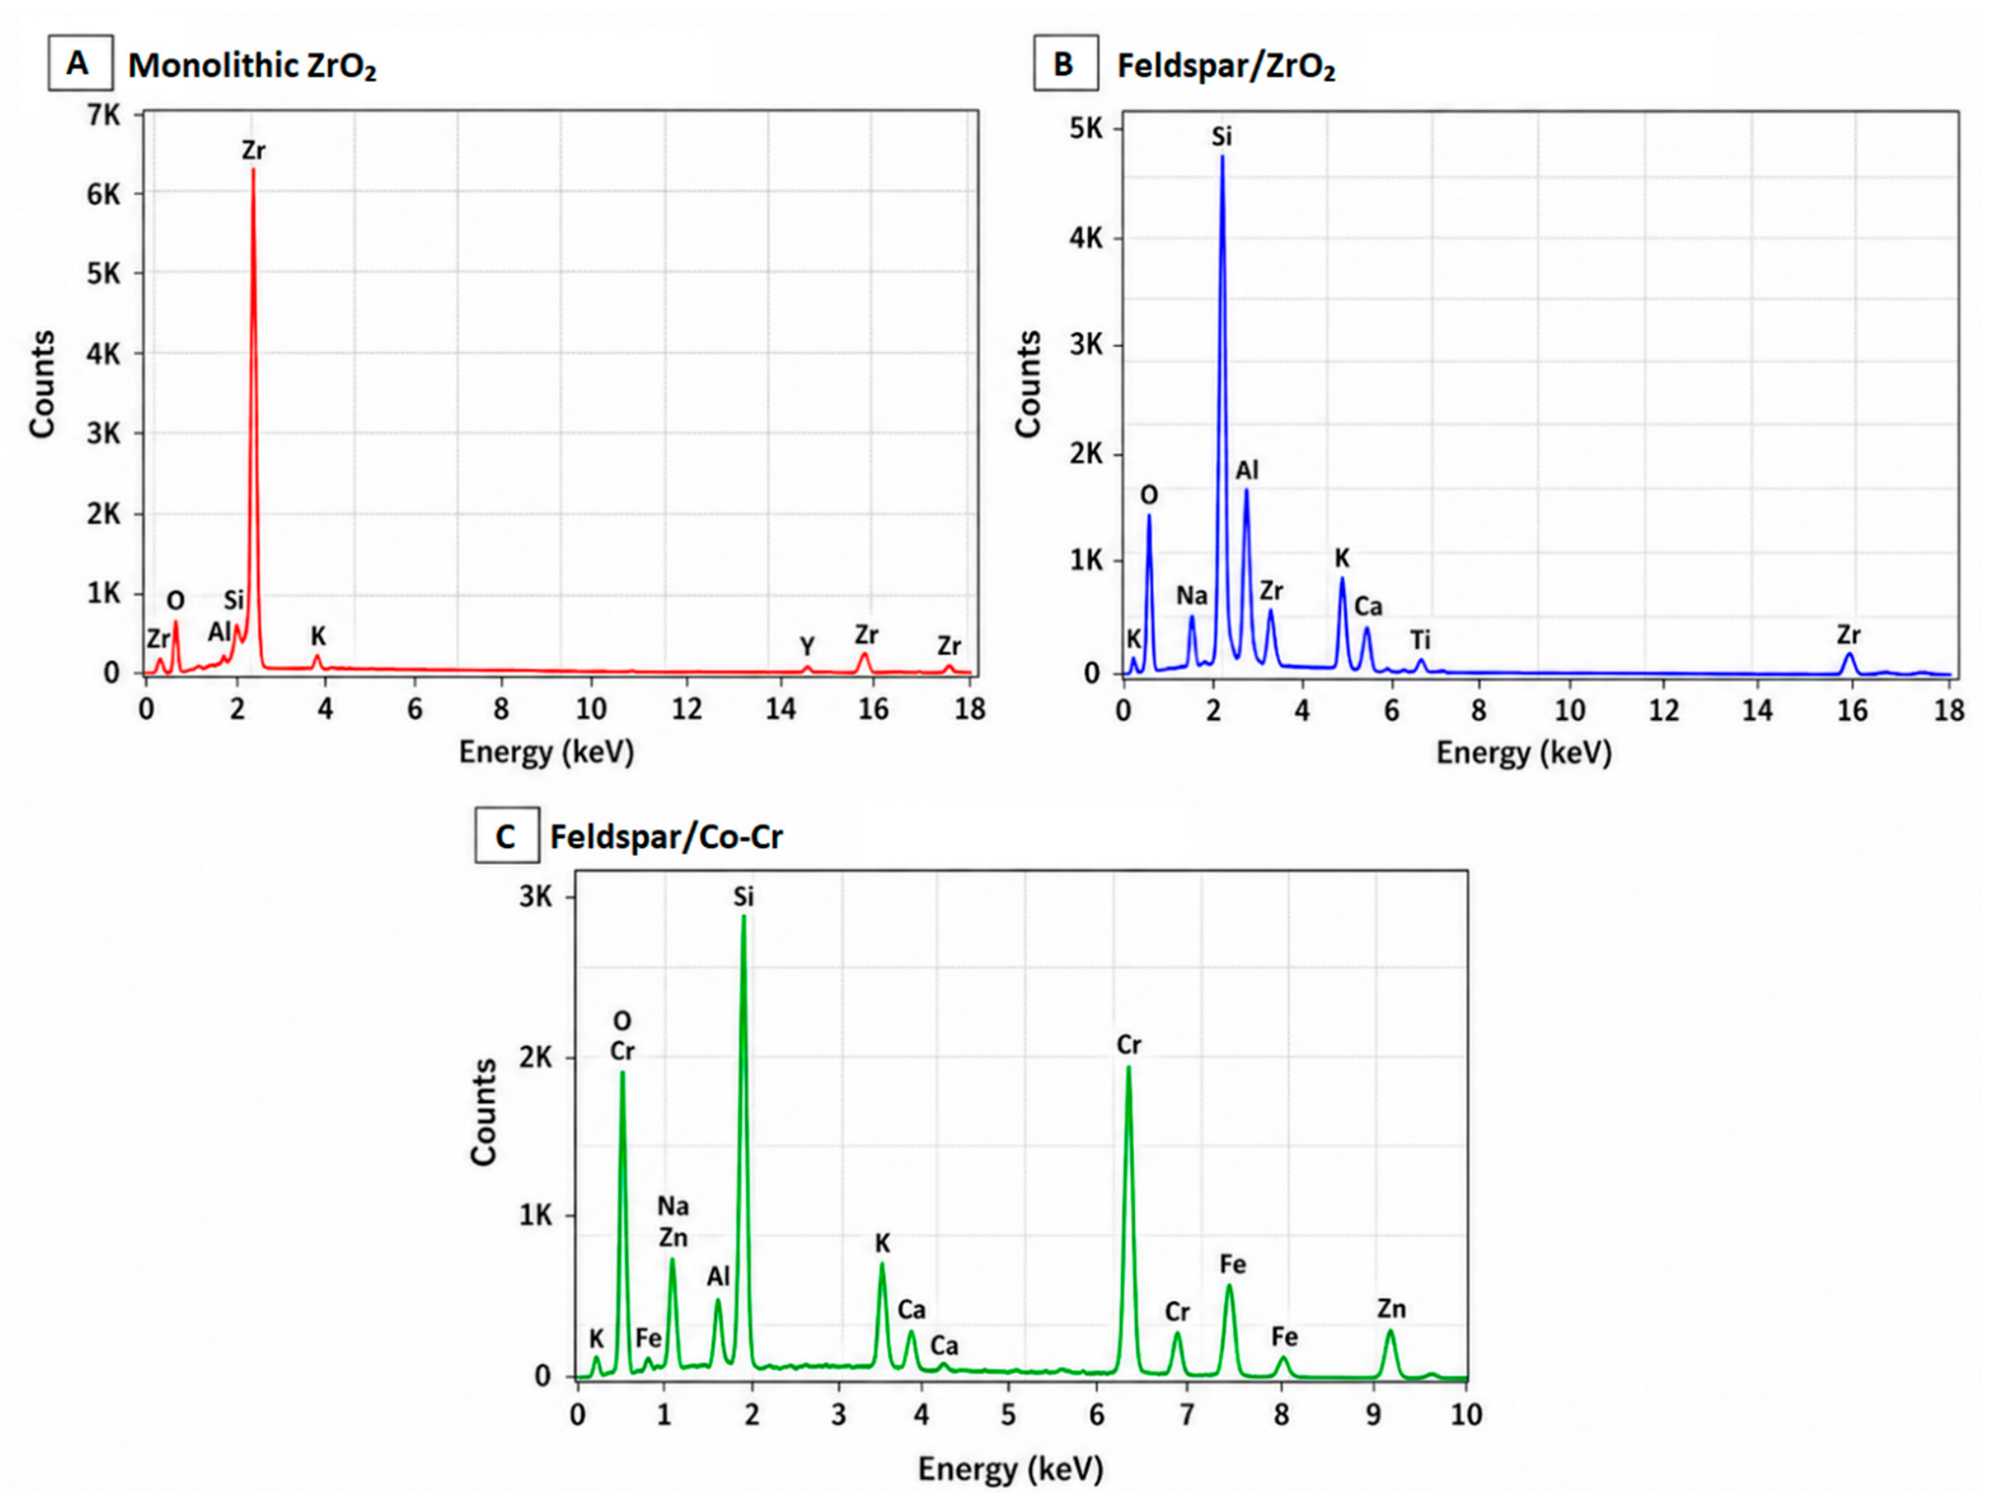
Energy-dispersive X-ray spectroscopy (EDS) was performed using an EDAX Genesis detector/software package (v6.29, EDAX Inc., Mahwah, NJ, USA) coupled to the Quanta 200 SEM system (FEI Company, Hillsboro, OR, USA). Spectra were acquired from representative surface, cross-sectional, and interfacial regions, as applicable, to determine the elemental composition of each restorative system. Regional EDS point spectra used for compositional characterization were acquired at an accelerating voltage of 20 kV, providing broader excitation of characteristic X-ray lines for elemental identification and regional compositional assessment. In contrast, interfacial EDS line scans and elemental maps were acquired at 10 kV. For interfacial line-scan acquisition, a step size of 0.20 µm and a probe setting of 3.0 were used, corresponding to an estimated lateral EDS spatial resolution of approximately 0.8–1.0 µm under the selected acquisition conditions. The lower accelerating voltage used for the interfacial analyses was deliberately selected to reduce the electron interaction volume and improve spatial resolution across the micrometer-scale veneer–substrate transition zones. Accordingly, regional point spectra were used for compositional characterization, whereas the 10 kV line-scan and mapping data were interpreted primarily as spatially resolved comparative microchemical profiles.
For monolithic ZrO2, EDS analysis focused on Zr, O, Y, and trace accessory elements. In the Feldspar/ZrO2 group, spectra were acquired from the feldspathic veneer, zirconia core, and interface, with attention to Si, Al, Na, K, O, Zr, and Y. In the Feldspar/Co-Cr group, spectra were obtained from the feldspathic veneer, Co-Cr substrate, and interface, focusing on Si, Al, Na, K, O, Co, Cr, and other alloy-associated elements. EDS-derived compositional values were reported as weight percentages (wt%), with minor heavy-element contributions interpreted semi-quantitatively under the selected acquisition conditions.
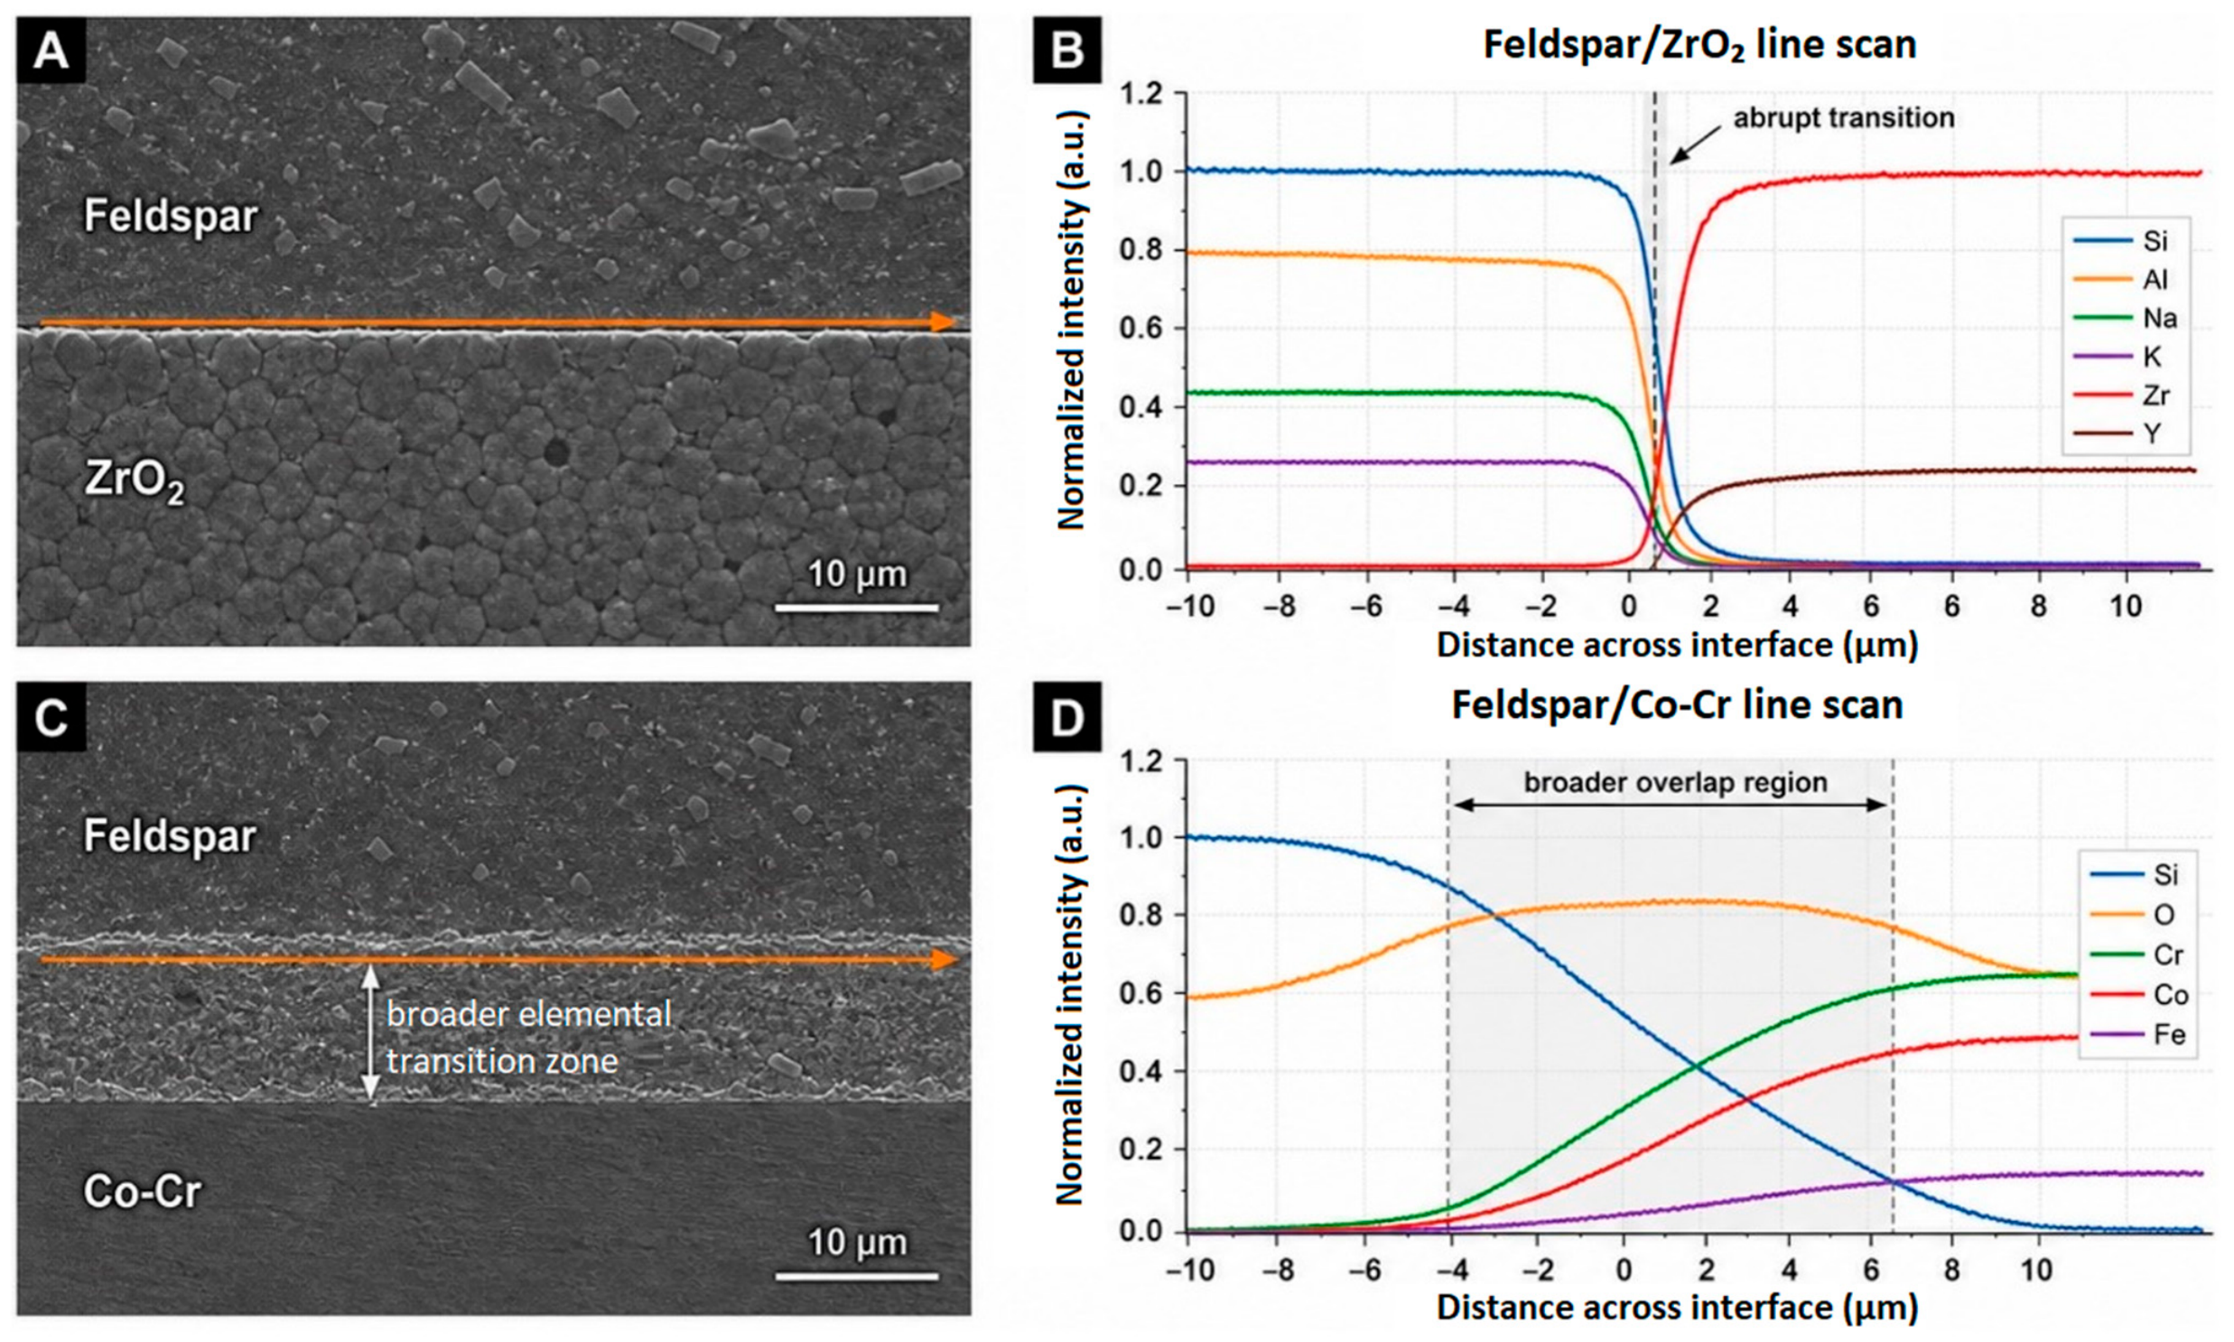
In the layered groups, EDS line scans and elemental maps were performed across the veneer–substrate interface. Line-scan trajectories were positioned perpendicular to the interface to evaluate elemental distribution, elemental overlap, and the abruptness or gradualness of the interfacial transition. Three independent line scans were acquired from non-overlapping interfacial locations in each layered specimen, as detailed in
Section 2.7. The EDS profiles were interpreted together with SEM and XPS findings. Oxygen values obtained by EDS were interpreted semi-quantitatively because light-element quantification by EDS may be affected by matrix effects, surface topography, detector sensitivity, and acquisition conditions. Minor heavy-element contributions were likewise interpreted cautiously because their quantitative reliability may vary according to the selected characteristic lines, matrix effects, spectral overlap, and acquisition conditions.
2.6. X-Ray Photoelectron Spectroscopy Analysis
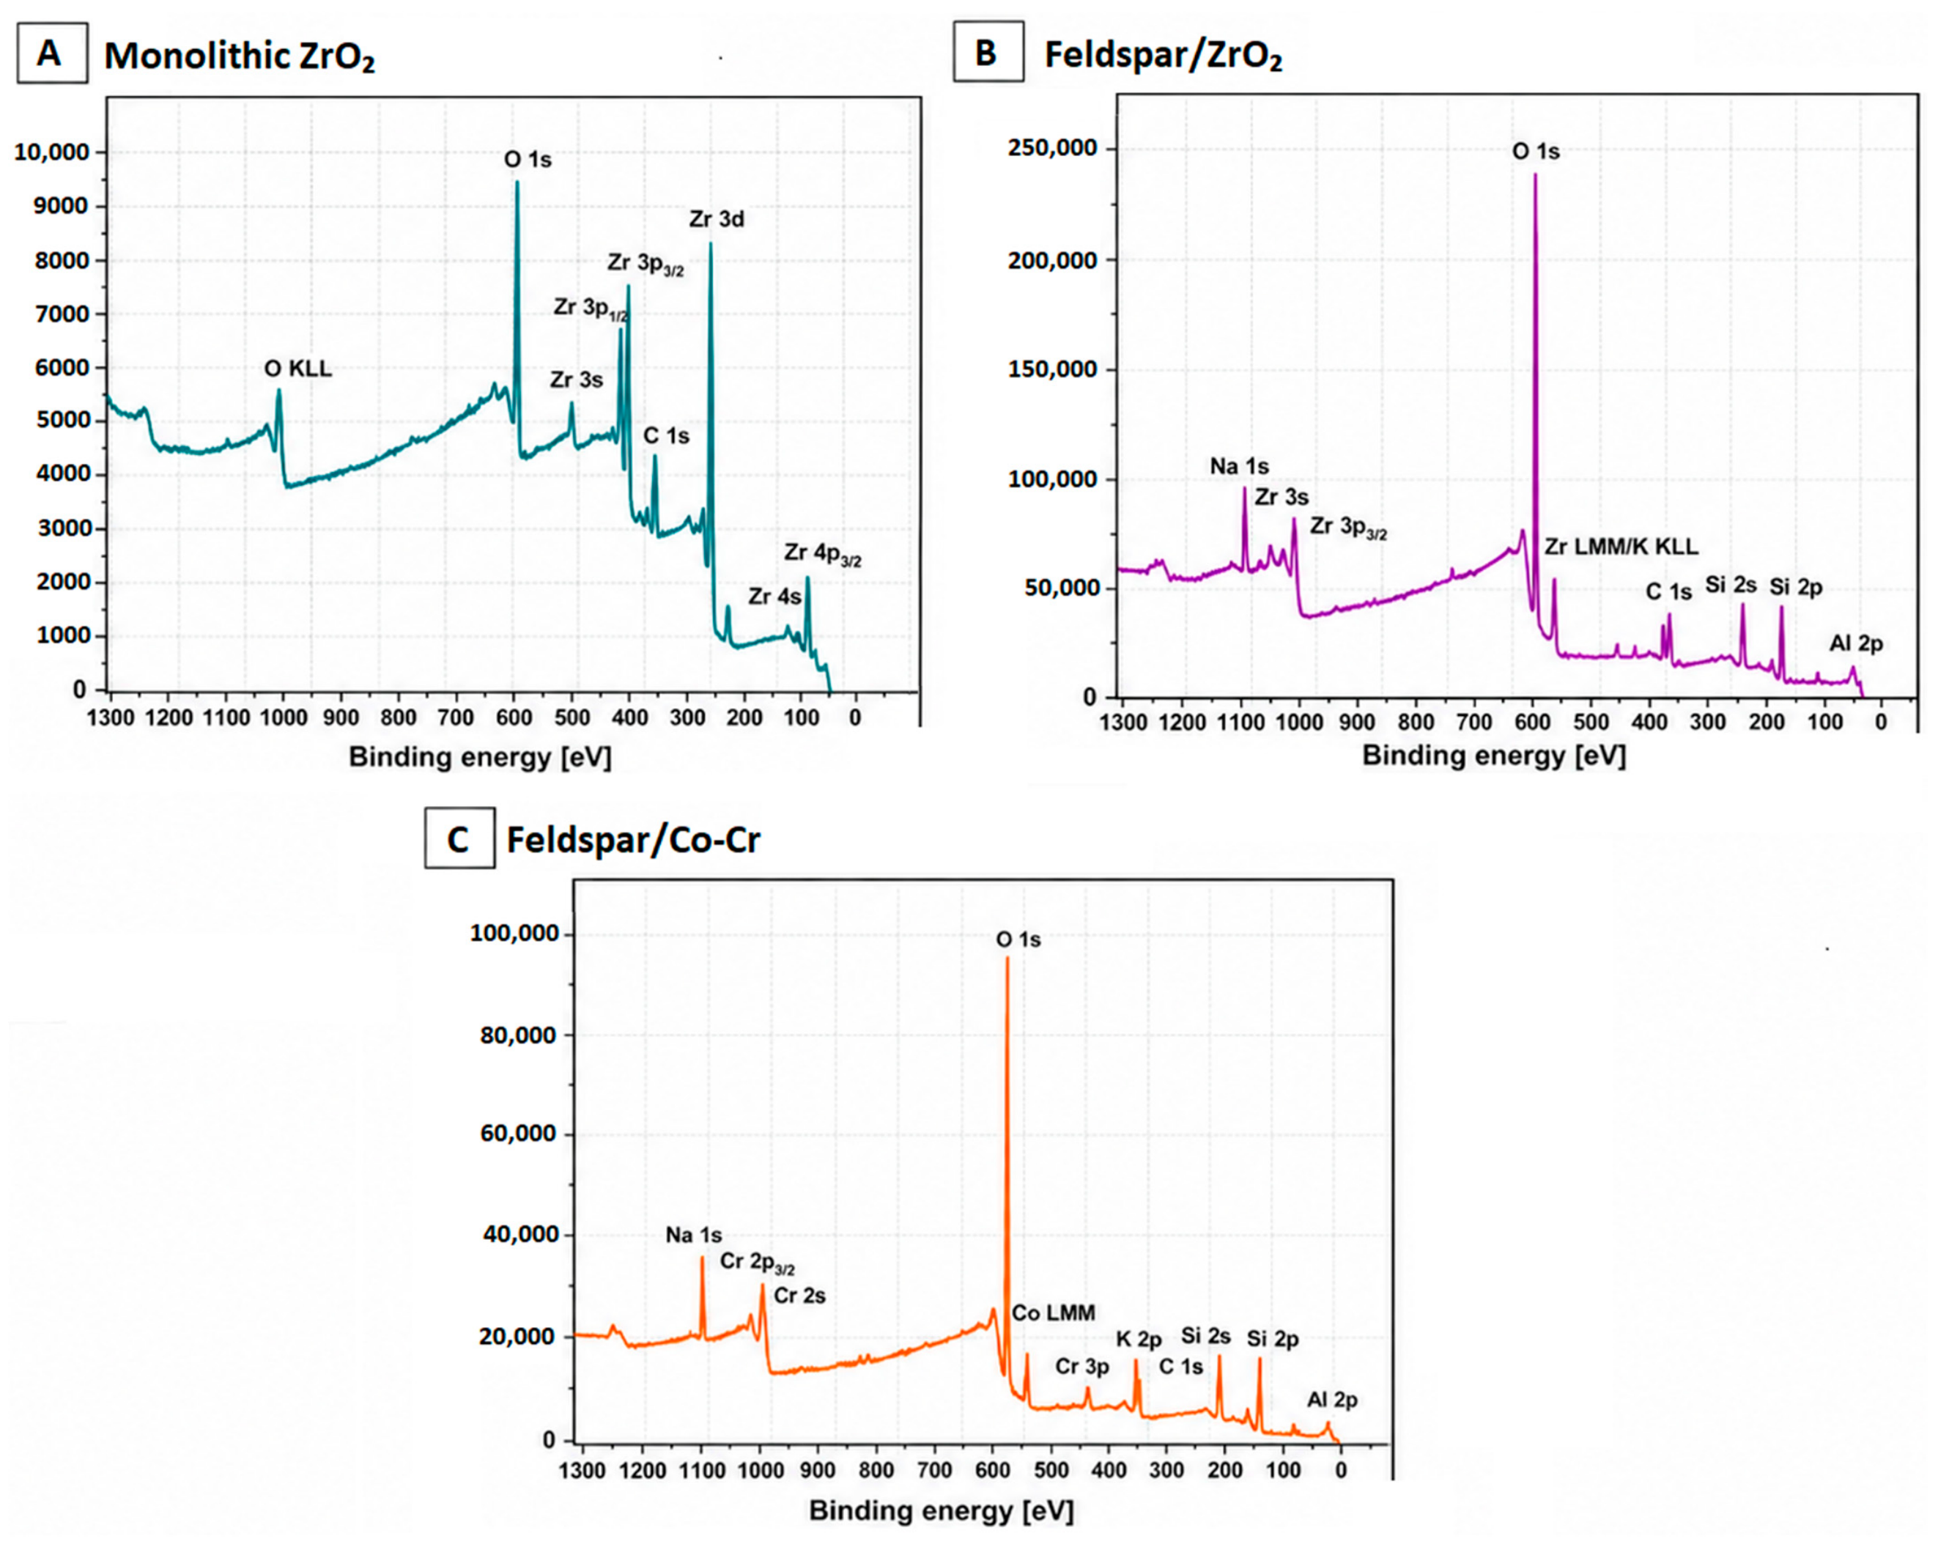
X-ray photoelectron spectroscopy (XPS) was performed using an ESCALAB 250Xi spectrometer (Thermo Fisher Scientific, Waltham, MA, USA) equipped with a monochromatic Al Kα X-ray source. Survey spectra were acquired for all experimental groups to identify the main surface elements and compare the chemical profiles of the analyzed restorative systems.
For monolithic ZrO2, XPS analysis focused on Zr-, O-, and Y-related signals. For Feldspar/ZrO2, feldspathic ceramic-related signals, including Si, O, Al, Na, and K, were evaluated together with possible weak zirconia-associated contributions. For Feldspar/Co-Cr, feldspathic ceramic-related signals were assessed together with possible Cr-, Co-, and O-associated features. These signals were interpreted as complementary surface chemical information and were not considered the primary evidence for defining the buried veneer–substrate interface.
Spectra were interpreted qualitatively and semi-quantitatively based on peak identification and relative signal intensity. Binding energy calibration was performed using the adventitious carbon C 1s peak at 284.8 eV, when required. Adventitious carbon was used solely as a binding-energy reference and was not assumed to be present at an identical surface concentration across specimens. Differences in C 1s atomic percentage were interpreted as variations in adventitious surface hydrocarbon coverage rather than as differences in bulk material composition. Because XPS is highly surface-sensitive, variations in hydrocarbon coverage may partially attenuate the relative intensities of underlying material-specific photoelectron signals, including Zr- and Si-related signals. Accordingly, XPS-derived atomic percentages were interpreted as comparative semi-quantitative surface chemical profiles rather than as direct measurements of bulk stoichiometric composition. In the layered groups, interfacial transition behavior was primarily assessed using cross-sectional SEM observations and EDS line-scan/mapping analysis, whereas XPS was used to complement the material-specific surface chemical profile. Because the analysis was based primarily on survey spectra, oxide-associated features were interpreted cautiously and were not considered definitive phase identification in the absence of high-resolution peak deconvolution. XPS findings were therefore interpreted in correlation with, but not as a substitute for, SEM and EDS interfacial evidence.
2.7. Interfacial Transition Assessment and Data Acquisition Strategy
Interfacial behavior was assessed only in the layered groups, Feldspar/ZrO2 and Feldspar/Co-Cr, because monolithic ZrO2 did not contain a veneer–substrate interface. Interfacial assessment was based primarily on cross-sectional SEM observations, EDS line-scan profiles, and elemental mapping, while XPS provided complementary material-specific surface chemical information. Interfacial transition width was determined from cross-sectional SEM micrographs and normalized EDS line-scan profiles acquired perpendicular to the veneer–substrate interface at an accelerating voltage of 10 kV and a working distance of 10 mm. Line scans were acquired using a step size of 0.20 µm and a probe setting of 3.0, corresponding to an estimated lateral EDS spatial resolution of approximately 0.8–1.0 µm under the selected acquisition conditions.
For each layered specimen, three non-overlapping interfacial locations were selected from morphologically intact cross-sectional regions, avoiding specimen margins, polishing artifacts, sectioning-induced cracks, and visibly contaminated areas. One EDS line scan was acquired at each selected location, resulting in three line scans obtained from spatially distinct locations within each specimen. Background intensity for each elemental signal was determined from compositionally homogeneous regions outside the interfacial transition zone. A signal was considered distinguishable from background when its intensity exceeded the mean background intensity by at least three standard deviations (mean background + 3 SD).
The interfacial transition zone was defined as the full distance interval over which at least one veneer-related elemental signal and at least one substrate-related elemental signal were simultaneously detectable above their respective background thresholds. The transition width was therefore measured between the first and last positions fulfilling this criterion and was not defined by the elemental signal cross-over point. For Feldspar/ZrO2, the transition was identified primarily from the spatial overlap between feldspathic ceramic-related signals (Si, Al, Na, and/or K) and zirconia-related signals (Zr and Y). For Feldspar/Co-Cr, the transition was identified from the overlap between feldspathic ceramic-related signals and substrate-related Co and Cr signals, with oxygen interpreted semi-quantitatively. The three transition-width measurements obtained from spatially distinct line scans within each specimen were averaged to generate a single specimen-level value for subsequent statistical analysis.
To improve measurement reproducibility, image acquisition and chemical analyses were performed using a predefined sampling strategy. Fields of view were selected using a systematic sampling approach, avoiding specimen margins, polishing artifacts, cracks caused by sectioning, and visibly contaminated areas. For SEM analysis, five non-overlapping surface fields were acquired from each specimen at 500× magnification. These standardized 500× surface fields served as the sampling units for surface defect density, visible porosity, and microcrack assessment. In the layered groups, three additional cross-sectional fields per specimen were acquired at 2000× magnification and used separately for interfacial evaluation. For EDS analysis, three point spectra were obtained from each predefined region per specimen, including the monolithic zirconia surface, feldspathic veneer, zirconia core, Co-Cr substrate, and interfacial regions, as applicable. Regional point spectra were acquired at 20 kV. Elemental mapping was performed in one representative interfacial area per layered specimen at 10 kV. For XPS analysis, one survey spectrum was acquired from each specimen, resulting in ten XPS acquisitions per experimental group.
For all quantitative analyses, the individual specimen was considered the experimental unit. Multiple SEM fields, EDS point spectra, and EDS line scans acquired within the same specimen were treated as within-specimen subsamples and were not entered into inferential statistical analyses as independent observations. SEM field-level measurements were averaged within each specimen to generate a single specimen-level value for each parameter. Likewise, the three EDS point spectra obtained from each predefined region were averaged to generate one specimen-level regional compositional value, and the three interfacial transition-width measurements obtained from separate line scans were averaged to generate one specimen-level transition-width value. Group-level statistical analyses were therefore based on n = 10 independent specimens per experimental group, thereby avoiding pseudoreplication arising from repeated within-specimen measurements.
2.8. Statistical Analysis
Statistical analysis was performed according to data type and predefined comparison level. The individual specimen, rather than the individual SEM field, EDS acquisition, or line scan, was used as the unit of statistical analysis. Quantitative SEM-derived parameters, EDS elemental values, interfacial transition width, and XPS atomic percentages, when available, were expressed as mean ± standard deviation. Data distribution was assessed using the Shapiro–Wilk test.
For comparisons involving three experimental groups, normally distributed data were analyzed using one-way analysis of variance followed by Tukey’s post-hoc test, whereas non-normally distributed data were analyzed using the Kruskal–Wallis test followed by Dunn’s post-hoc correction. For predefined two-group comparisons, including interfacial transition width between Feldspar/ZrO2 and Feldspar/Co-Cr, Welch’s t-test was used for normally distributed data, and the Mann–Whitney U test was used for non-parametric data.
EDS statistical comparisons were restricted to predefined comparable regions and to elements quantitatively detected in both compared regions. Global comparisons across compositionally distinct regions were not performed. Because small numerical differences in elemental composition may reach statistical significance when within-group variability is low, statistically significant EDS differences were interpreted together with their material relevance, regional distribution, and SEM/XPS correlation, rather than as isolated indicators of functional performance. SEM findings were primarily analyzed descriptively, focusing on surface morphology, porosity, microcracks, interfacial continuity, and transition-zone morphology. XPS survey spectra were interpreted qualitatively and semi-quantitatively based on peak identification, relative signal intensity, and atomic percentage values. XPS-derived atomic percentages were expressed as mean ± standard deviation and were compared statistically only for signals quantitatively detected in at least two experimental groups. Because XPS analysis was based primarily on survey spectra and no high-resolution peak deconvolution was performed, these comparisons were interpreted as exploratory semi-quantitative comparisons of surface chemical profiles and were not used for definitive oxide phase identification.
Inter-examiner reliability was assessed from the initial independent evaluations of the two observers. For count-based SEM variables, including surface defect density and microcrack count, agreement was evaluated using the intraclass correlation coefficient (ICC). For ordinal SEM variables, including visible porosity and interfacial continuity scores, agreement was evaluated using weighted Cohen’s kappa (κw). The same reliability measures were used to assess intra-examiner repeatability based on the repeated evaluation of the randomly selected 25% image subset.
The level of statistical significance was set at α = 0.05. Statistical analyses were performed using GraphPad Prism v10.0, and image-based measurements were performed using ImageJ v1.54.