Article

Local and Average Structure of Yb-Doped Ceria through Synchrotron and Neutron Pair Distribution Function

1
Dipartimento di Chimica, Università Degli Studi di Pavia, I-27100 Pavia, Italy
2
ESRF, European Synchrotron Radiation Facility, F-38043 Grenoble, France
3
Dipartimento di Chimica, Università di Milano, I-20133 Milano, Italy
4
MAX IV Laboratory, Lund University, SE-22100 Lund, Sweden
5
DUBBLE CRG at the ESRF, Netherlands Organisation for Scientific Research (NWO), F-38043 Grenoble, France
*
Author to whom correspondence should be addressed.
Inorganics 2019, 7(8), 102; https://doi.org/10.3390/inorganics7080102
Submission received: 29 June 2019 / Revised: 13 August 2019 / Accepted: 15 August 2019 / Published: 18 August 2019
(This article belongs to the Special Issue Rare Earth-Doped Ceria Systems and Their Applications)

Abstract

:
As transport properties of doped ceria electrolytes depend significantly on the nature of the dopant and the defectivity, the design of new materials and devices requires proper understanding of the defect structure. Among lanthanide dopants, Yb shows some peculiar characteristics that call for a possible different defect structure compared to Gd and Sm conventional dopants, which could be linked to its poorer performance. For this purpose, we combine synchrotron and neutron powder diffraction exploiting the Rietveld and Pair distribution Function. By increasing its concentration, Yb produces qualitatively the same structural distortions as other dopants, leading to a domain structure involving the progressive nucleation and growth of nanodomains with a Yb2O3-like (C-type) structure hosted in a fluorite CeO2 matrix. However, when it comes to growing the C-type nanodomains into a long-range phase, the transformation is less pronounced. At the same time, a stronger structural distortion occurs at the local scale, which is consistent with the segregation of a large amount of oxygen vacancies. The strong trapping of VOs by Yb3+ explains the poor performance of Yb-doped ceria with respect to conventional Sm-, Gd-, and Y-doped samples at equal temperature and dopant amount.

Graphical Abstract

1. Introduction

Pure and doped cerium oxides have high catalytic oxygen exchange and charge transport properties. When doped with lower valent cations (e.g., trivalent rare earth cations, RE3+), Ce reduction is depressed and oxygen vacancies (VOs) are formed proportionally to the amount of RE dopant, giving Ce1−µREµO2−µ/2. Consequently, significant ionic conductivity is promoted, already at low temperature (500–700 °C) [1]. This allows doped ceria to be used as an electrolyte for solid oxide full cells. Since doped ceria exhibits ionic conductivity properties that are even greater than those of yttria-stabilized zirconia, nowadays it is being investigated and tested for application in low-temperature devices [2].
The transport properties of doped ceria depend significantly on the nature of the dopant, morphology, and defectivity [1]. Therefore, the design of new materials and devices requires proper understanding of the defect structure of the electrolyte. A number of reports and reviews exist about the description of defect structure in doped ceria [3,4,5]. It is nowadays accepted that the VOs formed in response to aliovalent doping are not randomly distributed in fluorite; they rather tend to cluster together, leading to a system significantly different from an ideal solid solution. This is evident when the doping amount is increased to values near the solubility limit. Approaching the transition to the sesquioxide RE2O3 phase, either hexagonal A (RE = La, Nd) or cubic C-Type for other RE elements is formed [6]. Among the different dopants, most literature reports focus on Gd, Sm, and Y, which provide the highest ionic conductivities [7]. Still, the investigation of other dopants can provide further understanding of the system, as not all the dopants behave the same when entering fluorite.
A direct correlation between ionic conductivity and size mismatch between dopant and host Ce4+ ion was already established in the 1990s [7,8], and confirmed by ab initio calculations as the balance between migration barrier for bulk diffusion and dopant-VO interactions [9]. The first X-ray absorption spectroscopy (XAS) investigations proved that the more the VOs are distributed randomly, the higher the value of ionic conductivity [10]. Indeed, XAS generally found VOs close to the dopant ions, Sm being the only exception [11,12,13] as it can be either NN or NNN of the VO [14]. In general, it has been proposed that the dopant is arranged as in its own oxide [15], even though a full structural model cannot be obtained by XAS alone.
With the exception of Pr and Tb, which maintain a mixed valence state [11,16,17], the structural distortion around VOs has been found by Pair Distribution Function (PDF) studies to depend on the size mismatch between cations [18]. Cation size mismatch appears to also affect the dopant solubility limit into fluorite structure. Keeping in mind that reported solubilities are affected by the synthesis route, La doping can reach µ = 50%, maintaining long-range fluorite [19,20], while Yb is reported to enter fluorite up to µ = 40% [21]. However, it should be noted that slight C-type distortions from fluorite give rise to tiny superstructure peaks that can be easily missed unless recurring to synchrotron radiation (see [3] and references therein). Structural details about fluorite and C-type structures are discussed elsewhere [22] and will be recalled later. Structural evolution linked with heavy doping is an important factor to understand and to estimate the way defects interact at lower dopant concentration. Indeed, it was proved recently by PDF that for Y [23], Gd [22,24], and Sm [25], the fluorite to C-type transformation occurs via nucleation and growth of distorted C-type nanodomains that merge and percolate at a critical dopant concentration. This makes heavily doped ceria structure a hybrid between those of fluorite and C-type [5,26]. The presence of nanodomains with the structure of the dopant oxide was already observed by HRTEM for many different dopants (see e.g., [27,28,29]), although microscopy does not provide bulk structural information and no dopant-specific effects could be assessed. Interestingly, whereas the above diffractive investigations indicated that the transformation occurs without intermediate segregation of secondary phases, Yb and Lu are reported to form a biphasic system before transforming completely into a single cubic C-type phase [20,30,31,32]. The present investigation gives a complete description of the local and average structure of Yb-doped ceria as a function of composition and shows key differences with the other dopants. Powder diffraction data from synchrotron (XRPD) and neutron (NPD) were used to analyze data in both reciprocal (Rietveld) and real (PDF) space. NPD is particularly favorable because the weight of O–O correlations in the neutron PDF is far greater than in the X-ray PDF. Moreover, concerning the Yb-doped system, Yb possesses the highest neutron scattering length (12.43 fm [33]) among lanthanides, thus increasing the scattering contrast with Ce (4.84 fm [33]).

2. Results and Discussion

2.1. Long-Range Structure

CeO2 exhibits fluorite structure, space group Fm-3m with both Ce (4a, 0, 0, 0) and O (8c, ¼, ¼, ¼) in special position sites. Doping is accounted for by sharing the cation site and by randomly distributing VOs at the O site. Yb2O3, like other rare earth sesquioxides, at ambient conditions has C-type structure, space group Ia-3, with the cations split in two sites, Yb1 (8b, ¼, ¼, ¼) and Yb2 (24d, x~0, 0, ¼), and O ions slightly out of special position (48e x ~ 3/8, y ~ 1/8, z ~ 3/8). Partial substitution of Ce for Yb leads to occupation of the O2 site (16c, x ~ 3/8, x, x). C-type is closely related to fluorite. It can be described as a distorted fluorite where the ordering of VOs produces the doubling of cell axis (hence the occurrence of superstructure peaks in the diffraction pattern) and the shift of atomic coordinates described above. Especially in the case of X-ray, the value of the x coordinate of the M2 site (M = Ce, dopant) can be interpreted as the degree of C-type distortion: Only when x(M2) = 0, the atomic (cation) structure is fluorite; otherwise, the larger the shift of x(M2), the larger the C-type distortion.
Figure 1a displays the experimental XRPD patterns for different Yb content. Three main effects appear with increasing the amount of Yb. First, the shift towards high-Q of Bragg peaks, consistent with lattice shrinkage. Second, superstructure peaks evidence C-type ordering, as highlighted in Figure 1b. The (413) reflection is already observed for Yb375, even though with small intensity and large broadening, about four times broader than structure peaks. This phenomenon, consistent with the existence of anti-phase boundaries due to the nucleation and growth of C-type nanodomains starting on different sites, is consistent with the hierarchical structures already observed for Y, Gd, and Sm and described as C* [23,24,25]. Lastly, x(M2) is very close to 0 (−0.003), indicating that only a slight C-type distortion occurs. For Yb500, a full C-type structure is obtained.
Based on the changes in long-range structure, the solubility limit of Yb in ceria can be estimated around 0.35, though more compositional points could be taken to increase accuracy. At the same time, as shown in Figure 1c, increasing doping induces progressive and significant broadening of the structure peaks (see arrows). We examine peak broadening in terms of lattice strain and crystal size by carrying out Williamson–Hall (WH) analysis, whose results are shown in Figure 2.
All curves point roughly to the same intercept, with crystal size estimated in the order of 70–100 nm. Being aware of the limitations of the method when it comes to crystal size, the main result here is that microstrain is by far the most important contribution to peak broadening. In the inset of Figure 2, the estimated strain parameter ε as a function of μ is plotted, where μ is the amount of Yb in the sample. Since ε increases monotonically with the amount of Yb, we deem the origin of peak broadening to be compositional gradients across the material, which lead to a spread distribution (Δd/d) of the lattice parameter.
Table 1 list the results of synchrotron Rietveld refinements. Up to μ = 0.250, the structure is fluorite and a large increase in mean square displacement parameters (msd) is observed. This points to the occurrence of static disorder, i.e., ions occupying different absolute positions in different crystallographic cells, leading to a broader distribution of the electronic cloud and resulting in increased decay of the peak intensity as a function of the scattering angle [34].
The presence of a static contribution to the msd can be easily demonstrated by recording the temperature evolution of msd with the equivalent not-disordered form; in this case, CeO2. The temperature evolution of msd for CeO2, Yb125, and Yb250, estimated from NPD Rietveld refinements, is shown in Figure 3. Both cation and O sites (Figure 3a,b, respectively) shift rigidly towards high values of msd, thus confirming that static disorder increases with Yb concentration. The square root of the static contribution of msd leads to an average shift of atomic positions of approximately 0.05 and 0.08 Å for samples Yb125 and Yb250, respectively.

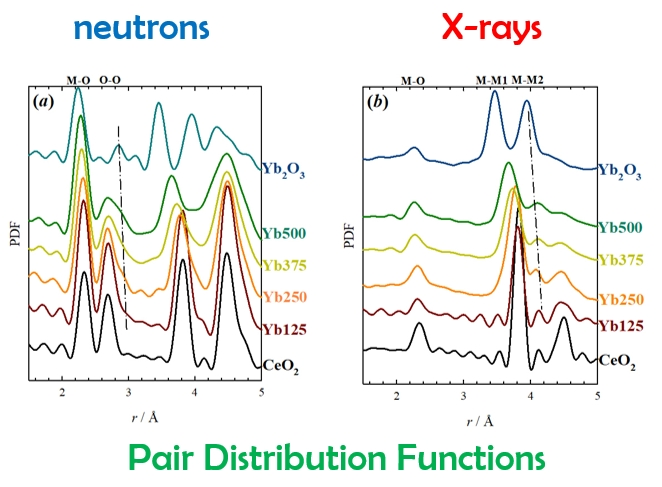
2.2. Local Structure—Neutron

Figure 4 reports the experimental neutron (Figure 4a) and X-ray (Figure 4b) PDF curves, while Table 2 shows selected interatomic distances computed by direct analysis. The first two signals in NPD PDF correspond to M–O and O–O distances, which in CeO2 occur at approximately 2.34 Å and 2.70 Å, respectively. By adding Yb, the M–O pair shrinks, according to lattice contraction, while O–O expands. This is not consistent with a fluorite atomic arrangement where all ions occupy special positions. In fact, lattice contraction would shrink all atom pairs.
This effect was already observed in Y-doped ceria and ascribed to the relaxation of O ions towards VOs, which increases the average O–O interatomic distance [18,35]. This model was first proposed for doped ceria by molecular dynamics [36]. Similar effects were observed on other systems [37].
Such a relaxation can be modeled by creating a 2a × 2a × 2a supercell with a VO and allowing the nearby O ions to relax towards it. Details of this “cluster” model are described in [18]. Because of geometrical constraints, this model can be applied only up to the composition Yb250. In fact, by further increasing the dopant concentration, some O ions are forced to be first neighbor of two different VOs, thus making the model unfeasible. Refinements accounting for O relaxations are shown in Figure 5 and compared with modelling with simple fluorite cells. The refined parameters are reported in Table 3.
Allowing O relaxations improves the fit significantly, especially for Yb250 where the most VOs are present. The relaxation of cations away from the VO was tested as well, but, as it failed to improve fits with respect to the fluorite model, a different mechanism for cations disordering must be applied. The magnitude of the O relaxation (~0.18 Å) is nearly invariant with doping. However, within the 63 O ions in the supercell, only part of the O ions is relaxed (six for every VO in the supercell), leading to an average shift of ~0.035 Å of Yb125 and ~0.07 Å for Yb250. These values are slightly smaller than those derived from static disorder estimated in the reciprocal space (~0.05 and ~0.08 Å, respectively). This discrepancy suggests that O disorder may be more complex than the simple relaxation of O ions towards an VO, especially because isolated VOs are assumed. Indeed, a signal on the high r side of the O–O peak, corresponding to the O–O distance in Yb2O3, becomes apparent already for Yb250 and grows with Yb-doping. Again, this effect was observed upon Y-doping [23] and found to be consistent with the complex ordering of VOs resembling the structure of C-type.

2.3. Local Structure—X-Ray

Experimental X-PDF curves are shown in Figure 4b. By increasing the amount of Yb, the first peak (M–O) contracts, consistent with NPD results. No O–O is observed according to the weak scattering form factor of O compared to Ce and Yb. The second main peak in the X-PDF corresponds to M–M pairs, plus a negligible contribution from O–O pairs. By increasing Yb-doping, the M–M contracts monotonically. In Yb2O3, this peak corresponds to the shorter of two M–M pairs. The longer one at ~4.1 Å is, surprisingly, evident even for Yb250. Like the expansion of the O–O pair observed by NPD PDF, the presence of a second M–M distance is not allowed in a fluorite atomic arrangement. As found previously by Allieta et al. [38], this demonstrates the occurrence of C-type ordering induced by dopant–dopant pairs. Figure 6 reports the fit of X-ray PDF of the doped samples, using either a single structural model—fluorite or C-type according to the structure determined by Rietveld (panels on the left)—or allowing the coexistence of the two phases at the local scale (panels on the right). The two-phase model significantly improves the fit, especially in the region featuring M–M distances. Similar results were already observed in ceria doped with Y [23,35], Sm [25], Gd [24,39], Bi [40], Zr [41], Pr, Tb [16], and La [42]. This is also consistent with recent absorption spectroscopy study, where a bimodal distribution of bond lengths was observed in Y- and Sm-doped ceria compounds [43]. As to lower dopant concentrations, the small magnitude of the peak at 4.1 Å, which is comparable to the nearby ripple, hinders the correct estimation of the C-type fraction. However, in view of the progressive evolution of msd and according to previous investigations on other dopants [23,25,39], we believe that C-type ordering occurs already for smaller concentrations.
In this respect, Yb behaves the same as other dopants. Having refined the relative amount of the two phases in the model, the local structural distortion can be quantified by the fraction of C-type at the local scale (C-frac). Comparison with other systems (data summarized in [25]) with µ = 0.250 reveals that C-frac observed here for Yb (0.30) is significantly larger than for Gd (0.20), Sm (0.23), and Y (0.24), which points to a larger local C-type distortion.
The spatial extent of the structural distortion can be estimated through box-car refinements, i.e., by monitoring the structural evolution as a function of the interatomic distance. In this respect, the relationship between fluorite and C-type facilitates the analysis, as described elsewhere [44], by focusing on the x(M2) structural parameter. Assuming negligibility of the O contributions, the average size of C-type regions embedded in a fluorite matrix corresponds to the r value at which x(M2) goes to zero. Results of box-car refinements are shown in Figure 7.
The r-dependent evolution of x(M2) suggests that both Yb250 and Yb375 have a local structure consisting of C-type domains hosted in a long-range fluorite matrix. In both materials, the C-type domains extend ~9 nm. For Yb500, however, x(M2) does not vary significantly and the structure can be defined as fully C-type. Domain size in Yb250 is smaller than in samples of ceria doped with the same concentration of Y, Sm, and Gd, which feature 10–12 nm domains estimated with the same method [23,24,25].
In other doped ceria systems, increasing the dopant concentration leads to a clear increase of domain size and to the formation of a long-range C-type structure. This effect is softened for Yb. By increasing doping up to Yb375, the C-type domain size does not increase and percolation is achieved as the concentration of Yb forces domains to meet and coalesce in a percolation path [24]. In the framework of previous PDF investigations on other dopants, the hierarchical structure of Yb375 can be defined as C*. From µ = 0.375 on, further C-type distortion is inhibited. The main reason lies in that the fluorite to C-type domain mechanism is held together by the close affinity between (i) the two crystallographic structures involved, and (ii) the two metal species. Artini et al. [26] proposed cation compressibility as a requirement to form a stable C-type phase, i.e., the ability of a dopant to accommodate the size mismatch-induced pressure change. Increasing the size mismatch between dopant and host Ce4+ ions, especially in the case of small lanthanides with reduced compressibility, will increase the energy of the domain structures, thus limiting their growth and making more favorable the long-range segregation of an Yb-rich phase.
To rationalize the difference in domain size between Yb and other dopants, one has to consider that the concentration of VOs is defined by electroneutrality and should be, therefore, invariant with the nature of the lanthanide dopant as long as it is trivalent. The larger C-type fraction value observed for Yb implies a larger local C-type distortion, consistent with regions with a higher density of VOs. As the distribution of VOs is spatially limited, the C-type nanodomains have smaller size in the case of Yb compared to other dopants. When dealing with conventional dopants such as Gd3+ and Sm3+, which are bigger than Yb3+ and have a similar size to Ce4+, nanodomains can grow more easily. The strong trapping of VOs by Yb3+ explains the low ionic conductivity detected for Yb-doped ceria with respect to Sm, Gd, and Y-doped samples at equal T and dopant µ.

3. Materials and Methods

Ce1−µYbµO2−µ/2 samples with µ = 0, 0.125, 0.250, 0.375, and 0.500 were produced using a modified Pechini sol–gel procedure, as described in [45]. Ce(NO3)3·6H2O (99%) and Yb(NO3)3·5H2O (99.9%) were dissolved into water in due proportions; then an excess of citric acid (99%) and ethylene glycol (≥99%) was added to the solution. A polymeric gel was obtained after water evaporation upon heating and stirring. The gel was burned at 500 °C for 3 h after 3 °C/min ramp rate in a Nabertherm ashing furnace. The products were pressed uniaxially and annealed at 900 °C for 3 days. Hereafter, samples will be named as “Yb”, followed by the corresponding μ Yb amount. Commercial Yb2O3 (99.9%) was used as the reference undoped materials. All chemicals were bought from Sigma-Aldrich (Milan, Italy) and used as received.
Synchrotron diffraction data were collected at the high resolution powder diffraction beamline (ID22) of the ESRF, Grenoble, France. The powdered samples were filled into 0.7 mm polyimide (kapton) capillaries and spun during acquisition at a temperature of 90 K. X-ray wavelength was λ = 0.32635 Å. PDF data were recorded with the same high-resolution setup and wider 2θ scans, in order to reach Qmax = 25 Å−1.
NPD data were collected at the ILL (Grenoble, France) [46] on samples contained in V cans, placed into a cryostat. As for reciprocal space analysis, data were collected from 5 to 300 K at the D20 instrument, working at λ = 1.3593 Å, recording patterns upon heating every 25 K on samples Yb125 and Yb250 and every few K for CeO2. The d4c instrument was exploited for obtaining PDF data on all the specimens, with incident neutron wavelength λ = 0.4975 Å to achieve Qmax = 23.5 Å−1. PDF data were collected at 90 K, to minimize thermal motion consistently with synchrotron datasets, and reduced using the proprietary software of D4c beamline [47].
Rietveld refinements of both X-ray and neutron datasets were performed with the software GSAS [48]. X-ray PDF data were reduced using pdfgetX2 [49], correcting all scattering contributions except the coherent scattering from the sample (capillary, absorption, Compton, fluorescence, etc.). Modelling of PDF data was performed via PDFgui [50]. Size and strain estimation was carried out by using the Williamson–Hall approach [51], where crystal size D and lattice strain ε are derived according to the following equation:
β c o s θ = λ D + 4 ε s i n θ
where β is the integral breadth of the diffraction peak.

4. Conclusions

The average and local structure evolution of ceria specimens with different Yb loadings was investigated, coupling synchrotron and neutron diffraction. Up to µ = 0.250, long-range fluorite structure is maintained, even though evidence of static disorder is clear. C-type local ordering is suggested by the observation of further M–M distances in X-ray PDF, and longer O–O pairs by neutron. The extent of the C-type distortion is approximately 10 nm. This picture recalls the one already observed for many other dopants. However, by further increasing Yb doping, the C-type distortion is less pronounced. The C-type domains do not grow further, with the local scale distortion being more important than for other dopants. The size difference between Yb+3 and Ce+4 becomes so important that a mixed Ce–Yb C-type is destabilized, consistent with the long-range phase separation reported in the literature.

Author Contributions

Conceptualization: S.C., M.C. and M.S. Sample preparation: D.B. Investigation, D.B., M.B., S.C., M.C. and M.S. Data analysis: D.B., M.C., M.S. Writing—original draft: M.C. and M.S.; Writing—review & editing. M.B., S.C., M.C. and M.S.

Funding

This research received no external funding.

Acknowledgments

We acknowledge the ESRF (ID22) and the ILL (D20, D4c) for provision of beamtime, and Paolo Masala and Gabriel Cuello for support during data collections.

Conflicts of Interest

The authors declare no conflict of interest.

References

  1. Kilner, J.A. Defects and conductivity in ceria-based oxides. Chem. Lett. 2008, 37, 1012–1015. [Google Scholar] [CrossRef]
  2. Mogensen, M.; Sammes, N.M.; Tompsett, G.A. Physical, chemical and electrochemical properties of pure and doped ceria. Solid State Ionics 2000, 129, 63–94. [Google Scholar] [CrossRef]
  3. Coduri, M.; Checchia, S.; Longhi, M.; Ceresoli, D.; Scavini, M. Rare Earth Doped Ceria: The Complex Connection Between Structure and Properties. Front. Chem. 2018, 6, 526. [Google Scholar] [CrossRef]
  4. Malecka, M.A. Ceria-Based Mixed Oxides—Beautiful Structures. Chem. Select 2016, 1, 4246–4254. [Google Scholar] [CrossRef]
  5. Artini, C. Rare-Earth-Doped Ceria Systems and Their Performance as Solid Electrolytes: A Puzzling Tangle of Structural Issues at the Average and Local Scale. Inorg. Chem. 2018, 57, 13047–13062. [Google Scholar] [CrossRef] [Green Version]
  6. Horlait, D.; Claparede, L.; Clavier, N.; Szenknect, S.; Dacheux, N.; Ravaux, J.; Podor, R. Stability and Structural Evolution of CeIV1−xLnIIIxO2−x/2 Solid Solutions: A coupled µ-raman/XRD approach. Inorg. Chem. 2011, 50, 7150–7161. [Google Scholar] [CrossRef]
  7. Balazs, G.B.; Glass, R.S. ac impedance studies of rare earth oxide doped ceria. Solid State Ionics 1995, 76, 155–162. [Google Scholar] [CrossRef]
  8. Faber, J.; Geoffroy, C.; Roux, A.; Sylvestre, A.; Abelard, P. A Systematic Investigation of the dc Electrical Conductivity of Rare-Earth Doped Ceria. Appl. Phys. A 1989, 49, 225–232. [Google Scholar] [CrossRef]
  9. Andersson, D.A.; Simak, S.I.; Skorodumova, N.V.; Abrikosov, I.A.; Johansson, B. Optimization of ionic conductivity in doped ceria. Proc. Natl. Acad. Sci. USA 2006, 103, 3518–3521. [Google Scholar] [CrossRef] [Green Version]
  10. Yoshida, H.; Deguchi, H.; Miura, K.; Horiuchi, M.; Inagaki, T. Investigation of the relationship between the ionic conductivity and the local structures of singly and doubly doped ceria compounds using EXAFS measurement. Solid State Ionics 2001, 140, 191–199. [Google Scholar] [CrossRef]
  11. Nitani, H.; Nakagawa, T.; Yamanouchi, M.; Osuki, T.; Yuya, M.; Yamamoto, T.A. XAFS and XRD study of ceria doped with Pr, Nd or Sm. Mater. Lett. 2004, 58, 2076–2081. [Google Scholar] [CrossRef]
  12. Shirbhate, S.C.; Yadav, A.K.; Acharya, S.A. Extended x-ray absorption fine structure spectroscopy and x-ray absorption near edge spectroscopy study of aliovalent doped ceria to correlate local structural changes with oxygen vacancies clustering. Appl. Phys. Lett. 2016, 108, 143501. [Google Scholar] [CrossRef]
  13. Giannici, F.; Gregori, G.; Aliotta, C.; Longo, A.; Maier, J.; Martorana, A. Structure and oxide-ion conductivity: Local order, defect interactions and grain boundary effects in acceptor-doped ceria. Chem. Mater. 2014, 26, 5594–6006. [Google Scholar] [CrossRef]
  14. Hooper, J.; Ismail, A.; Giorgi, J.B.; Woo, T.K. Computational insights into the nature of increased ionic conductivity in concentrated samarium-doped ceria: A genetic algorithm study. Phys. Chem. Chem. Phys. 2010, 12, 12969–12972. [Google Scholar] [CrossRef]
  15. Deguchi, H.; Yoshida, H.; Inagaki, T.; Horiuchi, M. Study of doped ceria using multiple data set fit. Solid State Ionics 2005, 176, 1817–1825. [Google Scholar] [CrossRef]
  16. Coduri, M.; Scavini, M.; Brunelli, M.; Pedrazzin, E.; Masala, P. Structural characterization of Tb- and Pr-doped ceria. Solid State Ionics 2014, 268, 150–155. [Google Scholar] [CrossRef]
  17. Martinez-Arias, A.; Hungria, A.B.; Fernandez-Garcia, M.; Iglesias-Juez, A.; Conesa, J.C.; Mather, G.C.; Munuera, G. Cerium-terbium mixed oxides as potential materials for anodes in solid oxide fuel cells. J. Power Sources 2005, 151, 43–51. [Google Scholar] [CrossRef]
  18. Coduri, M.; Brunelli, M.; Scavini, M.; Allieta, M.; Masala, P.; Capogna, L.; Fischer, H.; Ferrero, C. Rare Earth doped ceria: A combined X-ray and neutron pair distribution function study. Z. Kristallogr. 2012, 227, 272–279. [Google Scholar] [CrossRef]
  19. Andrievskaya, E.R.; Kornienko, O.A.; Sameljuk, A.V.; Sayir, A. Phase relation studies in the CeO2–La2O3 system at 1100–1500 °C. J. Eur. Ceram. Soc. 2011, 31, 1277–1283. [Google Scholar] [CrossRef]
  20. Wilkes, M.F.; Hayden, P.; Bhattacharya, A.K. Catalytic studies on ceria lanthana solid solutions III. Surface segregation and solid state studies. J. Catal. 2003, 219, 305–309. [Google Scholar] [CrossRef]
  21. Mandal, B.P.; Grover, V.; Roy, M.; Tyagi, A.K. X-ray diffraction and raman spectroscopic investigation on the phase relations in Yb2O3- and Tm2O3-Substituted CeO2. J. Am. Ceram. Soc. 2007, 90, 2961–2965. [Google Scholar] [CrossRef]
  22. Coduri, M.; Scavini, M.; Pani, M.; Carnasciali, M.M.; Klein, H.; Artini, C. From nano to microcrystals: Effects of different synthetic pathways on the defect architecture in heavily Gd-doped ceria. Phys. Chem. Chem. Phys. 2017, 19, 11612–11630. [Google Scholar] [CrossRef]
  23. Coduri, M.; Scavini, M.; Allieta, M.; Brunelli, M.; Ferrero, C. Defect structure of Y-doped ceria on different length scales. Chem. Mater. 2013, 25, 4278–4289. [Google Scholar] [CrossRef]
  24. Scavini, M.; Coduri, M.; Allieta, M.; Masala, P.; Cappelli, S.; Oliva, C.; Brunelli, M.; Orsini, F.; Ferrero, C. Percolating hierarchical defect structures drive phase transformation in Ce1−xGdxO2−x/2: A total scattering study. IUCr J. 2015, 2, 511–522. [Google Scholar] [CrossRef]
  25. Coduri, M.; Masala, P.; Allieta, M.; Peral, I.; Brunelli, M.; Biffi, C.A.; Scavini, M. Phase Transformations in the CeO2–Sm2O3 System: A multiscale powder diffraction investigation. Inorg. Chem. 2018, 57, 879–891. [Google Scholar] [CrossRef]
  26. Artini, C.; Carnasciali, M.M.; Plaisier, J.R.; Costa, G.A.; Pani, M. A novel method for the evaluation of the Rare Earth (RE) coordination number in RE-doped ceria through Raman spectroscopy. Solid State Ionics 2017, 311, 90–97. [Google Scholar] [CrossRef]
  27. Ou, D.R.; Mori, T.; Ye, F.; Takahashi, M. Oxygen vacancy ordering in heavily rare-earth-doped ceria. Appl. Phys. Lett. 2006, 89, 171911. [Google Scholar] [CrossRef] [Green Version]
  28. Ou, D.R.; Mori, T.; Ye, F.; Zou, J.; Auchterlonie, G.; Drennan, J. Oxygen-vacancy ordering in lanthanide-doped ceria: Dopant type dependence and structure model. Phys. Rev. B 2008, 77, 240108. [Google Scholar] [CrossRef]
  29. Ye, F.; Mori, T.; Ou, D.R.; Zou, J.; Drennan, J. A structure model of nano-sized domain in Gd-doped ceria. Solid State Ionics 2009, 180, 1414–1420. [Google Scholar] [CrossRef]
  30. Grover, V.; Banerji, A.; Sengupta, P.; Tyagi, A.K. Raman, XRD and microscopic investigations on CeO2– Lu2O3 and CeO2–Sc2O3 systems: A sub-solidus phase evolution study. J. Solid State Chem. 2008, 181, 1930–1935. [Google Scholar] [CrossRef]
  31. Malecka, M.A.; Kepinski, L.; Maczka, M. Structure and phase composition of nanocrystalline Ce1−xLuxO2−y. J. Solid State Chem. 2008, 18, 2306–2312. [Google Scholar] [CrossRef]
  32. Artini, C.; Pani, M.; Carnasciali, M.M.; Plaisier, J.R.; Costa, G.A. Lu-, Sm-, and Gd-doped Ceria: A comparative approach to their structural properties. Inorg. Chem. 2016, 55, 10567–10579. [Google Scholar] [CrossRef]
  33. Neutron News. 1992. Available online: https://www.ncnr.nist.gov/resources/n-lengths/ (accessed on 6 June 2016).
  34. Argyriou, D.N. Measurement of the static disorder contribution to the temperature factor in cubic stabilized ZrO2. J. Appl. Crystallogr. 1994, 27, 155–158. [Google Scholar] [CrossRef]
  35. Coduri, M.; Scavini, M.; Allieta, M.; Brunelli, M.; Ferrero, C. Local disorder in yttrium doped ceria (Ce1−xYxO2−x/2) probed by joint X-ray and Neutron Powder Diffraction. J. Phys. Conf. Ser. 2012, 340, 012056. [Google Scholar] [CrossRef]
  36. Ohashi, T.; Yamazaki, S.; Tokunaga, T.; Arita, Y.; Matsui, T.; Harami, T.; Kobayashi, K. EXAFS study of Ce1−xGdxO2−x/2. Solid State Ionics 1998, 113–115, 559–564. [Google Scholar] [CrossRef]
  37. Neder, N.B.; Frey, F.; Schulz, H. Defect structure of Zirconia (Zr0.85Ca0.15O1.85) at 290 K and 1550 K. Acta Cryst. 1990, 46, 799–809. [Google Scholar] [CrossRef]
  38. Allieta, M.; Brunelli, M.; Coduri, M.; Scavini, M.; Ferrero, C. Differential Pair Distribution Function applied to Ce1−xGdxO2−x/2 system. Z. Krist. Proc. 2011, 1, 15–20. [Google Scholar] [CrossRef]
  39. Scavini, M.; Coduri, M.; Allieta, M.; Brunelli, M.; Ferrero, C. Probing complex disorder in Ce1−xGdxO2−x/2 using the pair distribution function analysis. Chem. Mater. 2012, 24, 1338–1345. [Google Scholar] [CrossRef]
  40. Sardar, K.; Playford, H.Y.; Darton, R.J.; Barney, E.R.; Hannon, A.C.; Tompsett, D.; Fisher, J.; Kashtiban, R.J.; Sloan, J.; Ramos, S.; et al. Nanocrystalline cerium-bismuth oxides: Synthesis, structural characterization, and redox properties. Chem. Mater. 2010, 22, 6191–6201. [Google Scholar] [CrossRef]
  41. Gateshki, M.; Niederberger, M.; Deshpande, A.S.; Ren, Y.; and Petkov, V. Atomic-scale structure of nanocrystalline CeO2–ZrO2 oxides by total x-ray diffraction and pair distribution function analysis. J. Phys. Condens. Matter. 2007, 19, 156205. [Google Scholar] [CrossRef]
  42. Coduri, M.; Scavini, M.; Brunelli, M.; Masala, P. In situ pair distribution function study on lanthanum doped ceria. Phys. Chem. Chem. Phys. 2013, 15, 8495–8505. [Google Scholar] [CrossRef]
  43. Kraynis, O.; Timoshenko, J.; Huang, J.; Singh, H.; Wachtel, E.; Frenkel, A.I.; Lubomirsky, I. Modeling Strain Distribution at the Atomic Level in Doped Ceria Films with Extended X-ray Absorption Fine Structure Specroscopy. Inorg. Chem. 2019, 58, 7527–7536. [Google Scholar] [CrossRef]
  44. Checchia, S.; Scavini, M.; Allieta, M.; Brunelli, M.; Ferrero, C.; Coduri, M. Size and spatial correlation of defective domains in yttrium doped CeO2. Powder Diffr. 2015, 30, S119–S126. [Google Scholar] [CrossRef]
  45. Oliva, C.; Orsini, F.; Cappelli, S.; Arosio, P.; Allieta, M.; Coduri, M.; Scavini, M. Electron Spin Resonance and Atomic Force Microscopy Study on Gadolinium Doped Ceria. J. Spectrosc. 2015, 2015, 491840. [Google Scholar] [CrossRef]
  46. Scavini, M.; Brunelli, M.; Cazzaniga, M.; Checchia, S.; Coduri, M.; Cuello, G.J.; Ferrero, C.; Giannuzzi, M. Neutron Diffraction Study of Local and Mesoscopic Disorder Induced by La and Yb Double Doping in Ce1−x−yLaxYbyO2−(x+y)/2, Using PDF Analysis; Institute Laue Langevin (ILL): Grenoble, France, 2015. [Google Scholar]
  47. Fischer, H.E.; Cuello, G.J.; Palleau, P.; Feltin, D.; Barnes, A.C.; Badyal, Y.S.; Simonson, J.M. D4c: A very high precision diffractometer for disordered materials. Appl. Phys. A 2002, 74, S160–S162. [Google Scholar] [CrossRef]
  48. Larson, A.C.; Von Dreele, R.B. General Structural Analysis System (GSAS); Los Alamos National Laboratory: Santa Fe, NM, USA, 2004; pp. 86–748. [Google Scholar]
  49. Qiu, X.; Thompson, J.W.; Billinge, S.L.J. PDFgetX2: A GUI driven program to obtain the pair distribution function from X-ray powder diffraction data. J. Appl. Crystallogr. 2004, 37, 678. [Google Scholar] [CrossRef]
  50. Farrow, C.L.; Juhás, P.; Liu, J.W.; Bryndin, D.; Božin, E.S.; Bloch, J.; Proffen, T.; Billinge, S.J.L. PDFfit2 and PDFgui: Computer programs for studying nanostructure in crystals. J. Phys. Condens. Matter. 2007, 19, 335219. [Google Scholar] [CrossRef]
  51. Williamson, G.K.; Hall, W.H. X-ray line broadening from filed aluminium and wolfram. Acta Metall. 1953, 1, 22–31. [Google Scholar] [CrossRef]
Figure 1. (a) Experimental synchrotron XRPD patterns as a function of Yb loading shifted along y-axis. Squares highlight angular region described in following panels. (b) Evidence for appearance of superstructure peaks (411), (332), and (413) by increasing Yb doping. (c) Example of (311) and (222) reflections (in fluorite setting).
Inorganics 07 00102 g001
Figure 2. Williamson–Hall plots for different compositions. The inset reports the evolution of the lattice strain with the Yb concentration.
Inorganics 07 00102 g002
Figure 3. Msds computed from Rietveld refinements of temperature resolved NPD patterns for (a) cation and (b) oxygen sites.
Inorganics 07 00102 g003
Figure 4. (a) Neutron and (b) X-ray experimental Pair Distribution Function (PDF) curves at 90 K. The dashed line in panel (a) is a guide to the eye for a second O–O pair; the one in panel (b) stands for a second M–M pair.
Inorganics 07 00102 g004
Figure 5. PDF refinements against neutron data of specimens Yb125 (top panels) and Y250 (bottom panels) by using a simple fluorite model (left panels) and a modified model accounting for relaxations (right panels). Empty circles: Experimental data; red solid line: Calculated; blue solid line: Difference curve.
Inorganics 07 00102 g005
Figure 6. Modelling of X-ray PDF data on three compositions using long-range (panels a, c, and e) and two-phase model (panels b, d, and f). Empty circles: Experimental data; red solid line: Calculated; blue solid line: Difference curve.
Inorganics 07 00102 g006aInorganics 07 00102 g006b
Figure 7. x(M2) from box-car refinements performed on X-ray PDF.
Inorganics 07 00102 g007
Table 1. Structural parameters returned by Rietveld refinements and Williamson–Hall analysis of synchrotron data at 90 K. Msd parameters are in Å2 units.
μ (≤ 0.250)00.1250.250
space groupFm-3mFm-3mFm-3m
a/Å5.40475(3)5.39803(3)5.38427(5)
msd(M)/Å20.00135(3)0.0043(7)0.0083(3)
msd(O)/Å20.00368(1)0.0067(8)0.0113(8)
msd mean/Å20.00138(9)0.00442(1)0.00836(0)
R(F2)0.02420.01730.0301
RP0.05530.02880.0264
ε/Δd/d0.000062(8)0.00041(2)0.00129(5)
DV/nm247(10)92(4)123(15)
μ(>0.250)0.3750.5001
space groupIa-3Ia-3Ia-3
a/Å10.73049(1)10.68752(0)10.42843(7)
x(M2)−0.0037(9)−0.0125(4)−0.03241(2)
x(O1)0.37729(4)0.37729(4)0.3910(3)
y(O1)0.14326(6)0.14326(6)0.1523(3)
z(O1)0.37775(3)0.37775(3)0.3809(3)
x(O2)0.37230(2)0.37230(2)-
msd11(M1)0.014(7)0.024(1)0.00190(6)
msd12(M1)0.000(5)0.010(9)-
msd11(M2)0.004(2)0.008(4)0.00150(4)
msd22(M2)0.017(4)0.004(4)≡msd11(M2)
msd33(M2)0.017(9)0.026(3)≡msd11(M2)
msd23(M2)−0.004(2)−0.006(4)-
msd(O1/O2)0.006(1)0.014(7)0.0023(5)
Uave0.0134(6)0.0148(1)0.00160(2)
R(F2)0.03920.03230.0147
RP0.02420.02920.0392
ε/Δd/d0.00202(7)0.0031(2)-
DV/nm67(7)77(17)-
Table 2. Selected interatomic distances from neutron and X-ray, computed by direct analysis of PDF curves.
μNeutronX-ray
M–O Distance (Å)O–O1 Distance (Å)O–O2 Distance (Å)O–O Relative IntensityM–M1 Distance (Å)M–M2 Distance (Å)M–M Relative Intensity
02.3412.702--3.826--
0.1252.3232.6972.8750.0983.8074.1220.047
0.2502.3062.6832.8700.2313.7834.0810.141
0.3752.2962.6872.8650.2723.7284.1010.171
0.5002.2842.6692.8640.3783.6754.0900.290
12.233-2.851-3.4723.9360.493
Table 3. Results of the refinements of neutron PDF curves.
ModelYb125Yb250
FluoriteClusterFluoriteCluster
a10.766(5)10.770(5)10.724(6)10.747(7)
msd(M)0.0064(7)0.0060(8)0.0105(10)0.0073(10)
msd(O)0.0056(7)0.0056(8)0.0142(14)0.0136(15)
O shift/Å00.17800.185
Rw0.0910.0690.1770.103

