Article

Gd3Li3Te2O12:U6+,Eu3+: A Tunable Red Emitting Garnet Showing Efficient U6+ to Eu3+ Energy Transfer at Room Temperature

Department of Chemical Engineering, Münster University of Applied Sciences, Stegerwaldstrasse 39, D-48565 Steinfurt, Germany
*
Authors to whom correspondence should be addressed.
Inorganics 2018, 6(3), 84; https://doi.org/10.3390/inorganics6030084
Submission received: 30 July 2018 / Revised: 20 August 2018 / Accepted: 21 August 2018 / Published: 23 August 2018
(This article belongs to the Special Issue Mixed Metal Oxides)

Abstract

:
Since the invention of fluorescent light sources, there is strong interest in Eu3+ activated phosphors as they are able to provide a high color rendering index (CRI) and luminous efficacy, which will also hold for phosphor converted light emitting diodes. Due to an efficient U6+ to Eu3+ energy transfer in Gd3Li3Te2O12:U6+,Eu3+, this inorganic composition shows red photoluminescence peaking at 611 nm. That means Eu3+ photoluminescence can be nicely sensitized via excitation into the U6+ excitation bands. Therefore, photoluminescence properties, such as temperature dependent emission and emission lifetime measurements, are presented. Charge transfer bands were investigated in detail. Additionally, density functional theory calculations reveal the band structure of the pure, i.e., non-doped host material. Obtained theoretical results were evaluated experimentally by the aid of diffuse UV reflectance spectroscopy.

Graphical Abstract

1. Introduction

In gas discharge light sources, Eu3+ activated phosphors (e.g., Y2O3:Eu3+, (Y,Gd)BO3:Eu3+, and Y(V,P)O4:Eu3+) are widely applied to generate the red fraction of the white lamp spectrum [1,2]. Due to insufficient absorption in the blue spectral range, these phosphors are not applicable in combination with a blue emitting (In,Ga)N light emitting dioded (LED) [3,4,5]. Yet, line emitting Eu3+ activated phosphors possess promising properties such as high luminous efficacy, long-term stability, and they are capable of providing a high color-rendering index [6,7]. To improve the absorption cross-section, sensitizers like Bi3+ and Tb3+ are often used [6,8,9]. Additionally, Blasse and Krol reported about an energy transfer from U6+ to Eu3+ in several compounds. However, this energy transfer only occurs in most compounds at rather low temperatures [10,11]. To further investigate the energy transfer from U6+ to Eu3+, we examined the luminescence properties of Gd3Li3Te2O12:U6+,Eu3+. The luminescence properties of Gd3Li3Te2O12:U6+, as well as Gd3Li3Te2O12:Eu3+, were already described a few decades ago, but a co-doped sample has not been investigated so far [12,13]. The yttrium analogue is also well known when doped with U6+ and Eu3+, respectively [14,15]. The excitation band of the uranate group in the Y3+ garnet is located at 325 nm and thus superimposes with the 7F05HJ transitions of Eu3+ [14]. In case of the Gd3+ garnet, the excitation band is located at 340 nm, which allows one to solely excite the uranate group. This allows for a precise investigation of the energy transfer. Thereby, we strive for a deeper insight into the U6+ to Eu3+ energy transfer. Furthermore, we discuss the usefulness of U6+ as a sensitizer in the UV-A range for Eu3+ activated red-emitting phosphors.
The authors are aware that uranium is a radioactive and toxic element, so commercial use should not be a priority. Depleted uranium, which consists mainly of U238 isotopes, shows an alpha decay for the most part. With LED encapsulation, the alpha particles would not be emitted into the atmosphere, but are captured by the encapsulation. Consequently, the radiation exposure will be almost zero. Depleted uranium, however, is used as a ballast in space technology. No radiological and chemical toxicities were detected there [16]. Recent calculations demonstrated that the theoretically used amounts of uranium in LEDs would not even exceed the limits of German laws for 10 L of drinking water. Therefore, from our point of view, it is reasonable to investigate U6+ as a sensitizer for Eu3+ phosphors [17].

2. Method of Calculation and Electronic Properties

The Cambridge Serial Total Energy Package (CASTEP) Module of Materials Studio 8.0 (Devoloped by Accelrys) was applied to execute DFT calculations. A non-local sX-LDA functional (local density approximation, abbrv. LDA, with exchange contribution replaced by screeened exchange, abbrv. sX) was applied to the Gd3Li3Te2O12 host structure [18,19,20]. The entire calculation process used a plane-wave basis, linear response functions, norm-conserving pseudo potentials, Pulay density mixing schemes, and fine interpolation methods. If density mixing was not applicable, all bands/ensemble density functional theory (EDFT) was used. For a description of the interaction between the ionic cores and the valence electrons, the norm-conserving pseudopotentials were applied. The following electronic configurations were set in the calculations: Gd: [Xe] 4f75d16s2; Te: [Kr] 4d105s25p4; Li: [He]2s1; O: [He] 2s22p4. The Monkhorst-Pack k-points were set to 10 × 10 × 10. The calculations were performed for a cubic cell. The energy convergence parameter was 5 × 10⁻⁶.
The obtained band structure of Gd3Te2Li3O12 is depicted in Figure 1. The following direct band gap was derived from the calculations and determined to be ≈5 eV. This allowed us to classify this compound as a wide band-gap dielectric. Commonly, the usual LDA method underestimates the real band gap. The mean variation goes up to 40% [20,21]. More accurate band gap values are more likely to be expected with the sX-LDA approach. Therefore, we have selected the sX-LDA method for the calculations. An approach using UV reflectance spectroscopy described by Jüstel et al. to derive the optical band gap (Figure 2) served for a Kubelka-Muk transformed Tauc absorption spectrum. These experimental results were compared with the theoretical values [22,23,24,25].
As demonstrated by the absorption spectrum (inset of Figure 2), the optical band gap amounts to ≈5 eV, which is in good accordance with the calculated value obtained from the sX-LDA method. The sX-LDA calculated density of states (DOS) diagrams are depicted in Figure 3. The conduction band mainly consisted of the Te 5s and 5p, as well as the Li 2s states. The valence band (VB) had a width of ≈7 eV and exhibited several narrow sub-bands. The VB was dominated by O 2p states. In addition, the Gd 4f states showed a noteworthy contribution to the VB. In between, the Te 4p states had a major influence on the VB at around ≈6 eV. The wide band gap of the host, taken together with the experimental excitation spectra of U6+ in Gd3Te2Li3O12, allowed for the conclusion that the energy levels of the U6+ ion were located in the band gap.

3. Results and Discussion

The recorded XRD patterns as depicted in Figure 4 indicate the formation of cubic Gd3Li3Te2O12 and Eu3Li3Te2O12 in the space group Ia 3 ¯ d [15,26]. As in a typical garnet structure, Li atoms occupied the tetrahedral sites, and Te and Gd atoms were coordinated in octahedral and square antiprism geometry, respectively. Due to the coinciding ionic radii of Gd3+ (105 pm) and Eu3+ (106 pm) in eightfold coordination, no changes in the structure could be observed upon substituting Gd3+ with Eu3+ [27]. The refined cell parameters of Gd3Li3Te2O12 with 1% U6+ were a = 1.2386 nm and V = 1.9003 nm3, and for Eu3Li3Te2O12 with 1% U6+, a = 1.2423 nm and V = 1.9176 nm3, which nicely fit with literature data published before [26]. The intermediate samples with different Eu3+ content showed a linear behavior of the cell parameters. The critical U6+ concentration amounted to 1 mol % for the [TeO6]6− site [14].
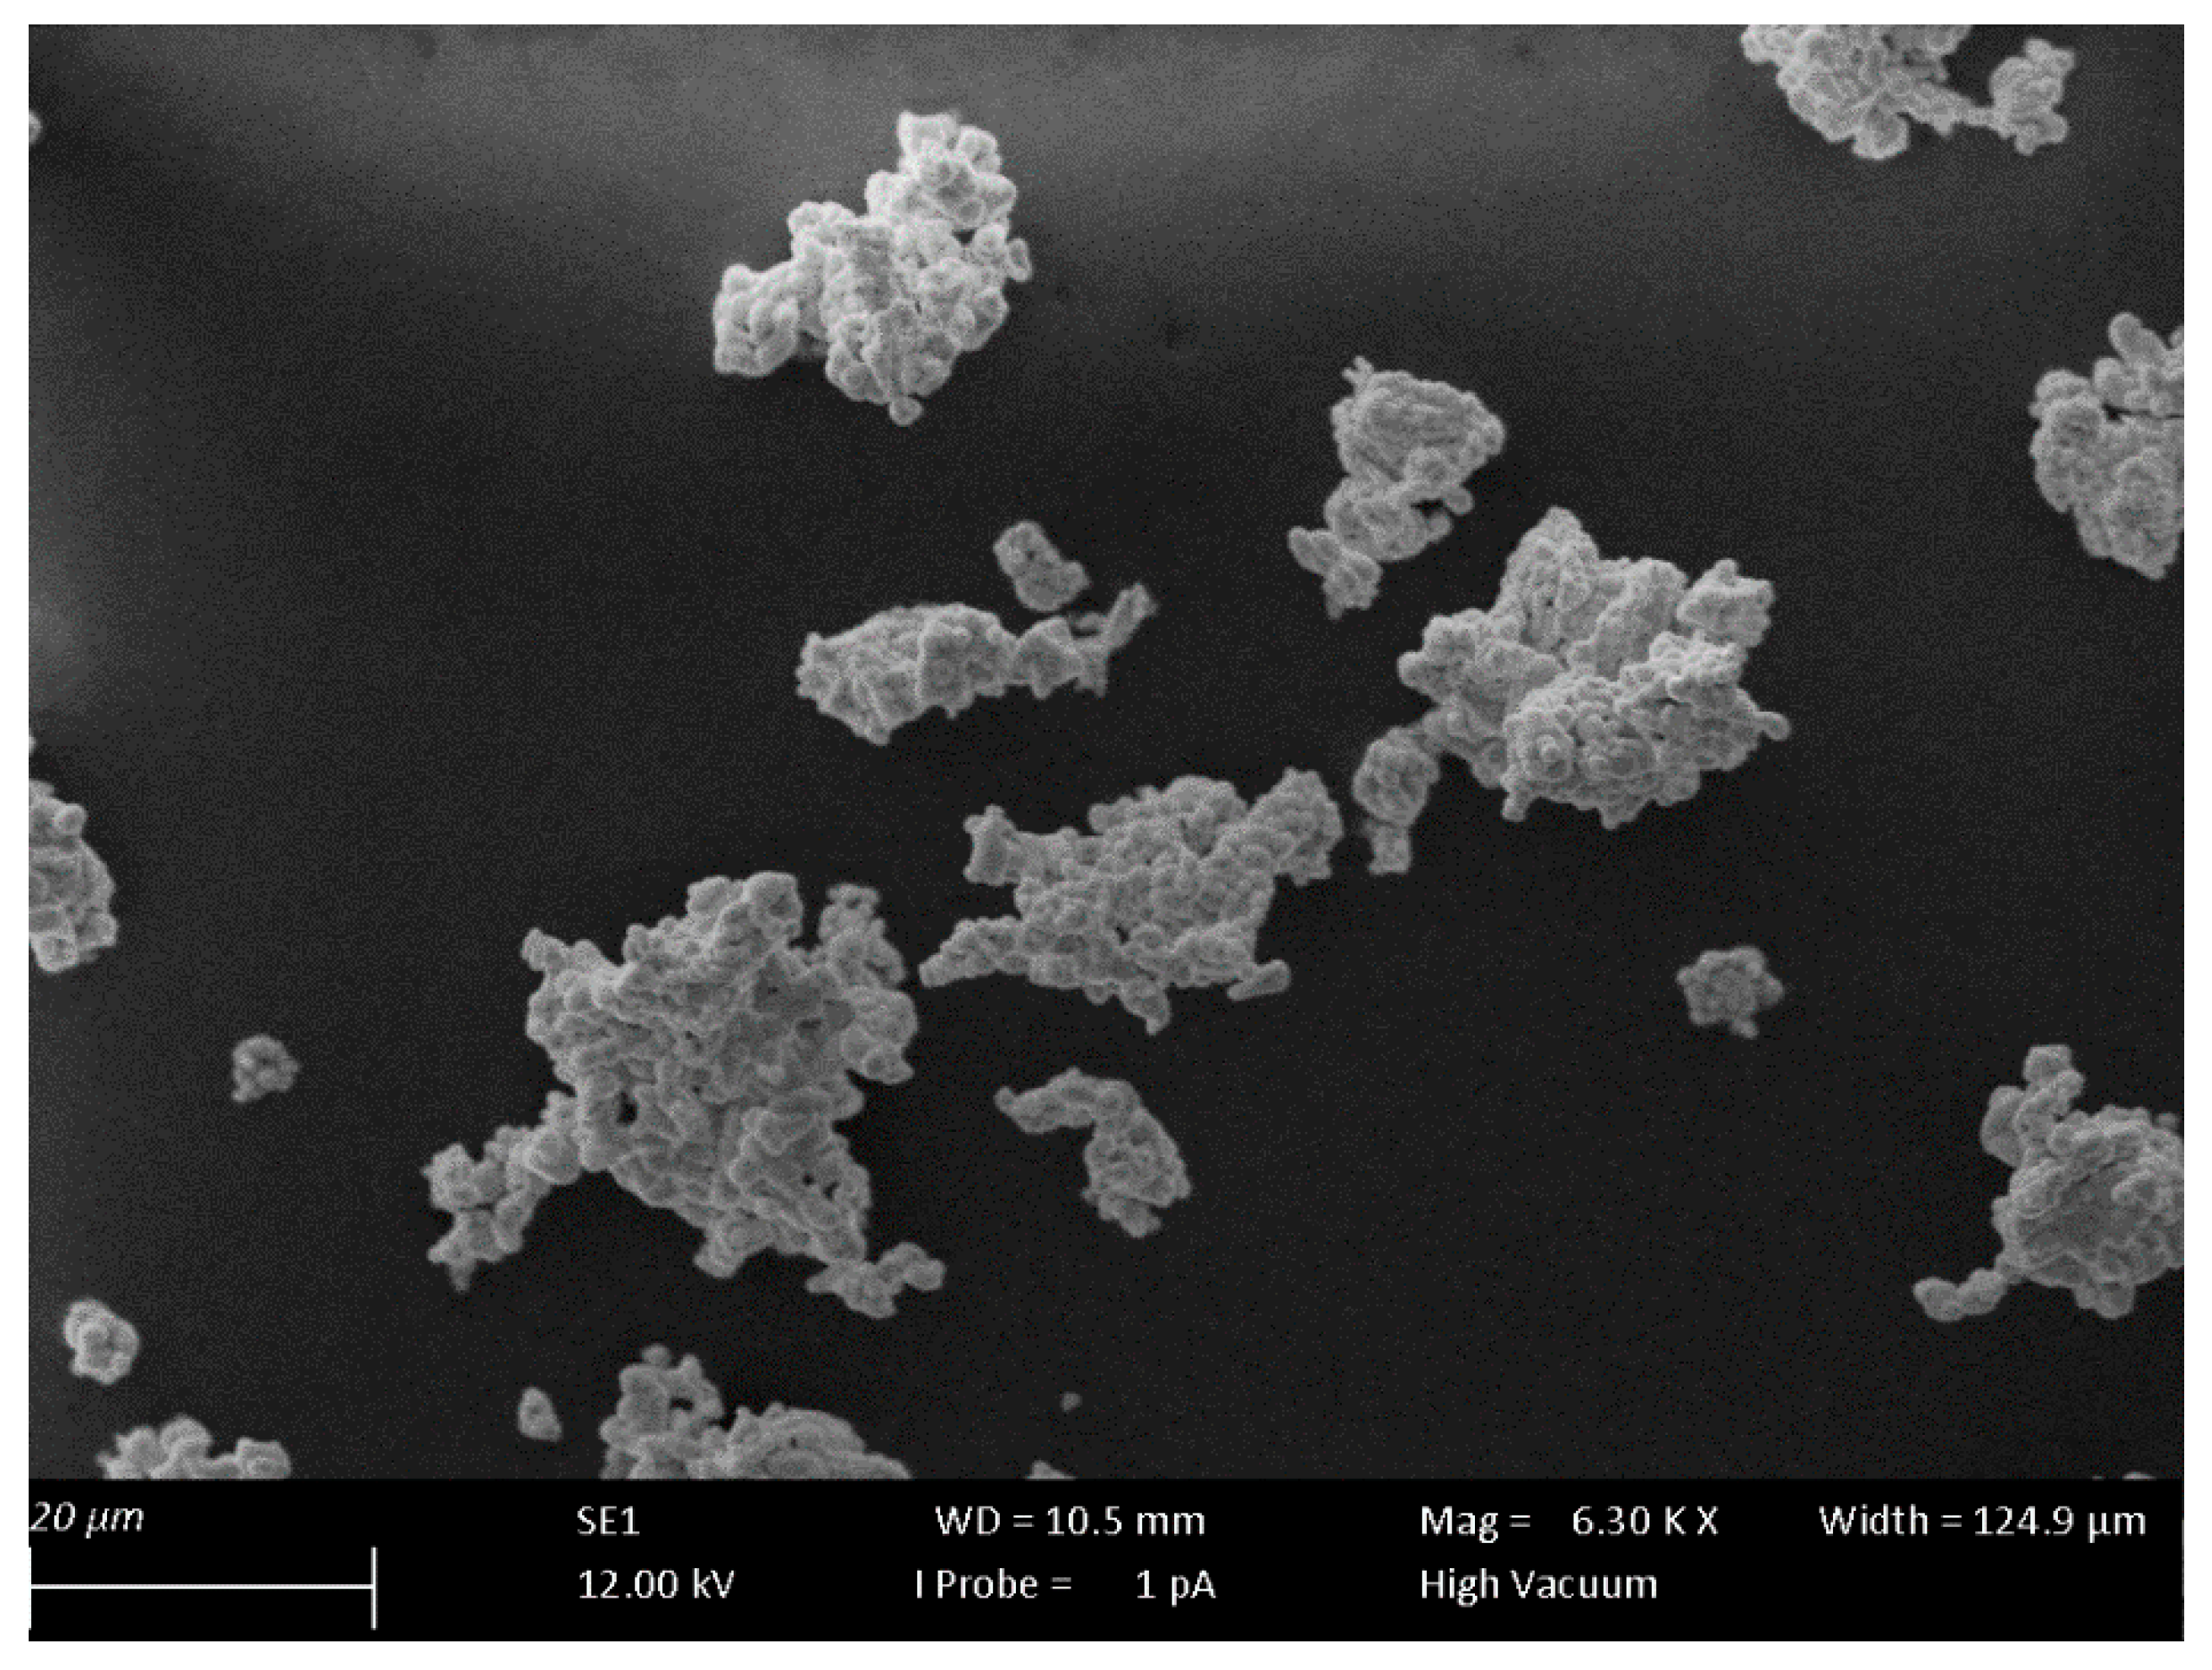
SEM micrographs of the sample (Gd0.8Eu0.2)3Li3(Te0.99U0.01)2O12, as shown in Figure 5, reveal a particle size of ≈1 μm, which form bigger agglomerates with a diameter of ≈20 μm. Samples doped with U6+ had a beige body color under natural light, indicating an absorption in the blue spectral range. Samples in the absence of U6+ exhibited a white body color.
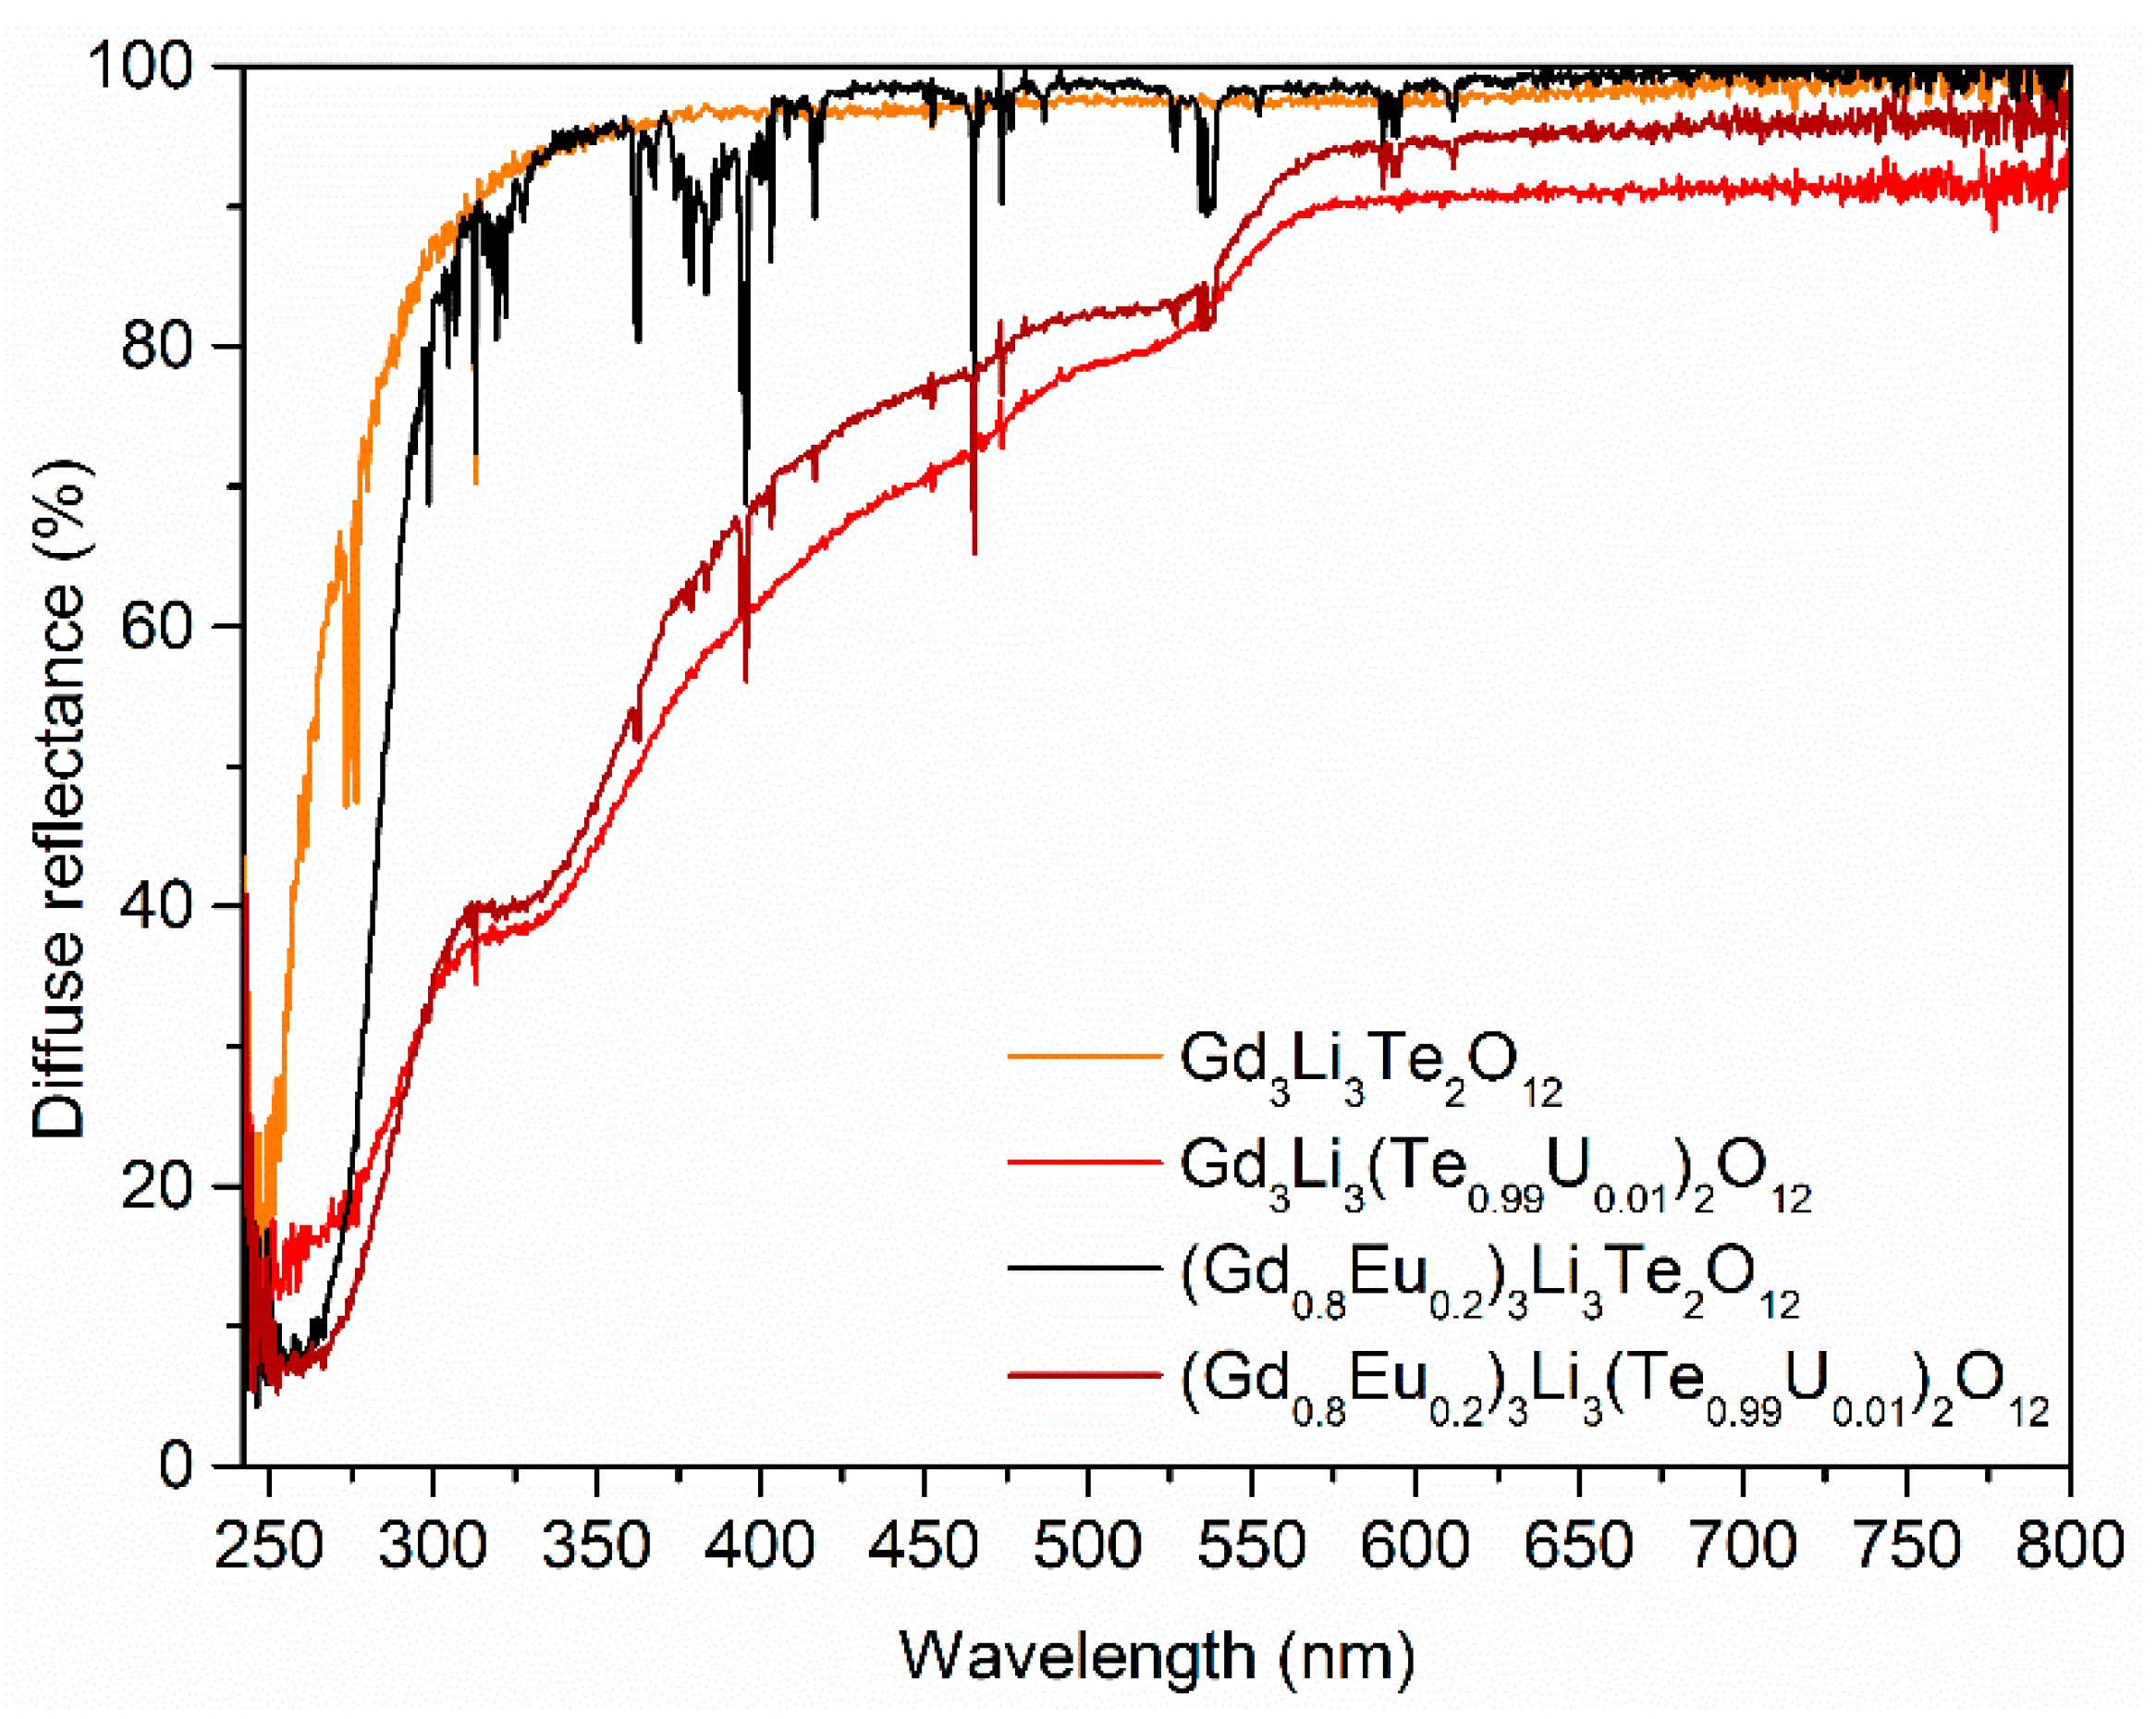
The body color could be derived from the reflectance spectra in Figure 6. Gd3Li3Te2O12 showed one strong absorption band at 250 nm. This could be assigned to the O2− to Te6+ charge transfer (CT) in the [TeO6]6− octahedron [13,28]. In addition, at 276 and 313 nm, Gd3+ transitions from the ground state 8S7/2 to the 6IJ and 6PJ levels were observed. Incorporation of Eu3+ created an additional band at 260 nm representing the CT from O2− to Eu3+. The typical 4f → 4f transitions of Eu3+ were also correspondingly present. U6+ doped samples exhibited several absorption bands in the UV and blue–green spectral range. The precise assignment turned out to be difficult. Bands located in the UV range could tentatively be assigned to parity-allowed CT transitions involving the 6d level of U6+, whereas parity-forbidden transitions involving the 5f level generated the absorption bands in the visible region [14,29].
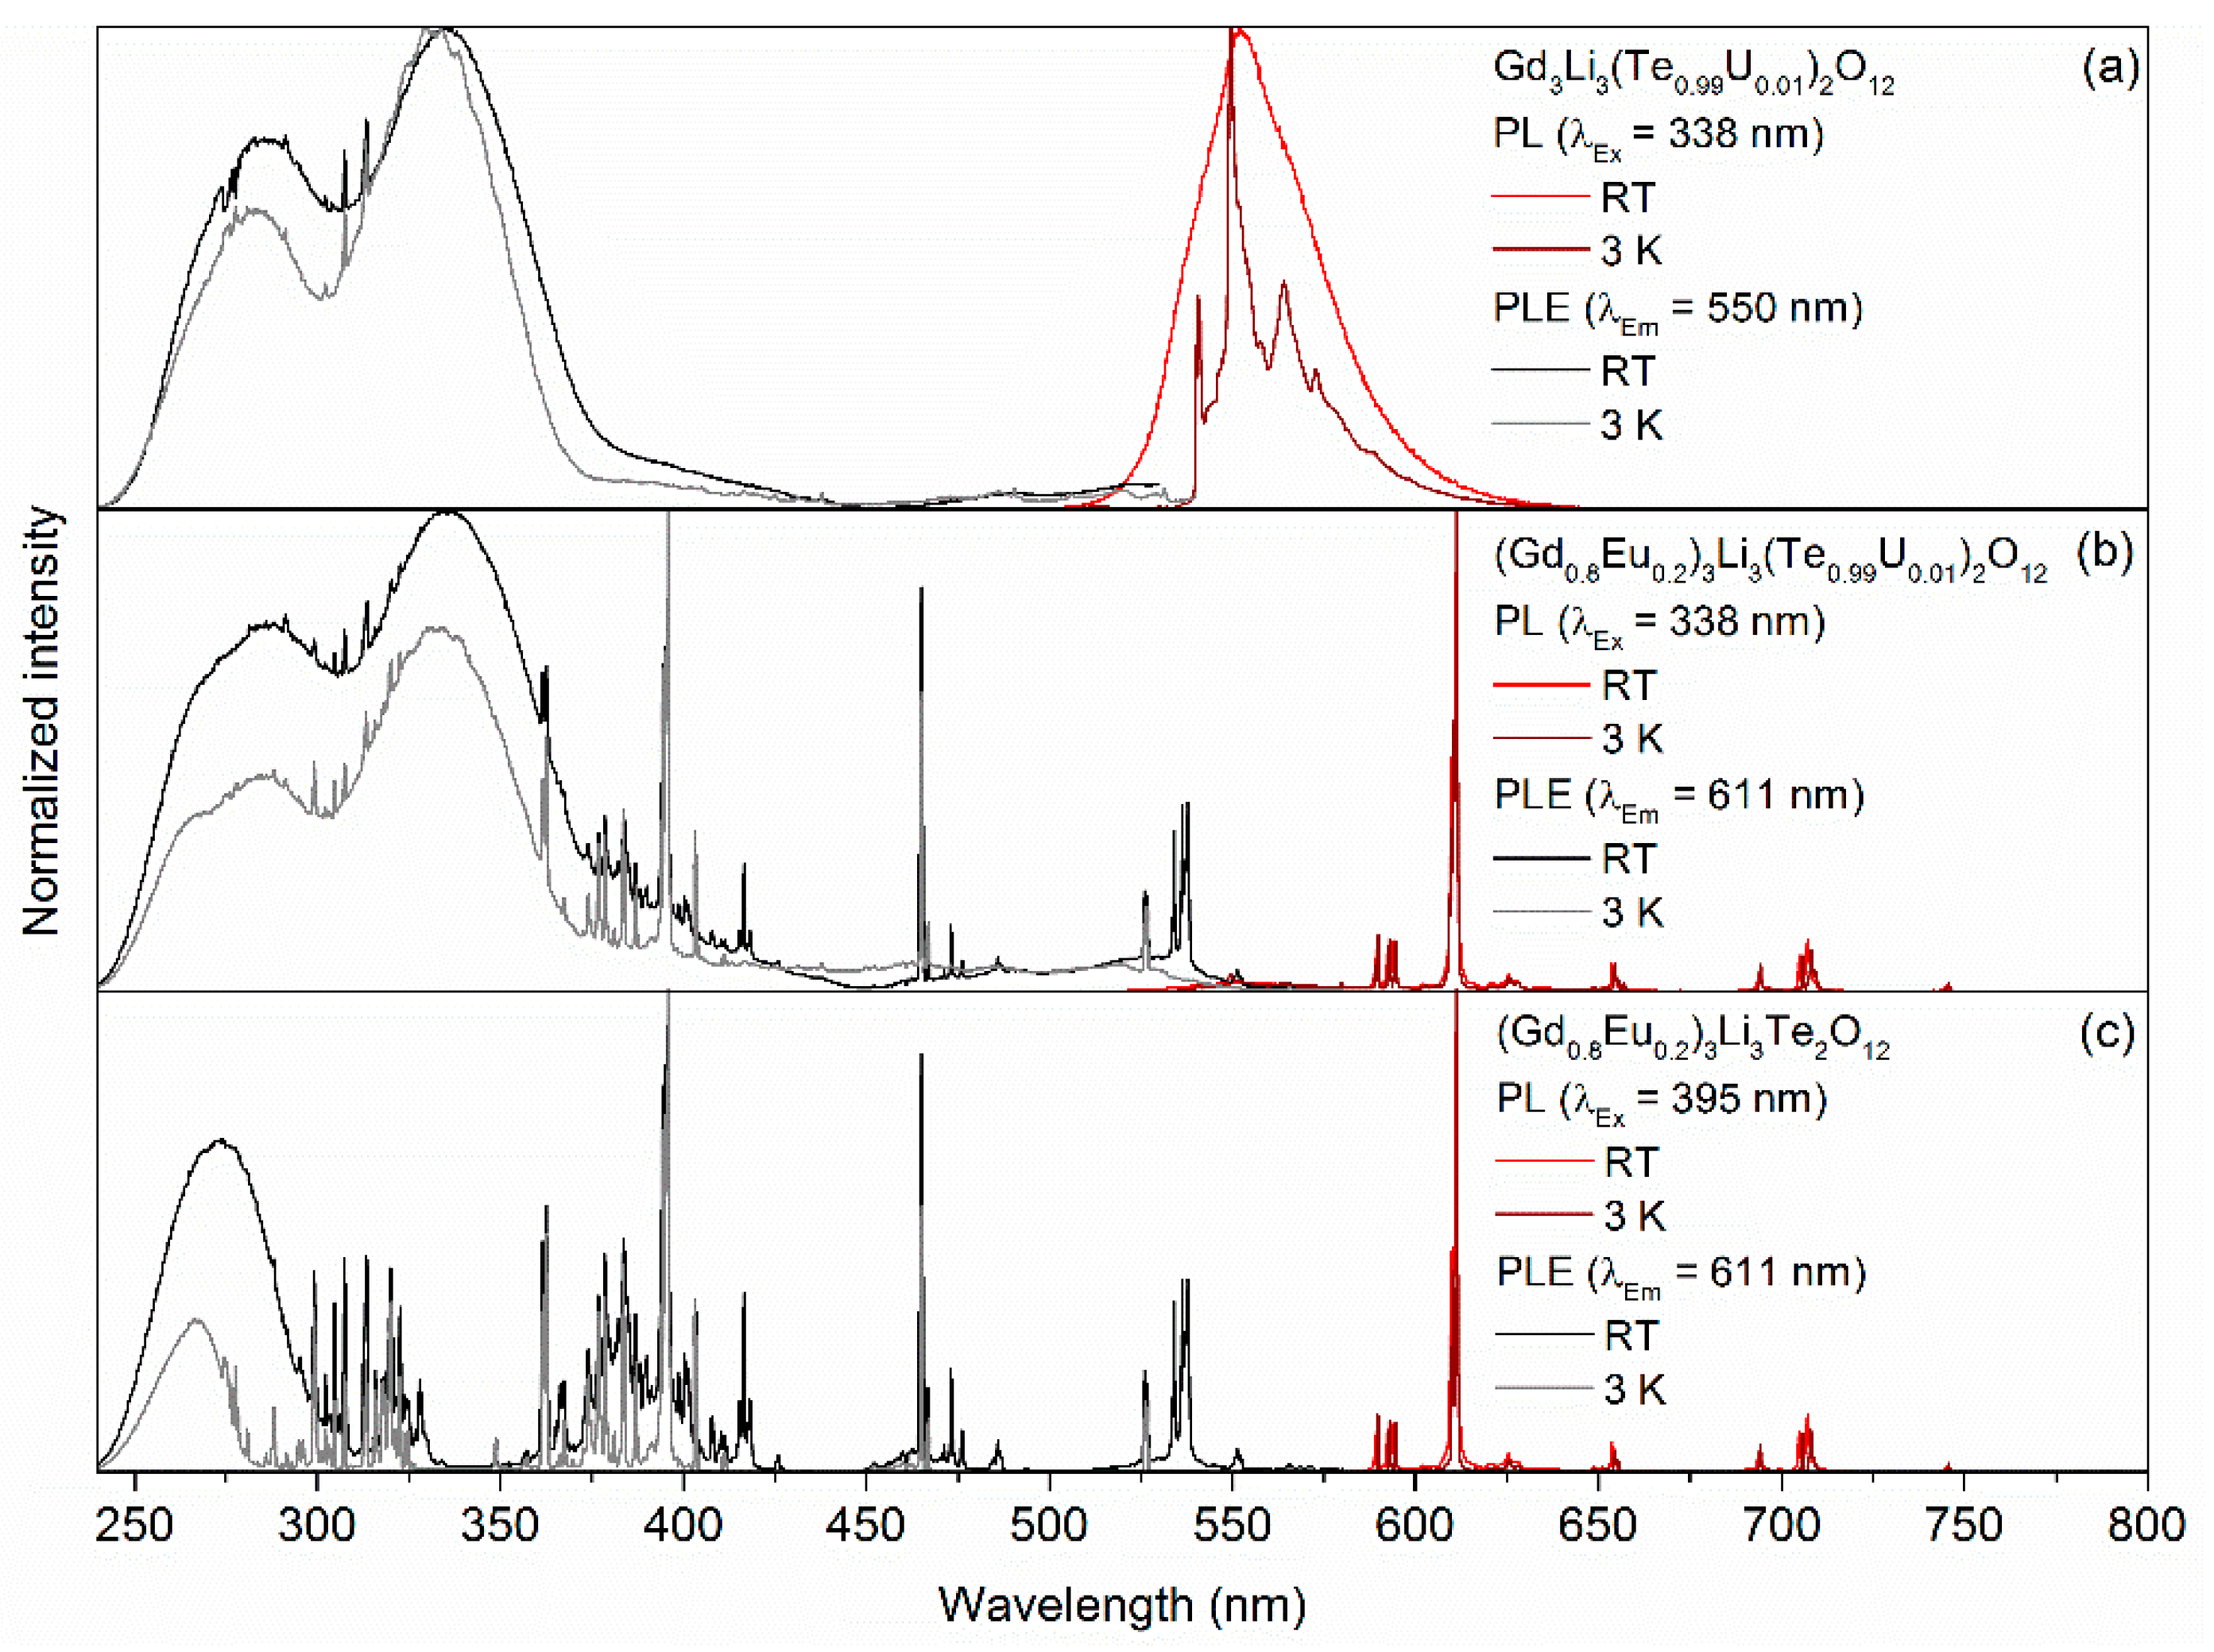
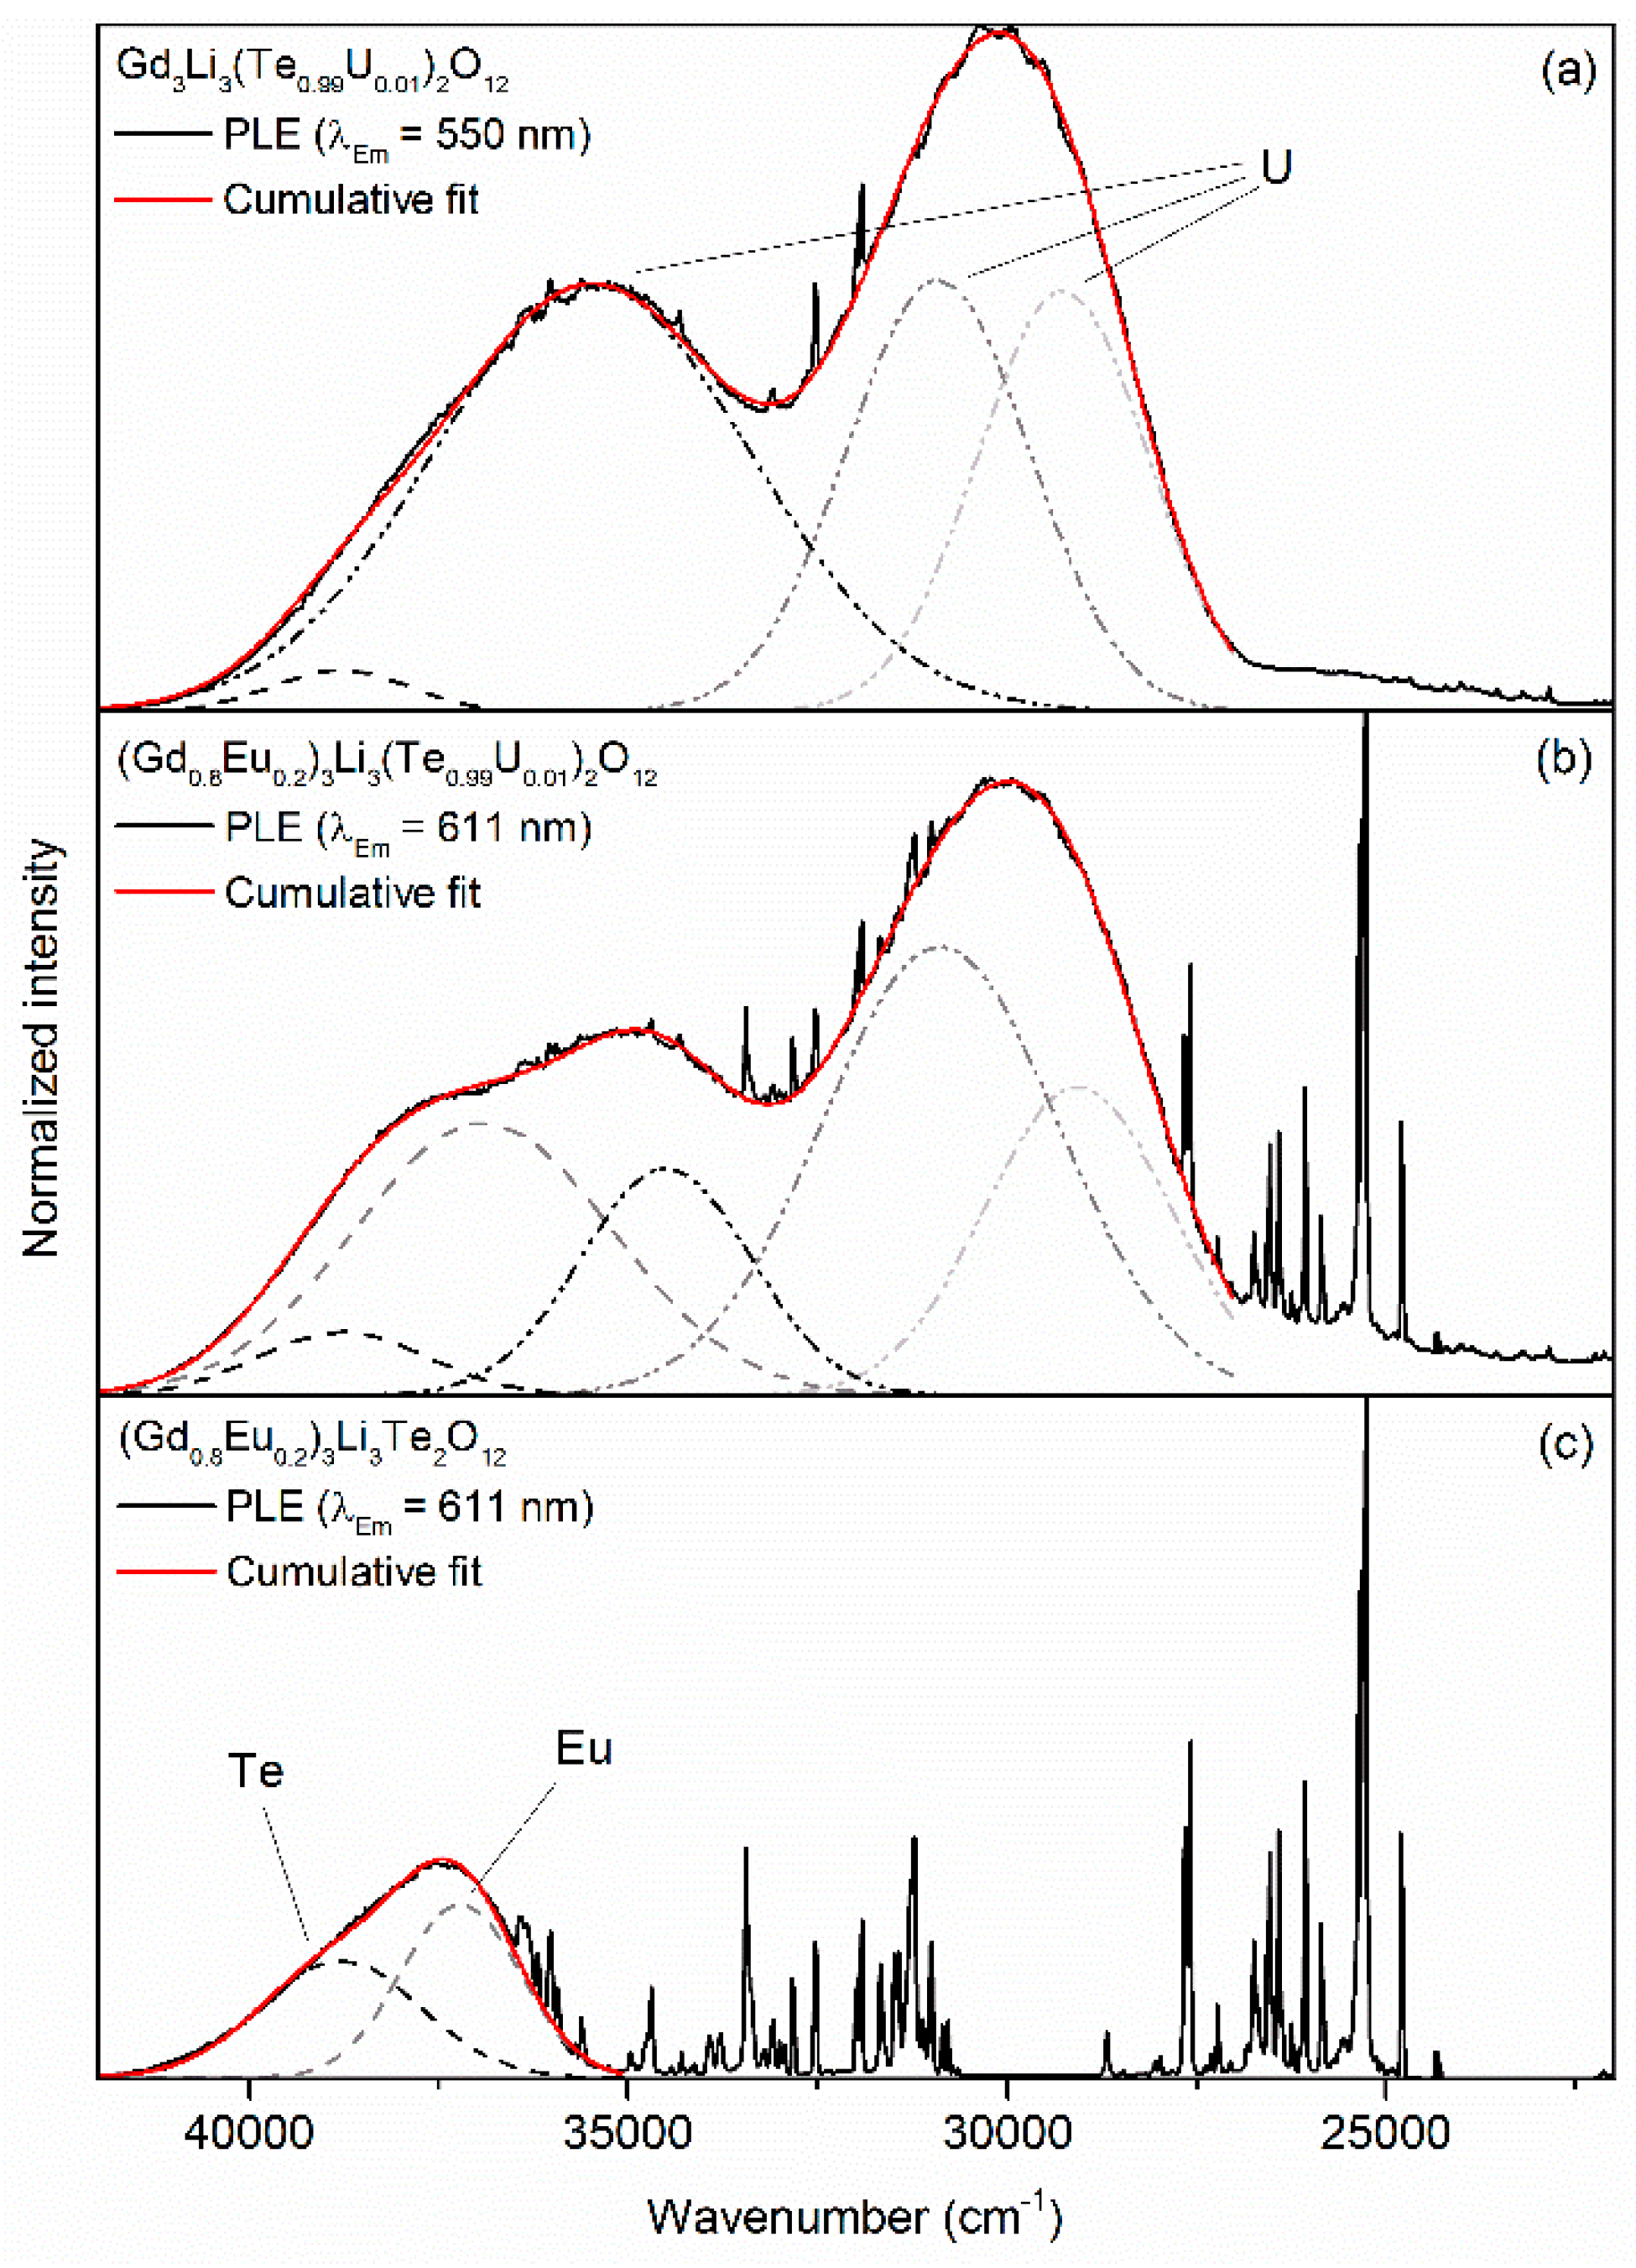
The excitation and emission spectra of the single and co-doped samples are plotted in Figure 7. Gd3Li3(Te0.99U0.01)2O12 showed parity-forbidden U6+ emission in the octahedral coordination, peaking at 550 nm. At 3 K, a fine structure of the emission could be observed, revealing a zero-phonon line at 18,498 cm−1 with a high intensity due to the low site symmetry of the Te6+ site (S6). Additionally, vibronic modes coupled with the CT transition could be identified. It was possible to assign some internal vibrational modes in the [UO6]6− octahedron. Other than with the UO22+ emission, the coupling took place with more than one mode [14]. In addition, the ungerade vibrational modes dominated the coupling mechanism [30]. For ν6 (T2u), ν4 (T1u), and ν3 (T1u), we found energy values of 196, 299, and 576 cm−1, respectively. The basic nature of the U6+ emission process is still not known. However, it was assumed that a charge-transfer transition between the O 2p and U 5f states led to the green emission [31]. In addition, coupling with ungerade vibrational modes indicated a parity-forbidden transition [32]. The emission spectra of the co-doped sample, as well as the Eu3+ doped sample, was dominated by the 5D07F2 transition resulting from a low symmetry of the Gd3+ site (D2). The excitation spectrum of the co-doped sample was evidence for the U6+ to Eu3+ energy transfer. While monitoring the 5D07F2 transition of Eu3+, the parity-allowed CTs of U6+ were observed. In addition, the Gd3+ to U6+ energy transfer, as described earlier by Smit and Blasse, was present [12]. Additionally, two excitation bands in the visible spectral range around 400 and 470 nm with rather low intensity could be observed, which match well with the diffuse reflectance spectra. In order to reveal the energetic positions of the CT bands, excitation spectra at 3 K were disentangled with the aid of Gaussian peak fitting. Figure 8a demonstrates that U6+ could be excited via three different U6+ CT bands, peaking at 30,821, 29,303, and 35,435 cm−1, as well as via the Te6+ CT band at 38,846 cm−1. The Eu3+ emission could be excited through the Te6+ CT band and the Eu3+ CT band located at 37,202 cm−1. The co-doped sample contained too many parameters, thus many possibilities were available to fit with Gaussian components. Hence, here the U6+ CT band was shifted from 35,435 towards 34,722 cm−1.
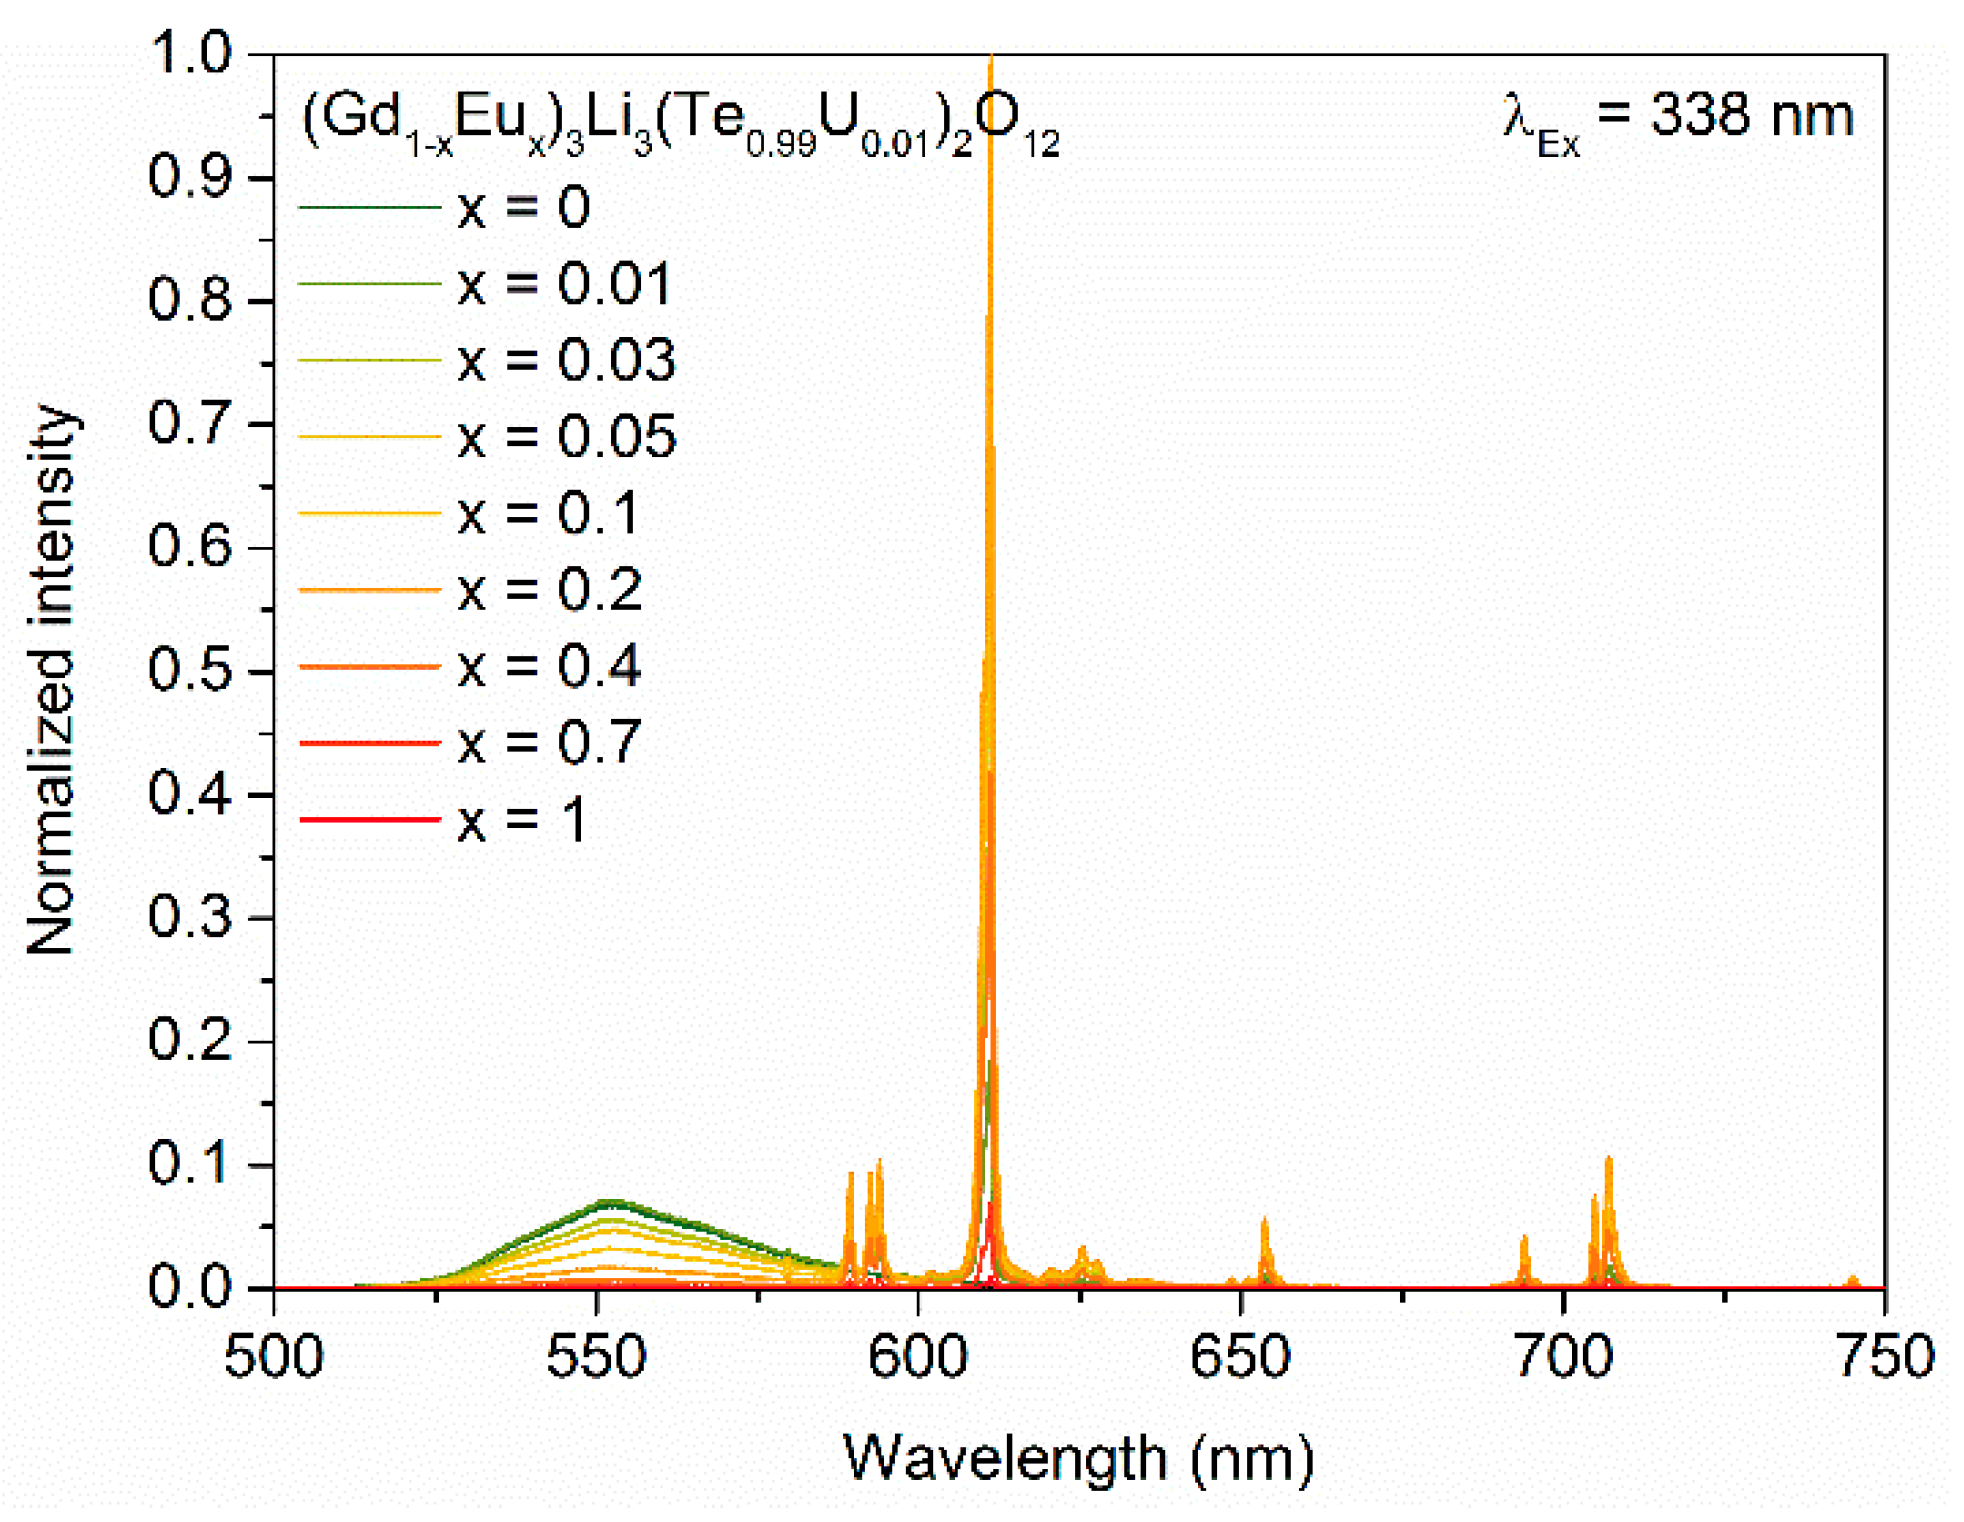
Emission spectra of the solid solution according to (Gd1−xEux)3Li3(Te0.99U0.01)2O12 with 0 ≤ x ≤ 1 are depicted in Figure 9 and unveil that a Eu3+ concentration of 20% yielded the highest emission integral for the emission at 611 nm. With an increasing Eu3+ content, the emission integral of U6+ emission decreased, highlighting the energy transfer. In other words, after the excitation of the uranate group, the absorbed energy was transferred to Eu3+. Therefore, the U6+ emission was hardly visible at a Eu3+ concentration higher than 10%. The samples were thus capable of generating green to red light under 338 nm excitation governed by the Eu3+ concentration. Color coordinates, as well as the luminous efficacies and the external quantum efficiencies, of each sample are listed in Table 1. We define the external quantum efficiency as the ratio of absorbed and emitted photons. The luminous efficacy decreased with increasing Eu3+ content as the emission was shifted from the green to the red spectral range, where the human eye is much less sensitive. The highest external quantum efficiency was reached at 10% Eu3+ and amounted to 42%. The quantum efficiency was thus rather low due to quenching of the U6+ CT process already at room temperature as well as some re-absorption in the red region as visible in the diffuse reflectance spectra [12]. In addition, due to the synthesis, the uranate group could show some mixed valence states, i.e., U5+/U6+. The resulting metal-to-metal charge transfer would decrease the external quantum efficiency as well as explain the slightly brownish body color. The quantum efficiency further decreased with increasing Eu3+ content. We thus suggest that the introduction of Eu3+ generated traps in the host compound and thus increased the overall defect concentration. Moreover, Eu3+ tends to show concentration quenching in some compounds, which further reduces the external quantum efficiency at higher Eu3+ concentrations [4,6,9,33]. At first, the traps were capable of inhibiting the quenching mechanism as we will discuss later. However, at higher Eu3+ concentrations, the number of defects was too advanced.
Fluorescence lifetime measurements monitoring the U6+ emission at 550 nm of co-doped (Gd1−xEux)3Li3(Te0.99U0.01)2O12 with 0 ≤ x ≤ 0.2 were conducted and plotted in Figure 10. The obtained decay curves with x > 0 could be well-fitted with a bi-exponential fitting function. The bi-exponential curve shape reflected the energy transfer from U6+ to Eu3+. The single-doped sample exhibited only a mono-exponential behavior. Therefore, co-doping with Eu3+ led to a second mechanism in which manner the excited U6+ state could abate. The averaged fluorescence lifetimes τ of the U6+ emissions are listed in Table 2. With increasing Eu3+ content, the fluorescence lifetimes of the U6+ emission decrease. As energy transfer processes were often much faster than radiative transitions, this proved the presence of an energy transfer from U6+ to Eu3+ [34].
The decay time of U6+ at 3 K was found to be ≈250 μs and was shorter than in other compounds, e.g., ordered perovskites (300 μs), indicating a more allowed transition. Generally, the U6+ decay time strongly depended on the site symmetry, which became shorter when inversion symmetry was no longer present [31,32]. While U6+ was tentatively occupying the Te6+ site, it exhibited a local symmetry of S6, which has no inversion center.
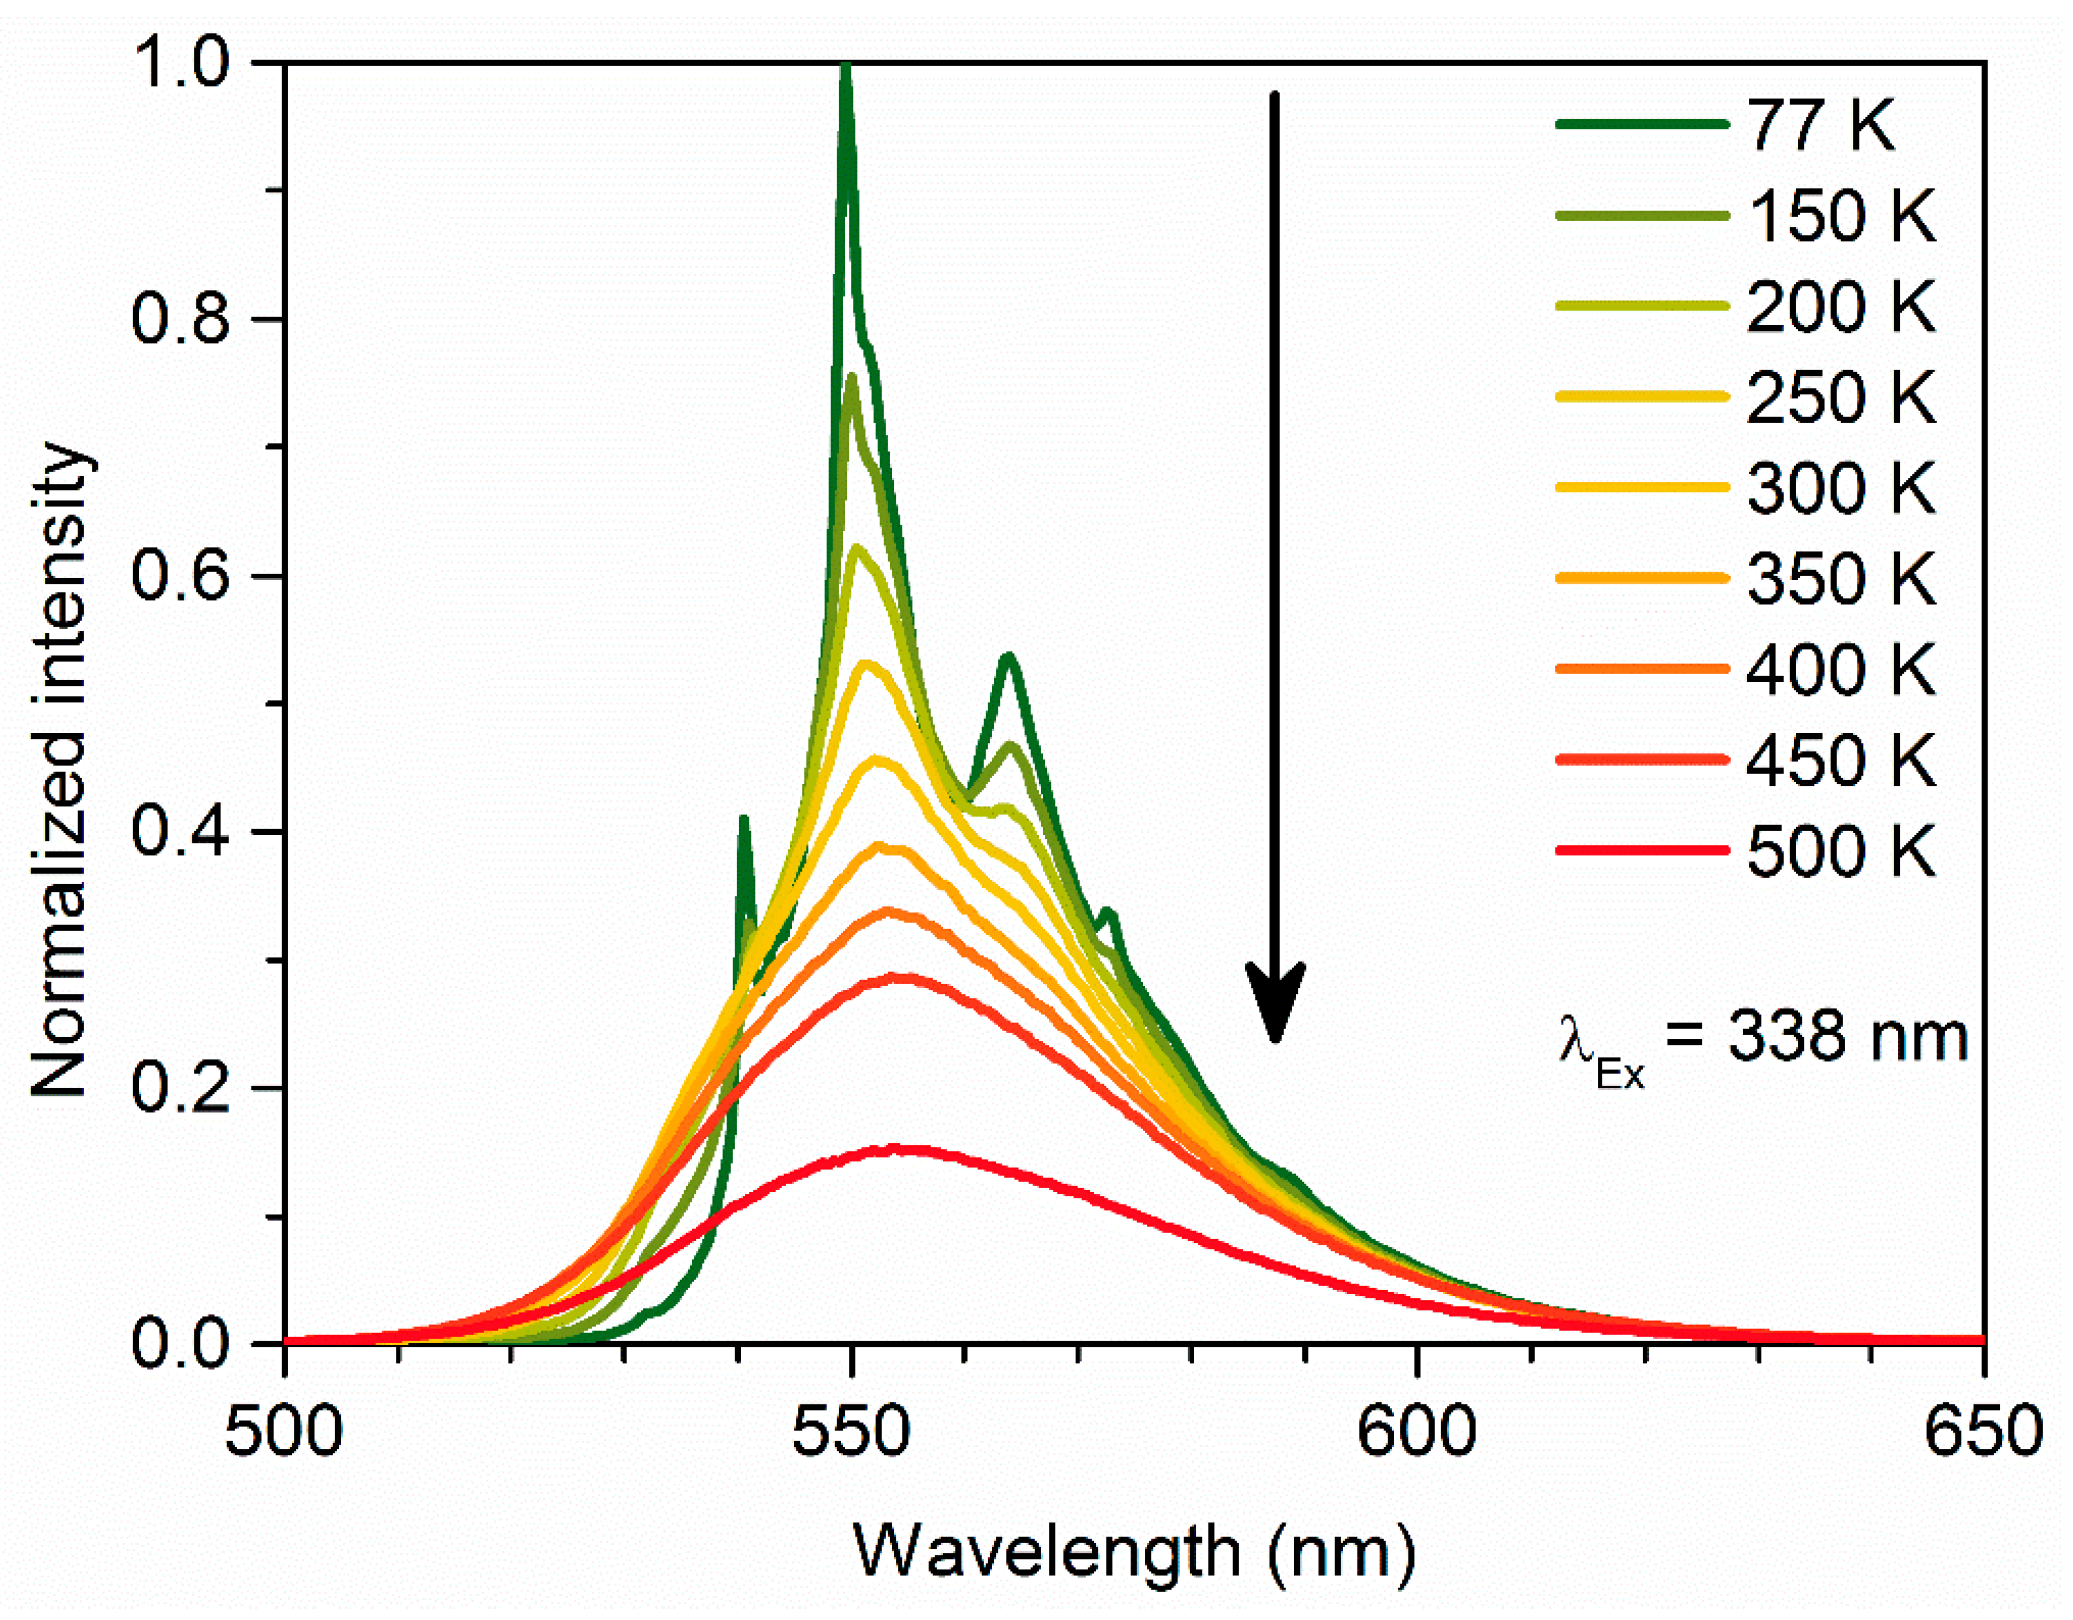
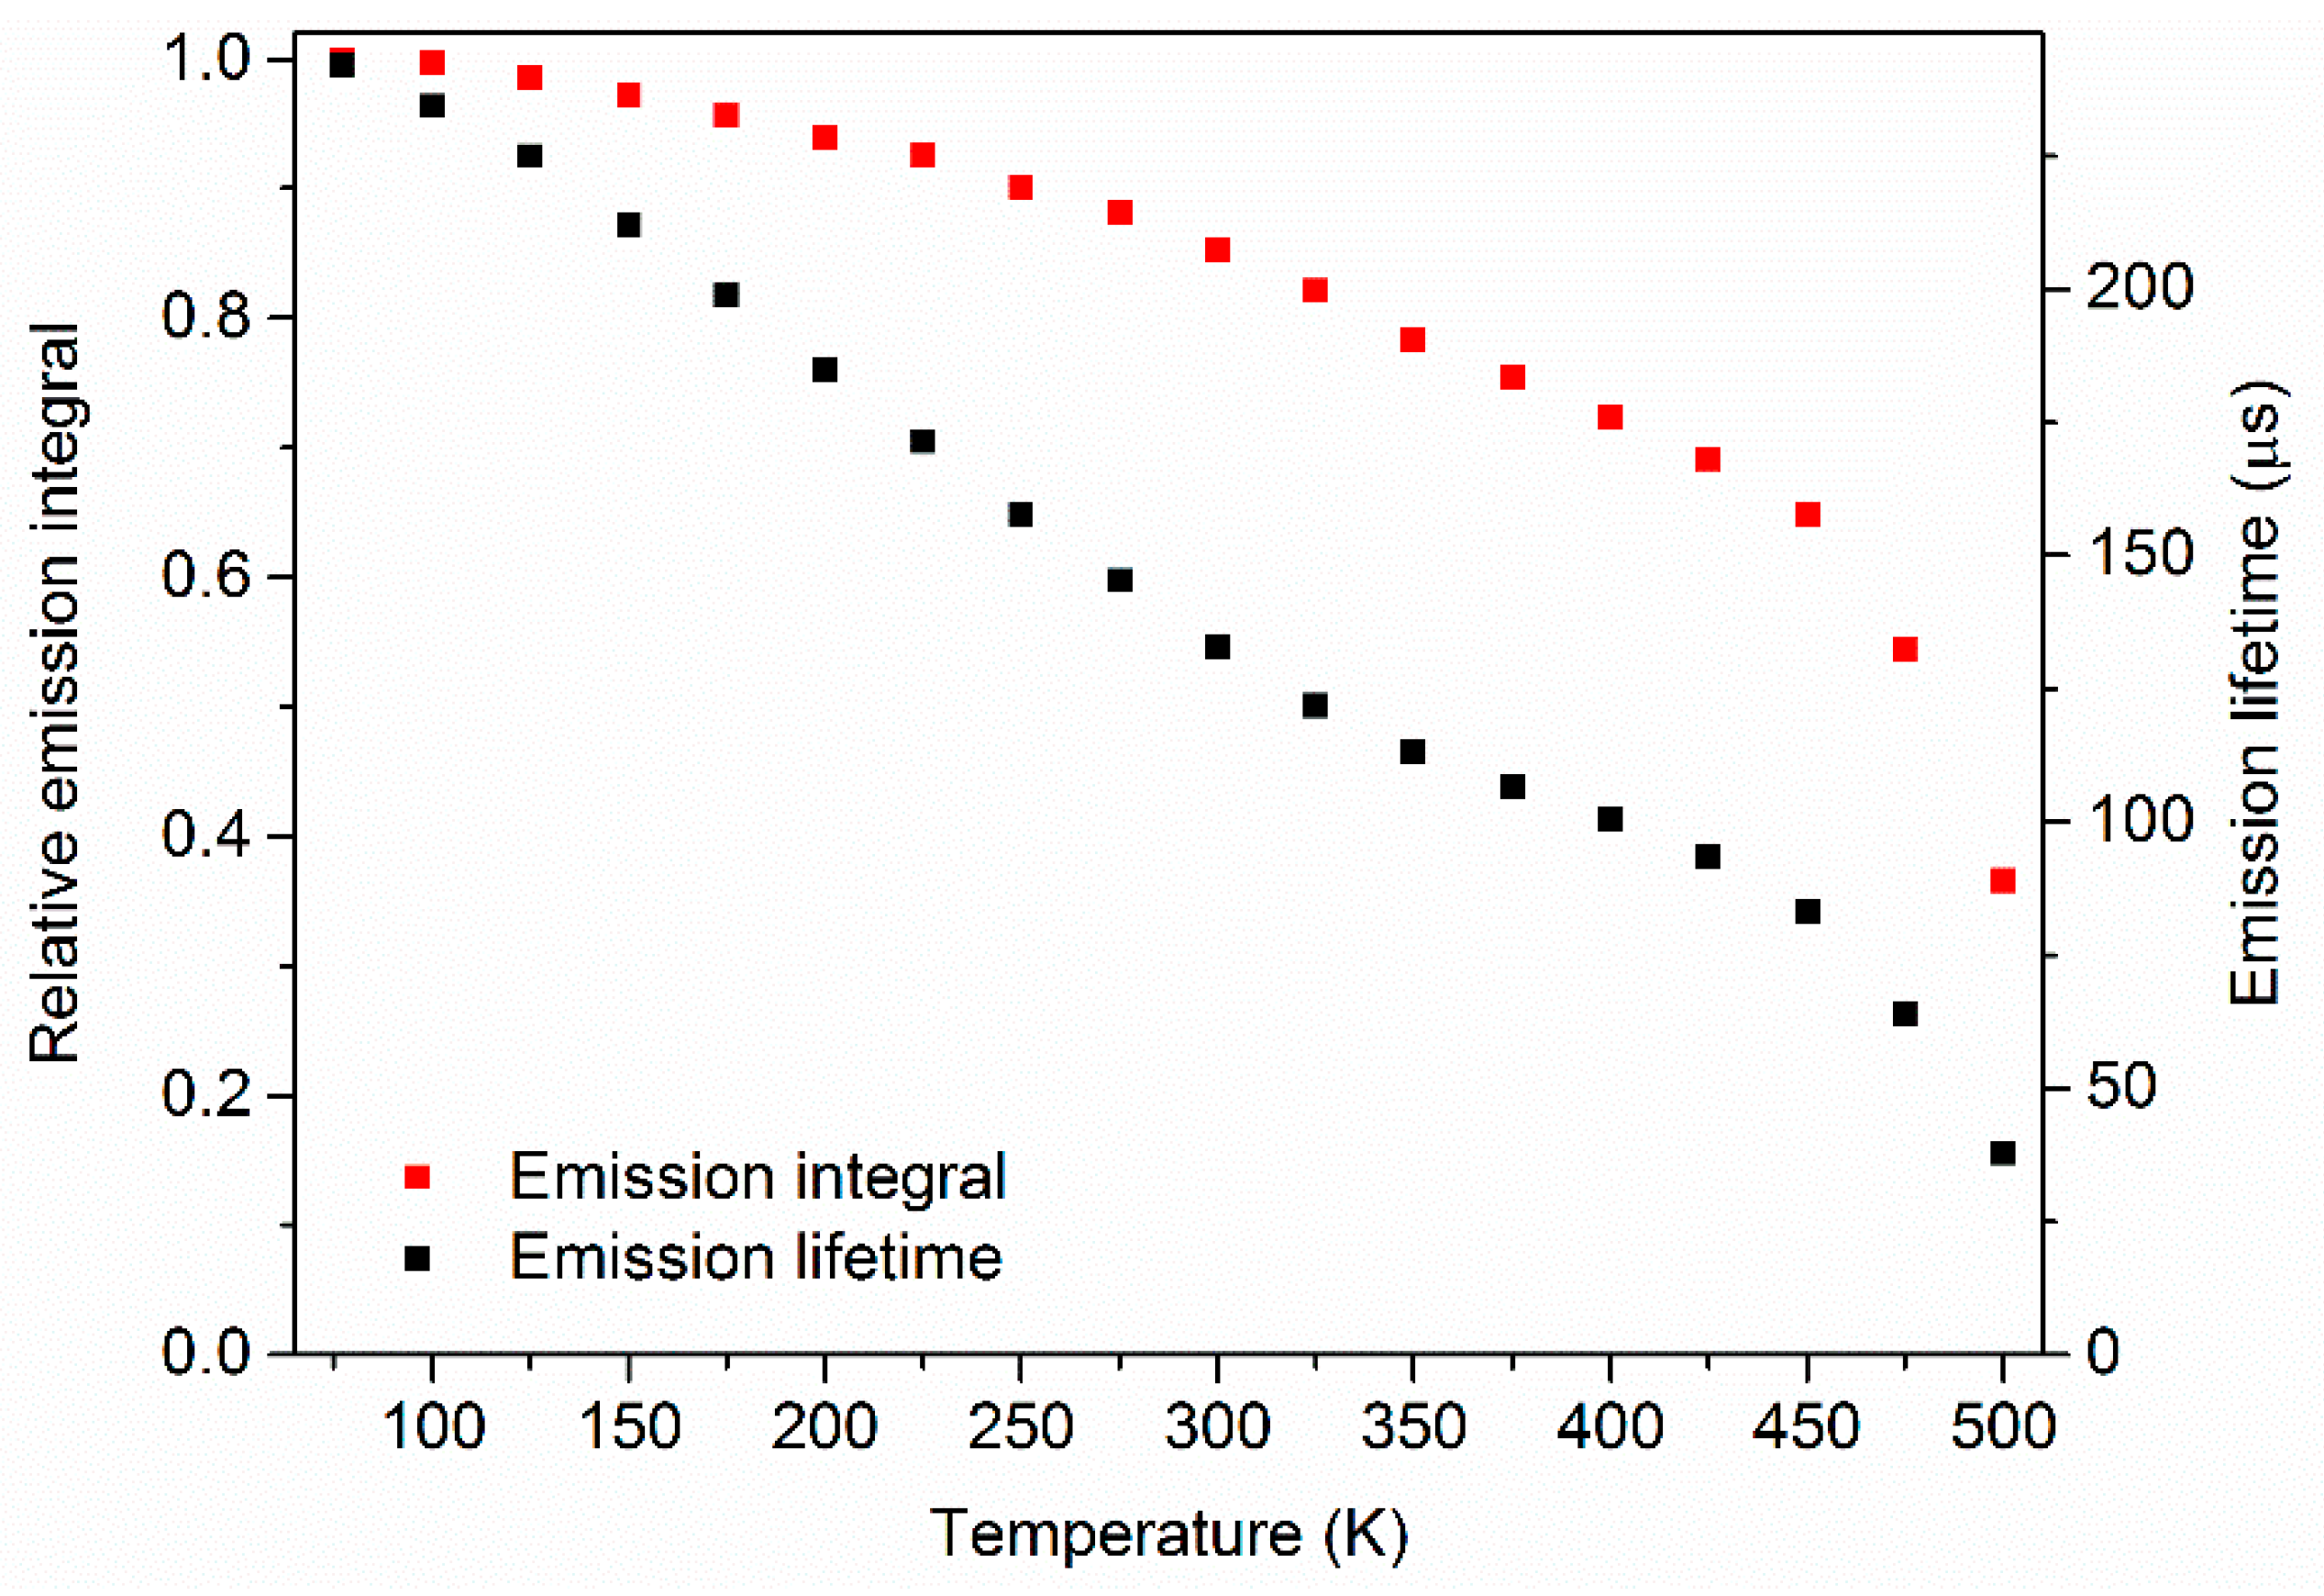
Emission spectra of U6+ at various temperatures are shown in Figure 11. At higher temperatures, the typical spectral broadening was observed. Already at 150 K, distinct phonon coupled transitions were visible. The determined emission integrals, as well as the emission lifetimes at different temperatures of single-doped Gd3Li3(Te0.99U0.01)2O12, are depicted in Figure 12. The decrease of the decay time over increasing temperature was probably due to an increase of the transition probability [33]. Due to orbital mixing, the parity-forbidden character was likely weakened, leading to shorter decay times. The deviation from the sigmoidal shape at higher temperatures was tentatively caused by another excited state, as presumed by Bleijenberg [35,36]. At higher temperatures, another excited level was populated, which exhibited a different decay time. The thermal quenching temperature T1/2 of the emission intensity depends on the energy difference between the position of the excitation and emission band. With a difference of 11,825 cm−1, the quenching temperature should be between 450 and 500 K, and thus lower than in Y3Li3Te2O12 (T1/2 = 540 K) due to longer Te–O bond lengths in Gd3Li3Te2O12 [31]. The experimental results indicated a quenching temperature of around 475 K. Blasse also suggested that the process of temperature quenching occurs via three quenching states in the configurational-coordinate diagram since the low energy gap between the ground state and the emitting state would lead to a much lower quenching temperature [31]. Already at low temperatures, quenching sets in, which might be defect related since the external quantum efficiencies were rather low.
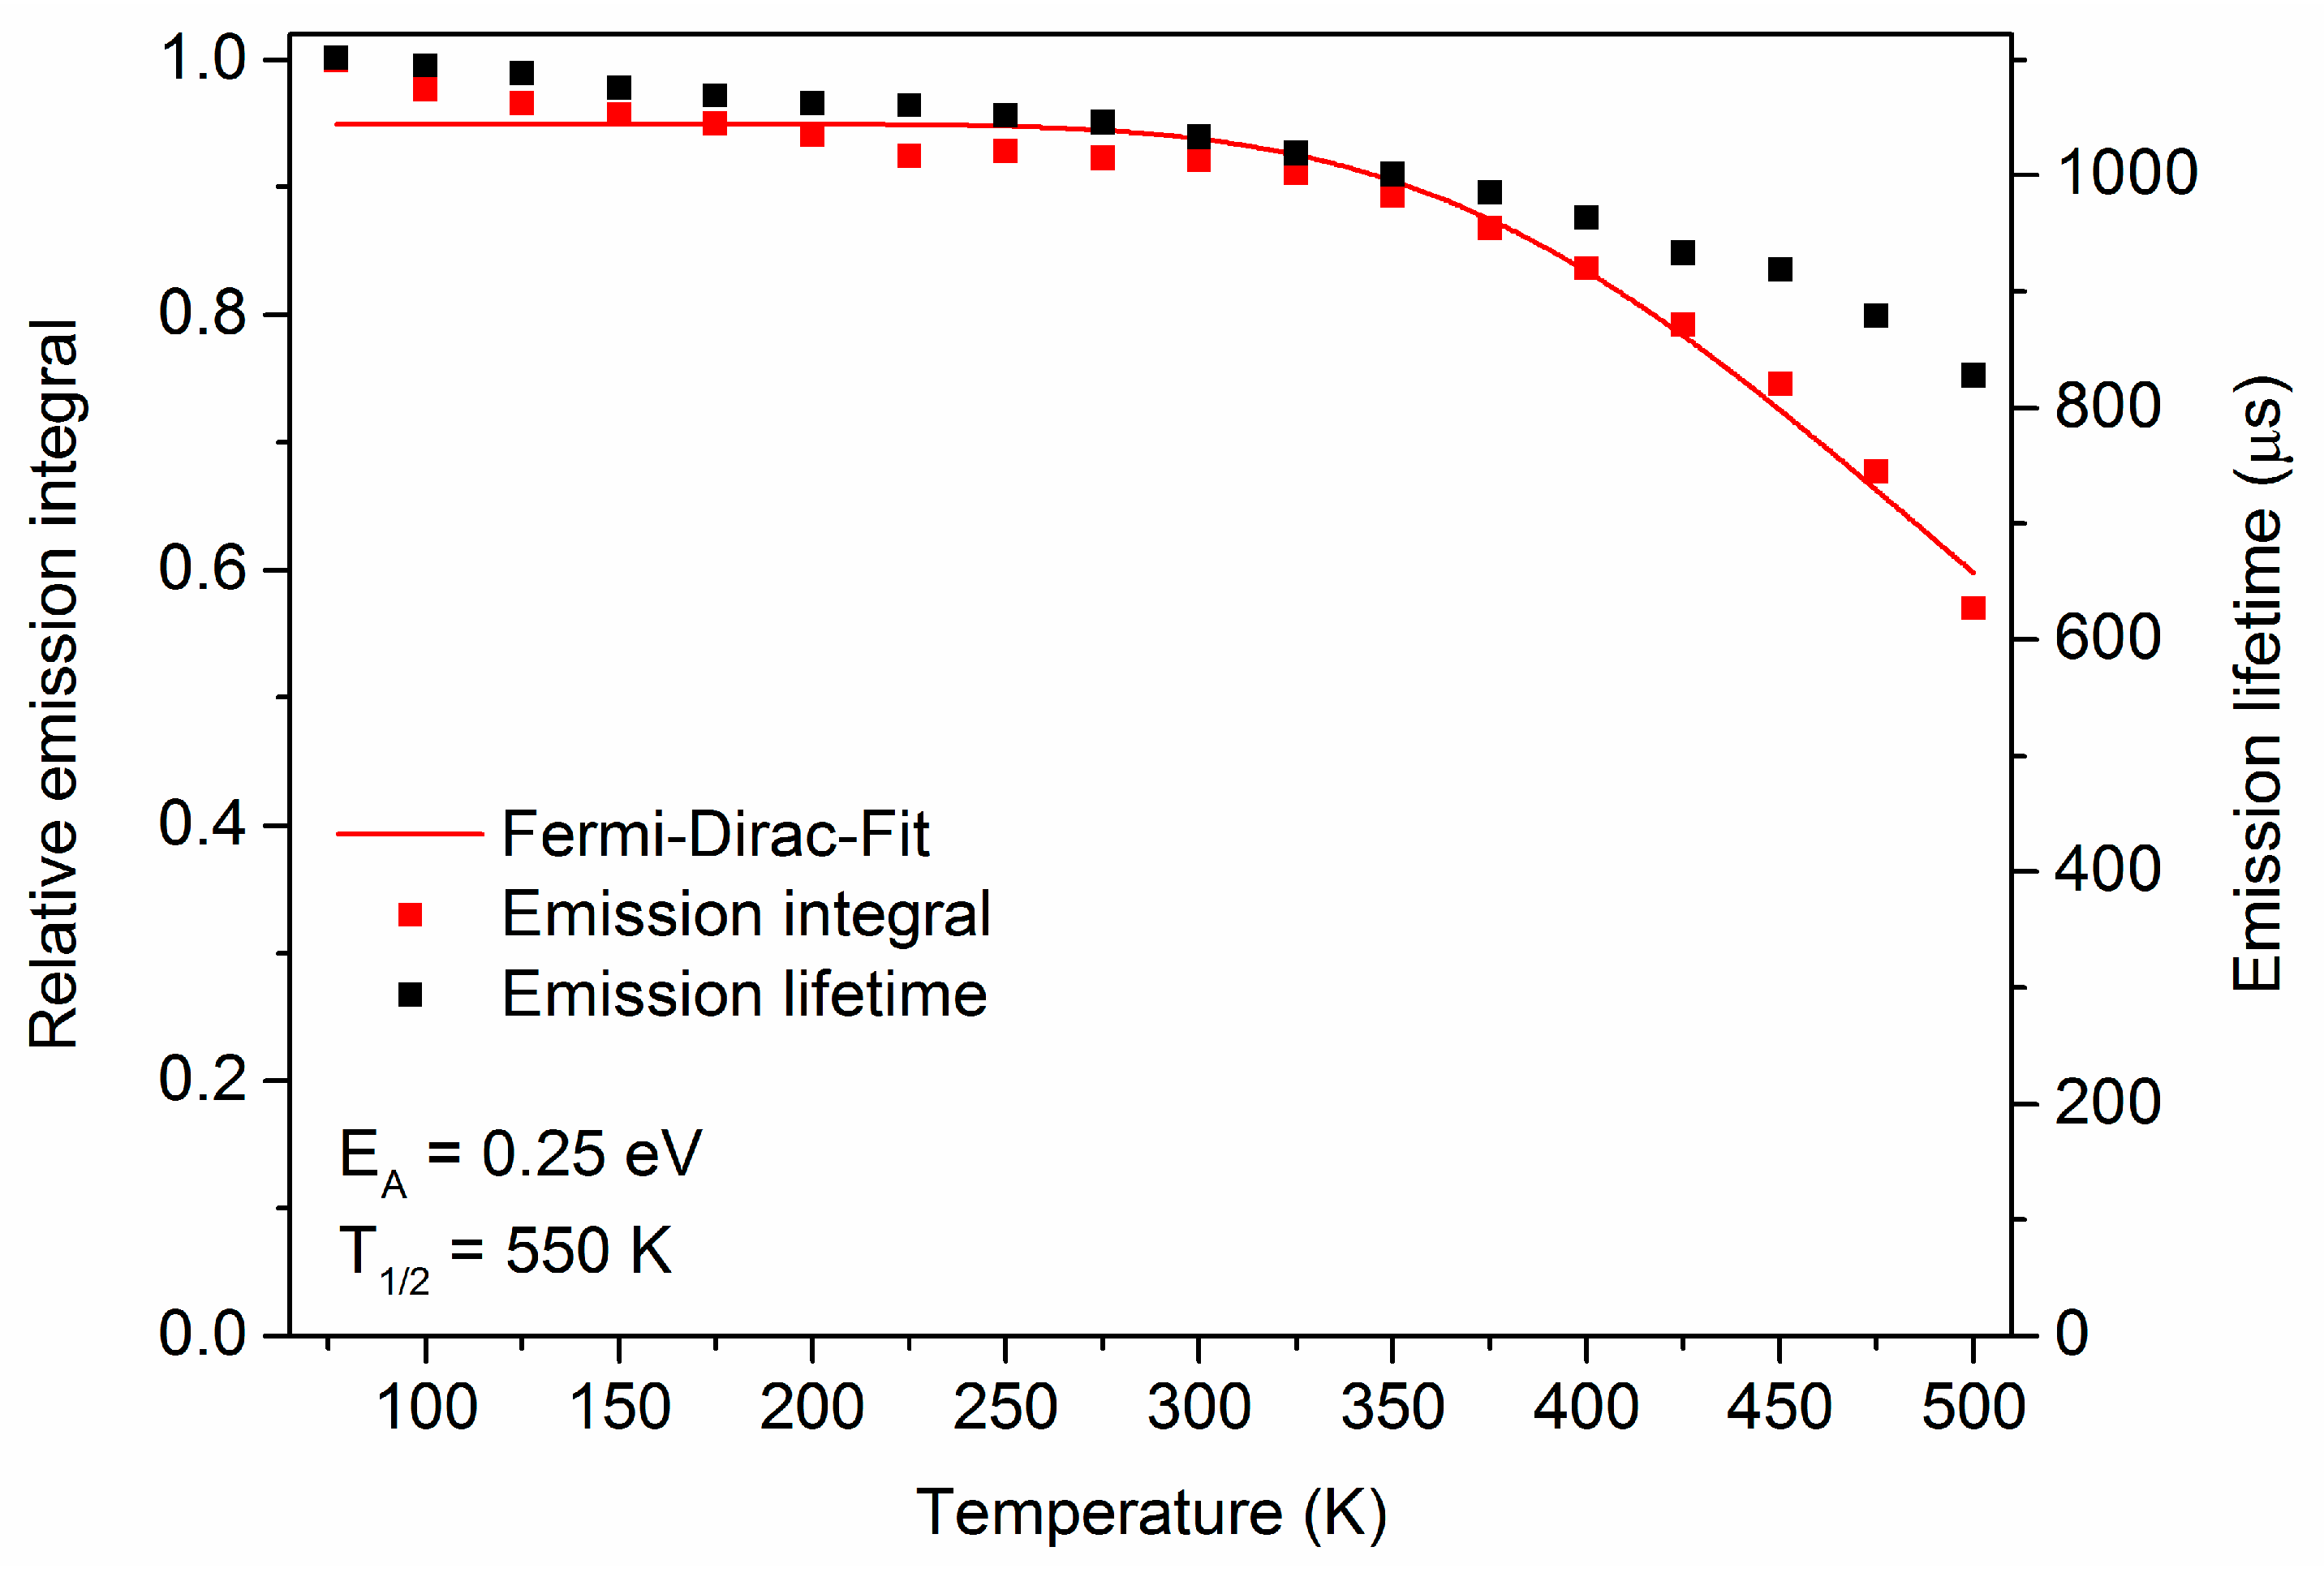
Figure 13 shows the temperature dependence of the emission intensity of Eu3+ excited by 338 nm radiation as well as emission lifetimes monitored at 611 nm of co-doped (Gd0.8Eu0.2)3Li3(Te0.99U0.01)2O12. The sample shows the typical quenching behavior with a thermal quenching temperature of about 550 K. The quenching of the U6+ centered photoluminescence seemed to not affect the energy transfer from U6+ to Eu3+. Thus, the energy transfer was a competitive process for the quenching mechanism. When the temperature-dependent U6+ emission of the same sample was investigated (Figure 14), it turned out that the quenching mechanism was somewhat hampered. The emission integrals started to decrease faster than the single-doped sample, but changed over to a plateau above 250 K. At higher temperatures, an increase could be observed. The decay measurements could only be fitted with a tri-exponential fit, emphasizing that several energy levels were present. The averaged decay lifetimes showed a similar behavior as the emission integrals. Due to orbital mixing, which weakened the parity regulation, the averaged emission lifetimes exhibited a more rapid decrease. At around 325 K, the lifetimes started to increase again, indicating that another energy level was populated. This phenomenon was more strongly pronounced than in the single-doped sample. The emission intensity, as well as the emission lifetimes, started to quench at around 475 K. Co-doping the sample with Eu3+ might have introduced some traps that prevented the reach of the cross-over point, which led to a relaxation into the ground-state level.

4. Experimental Section

A solid solution series of (Gd1−xEux)3Li3Te2O12:U6+ was prepared using a conventional solid state reaction. The U6+ concentration was set to 1 at % relative to the Te site to avoid possible concentration quenching [14]. High purity reagents Gd2O3 (Treibacher, Althofen, Austria, 99.99%), Li2CO3 (Alfa Aesar, Ward Hill, MA, USA, 99%), TeO2 (Alfa Aesar, 99.99%), Eu2O3 (Treibacher, 99.99%), and UO2(NO3)2⋅6H2O (made of uranium metal, Merck KGaA, Darmstadt, Germany, 99.99%) were weighed in stoichiometric amounts and rigorously mixed with hexane in an agate mortar. The dried blends were transferred to corundum crucibles and fired at 900 °C for 10 h under flowing oxygen. All samples containing U6+ exhibited a beige body color. The non-doped sample and the sample doped only with Eu3+ showed a white body color.
Phase purity of the synthesized samples was controlled using powder X-ray diffraction (XRD). All XRD patterns were recorded on a Panalytical (Almelo, The Netherlands) X’Pert PRO MPD diffractometer working in Bragg-Brentano geometry using Cu Kα radiation.
Photoluminescence (PL) and photoluminescence excitation (PLE) spectra were recorded on an Edinburgh Instruments (Livingston, UK) FLS980 spectrometer equipped with a Xe arc lamp (450 W) and a Peltier cooled (−20 °C) single-photon counting photomultiplier (Hamamatsu (Hamamatsu, Japan), R2658P). The emission spectra were corrected by applying a correction file obtained from a tungsten incandescent lamp certified by the National Physical Laboratory UK.
For time resolved spectroscopy, a micro-second pulsed Xe lamp (Heraeus (Hanau, Germany) µF920H) was used.
Temperature dependent PL spectra measurements from 77 to 500 K were performed using an Oxford Instruments (Abingdon, UK) cryostat MicrostatN2. Liquid nitrogen was used as a cooling agent. The temperature stabilization time was set to 30 s with a tolerance of ±3 K. Measurements below 77 K were performed using an Oxford Instruments Optistat AC-V 12 closed cycle He-cryostat.
Diffuse reflectance spectra (DRS) were recorded on an Edinburgh Instruments FS920 spectrometer equipped with a Xe arc lamp (450 W), a Peltier cooled (−20 °C) single-photon counting photomultiplier (Hamamatsu R928), and a Spectralon (Labsphere, North Sutton, NH, USA) integration sphere. BaSO4 (99.998%, Sigma Aldrich, St. Louis, MO, USA) was used as a reflectance standard. External quantum efficiencies (eQE) were determined using the approach of Kawamura et al. [37].
Scanning electron microscopy (SEM) micrographs were recorded on a Zeiss (Oberkochen, Germany) EVO MA10 equipped with a secondary electron detector. SEM was operated in high vacuum mode (P = 10−7 Pa).

5. Conclusions

Solid solutions according to the formula (Gd1−xEux)3Li3(Te0.99U0.01)2O12 with x = 0…1 were successfully synthesized via a conventional solid-state reaction. Diffuse UV reflectance spectroscopy, as well as DFT calculations, revealed the band structure of the host. The band gap was determined to be about 5 eV, both from theory and from experiment. Photoluminescence measurements revealed that Gd3Li3Te2O12:U6+,Eu3+ was capable of generating green band and red line emission peaking at 550 and 611 nm, respectively. At low temperatures, vibronic modes coupled to U6+ emission became visible, allowing the assignment of the energy of some ungerade vibrations. A distinct zero-phonon line was observed at 540.60 nm. Several excitation bands could be assigned to CT transitions from O2- to Te6+, U6+, and Eu3+, demonstrating the presence of efficient energy transfer from U6+ to Eu3+ even at high temperatures. Temperature-resolved photoluminescence and emission lifetime measurements confirmed the assumptions of Blasse and Bleijenberg concerning the energy level structure of U6+. The thermal quenching temperature of the 4f–4f intraconfigurational transitions of Eu3+ was found to be at 550 K, which was independent of the U6+ quenching mechanism. Finally, it turned out that the introduction of Eu3+ into the host structure generated traps, which hampered the quenching of U6+.

Author Contributions

Conceptualization, D.B. and T.J. (Thomas Jüstel); Data curation, D.B. and J.R.; Formal analysis, D.B. and T.J. (Thomas Jansen); Investigation, D.B., J.R., T.J. (Thomas Jansen) and T.J. (Thomas Jüstel); Methdology, D.B. and J.R.; Supervision, T.J. (Thomas Jüstel); Writing-original draft, D.B.; Writing-review & editing, J.R., T.J. (Thomas Jansen) and T.J. (Thomas Jüstel).

Funding

The authors are grateful to Merck KGaA, Darmstadt, Germany for generous financial support.

Conflicts of Interest

The authors declare no conflict of interest.

References

  1. Welker, T. Recent developments on phosphors for fluorescent lamps and cathode-ray tubes. J. Lumin. 1991, 48–49, 49–56. [Google Scholar] [CrossRef]
  2. Feldmann, C.; Jüstel, T.; Ronda, C.R.; Schmidt, P.J. Inorganic Luminescent Materials: 100 Years of Research and Application. Adv. Funct. Mater. 2003, 13, 511–516. [Google Scholar] [CrossRef]
  3. Baur, F.; Jüstel, T. New Red-Emitting Phosphor La2Zr3(MoO4)9:Eu3+ and the Influence of Host Absorption on its Luminescence Efficiency. Aust. J. Chem. 2015, 68, 1727. [Google Scholar] [CrossRef]
  4. Katelnikovas, A.; Plewa, J.; Sakirzanovas, S.; Dutczak, D.; Enseling, D.; Baur, F.; Winkler, H.; Kareiva, A.; Jüstel, T. Synthesis and optical properties of Li3Ba2La3(MoO4)8:Eu3+ powders and ceramics for pcLEDs. J. Mater. Chem. 2012, 22, 22126. [Google Scholar] [CrossRef]
  5. Park, S.H.; Lee, K.H.; Unithrattil, S.; Yoon, H.S.; Jang, H.G.; Im, W.B. Melilite-Structure CaYAl3O7:Eu3+ Phosphor: Structural and Optical Characteristics for Near-UV LED-Based White Light. J. Phys. Chem. C 2012, 116, 26850–26856. [Google Scholar] [CrossRef]
  6. Baur, F.; Glocker, F.; Jüstel, T. Photoluminescence and energy transfer rates and efficiencies in Eu3+ activated Tb2Mo3O12. J. Mater. Chem. C 2015, 3, 2054–2064. [Google Scholar] [CrossRef]
  7. Žukauskas, A.; Vaicekauskas, R.; Ivanauskas, F.; Vaitkevičius, H.; Shur, M.S. Spectral optimization of phosphor-conversion light-emitting diodes for ultimate color rendering. Appl. Phys. Lett. 2008, 93, 51115. [Google Scholar] [CrossRef]
  8. Park, W.J.; Jung, M.K.; Yoon, D.H. Influence of Eu3+, Bi3+ co-doping content on photoluminescence of YVO4 red phosphors induced by ultraviolet excitation. Sens. Actuator B Chem. 2007, 126, 324–327. [Google Scholar] [CrossRef]
  9. Böhnisch, D.; Baur, F.; Jüstel, T. Photoluminescence and energy transfer behavior of narrow band red light emitting Li3Ba2Tb3(MoO4)8:Eu3+. Dalton Trans. 2018, 47, 1520–1529. [Google Scholar] [CrossRef] [PubMed]
  10. Blasse, G.; Krol, D.M. Energy transfer phenomena in ordered perovskites of the type Sr2Na0.5Ln3+0.5X6+O6. J. Lumin. 1981, 22, 389–396. [Google Scholar] [CrossRef]
  11. Krol, D.M.; Ros, J.P.M.; Roos, A. The influence of crystal structure and chemical composition on the energy transfer processes in uranates. J. Chem. Phys. 1980, 73, 1521–1526. [Google Scholar] [CrossRef]
  12. Smit, W.M.A.; Blasse, G. Luminescence and energy migration in the garnet Gd3Li3Te2O12 doped with several rare earths and uranium. J. Solid State Chem. 1986, 63, 308–315. [Google Scholar] [CrossRef]
  13. Köngeter, B.; Kemmler-Sack, S. Photolumineszenz und Energeitransfer in Seltenerd-aktivierten Granat Gd3Te2Li3O12. Z. Naturforsch. A 1984, 39a, 490–494. [Google Scholar] [CrossRef]
  14. Alberda, R.H.; Blasse, G. Luminescence in a new garnet phase with hexavalent metal ions. J. Lumin. 1976, 12–13, 687–692. [Google Scholar] [CrossRef]
  15. Zhang, W.; Seo, H.J. Luminescence and structure of a novel red-emitting phosphor Eu3+-doped tellurate garnet Li3Y3Te2O12. J. Alloys Compd. 2013, 553, 183–187. [Google Scholar] [CrossRef]
  16. Sztajnkrycer, M.D.; Otten, E.J. Chemical and Radiological Toxicity of Depleted Uranium. Mil. Med. 2004, 169, 212–216. [Google Scholar] [CrossRef] [PubMed] [Green Version]
  17. Baur, F.; Jüstel, T. Warm-white LED with ultra high luminous efficacy due to sensitisation of Eu 3+ photoluminescence by the uranyl moiety in K4(UO2)Eu2(Ge2O7)2. J. Mater. Chem. C 2018, 7, 1600826. [Google Scholar] [CrossRef]
  18. Clark, S.J.; Segall, M.D.; Pickard, C.J.; Hasnip, P.J.; Probert, M.I.J.; Refson, K.; Payne, M.C. First principles methods using CASTEP. Z. Kristallogr. 2005, 220, 567–570. [Google Scholar] [CrossRef] [Green Version]
  19. Ceperley, D.M.; Alder, B.J. Ground State of the Electron Gas by a Stochastic Method. Phys. Rev. Lett. 1980, 45, 566–569. [Google Scholar] [CrossRef]
  20. Perdew, J.P. Density functional theory and the band gap problem. Int. J. Quantum Chem. 1986, 30, 451. [Google Scholar] [CrossRef]
  21. Perdew, J.P.; Zunger, A. Self-interaction correction to density-functional approximations for many-electron systems. Phys. Rev. B 1981, 23, 5048–5079. [Google Scholar] [CrossRef]
  22. Enseling, D.; Herden, B.; Katelnikovas, A.; Möller, S.; Winkler, H.; Petry, R.; Meyer, H.-J.; Jüstel, T. Powder Reflection Spectroscopy in the Vacuum UV range. J. Appl. Spectrosc. 2014, 81, 341–346. [Google Scholar] [CrossRef]
  23. Kubelka, P.; Munk, F. Ein Beitrag zur Optik der Farbanstriche. Z. Phys. 1931, 12, 593–601. [Google Scholar]
  24. Tauc, J. Optical properties and electronic structure of amorphous Ge and Si. Mater. Res. Bull. 1968, 3, 37–46. [Google Scholar] [CrossRef]
  25. Tauc, J.; Grigorovici, R.; Vancu, A. Optical Properties and Electronic Structure of Amorphous Germanium. Phys. Stat. Sol. 1966, 15, 627–637. [Google Scholar] [CrossRef]
  26. O’Callaghan, M.P.; Lynham, D.R.; Cussen, E.J.; Chen, G.Z. Structure and Ionic-Transport Properties of Lithium-Containing Garnets Li3Ln3Te2O12 (Ln = Y, Pr, Nd, Sm–Lu). Chem. Mater. 2006, 18, 4681–4689. [Google Scholar] [CrossRef]
  27. Shannon, R.D. Revised Effective Ionic Radii and Systematic Studies of Interatomic Distances in Halides and Chalcogenides. Acta Crystallogr. 1976, A32, 751–767. [Google Scholar] [CrossRef]
  28. Blasse, G.; Bril, A. Luminescence of tungsten-activated tellurates. J. Solid State Chem. 1970, 2, 291–294. [Google Scholar] [CrossRef]
  29. Jørgensen, C.K.; Lundström, T.; Patoharju, O.; Noer, B.; Reio, L. Complexes of the 4d- and 5d-Groups. IV. Electron Transfer Bands with Special Application to M. Delépine’s Complexes and a Transition from Iridium(III) to Pyridine, with some Remarks about Intermediate Coupling in Halide Complexes and the Uranyl Ion. Acta Chem. Scand. 1957, 11, 166–178. [Google Scholar] [CrossRef]
  30. De Hair, J.T.W.; Blasse, G. Luminescence of the octahedral uranate group. J. Lumin. 1976, 14, 307–323. [Google Scholar] [CrossRef]
  31. Blasse, G. The Structure Sensitivity of the U6+ Ion Luminescence in Oxides. J. Electrochem. Soc. 1977, 124, 1280. [Google Scholar] [CrossRef]
  32. Blasse, G.; Bleijenberg, K.C.; Krol, D.M. The luminescence of hexavalent uranium in solids. J. Lumin. 1979, 18-19, 57–62. [Google Scholar] [CrossRef]
  33. Chang, Y.-C.; Liang, C.-H.; Yan, S.-A.; Chang, Y.-S. Synthesis and Photoluminescence Characteristics of High Color Purity and Brightness Li3Ba2Gd3(MoO4)8:Eu3+ Red Phosphors. J. Phys. Chem. C 2010, 114, 3645–3652. [Google Scholar] [CrossRef]
  34. Blasse, G.; Grabmaier, B.C. Luminescent Materials; Springer Verlag: Utrecht, The Netherlands, 1994; pp. 91–106. [Google Scholar]
  35. Bleijenberg, K.C.; Breddels, P.A. On the vibrational structure in the luminescence spectra of uranium-activated sodium fluoride crystals. J. Chem. Phys. 1980, 72, 5390–5398. [Google Scholar] [CrossRef]
  36. Bleijenberg, K.C. Luminescence properties of uranate centres in solids. In Luminescence and Energy Transfer. Structure and Bonding; Springer Verlag: Utrecht, The Netherlands, 1980; pp. 97–217. [Google Scholar]
  37. Kawamura, Y.; Sasabe, H.; Adachi, C. Simple Accurate System for Measuring Absolute Photoluminescence Quantum Efficiency in Organic Solid-State Thin Films. Jpn. J. Appl. Phys. 2004, 43, 7729–7730. [Google Scholar] [CrossRef]
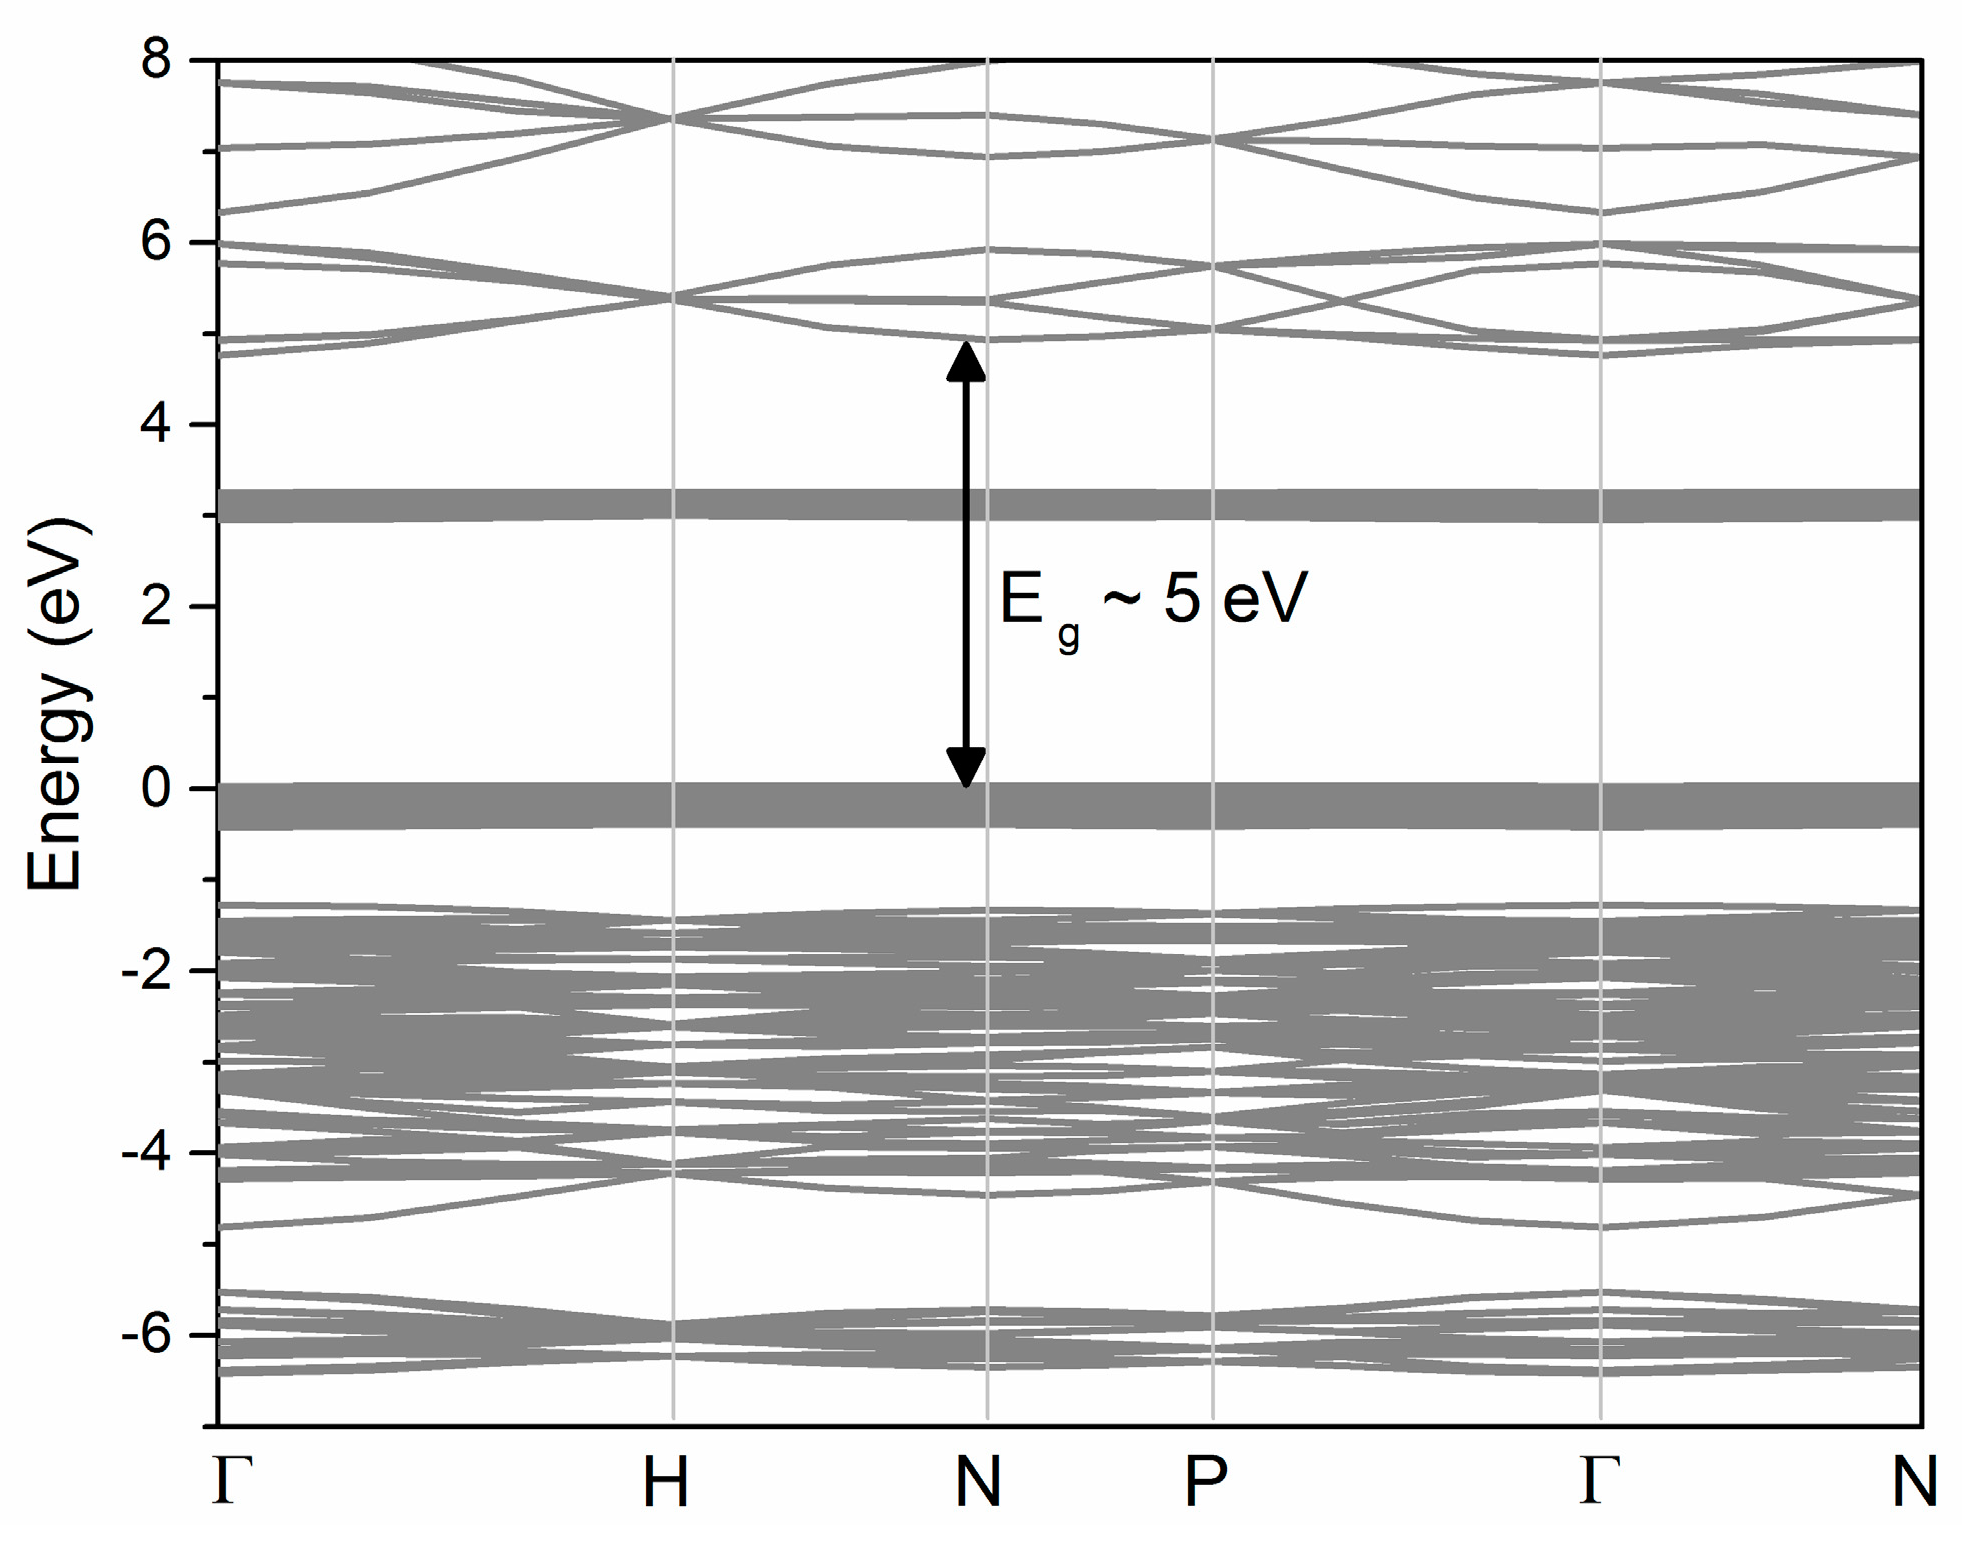
Figure 1. The calculated band structure of Gd3Li3Te2O12. sX-LDA calculated electronic bands are shown. The Fermi level is set to zero.
Inorganics 06 00084 g001
Figure 2. Tauc plot of Gd3Li3Te2O12 derived from a diffuse reflectance measurement.
Inorganics 06 00084 g002
Figure 3. The calculated density of states diagrams for Gd3Li3Te2O12. From the top partial density of states is shown for Gd, Te, Li, and O ions, respectively, together with the total density of states.
Inorganics 06 00084 g003
Figure 4. Powder XRD patterns of Gd3Li3Te2O12, Gd3Li3(Te0.99U0.01)2O12, (Gd0.8Eu0.2)3Li3Te2O12, and (Gd1−xEux)3Li3(Te0.99U0.01)2O12 with x = 0…1, as well as calculated reference pattern for Cu Kα radiation.
Inorganics 06 00084 g004
Figure 5. Scanning electron micrograph of (Gd0.8Eu0.2)3Li3(Te0.99U0.01)2O12 particles.
Inorganics 06 00084 g005
Figure 6. Diffuse reflectance spectra of Gd3Li3Te2O12 (orange line), Gd3Li3(Te0.99U0.01)2O12 (red line), (Gd0.8Eu0.2)3Li3Te2O12 (black line), and (Gd0.8Eu0.2)3Li3(Te0.99U0.01)2O12 (dark red line).
Inorganics 06 00084 g006
Figure 7. Emission and excitation spectra of (a) Gd3Li3(Te0.99U0.01)2O12; (b) (Gd0.8Eu0.2)3Li3(Te0.99U0.01)2O12; and (c) (Gd0.8Eu0.2)3Li3Te2O12 at room temperature and 3 K.
Inorganics 06 00084 g007
Figure 8. Excitation spectra with Gaussian distribution curves of (a) Gd3Li3(Te0.99U0.01)2O12; (b) (Gd0.8Eu0.2)3Li3(Te0.99U0.01)2O12; and (c) (Gd0.8Eu0.2)3Li3Te2O12 at 3 K.
Inorganics 06 00084 g008
Figure 9. Emission spectra of (Gd1−xEux)3Li3(Te0.99U0.01)2O12 with 0 ≤ x ≤ 1 under 338 nm excitation.
Inorganics 06 00084 g009
Figure 10. Fluorescence lifetime curves of (Gd1−xEux)3Li3(Te0.99U0.01)2O12 with 0 ≤ x ≤ 0.2 upon 340 nm excitation while monitoring the U6+ emission at 550 nm.
Inorganics 06 00084 g010
Figure 11. Emission spectra of Gd3Li3(Te0.99U0.01)2O12 at various temperatures. Excitation wavelength was set to 338 nm.
Inorganics 06 00084 g011
Figure 12. Emission integrals of U6+ excited at 338 nm, and averaged decay lifetimes monitoring the 550 nm emission of Gd3Li3(Te0.99U0.01)2O12.
Inorganics 06 00084 g012
Figure 13. Emission integrals of Eu3+ excited at 338 nm, and averaged decay lifetimes monitoring the 611 nm emission of (Gd0.8Eu0.2)3Li3(Te0.99U0.01)2O12.
Inorganics 06 00084 g013
Figure 14. Emission integrals of U6+ excited at 338 nm, and averaged decay lifetimes monitoring the 550 nm emission of (Gd0.8Eu0.2)3Li3(Te0.99U0.01)2O12.
Inorganics 06 00084 g014
Table 1. External quantum efficiencies, color coordinates, and luminous efficacy of (Gd1−xEux)3Li3(Te0.99U0.01)2O12 with 0 ≤ x ≤ 1 upon 338 nm excitation.
Eu3+ Conc.EQECIE1931 Color CoordinateLuminous Efficacy
%Ex = 338 nm)xy[lm/Wopt]
0320.38120.6119632
1390.41940.5748576
3390.46550.5297511
5410.50310.4931464
10420.55140.4459405
20380.59210.4061357
40160.59330.4048352
7020.57470.4224364
100<10.60790.3855271
Table 2. Fluorescence lifetimes τ1 and τ2, as well as averaged lifetimes τ, of the U6+ emission in (Gd1−xEux)3Li3(Te0.99U0.01)2O12.
Sample
(x)
Fraction 1
(%)
τ1
(μs)
Fraction 2
(%)
τ2
(μs)
τ
(μs)
0100127.5
178107.822186.8125.2
35888.842163.7120.2
54371.057146.1113.7
104061.660144.0111.0
203652.464138.7108.1