
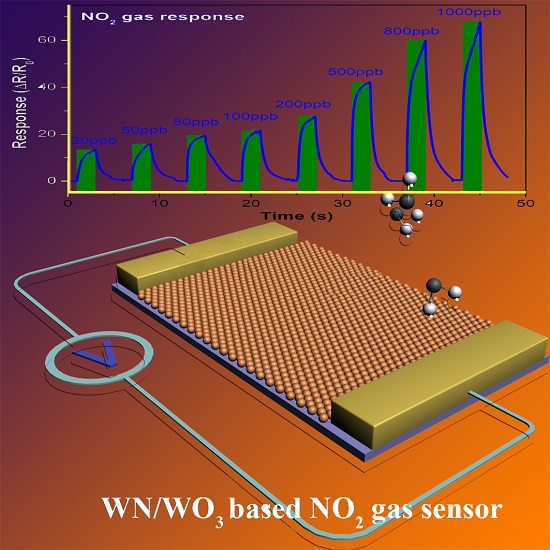
Mesoporous WN/WO3-Composite Nanosheets for the Chemiresistive Detection of NO2 at Room Temperature

Abstract
:
1. Introduction
2. Results and Discussion
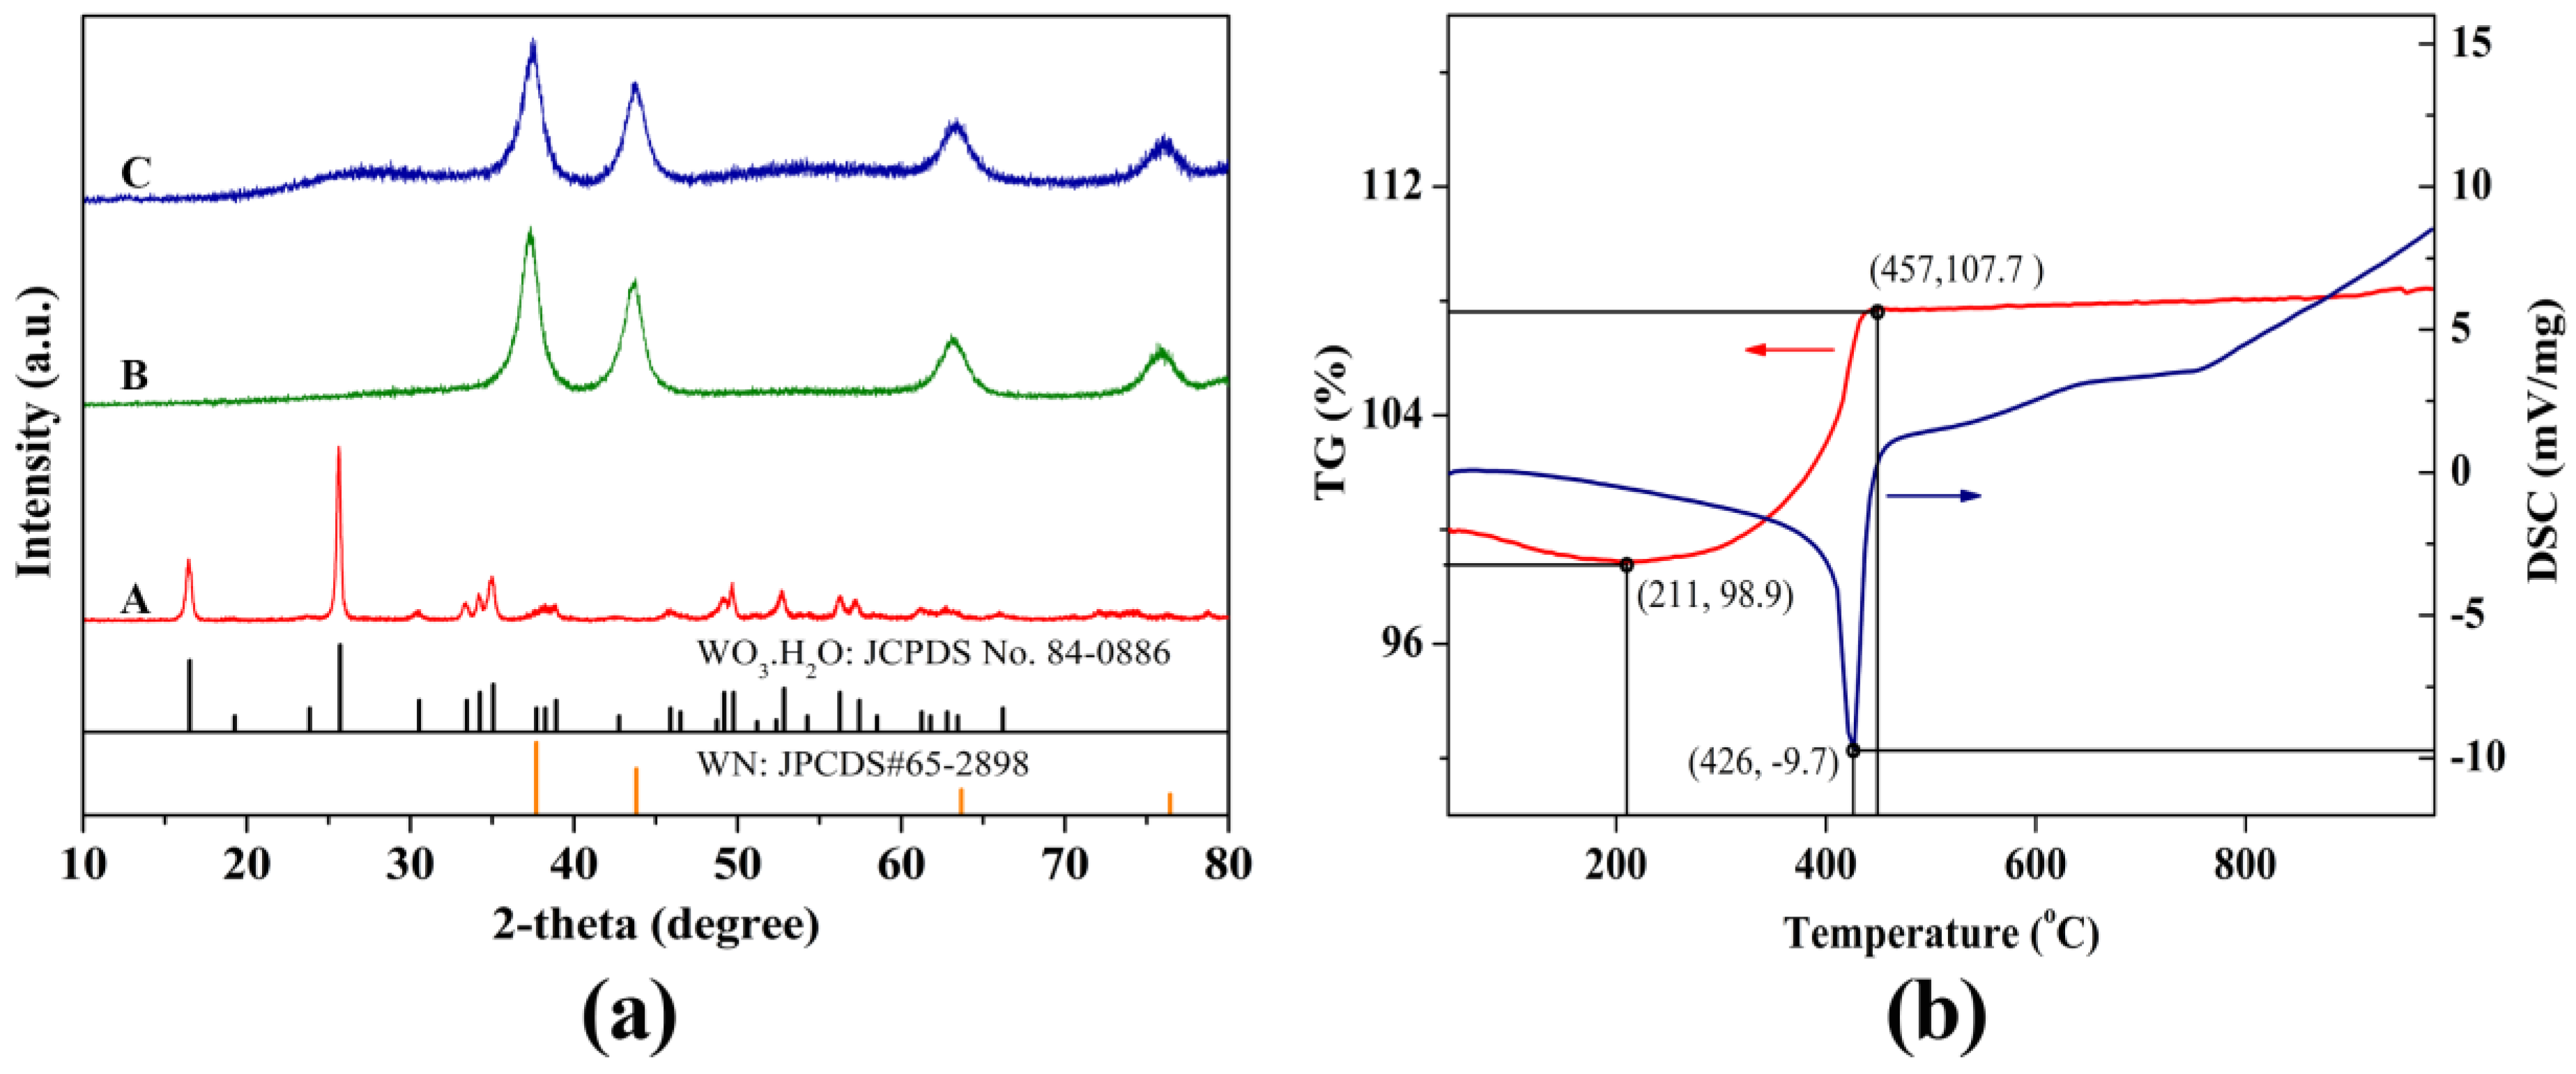
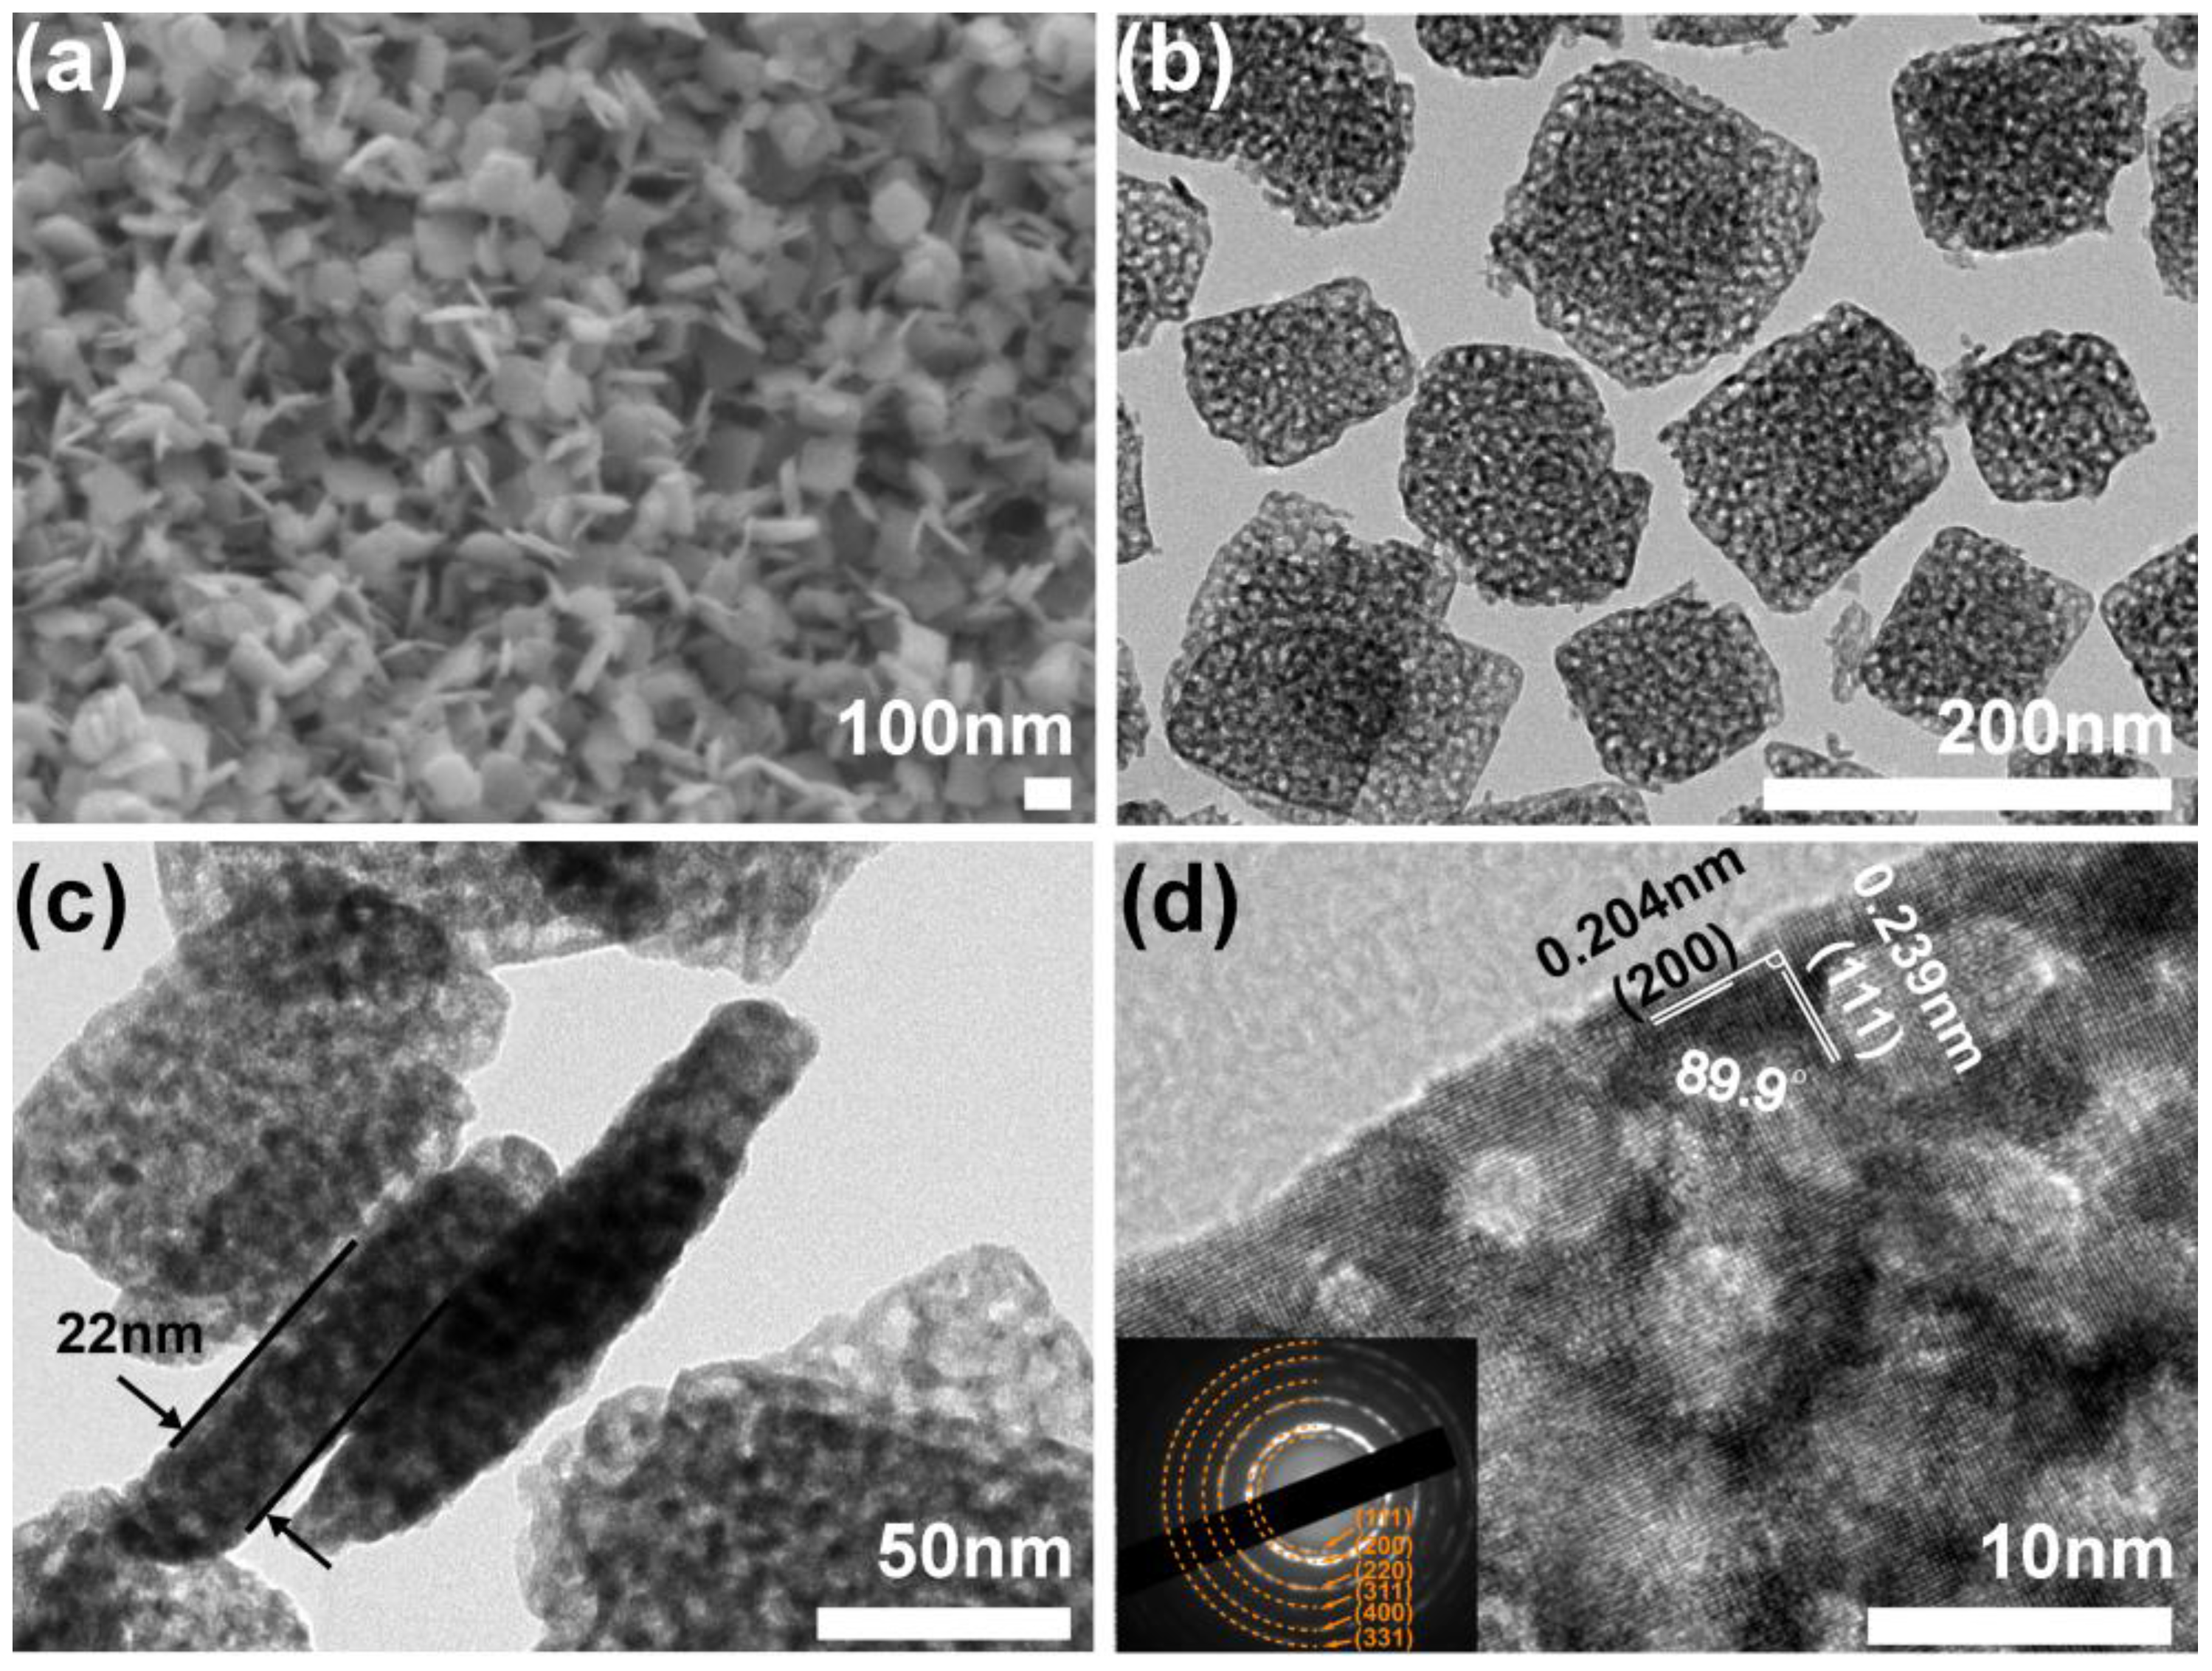
2.1. Structure, Composition and Morphology
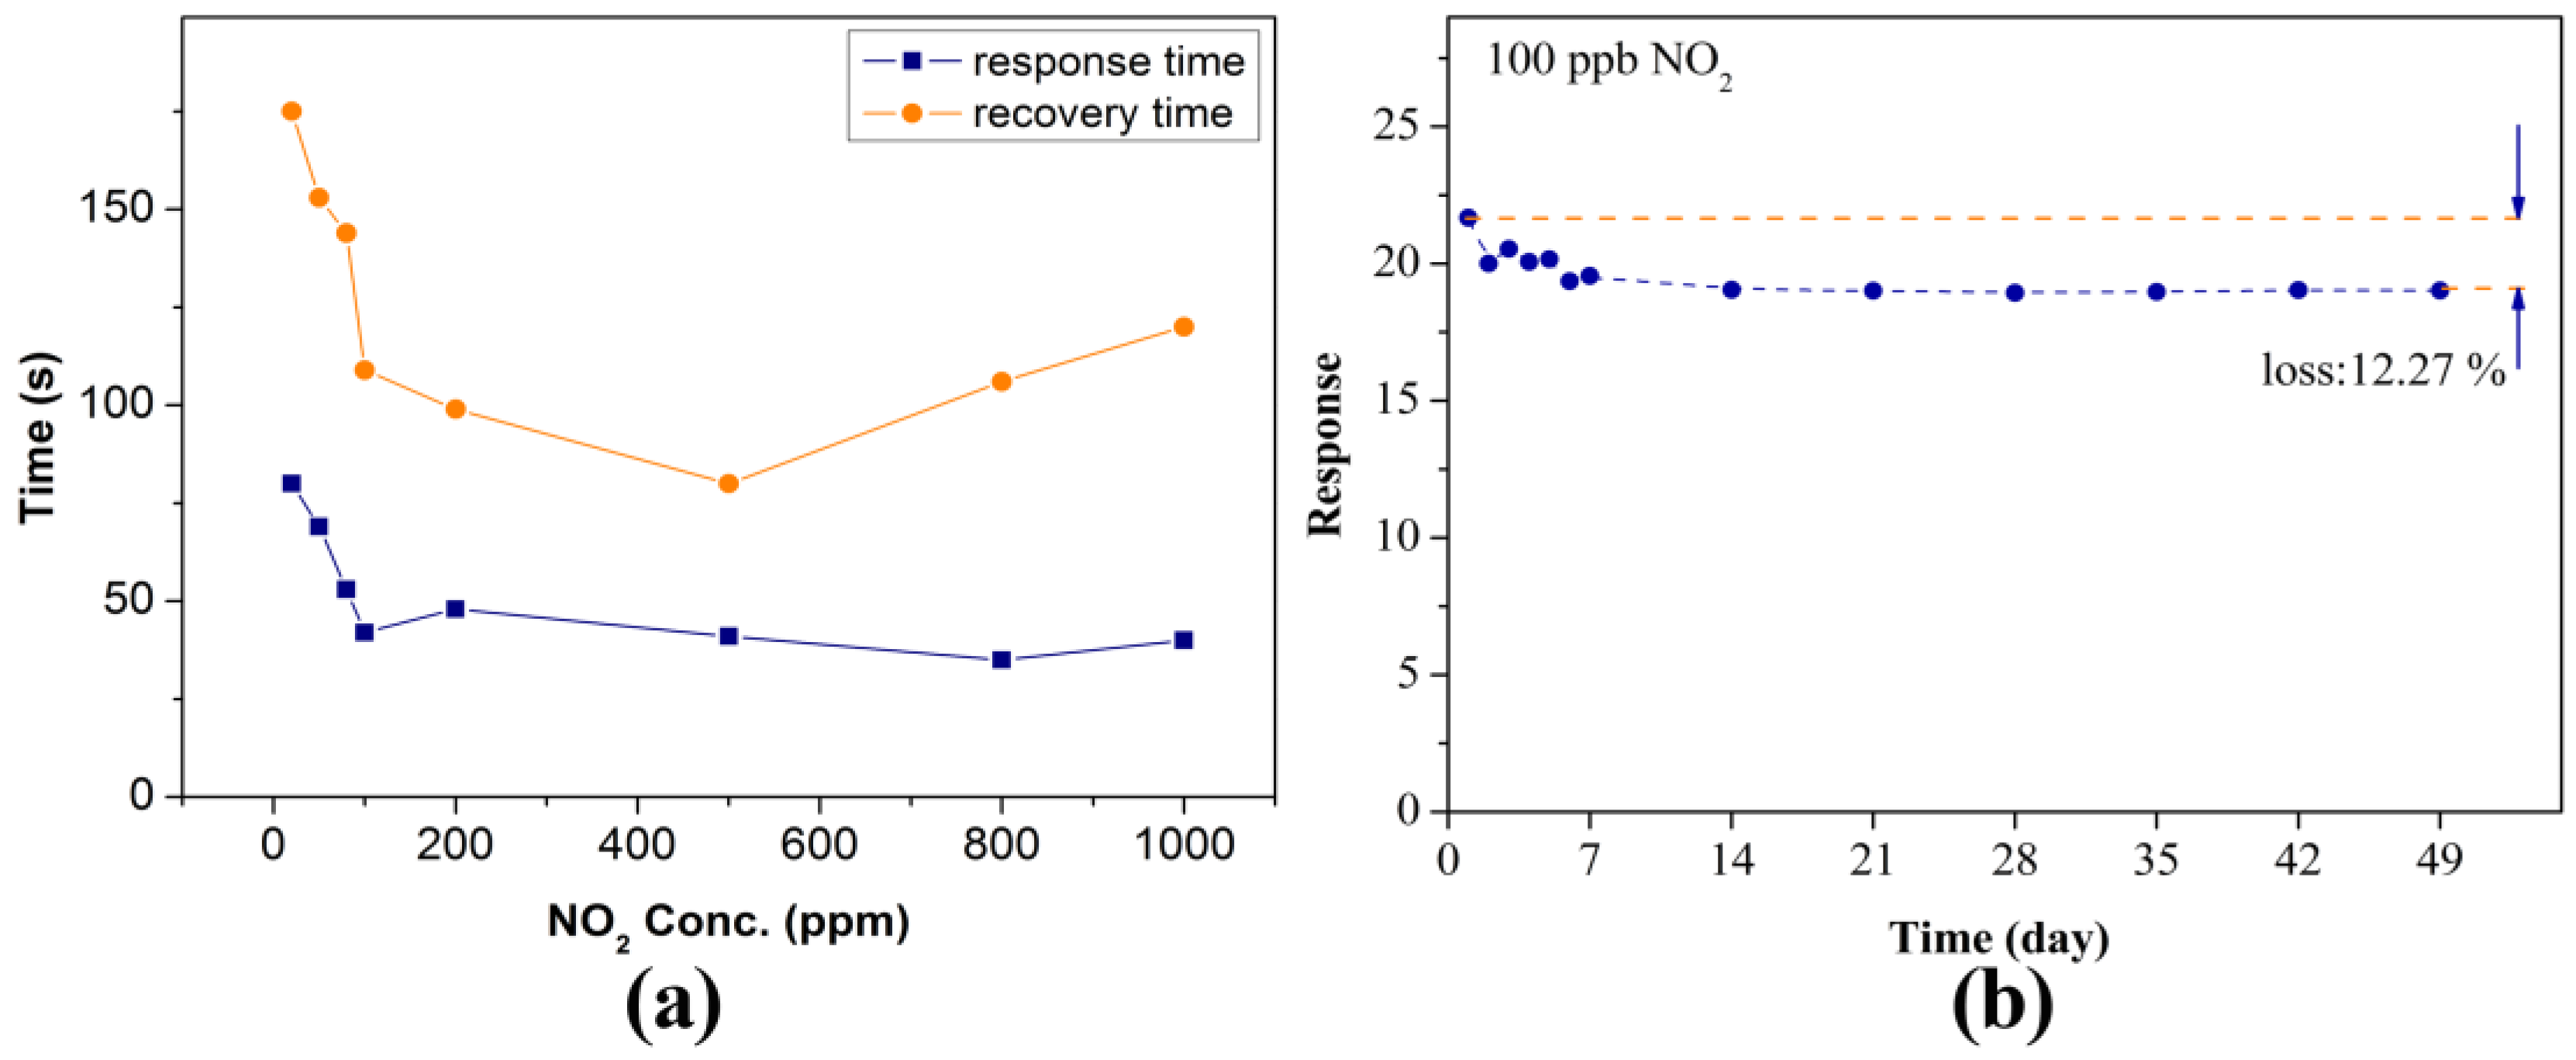
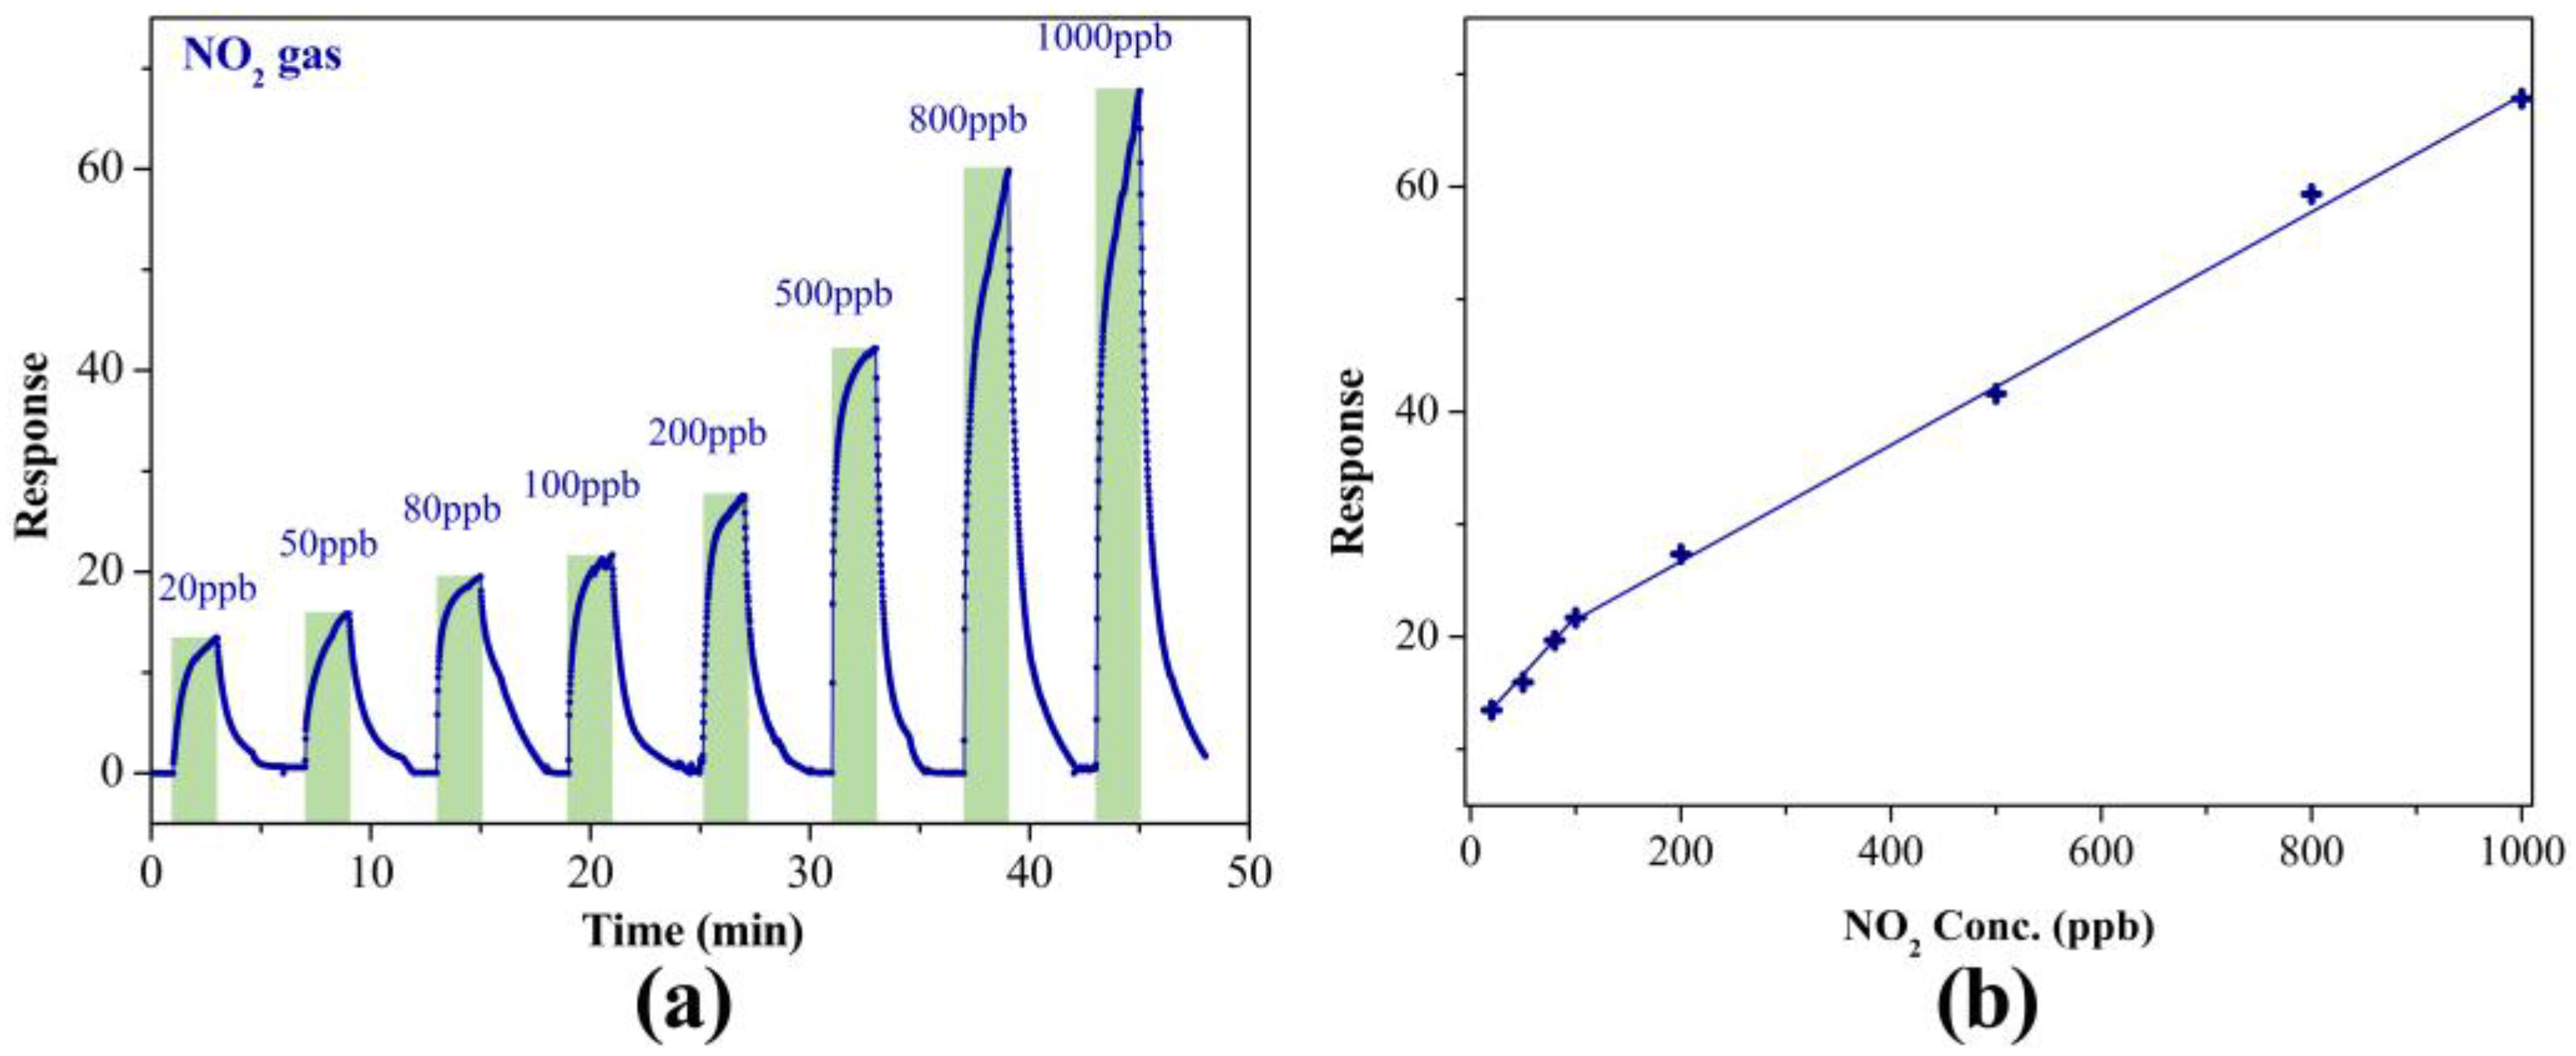
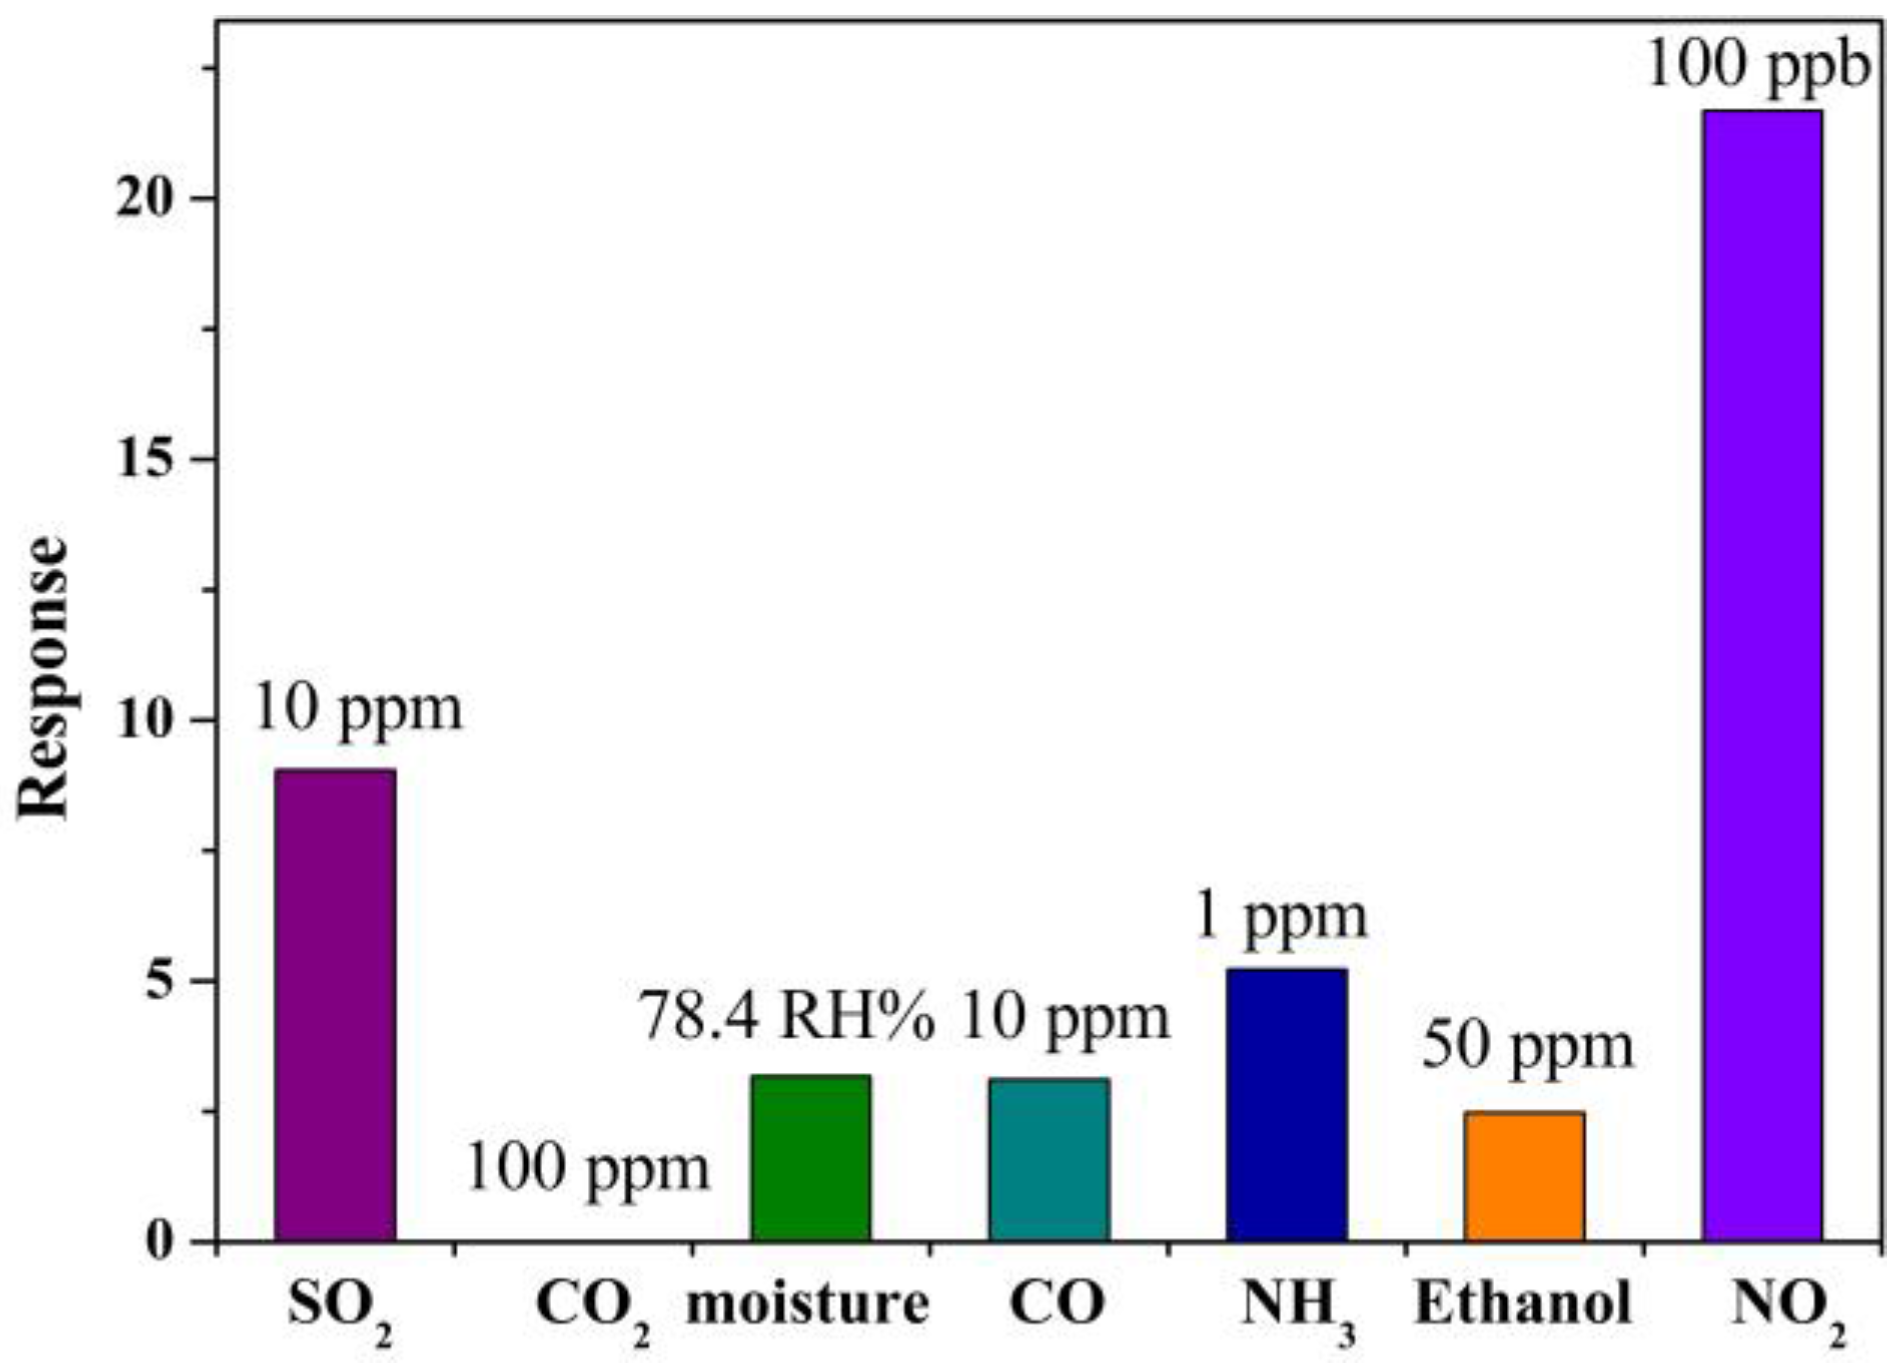
2.2. Gas Sensing Characteristics
2.3. Gas Sensing Mechanism
3. Materials and Methods
3.1. Materials
3.2. Synthesis
3.3. Materials Characterizations
3.4. Fabrication and Measurement of Gas Sensor
4. Conclusions
Supplementary Materials
Acknowledgments
Author Contributions
Conflicts of Interest
References
- Haick, H.; Broza, Y.Y.; Mochalski, P.; Ruzsanyi, V.; Amann, A. Assessment, origin, and implementation of breath volatile cancer markers. Chem. Soc. Rev. 2014, 43, 1423–1449. [Google Scholar] [CrossRef]
- Hagleitner, C.; Hierlemann, A.; Lange, D.; Kummer, A.; Kerness, N.; Brand, O.; Baltes, H. Smart single-chip gas sensor microsystem. Nature 2001, 414, 293–296. [Google Scholar] [CrossRef] [PubMed]
- Peng, G.; Tisch, U.; Adams, O.; Hakim, M.; Shehada, N.; Broza, Y.Y.; Billan, S.; Abdah-Bortnyak, R.; Kuten, A.; Haick, H. Diagnosing lung cancer in exhaled breath using gold nanoparticles. Nat. Nanotechnol. 2009, 4, 669–673. [Google Scholar] [CrossRef] [PubMed]
- Kolmakov, A.; Klenov, D.; Lilach, Y.; Stemmer, S.; Moskovits, M. Enhanced gas sensing by individual SnO2 nanowires and nanobelts functionalized with Pd catalyst particles. Nano Lett. 2005, 5, 667–673. [Google Scholar] [CrossRef] [PubMed]
- Deng, S.; Tjoa, V.; Fan, H.M.; Tan, H.R.; Sayle, D.C.; Olivo, M.; Mhaisalkar, S.; Wei, J.; Sow, C.H. Reduced graphene oxide conjugated Cu2O nanowire mesocrystals for high-performance NO2 gas sensor. J. Am. Chem. Soci. 2012, 134, 4905–4917. [Google Scholar] [CrossRef] [PubMed]
- Rai, P.; Khan, R.; Raj, S.; Majhi, S.M.; Park, K.-K.; Yu, Y.-T.; Lee, I.-H.; Sekhar, P.K. Au@Cu2O core–shell nanoparticles as chemiresistors for gas sensor applications: Effect of potential barrier modulation on the sensing performance. Nanoscale 2014, 6, 581–588. [Google Scholar] [CrossRef] [PubMed]
- Jing, Z.; Zhan, J. Fabrication and gas-sensing properties of porous ZnO nanoplates. Adv. Mater. 2008, 20, 4547–4551. [Google Scholar] [CrossRef]
- Cheng, W.; Ju, Y.; Payamyar, P.; Primc, D.; Rao, J.; Willa, C.; Koziej, D.; Niederberger, M. Large-area alignment of tungsten oxide nanowires over flat and patterned substrates for room-temperature gas sensing. Angew. Chem. Int. Ed. 2015, 54, 340–344. [Google Scholar] [CrossRef] [PubMed]
- Kim, H.W.; Na, H.G.; Kwon, Y.J.; Cho, H.Y.; Lee, C. Decoration of Co nanoparticles on ZnO-branched SnO2 nanowires to enhance gas sensing. Sens. Actuators B Chem. 2015, 219, 22–29. [Google Scholar] [CrossRef]
- Liang, Y.; Cui, Z.; Zhu, S.; Li, Z.; Yang, X.; Chen, Y.; Ma, J. Design of a highly sensitive ethanol sensor using a nano-coaxial p-Co3O4/n-TiO2 heterojunction synthesized at low temperature. Nanoscale 2013, 5, 10916–10926. [Google Scholar] [CrossRef] [PubMed]
- Xu, S.; Gao, J.; Wang, L.; Kan, K.; Xie, Y.; Shen, P.; Li, L.; Shi, K. Role of the heterojunctions in In2O3-composite SnO2 nanorod sensors and their remarkable gas-sensing performance for NOx at room temperature. Nanoscale 2015, 7, 14643–14651. [Google Scholar] [CrossRef] [PubMed]
- Zhou, X.; Feng, W.; Wang, C.; Hu, X.; Li, X.; Sun, P.; Shimanoe, K.; Yamazoe, N.; Lu, G. Porous ZnO/ZnCo2O4 hollow spheres: Synthesis, characterization, and applications in gas sensing. J. Mater. Chem. A 2014, 2, 17683–17690. [Google Scholar] [CrossRef]
- Sun, P.; Zhou, X.; Wang, C.; Shimanoe, K.; Lu, G.; Yamazoe, N. Hollow SnO2/α-Fe2O3 spheres with a double-shell structure for gas sensors. J. Mater. Chem. A 2014, 2, 1302–1308. [Google Scholar] [CrossRef]
- Chan, N.Y.; Zhao, M.; Wang, N.; Au, K.; Wang, J.; Chan, L.W.H.; Dai, J. Palladium nanoparticle enhanced giant photoresponse at LaAlO3/SrTiO3 two-dimensional electron gas heterostructures. ACS Nano 2013, 7, 8673–8679. [Google Scholar] [CrossRef] [PubMed]
- Pearton, S.; Kang, B.; Kim, S.; Ren, F.; Gila, B.; Abernathy, C.; Lin, J.; Chu, S. Gan-based diodes and transistors for chemical, gas, biological and pressure sensing. J. Phys. Condens. Matter 2004, 16, R961. [Google Scholar] [CrossRef]
- Aliano, A.; Cicero, G.; Catellani, A. Origin of the accumulation layer at the InN/a-In2O3 interface. ACS Appl. Mater. Interfaces 2015, 7, 5415–5419. [Google Scholar] [CrossRef] [PubMed]
- Liu, J.; Dai, M.; Wang, T.; Sun, P.; Liang, X.; Lu, G.; Shimanoe, K.; Yamazoe, N. Enhanced gas sensing properties of SnO2 hollow spheres decorated with CeO2 nanoparticles heterostructure composite materials. ACS Appl. Mater. Interfaces 2016, 8, 6669–6677. [Google Scholar] [CrossRef] [PubMed]
- Sun, P.; Cai, Y.; Du, S.; Xu, X.; You, L.; Ma, J.; Liu, F.; Liang, X.; Sun, Y.; Lu, G. Hierarchical α-Fe2O3/SnO2 semiconductor composites: Hydrothermal synthesis and gas sensing properties. Sens. Actuators B Chem. 2013, 182, 336–343. [Google Scholar] [CrossRef]
- An, X.; Jimmy, C.Y.; Wang, Y.; Hu, Y.; Yu, X.; Zhang, G. WO3 nanorods/graphene nanocomposites for high-efficiency visible-light-driven photocatalysis and NO2 gas sensing. J. Mater. Chem. 2012, 22, 8525–8531. [Google Scholar] [CrossRef]
- Tanaka, A.; Hashimoto, K.; Kominami, H. Visible-light-induced hydrogen and oxygen formation over Pt/Au/WO3 photocatalyst utilizing two types of photoabsorption due to surface plasmon resonance and band-gap excitation. J. Am. Chem. Soc. 2014, 136, 586–589. [Google Scholar] [CrossRef] [PubMed]
- Chen, D.; Ye, J. Hierarchical WO3 hollow shells: Dendrite, sphere, dumbbell, and their photocatalytic properties. Adv. Funct. Mater. 2008, 18, 1922–1928. [Google Scholar] [CrossRef]
- Li, X.-L.; Lou, T.-J.; Sun, X.-M.; Li, Y.-D. Highly sensitive WO3 hollow-sphere gas sensors. Inorg. Chem. 2004, 43, 5442–5449. [Google Scholar] [CrossRef] [PubMed]
- Penza, M.; Tagliente, M.; Mirenghi, L.; Gerardi, C.; Martucci, C.; Cassano, G. Tungsten trioxide (WO3) sputtered thin films for a NOx gas sensor. Sens. Actuators B Chem. 1998, 50, 9–18. [Google Scholar] [CrossRef]
- Lee, D.-S.; Han, S.-D.; Huh, J.-S.; Lee, D.-D. Nitrogen oxides-sensing characteristics of WO3-based nanocrystalline thick film gas sensor. Sens. Actuators B Chem. 1999, 60, 57–63. [Google Scholar] [CrossRef]
- Tao, W.-H.; Tsai, C.-H. H2S sensing properties of noble metal doped WO3 thin film sensor fabricated by micromachining. Sens. Actuators B Chem. 2002, 81, 237–247. [Google Scholar] [CrossRef]
- Deng, L.; Ding, X.; Zeng, D.; Tian, S.; Li, H.; Xie, C. Visible-light activate mesoporous WO3 sensors with enhanced formaldehyde-sensing property at room temperature. Sens. Actuators B Chem. 2012, 163, 260–266. [Google Scholar] [CrossRef]
- Wang, G.; Ji, Y.; Huang, X.; Yang, X.; Gouma, P.-I.; Dudley, M. Fabrication and characterization of polycrystalline WO3 nanofibers and their application for ammonia sensing. J. Phys. Chem. B 2006, 110, 23777–23782. [Google Scholar] [CrossRef] [PubMed]
- Guruvenket, S.; Rao, G.M. Bias induced structural changes in tungsten nitride films deposited by unbalanced magnetron sputtering. Mater. Sci. Eng. B 2004, 106, 172–176. [Google Scholar] [CrossRef]
- Li, G.; Song, J.; Pan, G.; Gao, X. Highly Pt-like electrocatalytic activity of transition metal nitrides for dye-sensitized solar cells. Energy Environ. Sci. 2011, 4, 1680–1683. [Google Scholar] [CrossRef]
- Cui, S.; Pu, H.; Wells, S.A.; Wen, Z.; Mao, S.; Chang, J.; Hersam, M.C.; Chen, J. Ultrahigh sensitivity and layer-dependent sensing performance of phosphorene-based gas sensors. Nat. Commun. 2015, 6. [Google Scholar] [CrossRef] [PubMed]
- Kulkarni, G.S.; Reddy, K.; Zhong, Z.; Fan, X. Graphene nanoelectronic heterodyne sensor for rapid and sensitive vapour detection. Nat. Commun. 2014, 5, 4376. [Google Scholar] [CrossRef] [PubMed]
- Sun, Y.-F.; Liu, S.-B.; Meng, F.-L.; Liu, J.-Y.; Jin, Z.; Kong, L.-T.; Liu, J.-H. Metal oxide nanostructures and their gas sensing properties: A review. Sensors 2012, 12, 2610–2631. [Google Scholar] [CrossRef] [PubMed]
- Ganbavle, V.; Inamdar, S.; Agawane, G.; Kim, J.; Rajpure, K. Synthesis of fast response, highly sensitive and selective Ni:ZnO based NO2 sensor. Chem. Eng. J. 2016, 286, 36–47. [Google Scholar] [CrossRef]
- Koziej, D.; Bârsan, N.; Weimar, U.; Szuber, J.; Shimanoe, K.; Yamazoe, N. Water–oxygen interplay on tin dioxide surface: Implication on gas sensing. Chem. Phys. Lett. 2005, 410, 321–323. [Google Scholar] [CrossRef]
- Wang, C.; Li, X.; Feng, C.; Sun, Y.; Lu, G. Nanosheets assembled hierarchical flower-like WO3 nanostructures: Synthesis, characterization, and their gas sensing properties. Sens. Actuators B Chem. 2015, 210, 75–81. [Google Scholar] [CrossRef]
- Wang, L.; Dou, H.; Lou, Z.; Zhang, T. Encapsuled nanoreactors (Au@SnO2): A new sensing material for chemical sensors. Nanoscale 2013, 5, 2686–2691. [Google Scholar] [CrossRef] [PubMed]
- Bao, M.; Chen, Y.; Li, F.; Ma, J.; Lv, T.; Tang, Y.; Chen, L.; Xu, Z.; Wang, T. Plate-like p–n heterogeneous NiO/WO3 nanocomposites for high performance room temperature NO2 sensors. Nanoscale 2014, 6, 4063–4066. [Google Scholar] [CrossRef] [PubMed]
- Nandi, D.K.; Sen, U.K.; Sinha, S.; Dhara, A.; Mitra, S.; Sarkar, S.K. Atomic layer deposited tungsten nitride thin films as a new lithium-ion battery anode. Phys. Chem. Chem. Phys. 2015, 17, 17445–17453. [Google Scholar] [CrossRef] [PubMed]


© 2016 by the authors; licensee MDPI, Basel, Switzerland. This article is an open access article distributed under the terms and conditions of the Creative Commons Attribution (CC-BY) license (http://creativecommons.org/licenses/by/4.0/).
Share and Cite
Qu, F.; He, B.; Guarecuco, R.; Yang, M. Mesoporous WN/WO3-Composite Nanosheets for the Chemiresistive Detection of NO2 at Room Temperature. Inorganics 2016, 4, 24. https://doi.org/10.3390/inorganics4030024
Qu F, He B, Guarecuco R, Yang M. Mesoporous WN/WO3-Composite Nanosheets for the Chemiresistive Detection of NO2 at Room Temperature. Inorganics. 2016; 4(3):24. https://doi.org/10.3390/inorganics4030024
Chicago/Turabian StyleQu, Fengdong, Bo He, Rohiverth Guarecuco, and Minghui Yang. 2016. "Mesoporous WN/WO3-Composite Nanosheets for the Chemiresistive Detection of NO2 at Room Temperature" Inorganics 4, no. 3: 24. https://doi.org/10.3390/inorganics4030024
APA StyleQu, F., He, B., Guarecuco, R., & Yang, M. (2016). Mesoporous WN/WO3-Composite Nanosheets for the Chemiresistive Detection of NO2 at Room Temperature. Inorganics, 4(3), 24. https://doi.org/10.3390/inorganics4030024