Article

Lanthanide Tris-Acetylacetonate Complexes for Luminescent Thermometry: From Isolated Compounds to Hybrid Prussian Blue Core–Silica Shell Nanoparticles

ICGM, University Montpellier, CNRS, ENSCM, 34293 Montpellier, France
*
Authors to whom correspondence should be addressed.
Inorganics 2025, 13(9), 304; https://doi.org/10.3390/inorganics13090304
Submission received: 25 July 2025 / Revised: 3 September 2025 / Accepted: 8 September 2025 / Published: 11 September 2025
(This article belongs to the Special Issue Synthesis and Application of Luminescent Materials, 2nd Edition)

Abstract

Precise remote temperature sensing at the micro- and nanoscale is a growing necessity in modern science and technology. We report a series of luminescent tris-acetylacetonate lanthanide complexes, Ln(acac)3(H2O)2 (Ln = Eu (1Eu), Tb (1Tb), Yb (1Yb)); acac = acetylacetonate), operating as self-referenced thermometers in the 290–350 K range, both in the solid state and when embedded in hybrid nanoparticles. Among the investigated systems, the Eu3+ complex exhibits excellent lifetime-based thermometric performance, achieving a maximum relative sensitivity (Srmax) of 2.9%·K−1 at 340 K with a temperature uncertainty (δT) as low as 0.02 K and an average temperature uncertainty ( δ T ¯ ) of 0.5 K, placing it among the most effective ratiometric lanthanide-based luminescent thermometers reported to date. The Yb3+ analog enables intensity-based thermometry in the near-infrared domain with a good sensitivity Srmax = 0.5%·K−1 at 293 K, δT = 0.5 K at 303 K, and δ T ¯ = 1.6 K. These molecular thermometers were further incorporated into the shell of Prussian Blue@SiO2 core–shell nanoparticles. Among the resulting hybrids, PB@SiO2-acac/(1Tb/1Eu) (with a Tb/Eu ratio of 2/8) stood out by enabling ratiometric temperature sensing based on the Eu3+ 5D07F2 lifetime, with satisfactory parameters (Srmax = 0.9%·K−1, δT = 0.21 K at 303 K, and δ T ¯ = 1.1 K). These results highlight the potential of simple coordination complexes and their nanohybrids for advanced luminescent thermometry applications.

Graphical Abstract

1. Introduction

Accurate and remote temperature sensing at the micro- and nanoscale is of paramount importance across a wide range of applications, from biology and medicine to cryogenics [1,2,3]. Over several recent decades, a considerable effort has been devoted to the development and optimization of luminescent thermal probes based on lanthanide ions (Ln3+), which have emerged as powerful tools thanks to their broad operating temperature ranges in both the visible and near-infrared (NIR) regions, good precision, remote sensing capabilities, and high resolution [1]. In line with this, different types of Ln3+-based luminescent thermometers have been designed, including Ln3+-based nanocomposites [4], upconverting nanoparticles [5,6,7,8], metal–organic frameworks [9,10,11,12,13,14,15], and coordination complexes [16,17]. Each of these systems presents specific strengths and limitations [18,19]. These probes are now capable of delivering remote and localized temperature readings with sub-10 μm spatial resolution, acquisition times under 10 μs, and maximal thermal sensitivity (Srmax) often exceeding 1%·K−1, which can be viewed as a benchmark for evaluating luminescent thermometric performance [19,20,21,22,23].
Several approaches have been developed to exploit the temperature dependence of luminescence in these systems [1,2,3]. Among them we can cite the most often used: (i) Intensity-based (non-ratiometric) thermometry, which relies on the absolute emission intensity (or integrated area under a peak) of a single emission band. While this method is straightforward, it requires an external reference to account for fluctuations in excitation power, probe concentration, or optical path length, which may limit its accuracy and reproducibility. (ii) Ratiometric thermometry, which is based on the luminescence intensity ratio (LIR) between two emission bands. These bands can originate from two distinct lanthanide ions or from different electronic transitions of the same ion. Ratiometric methods inherently correct for many external variables, such as probe concentration and excitation power, offering improved robustness and reliability. (iii) Lifetime-based thermometry, which exploits the temperature dependence of the excited-state lifetime of the luminescent ions. This approach does not depend on emission intensity and is particularly attractive for quantitative and non-invasive thermometry. Notably, lifetime-based methods are independent of factors such as fluorophore concentration, light scattering, and photobleaching, making them suitable for measurements even in turbid or complex media. Each of these approaches has its own advantages and limitations, and the choice of method depends on the specific application requirements, such as spatial resolution, sensitivity, acquisition speed, and environmental conditions.
Among the above-mentioned Ln3+-based temperature probes, coordination compounds incorporating Ln3+ ions have proven particularly promising. They combine the well-known benefits of coordination chemistry, including well-defined crystal structures, the ability to substitute lanthanide ions without altering the framework, low density, mechanical stability, and mild synthesis conditions, with valuable photophysical properties. These include long-lived emissions (on the millisecond scale) in the visible and/or NIR domains, arising from 4f–4f electronic transitions. These transitions provide sharp emission lines, large Stokes shifts, and high quantum yields [24,25]. Importantly, the temperature-dependent luminescence of these compounds can be precisely tuned by selecting appropriate lanthanide ions and adjusting their ratios, modifying the Ln3+ coordination environment, or selecting appropriate antenna ligands. Among the different Ln3+ ions, the most commonly used is the ratiometric (LIR) approach employing the Tb3+/Eu3+ pair, which is integrated in specific ratios into polynuclear discrete complexes or coordination networks or used as a solid solution of two mononuclear complexes [9,12,13,16,26,27,28,29,30,31,32,33,34,35]. In these systems, the Tb3+/Eu3+ ratio not only influences the luminescence response to temperature, which is sometimes mediated by Tb-to-Eu energy transfer, but also enables the optimization of thermometric performance. Complexes incorporating other lanthanide ions, such as Eu3+ [36,37,38,39,40], Tb3+ [41], Dy3+ [41,42], Nd3+ [43,44], or Yb3+ [45,46], have also been explored.
In parallel with the development of Ln3+-based coordination complexes as luminescent thermometers, considerable efforts have focused on integrating them into functional (nano)materials, such as films or nanoparticles, which provide protection and enhance stability, thereby overcoming the limitations faced by traditional coordination complexes in diverse environments. We can cite the integration of Ln3+ compounds into polymer films, which facilitates remote, spatially resolved temperature sensing in solid-state devices, offering advantages in terms of stability and ease of use [47,48,49,50,51,52,53]. Additionally, incorporating them into silica or polymer nanoparticles enables temperature readout in aqueous and biological media, which constitute environments where most lanthanide-based coordination complexes struggle to perform effectively [54,55,56,57]. The current challenge, however, lies in integrating these luminescent Ln3+-based temperature probes into multifunctional nanoparticles that combine temperature sensing with localized heating at the nanoscale. Such integration extends the application of Ln3+-based complexes beyond passive sensing, enabling real-time thermal feedback directly within the multifunctional nanoparticles capable of generating localized heating upon exposure to external stimuli, such as magnetic fields or light irradiation, thus enabling the precise monitoring of nanoscale temperature elevations [58,59,60,61]. This approach is particularly challenging as it requires preserving the stability and functionality of both thermometric and heating properties within nanoparticles. In this context, dual-emissive β-diketonate Eu3+/Tb3+ and Sm3+/Eu3+ complexes working as ratiometric thermometric probes have been successfully incorporated into a P4VP-b-P(PMEGA-co-PEGA) copolymer [59,61] and in a silica shell [53,62] surrounding magnetic iron oxide nanoparticles able to generate local heat upon exposure to an alternating current magnetic field. On the other hand, multifunctional systems that combine photothermal nanoheaters capable of generating heat under light irradiation with Ln3+ complexes as thermal probes are scarcely reported [63]. In this regard, we recently introduced a new class of multifunctional Prussian Blue (PB) nanoparticles coated with a mesoporous silica shell and loaded with the luminescent [(Tb/Eu)9(acac)163-OH)84-O)(μ4-OH)]·H2O complex [64]. These nanoparticles provide a macroscopic temperature rise upon light irradiation at 808 nm and exhibit characteristic Tb3+ and Eu3+ temperature-dependent luminescence, with enhanced Tb3+-to-Eu3+ energy transfer, making them efficient as luminescent thermometers with intensity-based methods. They operate in the 293–353 K (20–80 °C) range, with a maximal relative thermal sensitivity of 0.75%·K−1 at 293 K (20 °C).
In the present work, we investigated a series of tris-β-diketonate complexes Ln(acac)3(H2O)2 (Ln = Eu (1Eu), Tb (1Tb), Yb (1Yb)) (Figure 1) as thermometric probes as standalone compounds or as a mixture (Ln = Tb3+/Eu3(1Tb/Eu)) and also integrated into hybrid PB core@silica shell nanoparticles. In fact, among various mononuclear Ln3+ complexes, tris-acetylacetonate complexes have been chosen because of their well-known excellent luminescent properties in the visible and NIR regions, including long-lived emissions and efficient ligand-to-metal energy transfer, small size, and potential to coordinate free acac silica shell functionality [65]. While thermometric studies have been carried out on several Ln(acac)3(L)2 complexes with L = trioctylphosphine oxide [66], 1,10-phenanthroline [67], and 2-amidinopyridine [41], showcasing their promising potential, systematic investigations of Ln(acac)3(H2O)2 compounds are still surprisingly lacking [68]. Moreover, their integration in a hybrid structure for the design of hybrid temperature probes has also been only scarcely explored [69]. Thus, we demonstrate here that the mixed Tb3+/Eu3+- and Yb3+-based complexes can be used as self-referenced thermometers in the 290–350 K range, providing intensity-based readouts in the visible (Srmax = 3.2%·K−1 at 320 K) and NIR (0.5%·K−1 at 293 K) regions, respectively. The Eu3+ analog, on the other hand, is particularly suitable for lifetime-based thermometry, with Srmax = 2.9%·K−1 at 340 K. All of these complexes were tested as temperature probes encapsulated into a silica shell of photothermal core@shell PB@SiO2-acac nanoparticles. Among them, the PB@SiO2-acac/(1Tb/1Eu) nanoparticles (with Tb/Eu ratio = 2/8) emerged as promising candidates for ratiometric temperature sensing, based on the temperature dependence of the Eu3+ 5D07F2 transition lifetime, exhibiting satisfactory thermometric performance with a maximum relative sensitivity of 0.9%·K−1, δT = 0.21 K, at 303 K and an average temperature uncertainty in the whole temperature range of 1.1 K.

2. Results and Discussion

2.1. Tris-Acetylacetonate Ln3+ Compounds as Luminescent Thermometers

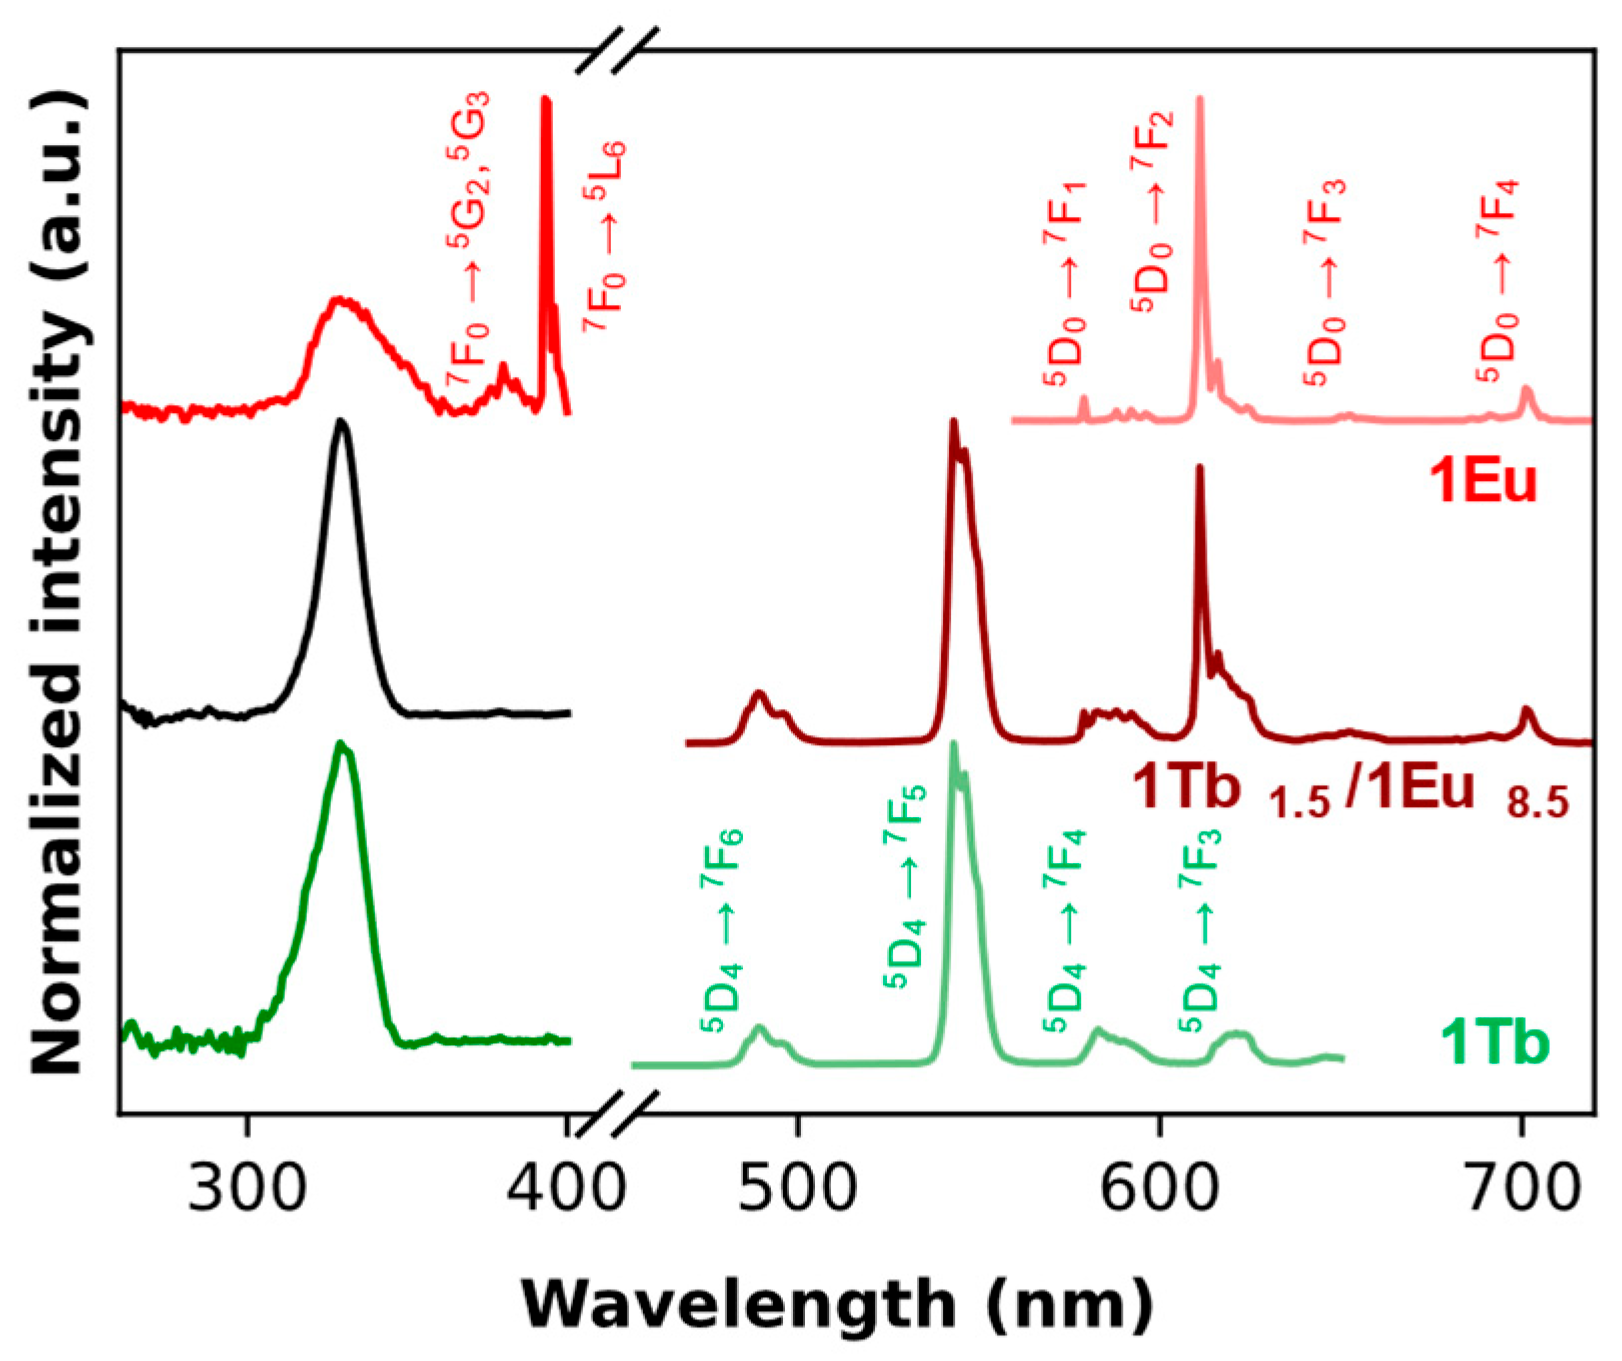
The temperature-dependent photoluminescence properties for a series of tris-β-diketonate complexes Ln(acac)3(H2O)2 (Ln = Eu3+ (1Eu), Tb3+ (1Tb), Yb3+ (1Yb)) and a physical mixture of Tb3+/Eu3+ (1Tb/Eu) were investigated on the visible and NIR windows. The room temperature excitation and emission spectra for 1Eu and 1Tb complexes are shown in Figure 2. The excitation spectra for both compounds demonstrate the expected acacligand antenna effect, with a large excitation band centered at ~330 nm. However, for 1Eu, the antenna effect is relatively weak, as evidenced by the comparatively small absorption band of acac and the prominent presence of direct f–f excitation bands such as 7F05G2, 5G3 and 7F05L6 transitions. In contrast, the 1Tb complex exhibits a stronger antenna effect, with a broad dominating excitation band at 330 nm. This difference can be attributed to the inherently low molar absorption coefficients of Eu3+ f–f transitions and their limited sensitivity to ligand sensitization compared to Tb3+. The excitation spectrum of the 1Tb1.5/1Eu8.5 solid mixture (Figure 2) also shows a prominent band at 330 nm, suitable for excitation of both lanthanides, with the antenna effect dominated by the Tb3+ contribution.
The emission spectra of Eu3+ and Tb3+ analogs (under excitation at 330 nm) show a series of 5D07FJ (J = 0–4) transitions for Eu3+ and 5D47FJ (J = 6 − 2) transitions for Tb3+ (Figure 2). The emission spectrum of the 1Tb1.5/1Eu8.5 sample monitored under this excitation wavelength displays the expected transitions corresponding to both lanthanides. The intensity ratio between the integrated areas of the main emissive transitions of Tb3+ (540 nm) and Eu3+ (611 nm), I540/I611, is 3.9 (see Figure 3c,d). The Tb/Eu molar ratio of 1.5/8.5 was selected to optimize the relative intensities of these transitions, thereby maximizing the signal-to-noise ratio for subsequent temperature-dependent luminescence measurements. As an example, the emission spectra for 1Tb8/1Eu2 and 1Tb6/1Eu4 samples are presented in Figure S1 (Electronic Supporting Information (ESI)). Their spectra reflect the weaker antenna effect of Eu3+, resulting in a lower emission intensity.
We first explored the potential of these compounds as luminescent thermometers using intensity-based (integrated area) thermometry, either in non-ratiometric (for 1Tb and 1Eu) or ratiometric mode (for 1Tb1.5/1Eu8.5). To evaluate their performance, temperature-dependent emission spectra were recorded in the 290–350 K range. Figure 3a,b display the temperature-dependent emission spectra and intensity (integrated area) variations of the main Eu3+ 5D07F2 (I611) transition, while similar data for the Tb3+ analog (5D47F5, I545) are shown in Figure S2a,b (ESI). Note that the main europium transition 5D07F2 exhibits a significant temperature variation, contrasting sharply with the slight temperature evolution observed for the terbium analog at 545 nm (5D47F5).
For the 1Tb1.5/1Eu8.5 powder, Figure 3c presents the temperature-dependent spectra, and Figure 3d shows the evolution of the luminescence intensity ratio (LIR = I5D27F5/I5D07F2).
The absolute sensitivity of a temperature sensor is defined as the absolute value of the derivative of the measured signal as a function of the variable that is to be detected. In the case of a temperature sensor based on luminescence measurement, the measured signal (L) can be the light intensity, light intensity ratio (LIR), or lifetime. Then, the absolute sensitivity can be defined as follows:
S a T = L T T
The relative thermal sensitivity (Sr) is the parameter allowing the comparison of thermometric performance among different types of thermometers [71]. The Sr value represents the normalization of the absolute sensitivity (Sa(T)) per the measured signal:
S r T = S a T L T
The maximal relative thermal sensitivities (Srmax) extracted from these data are equal to 1.0%·K−1 (at 353 K) for 1Tb, 6.5%·K−1 (at 338 K) for 1Eu, and 3.2%·K−1 (at 320 K) for 1Tb1.5/1Eu8.5 (see Table 1). Note that these Srmax values are equal to or higher than 1%·K−1, which is commonly taken as the benchmark for good luminescent thermometers [19].
Another parameter that must be used to compare sensors is the thermal uncertainty, δT, which should be as low as possible:
δ T = δ L S a T = δ L L T × S r T
This thermal uncertainty is calculated by using three consecutive cyclic temperature measurements in order to evaluate the reproducibility of the thermometer response. This parameter enables a more comprehensive comparison by accounting for the inherent uncertainty of the measured signal (δL in our case) and the absolute sensitivity. In this study, in addition to the conventional temperature uncertainty δT at a given temperature, we also calculated the average thermal uncertainty over the investigated temperature range, δ T ¯ :
δ T ¯ = 1 N i = 1 N δ T i
The best thermal uncertainty of 0.1 K (at 303 K) has been obtained for the 1Eu analog using a non-ratiometric approach, while 1Tb1.5/1Eu8.5 also exhibits a suitable value for satisfactory temperature detection of 1.1 K (at 333 K) using a ratiometric method. Note that the temperature uncertainty of 1.7 K at 333 K obtained for the 1Tb analog is higher compared to the other compounds, particularly the 1Eu analog measured with the non-ratiometric method. The corresponding average thermal uncertainties over the whole investigated temperature range, δ T , ¯ are equal to 0.2 K for 1Eu, 1.5 K for the 1Tb1.5/1Eu8.5 powder mixture, and 5.7 K for 1Tb.
Lifetime-based thermometry represents a method relying on the temperature-dependent excited-state lifetime of the luminescent ion, which offers the advantages of being independent of emission intensity, fluorophore concentration, and environment. This self-referenced nature makes the lifetime a particularly robust parameter for accurate temperature sensing. In the context of classical relaxation, the fluorescence intensity, I, exhibits an exponential behavior following a pulse of light, which is characterized by a pre-exponential factor, A, and a lifetime, τ:
I = A × exp t τ
In the case of a mixing of fluorophore or non-exponential decays, the fluorescence intensity can be written as a sum of exponential lifetimes:
I = i = 1 N A i × exp t τ i
From this equation, two average lifetimes can be obtained, the amplitude average lifetime τamp and the intensity average lifetime τint:
τ a m p = i = 0 N A i × τ i i = 0 N A i
and
τ i n t = i = 0 N A i × τ i 2 i = 0 N A i × τ i
In order to determine the average lifetimes, it is necessary to fit the experimental data with a number N of exponential functions. Another way to obtain these lifetimes is to use the integration formula of the experimental fluorescence intensity, Iexp: [72,73]
τ a m p = 0 I e x p t   d t I e x p ( 0 )
and
τ i n t = 0 t × I e x p t   d t 0 I e x p t   d t
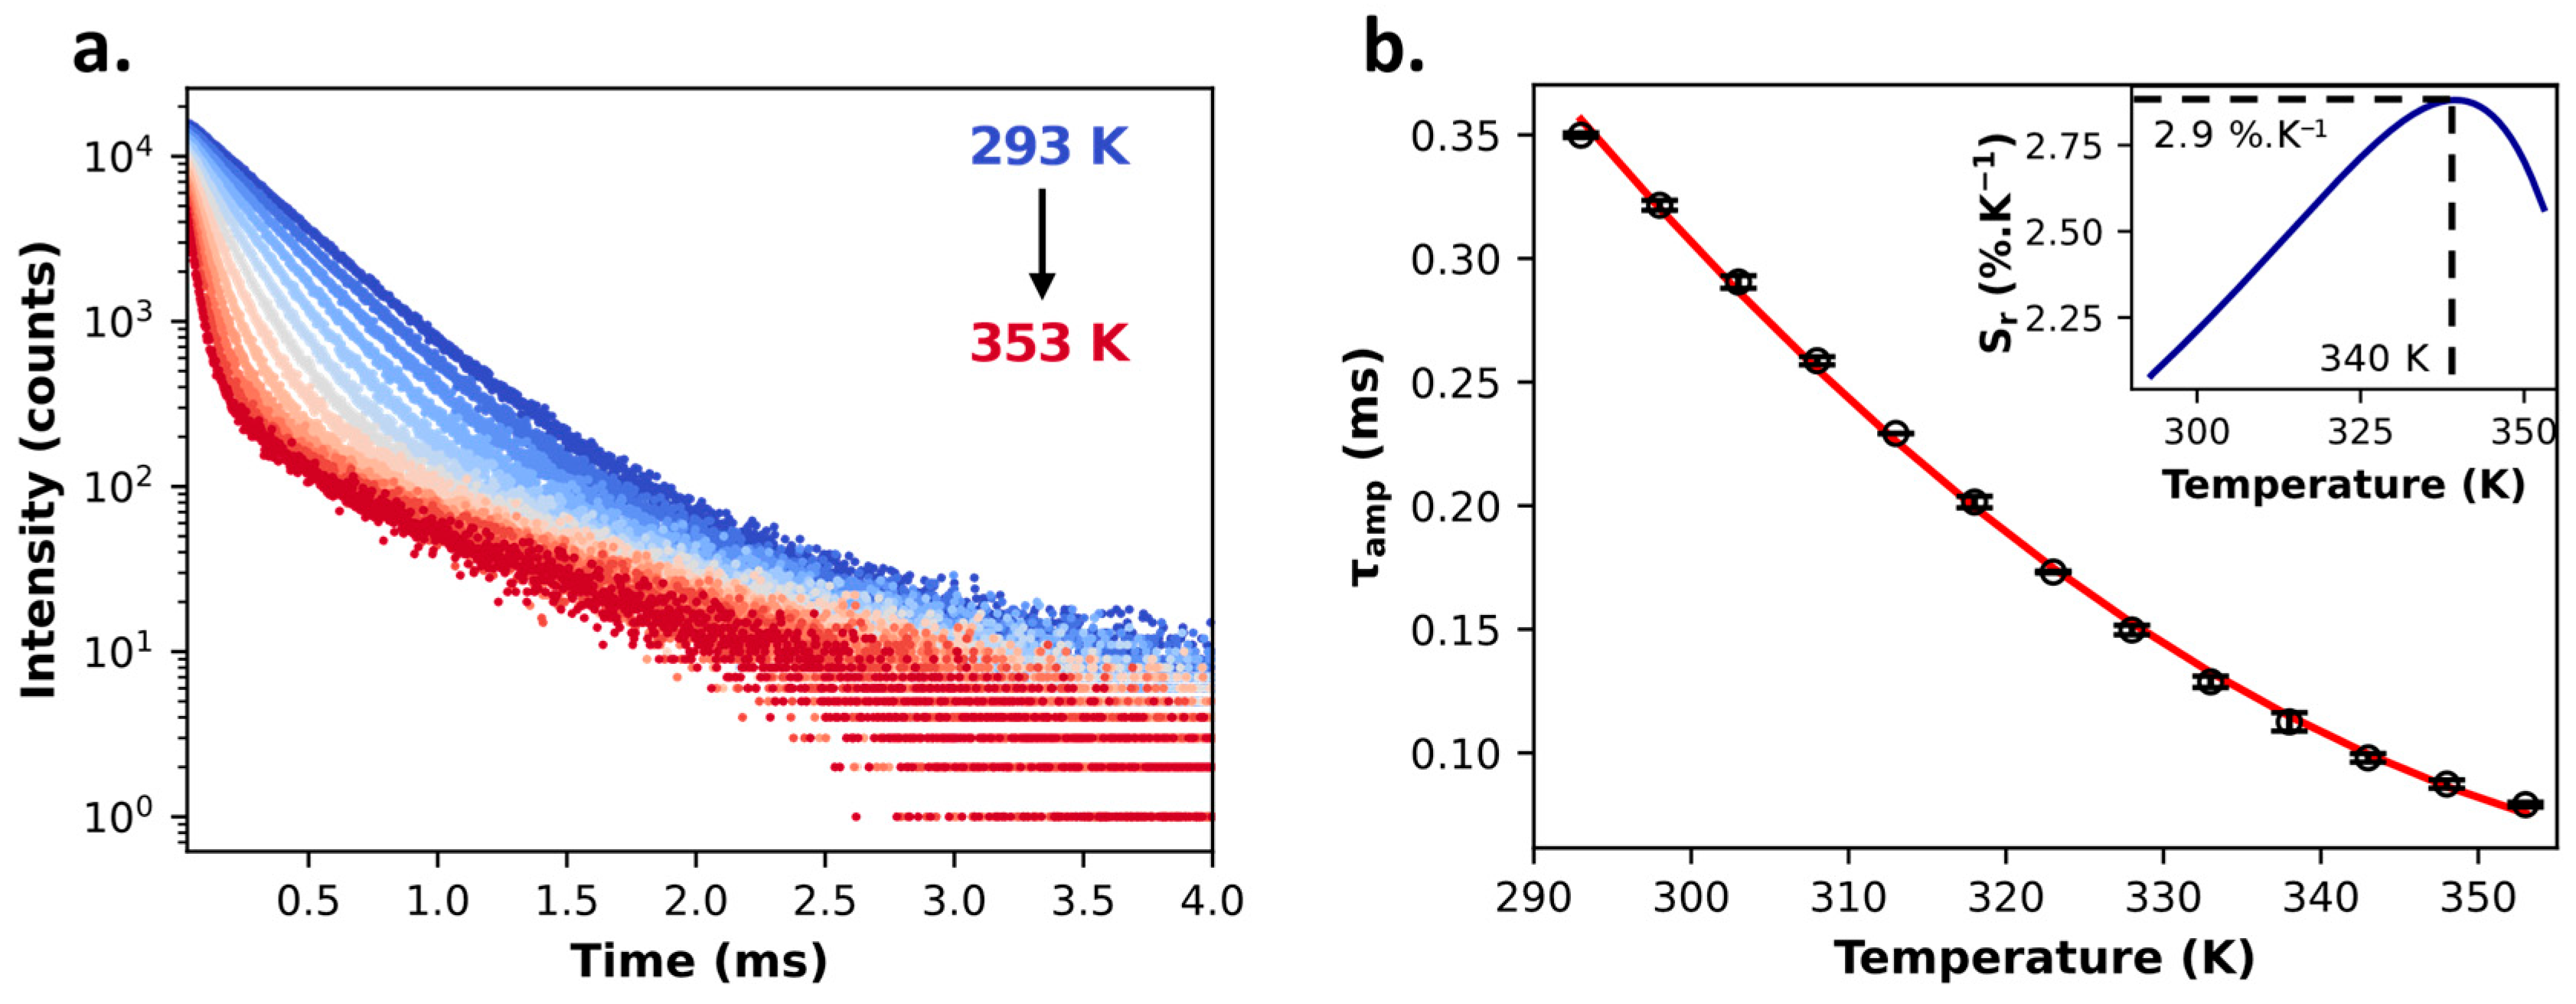
In this work, we calculated lifetimes by using the integration formula for the amplitude-averaged lifetime. Figure 4a illustrates the solid-state 1Eu fluorescence intensity as a function of time in the 293–353 K temperature range under an excitation of 330 nm and an emission wavelength of 611 nm. The amplitude average lifetime is displayed in Figure 4b, where black circles and error bars represent the average lifetime and the uncertainty over three consecutive temperature cycles, respectively. The red line represents a two-order polynomial fit. The temperature dependence of Sr was calculated from the extracted calibration curve and showed a maximum value equal to 2.9%·K−1 at 340 K. The calculated uncertainty of the temperature is equal to δT = 0.02 K at 313 K and the average uncertainty over the whole temperature range is δ T ¯ = 0.5 K. Although the Srmax value obtained here is lower than that achieved using the integrated area method for the same compounds, the latter not only represents the best value among the investigated systems, but also compares favorably with the highest values reported in the literature for efficient luminescent thermometers, highlighting a robust high-precision nanothermometer utilizing lifetime measurements [19].
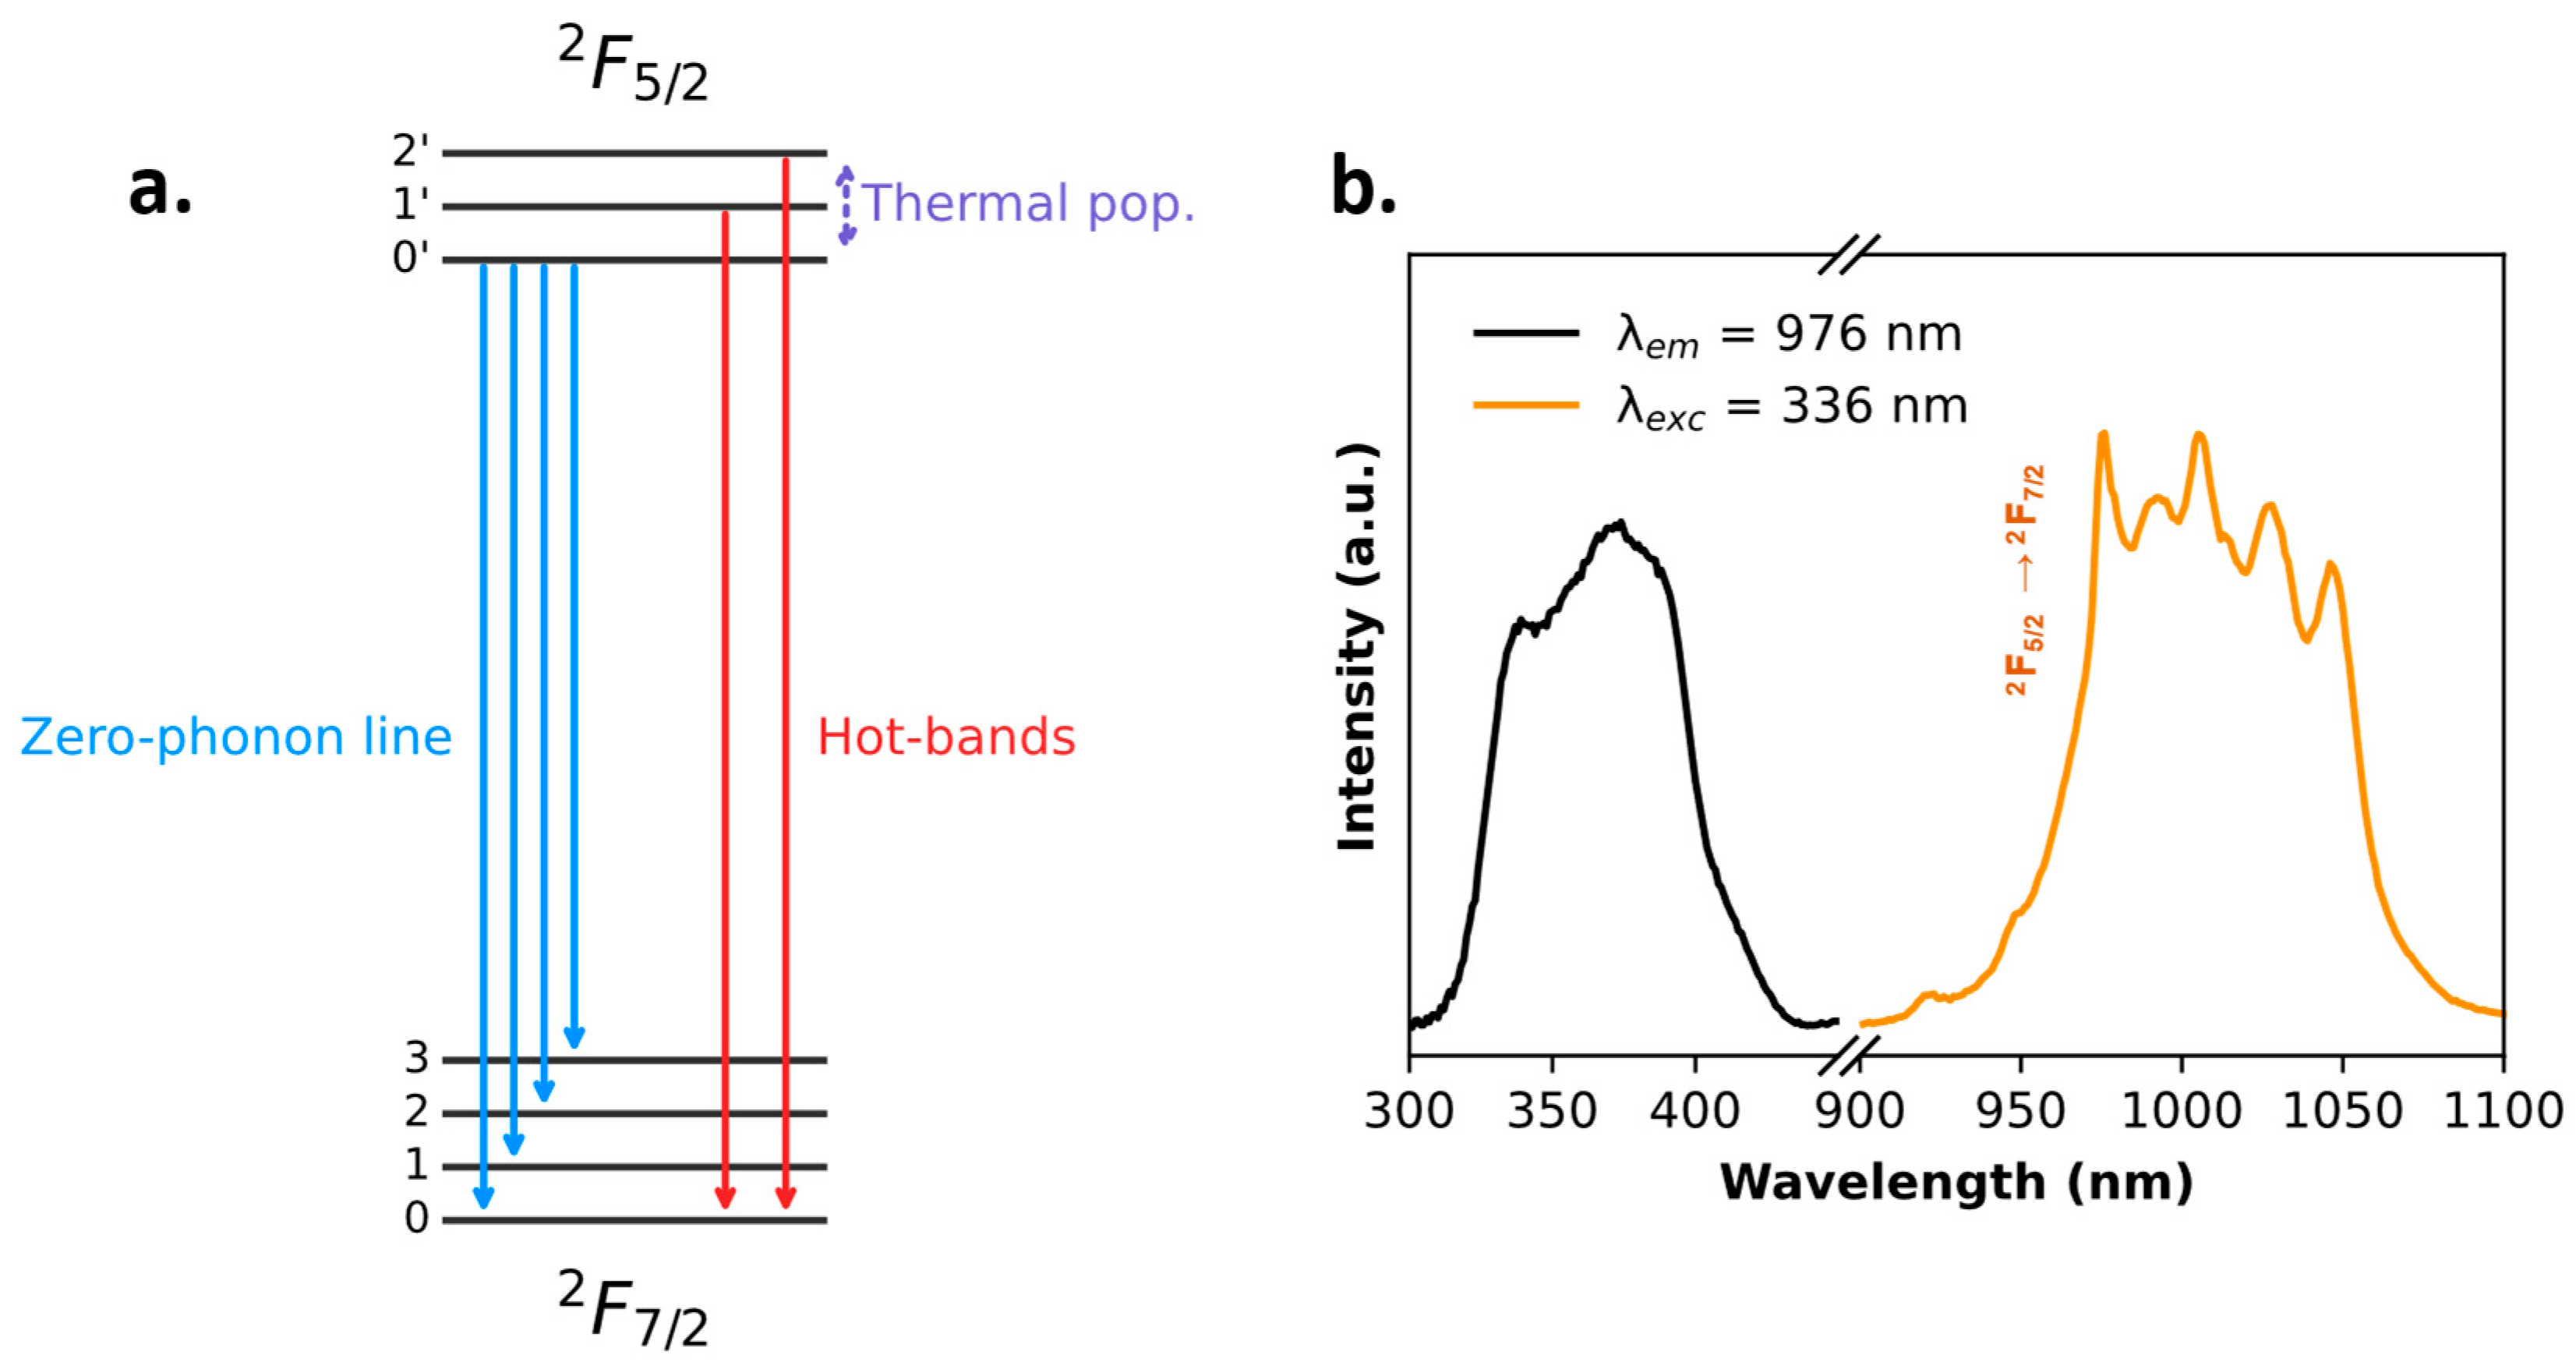
In contrast to the extensively studied Tb3+- and Eu3+-based luminescent thermometers, reports on Yb3+-based coordination compounds for thermometric applications remain relatively scarce [45,46]. The luminescence transition of Yb3+ between the excited state 2F5/2 and the ground state 2F7/2 involves vibrational sublevels of the ground state. The energy and population of these vibrational levels are influenced by the local chemical environment and crystal field. Their population follows a Boltzmann distribution, leading to increased occupation of the excited vibrational sublevel at higher temperatures. As a result, emissions occur from both the fundamental and thermally populated vibrational states, producing temperature-dependent hot band features. This phenomenon is schematically illustrated in Figure 5a. This behavior allows for ratiometric thermometry in the NIR range based on monitoring the intensity ratios between selected components [74]. In this context, we investigated the potential of the 1Yb complex as an emissive thermometer, taking advantage of the ratiometric intensity-based approach by monitoring the LIR within the main 2F5/22F7/2 transition, comparing spectral regions differently affected by hot bands. The room temperature excitation spectrum of 1Yb displays a broad band, indicating that the antenna effect of the β-diketonate ligands efficiently sensitizes the Yb3+ ion through energy transfer (Figure 5b). The corresponding emission spectrum obtained under excitation at 336 nm shows the fluorescence of Yb3+ in the wavelength range of 900–1100 nm, consistent with the 2F5/22F7/2 transition. Despite the measurement being performed at room temperature, several Stark sublevels remain distinguishable. This observation suggests limited thermal broadening under these conditions.
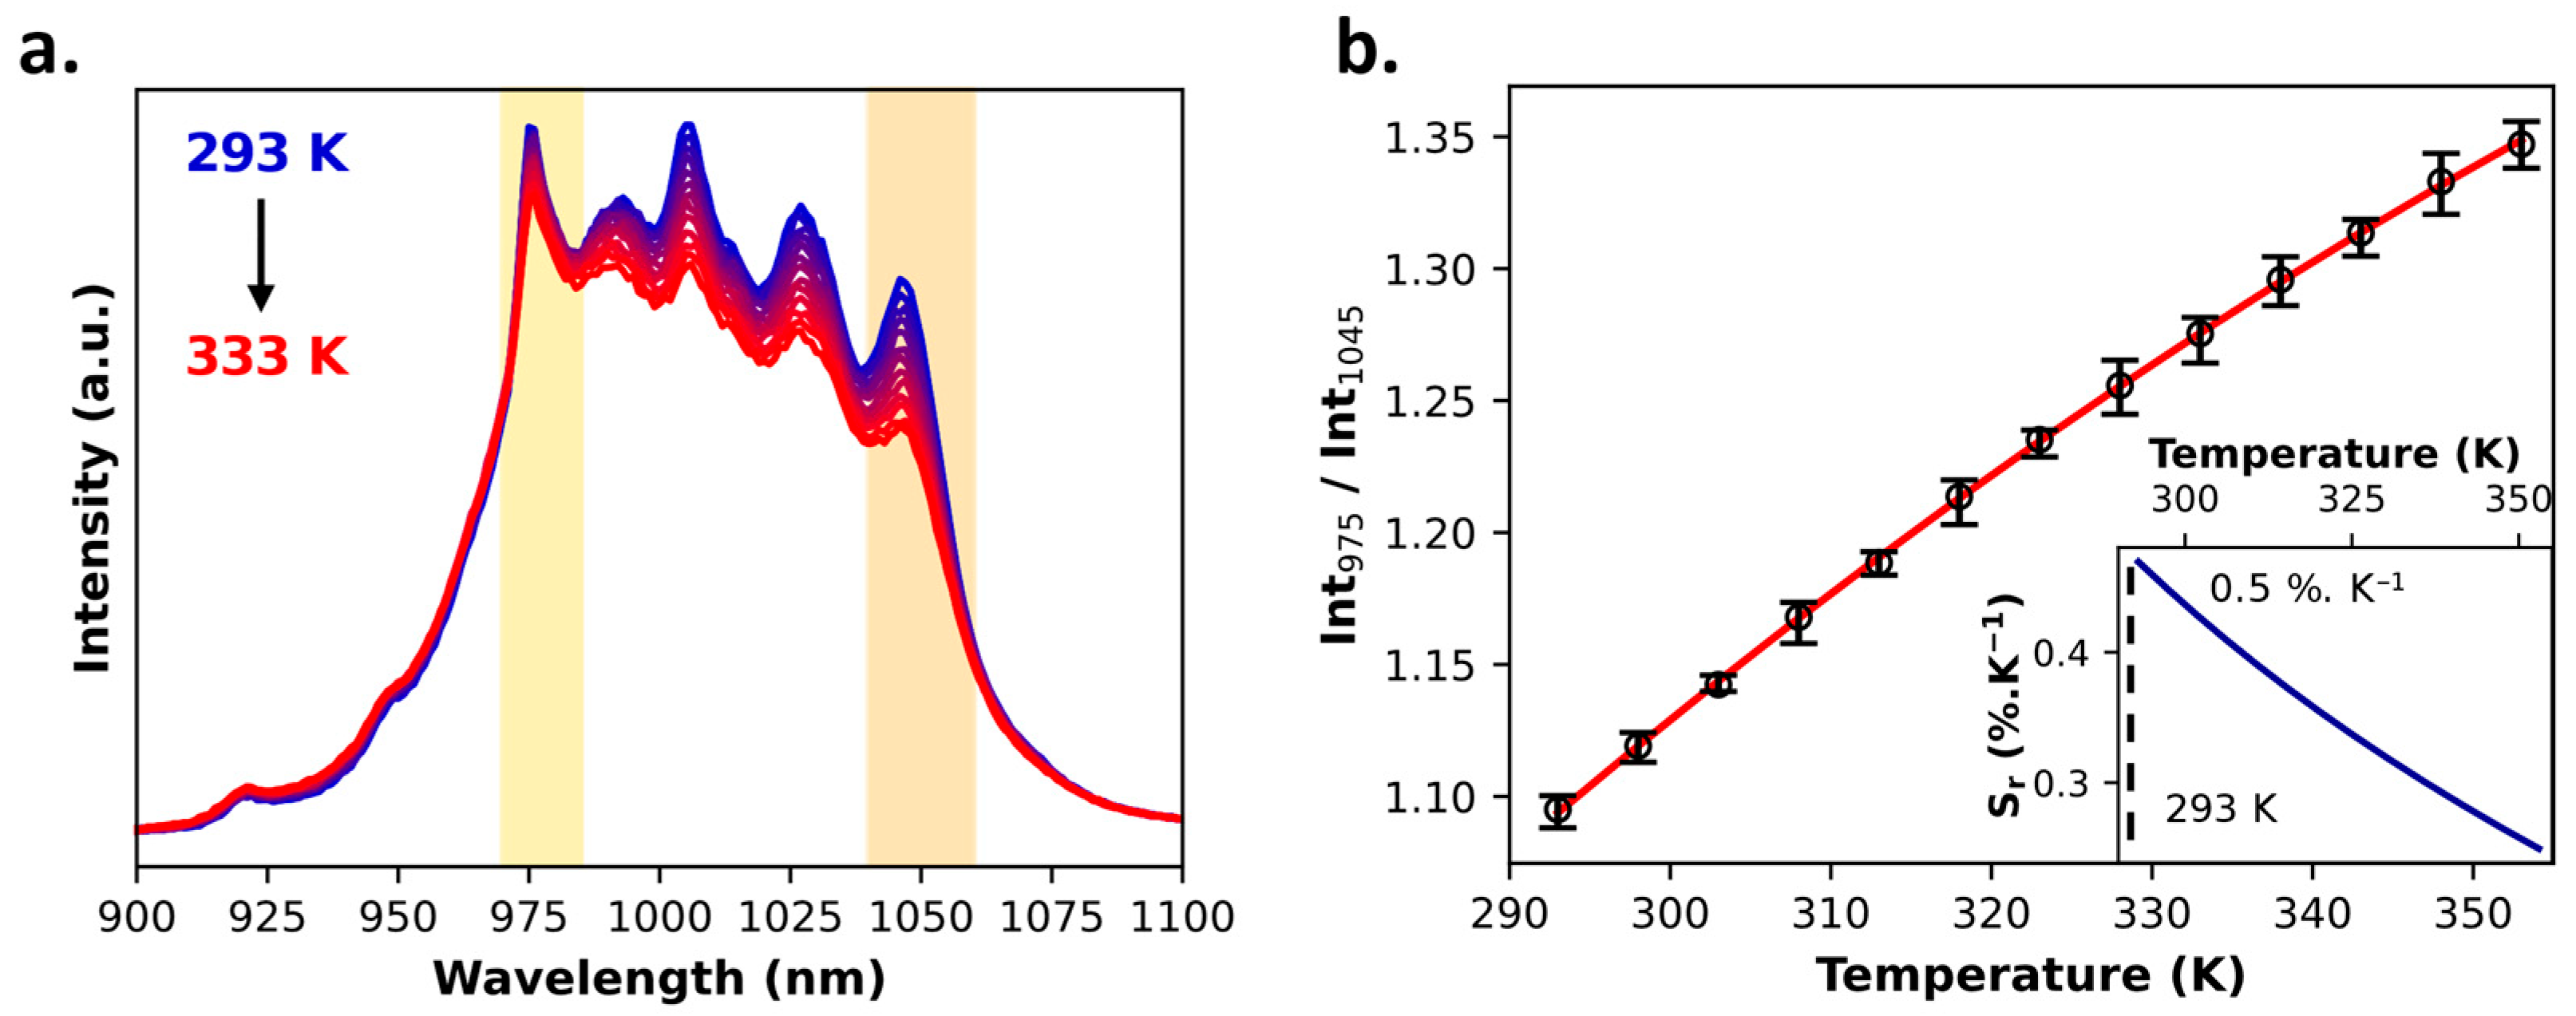
Figure 6a shows the emission spectra of 1Yb recorded in the 290–350 K temperature range, demonstrating that the influence of temperature is relatively weak below 985 nm, while the bands above 985 nm exhibit a clear temperature dependence. This behavior can be understood in light of the hot band mechanism previously discussed. As temperature increases, the overall luminescence intensity generally decreases, but in the higher-energy region (below 985 nm), hot bands emerge and partially compensate for this luminescence loss. Conversely, at lower energies (longer wavelengths), hot bands are less significant, leading to a more pronounced decrease in emission intensity with increasing temperature. Based on this, the temperature dependence of LIR is evaluated using two spectral intervals: 970–985 nm, where the hot band contribution is maximal, and 1040–1060 nm, where hot bands are less pronounced. This LIR, taken as the ratio of the integrated emission areas in these two regions, is shown in Figure 6b. The associated uncertainty, which was calculated from three temperature cycles, is represented by the error bars. The temperature dependence of Sr presented in the inset of Figure 6b indicates that the Srmax value is equal to 0.5%·K−1 at 293 K. This latter value falls within the range of values (between 0.4% and 1.3%) reported for other good Yb3+-based nanothermometers in the NIR region obtained using a single-band ratiometric approach. The calculated uncertainty is 0.5 K at 303 K, which is notably low compared to previously reported Yb3+-based thermometers such as [Yb2(valdien)2(NO3)2], which demonstrated a sensitivity of 0.50% and a temperature uncertainty of 4 K over the 80–320 K range [45]. The average uncertainty for 1Yb for all temperatures investigated is 1.6 K.
Table 1 summarizes the main thermometric parameters of four investigated luminescent thermometers. The first three compounds, which operate in the visible spectral region, exhibit relatively high maximal relative sensitivities in comparison to the commonly accepted criterion of Srmax > 1%·K−1 [19] and low temperature uncertainties of δT < 2 K. While non-ratiometric in the employment of intensity approach, sample 1Eu stands out in particular, reaching an Srmax value of 6.5%·K−1, and provides a temperature uncertainty as low as 0.1 K at 303 K and an average uncertainty over the whole temperature range of 0.2 K. These values are comparable to the ones reported in the literature for Eu-based systems [20]. In addition, this sample also allows for self-referenced temperature readout through luminescence lifetime measurements with excellent sensitivity and uncertainties: Srmax value of 2.9%·K−1, δT = 0.02 K, and δ T ¯ = 0.5 K. The Yb3+ sample, on the other hand, enables self-referenced thermometry in the NIR region through a single-band intensity-based approach with higher maximal relative sensitivity (0.5%·K−1) and low δT and δ T ¯ equal to 0.5 and 1.6 K, respectively, in comparison with previously reported Yb3+ coordination compounds [45].

2.2. Multifunctional PB@SiO2 Core@Shell Nanoparticles Loaded by Luminescent Thermometers

The investigated tris-acetylacetonate complexes exbibit promising thermometric behavior, prompting further investigation of their potential as temperature probes in photothermal core@shell PB@SiO2 nanoparticles. We focused, therefore, on encapsulation of 1Eu and mixed 1Tb/1Eu complexes presenting interesting thermometric performance in the visible region, as well as on a 1Yb one working in NIR.
The synthesis of core@shell PB@SiO2 nanoparticles loaded with the above-described complexes inside the porosity of the silica shell was performed by (i) the synthesis of the core@shell PB@SiO2 nanoparticles and the functionalization of the silica pores with the acetylacetonate moiety as previously reported [64] and (ii) the loading of the 1Eu, 1Tb/1Eu (with an initial ratio of 1.8/8.5), and 1Yb compounds inside the silica shell by impregnation during 2 h in ethanol at 80 °C. This led to the formation of PB@SiO2-acac/(1Eu), PB@SiO2-acac/(1Tb2/1Eu8), and PB@SiO2-acac/(1Yb) nano-objects (see Materials and Methods for details). Note that the functionalization of the silica pores with acetylacetonate moieties enhances complex loading by reducing hydrophilicity, while the ligand exchange between two water molecules of the pristine complex with acetylacetonate groups of silica can also be expected. The EDS analysis permitted the determination of the compounds’ loading: 0.28 1Eu per SiO2 unit for PB@SiO2-acac/(1Eu), 0.48 (1Tb2/1Eu8) per SiO2 unit for PB@SiO2-acac/(1Tb2/1Eu8) (with the Tb/Eu ratio = 2/8), and 0.31 1Yb per SiO2 unit for PB@SiO2-acac/(1Yb).
The transmission electronic microscopy (TEM) images of the obtained nano-objects show the cubic PB nanoparticles coated with the mesoporous silica shell having a size of 136 ± 16 for PB@SiO2-acac/(1Eu), 167 ± 22 for PB@SiO2-acac/(1Tb2/1Eu8), and 132 ± 18 nm for PB@SiO2-acac/(1Yb) (Figure 7 and Figure S4, ESI). Note that the size of the PB core is equal to ~95 nm for all samples, indicating that this size has been preserved after the silica shell coating. The silica porosity was maintained after acac grafting and complex loading. The infrared spectra of the obtained nanoparticles confirm the presence of the PB core, silica shell, and loaded complexes in nano-objects (Figures S5 and S6, ESI). Their absorption spectra indicate the presence of a broad band between 500 and 900 nm characteristic of the Fe2+-to-Fe3+ electron transfer in the PB nanoparticles (Figure S7, ESI), which is responsible for the efficient photothermal properties of the nanoparticles. The photothermal heating performed for the selected PB@SiO2-acac/(1Eu) nanoparticles with the laser irradiation at 808 nm with different powers (from 0.70 to 2.58 W cm−2) given in Figure S8 (ESI) indicates an important power-dependent temperature increase under irradiation. As an example, a temperature difference (∆T) of 20 °C (between the initial temperature and the temperature reached after 2 min of irradiation) was obtained under laser irradiation at a power density of 2.58 W cm−2. Note that the heating ability (∆T) is constant after three cycles of irradiation, indicating the photothermal stability of nanoparticles. Note that the observed photothermal ability is similar to what is observed for previously published PB@SiO2 nanoparticles loaded with the nonnuclear Tb/Eu compound [64].
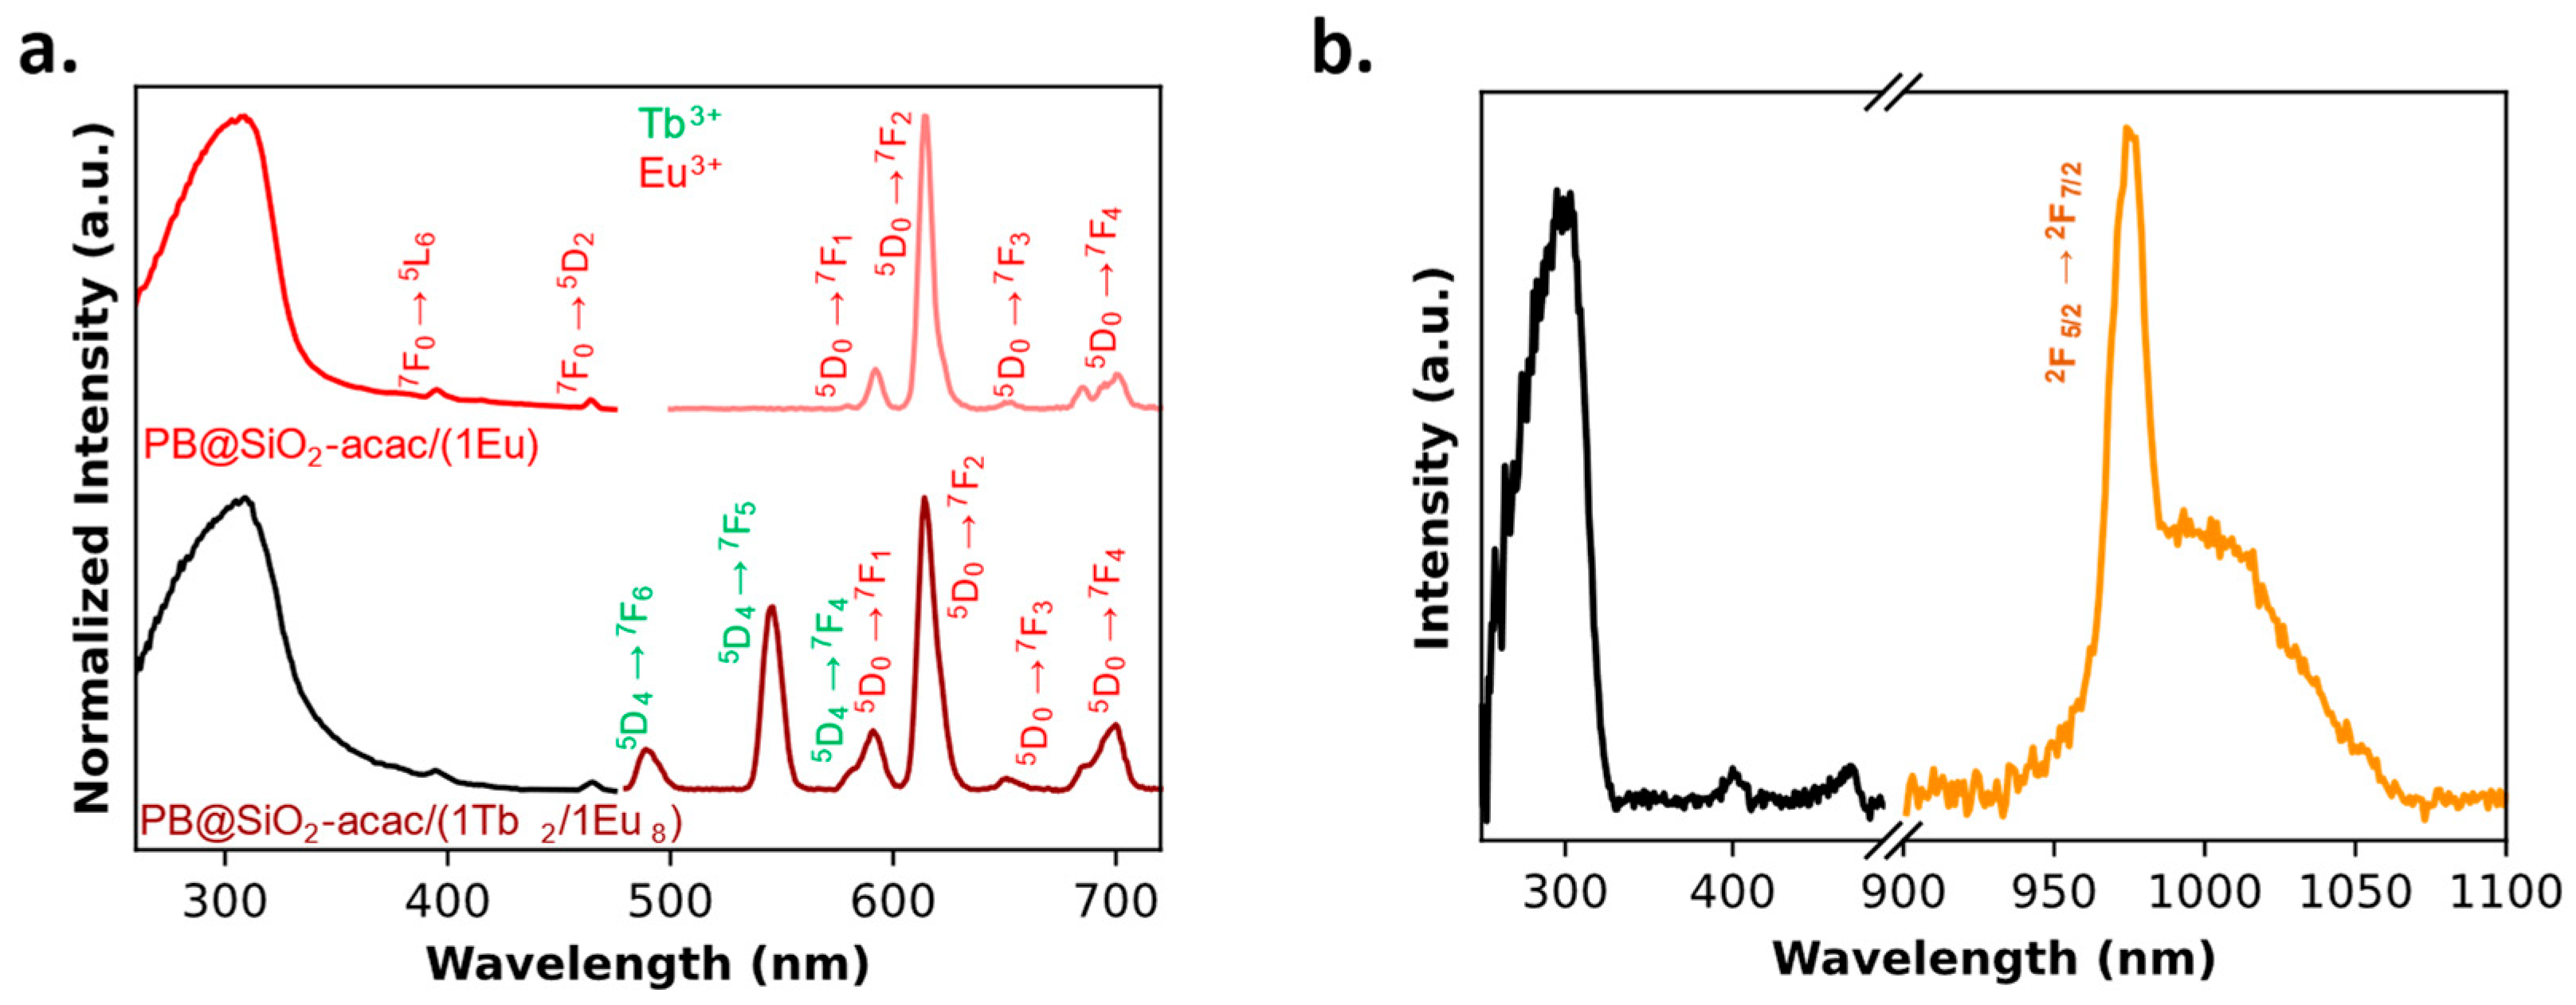
First, the photoluminescence of these nano-objects was investigated in order to prove the complexes’ good encapsulation inside the silica shell. The excitation spectrum of PB@SiO2-acac/(1Eu) exhibits a broad band associated with the acac ligand, along with the very small characteristic bands of Eu3+, namely the 7F05L6 transition at 395 nm and the 7F05D2 transition at 465 nm (Figure 8a). Note that the non-encapsulated 1Eu complex showed a much weaker antenna effect near 300 nm (Figure 2), suggesting an enhancement of the energy transfer from the ligand to the metal ion in nanoparticles, likely favored by the encapsulation within the acac-functionalized silica shell. The emission spectrum displays the characteristic profile of Eu3+ with a series of 5D07Fj (J = 0 − 4) transitions consistent with the successful loading of 1Eu inside the silica shell. Note, however, that the I(5D07F1)/I(5D07F2) ratio increases from 0.089 in the spectrum of 1Eu to 0.27 for the spectrum of PB@SiO2-acac/(1Eu) nanoparticles. Such a pronounced change indicates a modification of the local symmetry around the Eu3+ ion due to a slight modification of the coordination environment during the compound’s loading. This effect has previously been observed in the case of encapsulation of the nonnuclear Tb/Eu luminescent compound inside the silica nanoparticles [57].
The excitation spectrum for PB@SiO2-acac/(1Tb2/1Eu8) recorded at 615 nm (Eu3+ emission) displays the characteristic antenna effect of the acac ligand at 300 nm, while weak Eu3+ direct f–f transitions (7F05L6 and 5D2) are also visible, though less intense than in PB@SiO2-acac/(1Eu) (Figure 8). Their emission spectrum performed under excitation at 300 nm shows both Eu3+- and Tb3+-related transitions, indicating the successful loading of both compounds into the silica shell. Note, however, that Tb3+-related transitions appear weaker in comparison to the emission spectrum of the non-encapsulated compounds 1Tb1.5/1Eu8.5 (Figure 2). Indeed, the intensity ratio between the main Tb3+ 5D47F5 (I545, from 530 to 560 nm) and Eu3+ 5D07F2 (I615, from 604 to 640 nm) transitions decreased from 1.84 in 1Tb1.5/1Eu8.5 powder to 0.62 in PB@SiO2-acac/(1Tb2/1Eu8). This observation might be ascribed to a possible energy transfer between Tb3+ and the acac-functionalized silica matrix, or between Tb3+ and Eu3+ ions, as previously reported for hybrid nanoparticles involving Tb3+/Eu3+ coordination complexes [19,57]. Given that Tb3+→Eu3+ energy transfer appears to be inactive in the physical mixture of 1Tb1.5/1Eu8.5, the observed result reinforces the hypothesis that the luminescent compounds are grafted within the silica pores, likely through the exchange of the coordinated water molecules with the acac moieties of the silica.
Finally, the excitation and emission spectra for PB@SiO2-acac/(1Yb) nanoparticles show the expected antenna effect from the acac ligand, along with the characteristic Yb3+ 2F5/22F7/2 transition at 975 nm, which are also observed in the parent 1Yb complex (Figure 8b). This confirms the successful loading of the complex inside the silica shell.
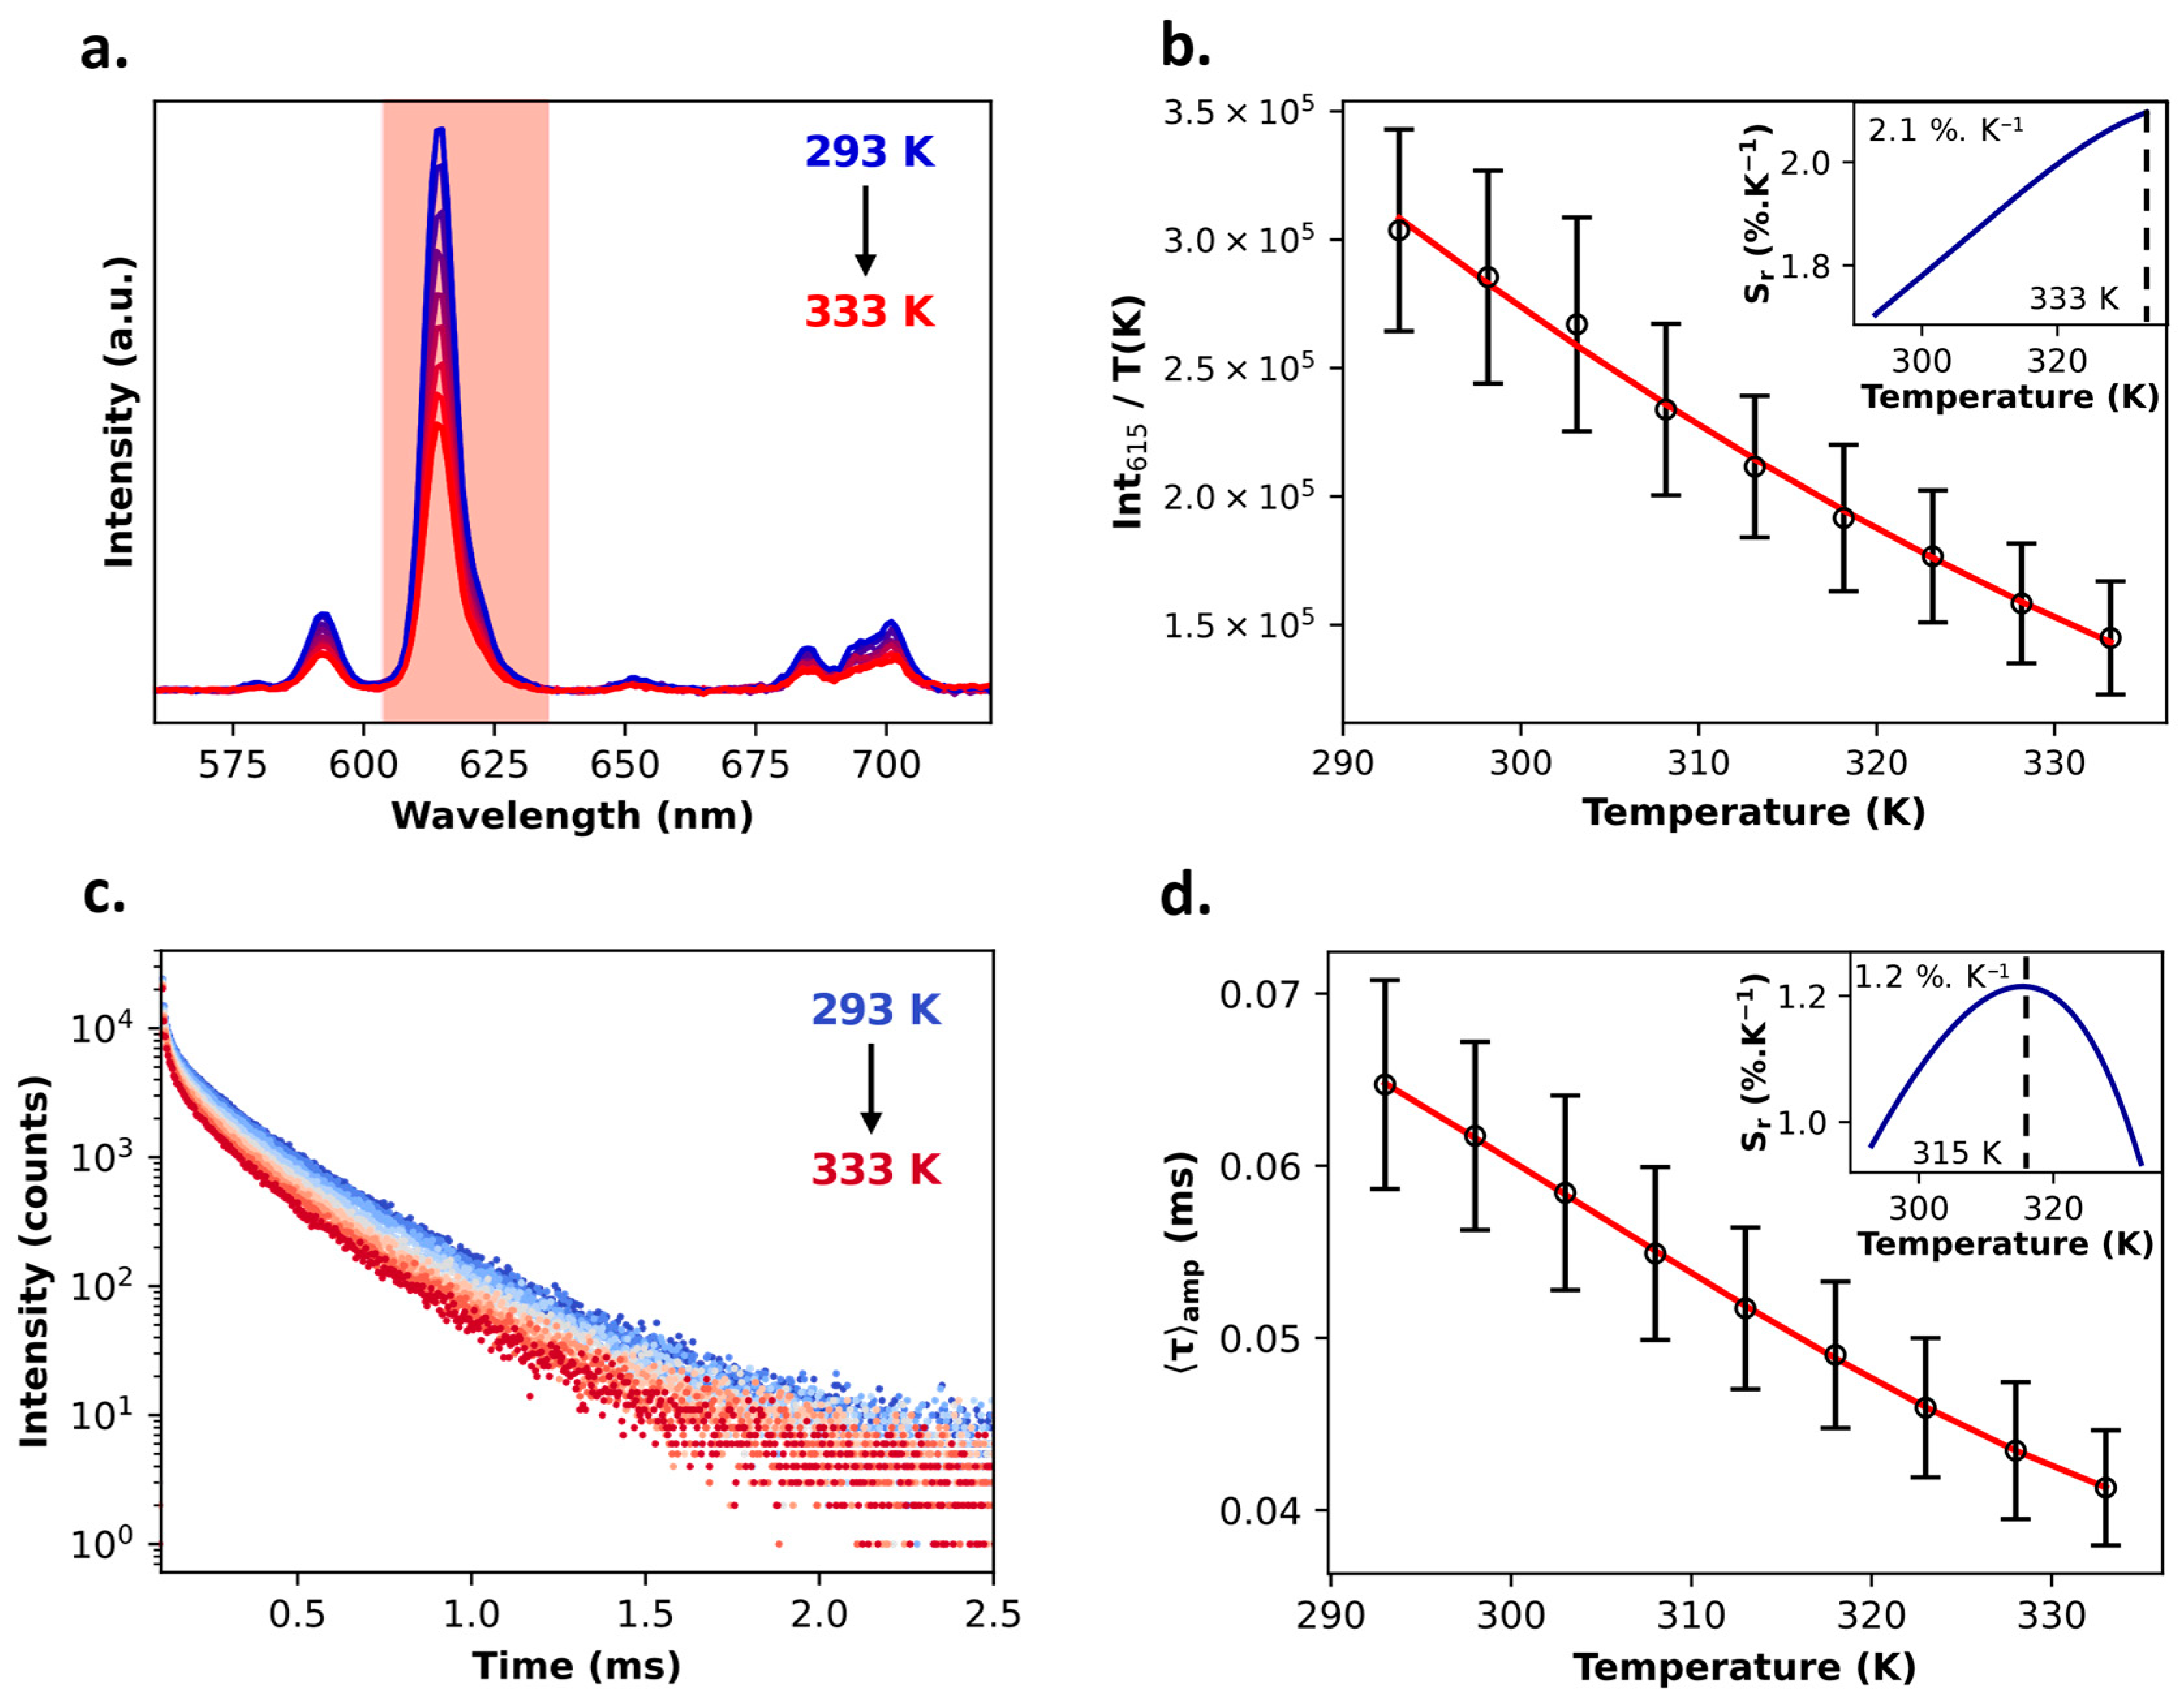
Second, the thermometry behavior of obtained nano-objects was investigated in the solid state via both emission intensity and lifetime approaches. Temperature-dependent emission spectra for PB@SiO2-acac/(1Eu) performed in the 293–333 K temperature range and the variation in intensity (integrated area of the main Eu3+ 5D07F2 transition) are shown in Figure 9a,b. The band intensity decreases with temperature, although the shape of the Int615 vs. T curve is different in comparison with the non-encapsulated 1Eu compound. Lifetime measurements monitored at the main Eu3+ 5D07F2 transition show a less pronounced temperature-dependent trend compared to the free 1Eu complex (Figure 9c,d). This change may result from modifications in the local environment and compound geometry induced by loading. Good maximum relative sensitivities of 2.1 and 1.21%·K−1 were obtained by, respectively, intensity-based and lifetime-based approaches. However, the associated respective temperature uncertainties (δT) of 6.7 and 7.2 K are quite large.
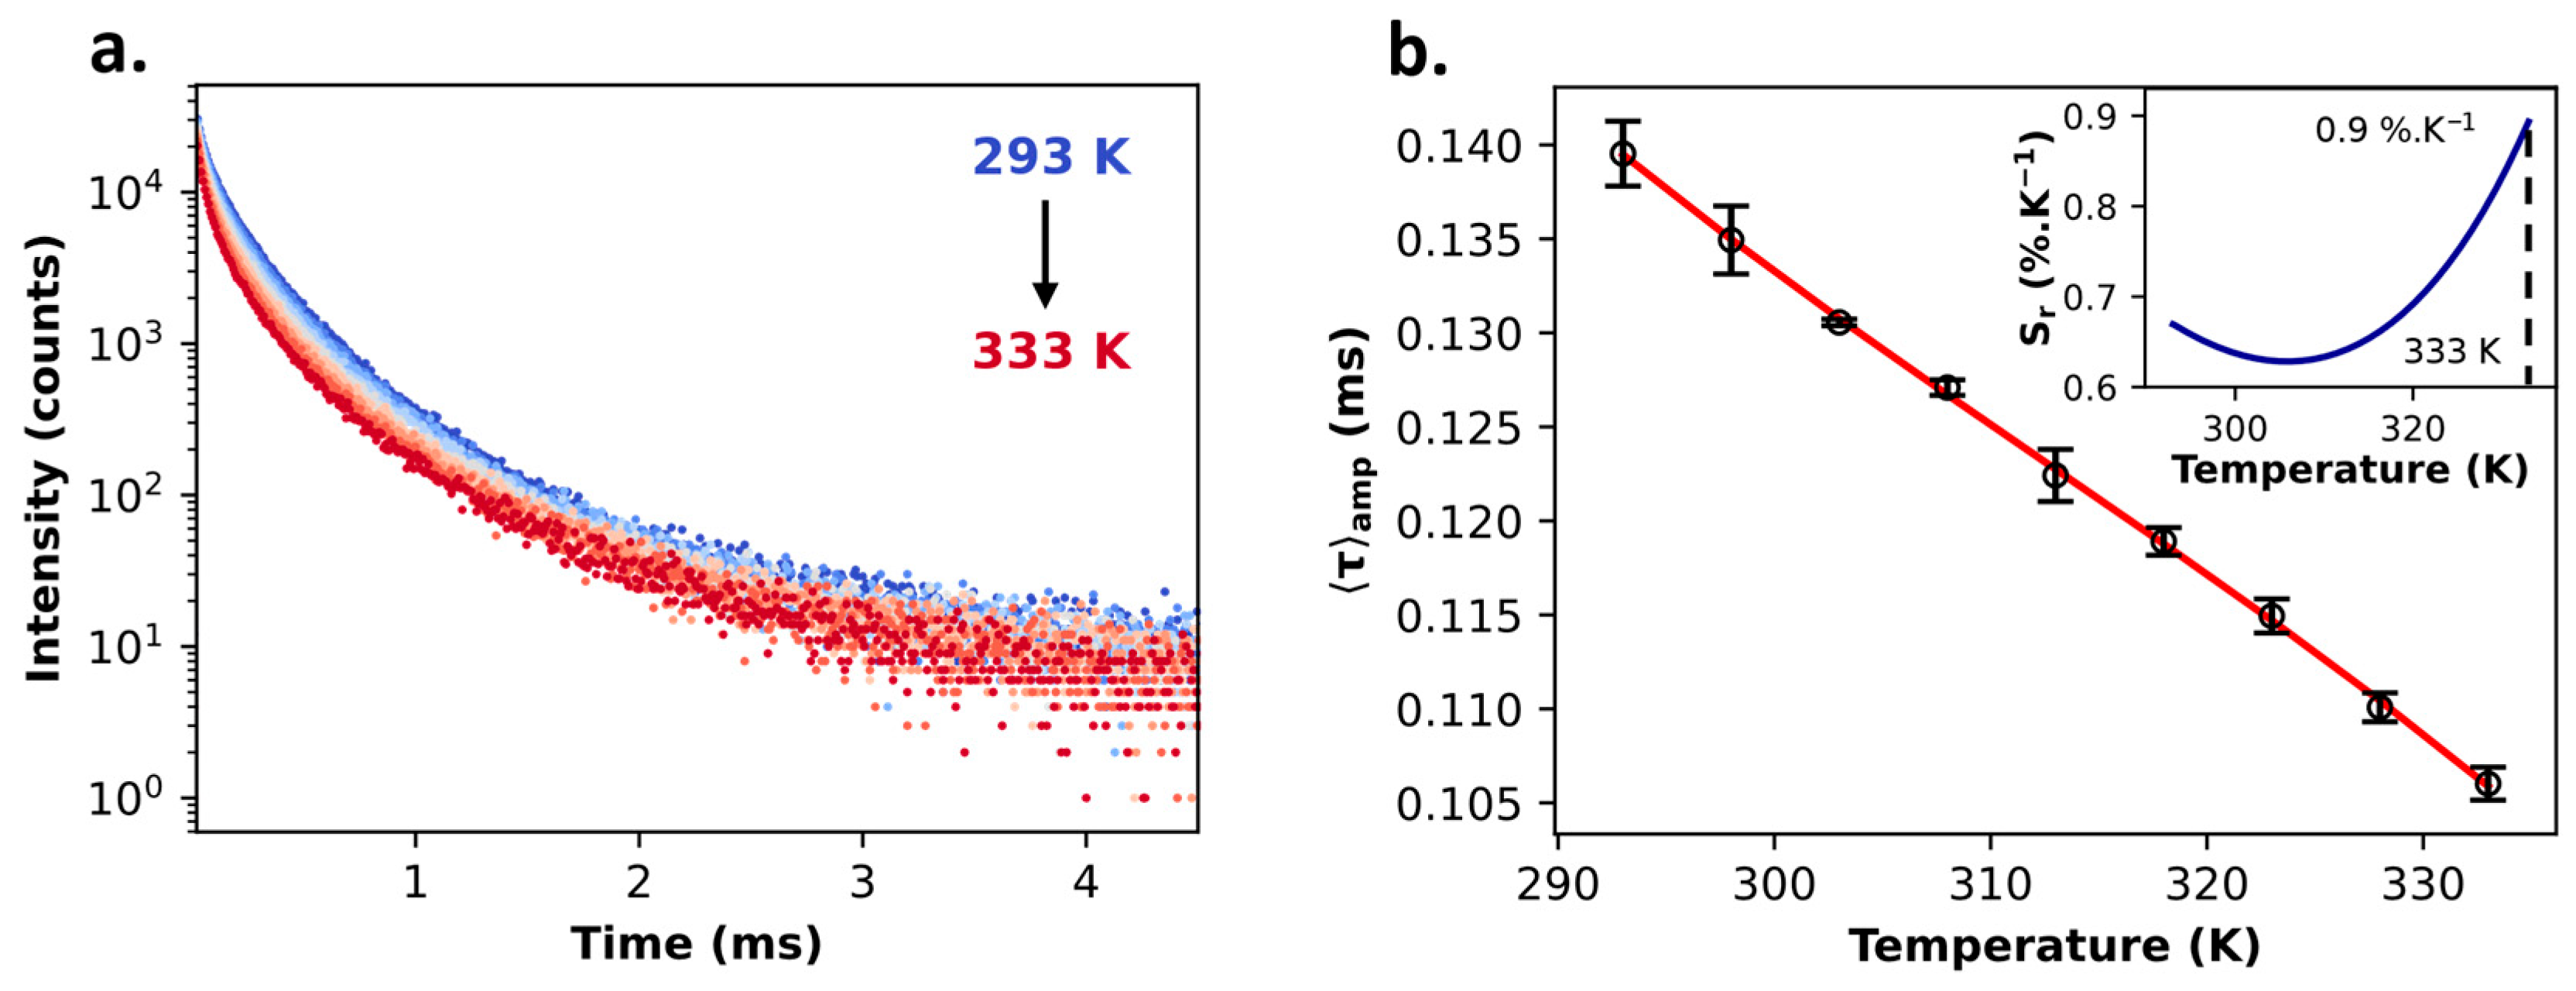
The ratiometric intensity-based temperature measurements for PB@SiO2-acac/(1Tb2/1Eu8) yielded non-relevant results, with a maximal relative sensitivity of 0.6%·K−1, δT of 20 K, and δ T ¯ of 21.6 K (Figure S9, ESI). These values are clearly poorer than those obtained for PB@SiO2-acac/(1Eu) (Srmax = 2.1%·K−1, δT = 6.7 K, and δ T ¯ = 7.6 K) and non-loaded 1Tb1.5/1Eu8.5 (Srmax = 3.2%·K−1 at 320 K, δT ≈ 1.1 K at 333 K, and δ T ¯ ≈ 1.5 K). However, time-resolved luminescence measurements (Figure 10a,b) revealed more consistent lifetime decay profiles than those of PB@SiO2-acac/(1Eu), while remaining distinct from 1Eu. This latter phenomenon likely stems from interactions between Tb3+ and Eu3+ ions and the silica matrix, which modify the Eu3+ emission dynamics. Although the intensity-based method presents certain limitations, the lifetime-based thermometric response proved far more promising. As a result, an Srmax of 0.9%·K−1 at 333 K, δT of 0.21 K, and δ T ¯ of 1.1 K were obtained, indicating substantial improvement over the readout based on the relative intensity approach. Although these values are lower than those of non-loaded 1Eu (Srmax = 2.9%·K−1 at 340 K, δT = 0.02 K at 313 K, and δ T ¯ = 0.5 K), this result remains quite relevant for thermometry measurements.
Finally, despite the rather good thermometric performance of the free 1Yb compound in the NIR domain (Srmax = 0.5%·K−1 at 293 K, δT = 0.5 K at 303 K, and δ T ¯ = 1.6 K), its incorporation did not result in the preservation of this performance in PB@SiO2-acac/(1Yb) nanoparticles. In fact, neither the use of the temperature dependence of the integrated intensity over the entire 2F5/22F7/2 emission band nor the analysis based on two distinct spectral intervals, 970–985 nm (with minimal hot band contribution) and 1040–1060 nm (with significant hot band contribution), led to the establishment of a usable calibration curve (Figure S10, ESI).
All relevant thermometric parameters for the studied hybrid nanoparticles are summarized in Table 2. A comparative analysis reveals that only the PB@SiO2-acac/(1Tb2/1Eu8) nanoparticles are suitable for temperature sensing, based on the temperature dependence of the Eu3+ 5D07F2 transition lifetime with satisfactory thermometric performance. These results enabled the development of self-referenced lifetime-based temperature probes, with performance metrics comparable to those reported for other hybrid luminescent thermometers developed both by our group and others [19,57,64].

3. Materials and Methods

Following chemicals were purchased commercially and used without further purification. Terbium(III) 2,4-pentanedionate (Tb(acac)3·2H2O; 99.9%) was purchased from thermoscientific (Waltham, MA, USA) and Europium(III) acetylacetonate hydrate (Eu(acac)3·2H2O; 99.9%) and Ytterbium(III) acetylacetonate hydrate (Yb(acac)3·2H2O; 99.9%) from Alfa Aesar (Haverhill, MA, USA). Sodium hexacyanoferrate decahydrate (Na4[Fe(CN)6]·10H2O, 99.99%), Iron (III) chloride hexahydrate (FeCl3·6H2O, 97%), ammonium nitrate (NH4NO3, 99%), and cetyltrimethylammonium bromide (CTAB, 99%) were purchased from Sigma Aldrich (Steinheim, Germany); tetraethyl orthosilicate, Si(OEt)4 (TEOS, 99%), was purchased from Abcr GmbH (Karlsruhe, Germany); sodium hydroxide (NaOH, 98%) was purchased from Honeywell (Charlotte, NC, USA); ammonia (NH4OH, 28%) was purchased from VWR Chemicals (Radnor, PA, USA); and ethanol (EtOH, 96%) was purchased from Merck (Darmstadt, Germany). The 3-[3-(Triethoxysilyl)propyl]pentane-2,4-dione)] (acac-Si) was synthesized according to a previously published method [75]. Sodium iodide (NaI, 99%) and (3-chloropropyl)triethoxysilane (Cl(CH2)3Si(OEt)3, 97%) were purchased from TCI Europe (Zwijndrecht, Belgique), potassium tert-butoxide (tBuOK, 97%) and acetylacetone (acac, 99%) were purchased from Alfa Aesar (Haverhill, MA, USA), and tert-Butanol (tBuOH, 99%) was purchased from Sigma-Aldrich (Steinheim, Germany).

3.1. Syntheses

  • Synthesis of 3-[3-(Triethoxysilyl)propyl]pentane-2,4-dione)] (acac-Si) [75]. The synthesis of acac-Si was performed in a two-step procedure. First, 3-iodopropyl)triethoxysilane was synthesized. For this, NaI was dissolved in 500 mL of acetone and (3-chloropropyl)triethoxysilane was added. The mixture was refluxed at 66 °C for 72 h and then the temperature was decreased to room temperature and the mixture was concentrated under reduced pressure. The residue was extracted in pentane, filtered, and concentrated again. Distillation under reduced pressure (vacuum line) gave (3-iodopropyl)triethoxysilane (Tvap = 78–82 °C, Tbath = 100–150 °C). Secondly, tBuOK and tBuOH were placed in a 250 mL two-necked flask with a bubbler, followed by acac. After 10 min, the previously obtained (3-iodopropyl)triethoxysilane was added, and the mixture was heated at 90 °C overnight. The solvent was removed under high vacuum, and the residue was dissolved in pentane, filtered, and concentrated. Distillation under reduced pressure (≈0.01 mbar, heat-on block) afforded the product, collected at Tvap = 87–91 °C (heat-on 125–150 °C). The first fraction distilled at Tvap = 60–65 °C (heat-on 90–120 °C).
  • Synthesis of core@shell PB@SiO2-acac nanoparticles. Pristine cubic PB nanoparticles were synthesized by a previously reported co-precipitation method [64]. For this purpose, aqueous solutions of FeCl3·6H2O (10.00 mM, 50 mL) and Na4[Fe(CN)6]·10H2O (11.25 mM, 50 mL) were added to 100 mL of ultrapure water using a peristaltic pump at a constant flow rate of 4 mL·h−1 during 10 h under ambient temperature (25 °C). After complete addition, the dispersion was centrifuged at 37,565 rcf for 10 min to collect the nanoparticles. The pellet was washed three times with ultrapure water and redispersed in water for storage. The nanoparticles were coated with a mesoporous silica layer following a modified procedure from the literature [76]. A surfactant solution was first prepared by dissolving 700 mg of cetyltrimethylammonium bromide (CTAB) in a mixture of 75 mL ethanol (96%) and 450 mL ultrapure water, stirred overnight at 35 °C (700 rpm). Then, 80 mg of PB nanoparticles was added, followed by 2 mL of tetraethyl orthosilicate (TEOS) and 250 µL of 30% aqueous ammonia. The mixture was stirred for 2 h at 35 °C and then for another 2 h at 80 °C to promote the growth of the silica shell. The resulting PB@SiO2 particles were isolated by centrifugation (37,565 rcf, 10 min). Surfactant removal was performed by two extraction cycles using a 6 g·L−1 NH4NO3 solution in ethanol, with sonication (30 min) followed by centrifugation (37,565 rcf, 10 min). The final purification involved three cycles of dispersion in water and centrifugation at low speed (6000 rcf, 15 min) to eliminate free silica nanoparticles. The purified PB@SiO2 particles were stored in water. The silica-coated nanoparticles were subsequently functionalized with acetylacetonates. For this, 20 mg of PB@SiO2 particles was dispersed in a mixture of 8 mL ethanol and 80 mL toluene. Then, 200 µL of acac–Si (0.62 mmol) was added and the suspension was refluxed at 110 °C under magnetic stirring (700 rpm) overnight. The nanoparticles were collected by centrifugation (37,565 rcf, 10 min) and washed three times with ethanol.
  • Characterization of pristine PB nanoparticles: IR (KBr): ν(O–H) = 3635 cm−1 (coordinated water), 3390 cm−1 (crystallized water), δ(O–H) = 1607 cm−1, ν(C≡N) = 2088 cm−1 (Fe3+–C≡N–Fe2+), ν(Fe2+–CN) = 605 cm−1, δ(Fe2+–CN) = 503 cm−1. EDS: Na/Fe atomic ratio of 16/84. Empirical formula: Na0.35Fe3+ [Fe2+ (CN)6]0.84·xH2O. Size (TEM): 95 ± 12 nm.
  • Characterization of core@shell PB@SiO2 nanoparticles: IR (KBr): ν(C–H) = 2800–3000 cm−1 (residual CTAB), ν(C≡N) = 2090 cm−1 (Fe3+–C≡N–Fe2+), δ(H–O–H) = 1603 cm−1, δ(CH2, CH3) = 1415 cm−1 (CTAB), ν(Si–O–Si) = 800–1090 cm−1 (SiO2), ν(Fe2+–CN) = 605 cm−1, δ(Fe2+–CN) = 503 cm−1, δ(Si–O–Si) = 475 cm−1. EDS: Si/Fe atomic ratio = 65/35. Size (TEM): 125 ± 15 nm.
  • Characterization of PB@SiO2–acac: IR (KBr): νas(CH2) = 2960 cm−1 and νs(CH2) = 2870–2840 cm−1 (acac, residual CTAB), ν(C≡N) = 2090 cm−1 (Fe3+–C≡N–Fe2+), ν(C=O) = 1710 cm−1 (acac, keto form), δ(H–O–H) = 1603 cm−1, ν(C=C) = 1527 cm−1 (acac), δas(CH3) and δ(CH2)= 1455 cm−1, δs(CH2) = 1415 cm−1, δs(CH3) = 1377cm−1, ν(Si–O–Si) = 800–1090 cm−1, ν(Fe2+–CN) = 605 cm−1, δ(Fe2+–CN) = 503 cm−1, δ(Si–O–Si) = 475 cm−1. EDS: Si/Fe atomic ratio = 65/35. Size (TEM): 138 ± 16 nm. The IR spectra for acac-Si, PB@SiO2 and PB@SiO2-acac are shown in Figure S11, ESI.
  • Loading of PB@SiO2-acac nanoparticles with the lanthanide complexes. The encapsulation of the Ln(acac)3(H2O)2 complexes (where Ln = Eu3+, Tb3+/Eu3+, or Yb3+) was achieved by adding 0.27 mmol of the complex (for Eu3+, Yb3+) or the mixture of Tb3+ and Eu3+ complexes with the ratio 1Tb/1Eu = 1.5/8.5 to 15 mg of PB@SiO2-acac nanoparticles dispersed in 80 mL of EtOH. The mixture was stirred under reflux at 80 °C for 2 h. The resulting nanoparticles were then washed twice with EtOH (37,565 rcf, 10 min) and dried at 60 °C for 24 h.
  • Characterizations of PB@SiO2acac/(1Eu): IR (KBr): νas(CH2) = 2960 cm−1 and νs(CH2) = 2870–2840 cm−1 (acac, residual CTAB), ν(C≡N) = 2090 cm−1 (Fe3+–C≡N–Fe2+), ν(C=O) = 1606 cm−1 (acac, enol form), ν(C=C) = 1527 cm−1 (acac), δas(CH3) = 1485 cm−1, δs(CH3) = 1385 cm−1, ν(Si–O–Si) = 800–1090 cm−1, ν(Fe2+–CN) = 605 cm−1, δ(Fe2+–CN) = 503 cm−1, δ(Si–O–Si) = 475 cm−1.
EDS: Si/Fe/Eu = 44/44/12. Size (TEM): 136 ± 17 nm.
  • Characterizations of PB@SiO2–acac/(1Tb2/1Eu8): IR (KBr): νas(CH2) = 2960 cm−1 and νs(CH2) = 2870–2840 cm−1 (acac, residual CTAB), ν(C≡N) = 2090 cm−1 (Fe3+–C≡N–Fe2+), ν(C=O) = 1606 cm−1 (acac, enol form), ν(C=C) = 1527 cm−1 (acac), δas(CH3) = 1485 cm−1, δs(CH3) = 1385 cm−1, ν(Si–O–Si) = 800–1090 cm−1, ν(Fe2+–CN) = 605 cm−1, δ(Fe2+–CN) = 503 cm−1, δ(Si–O–Si) = 475 cm−1. EDS: Si/Fe/Tb/Eu = 43/36/4/17; Tb/Eu = 22/78 Size (TEM): 136 ± 17 nm.
  • Characterizations of PB@SiO2–acac/(1Yb): IR (KBr): νas(CH2) = 2960 cm−1 and νs(CH2) = 2870–2840 cm−1 (acac, residual CTAB), ν(C≡N) = 2090 cm−1 (Fe3+–C≡N–Fe2+), ν(C=O) = 1606 cm−1 (acac, enol form), ν(C=C) = 1527 cm−1 (acac), δas(CH3) = 1485cm−1, δs(CH3) = 1360 cm−1, ν(Si–O–Si) = 800–1090 cm−1, ν(Fe2+–CN) = 605 cm−1, δ(Fe2+–CN) = 503 cm−1, δ(Si–O–Si) = 475 cm−1.
EDS: Si/Fe/Yb = 55/28/18. Size (TEM): 136 ± 17 nm.

3.2. Characterizations

SEM/EDS microscopy was conducted using a Quanta FEG 200 instrument (FEI, Hillsboro, OR, USA). The powders were placed on an adhesive carbon film and analyzed under high-vacuum conditions. Heavy element quantification was performed using AZTEC v5.1 software (Oxford Instruments, Abingdon-on-Thames, UK), with a dwell time of 3 µs. Transmission electron microscopy (TEM) analyses were conducted at 100 kV using a JEOL 1200 EXII microscope. Samples were prepared by drop-casting nanoparticle suspensions onto copper grids and drying at room temperature. Size distribution histograms were obtained from enlarged micrographs at 100,000× magnification, based on statistical analysis of 200–300 nanoparticles. Infrared (IR) spectra were recorded in attenuated total reflectance (ATR) mode using powdered samples and a PerkinElmer Spectrum Two FT-IR spectrometer (Waltham, MA, USA), with four scans at a resolution of 4 cm−1. UV–visible absorption spectra were acquired with a V-650 spectrometer (JASCO, Tokyo, Japan).

3.3. Photoluminescence Studies and Thermometry

Emission and excitation spectra were obtained at a controlled temperature (293 K) in the solid state using an FLS-1000 spectrofluorometer (Edimburgh Intruments, Livingston, UK) equipped with a PMT-900 (over a range from 185 nm to 900 nm) and a PMT-1400-LN2 (over a range from 500 nm to 1400 nm) detector (Edimburgh Intruments, Livingston, UK). The excitation source employed was a 450 W ozone-free Xenon arc lamp. Spectra underwent corrections in accordance with the detection and optical spectral response of the spectrofluorometer. Temperature control for thermometry measurements was achieved through the use of a TC 1 temperature controller (Quantum Northwest, Washington, DC, USA). Complexes were heated at 353 K for 1h and then cooled for 20 min before measurements. PB@SiO2-acac/(1Ln) nanoparticles were heated at 333 K for 2h and then cooled during the night before measurements. Emission spectra were recorded in the 293–353 K temperature range every 5 K, with a period of 2 min between each for temperature stabilization. Three emission spectra were recorded with a dwell time of 0.1 s and a step of 1 nm. For hybrid nanoparticles, three heating cycles were performed with a waiting time of one night.

4. Conclusions

In summary, this work presents a comprehensive study of luminescent thermometry using a series of tris-acetylacetonate lanthanide complexes, Ln(acac)3(H2O)2, where Ln = Eu, Tb, or Yb. These compounds were examined both in the solid state and after being embedded into the silica shell of multifunctional Prussian Blue core@shell nanoparticles.
Individually, the lanthanide complexes exhibited temperature-responsive emission in either the visible or NIR spectral ranges, with each offering distinct thermometric profiles. Among them, the Eu3+ complex stood out as a particularly promising probe in the visible region. When employing a straightforward intensity-based (non-ratiometric) approach, it achieved a remarkable relative sensitivity of 6.5%·K−1, with a temperature uncertainty as low as 0.1 K at 353 K (0.2 K for the average temperature uncertainty in the all-temperature range). Furthermore, lifetime-based measurements reduced this local uncertainty to 0.02 K at 313 K (an average uncertainty of 0.5 K), while maintaining an excellent maximal relative sensitivity of 2.9%·K−1. Note that the latter method enables self-referenced detection, positioning this Eu3+ system among the most efficient visible-range luminescent thermometers known to date. The thermometric performance was further enhanced by combining Eu3+ and Tb3+ complexes in a 1.5:8.5 molar ratio. This physical mixture enabled intensity-based ratiometric thermometry with robust output: a maximum relative sensitivity of 3.2%·K−1 and a temperature uncertainty of 1.1K at 333 K (1.5 K in the all-temperature range). In the NIR domain, the Yb3+ complex offered an attractive alternative. It enabled self-referenced temperature sensing with a relative sensitivity of 0.5%·K−1 and a measurement uncertainty of 0.5 K at 293 K (an average uncertainty of 1.6 K), values that place it among the best-performing NIR thermometers currently available in a field where highly sensitive systems remain relatively limited.
To further explore their practical applicability as temperature probes, the three luminescent lanthanide complexes were successfully incorporated into the porous silica shell of photothermal PB core@ silica shell nanoparticles. EDS together with spectroscopic characterizations confirmed their successful encapsulation, with luminescence measurements providing clear evidence of emission from within the nano-objects. Interestingly, some modifications in the relative band intensities of the emission profiles suggested slight modifications in their coordination environments due to confinement effects within the pores or eventual exchange between coordinated water molecules and acetylacetonate groups grafted to the silica surface. Once integrated into the PB@SiO2-acac hybrid nanostructures, the thermometric response of the lanthanide complexes evolved significantly, indicating that the integration into the core@shell system clearly influenced the temperature sensing behavior. For both PB@SiO2-acac/(1Eu) and PB@SiO2-acac/(1Tb2/1Eu8) nanoparticles, intensity-based and lifetime-based methods still delivered relatively high maximal sensitivities. However, these were accompanied by substantial temperature uncertainties, rendering them unsuitable for precise thermometric applications in their current form. Despite this, the ratiometric approach applied to PB@SiO2-acac/(1Tb2/1Eu8) nanoparticles, specifically using the temperature-dependent lifetime of the Eu3+ 5D07F2 transition, yielded very promising results. This system achieved a maximum relative sensitivity of 0.9%·K−1, with a notably low temperature uncertainty of 0.21 at 303 K (an average uncertainty of 1.1 K), demonstrating, therefore, its potential as a viable hybrid luminescent thermometer for micro- or nanoscale environments. In contrast, attempts to exploit the NIR-emitting PB@SiO2-acac/(1Yb) nanoparticles for thermometry proved unsuccessful. The system failed to exhibit reliable temperature-dependent luminescence behavior, underscoring the challenge of preserving Yb3+-based thermometric performance within confined or complex hybrid environments.
Altogether, this study highlights the versatile and efficient thermometric capabilities of simple lanthanide β-diketonate complexes, both as standalone compounds and within nanostructured hybrid platforms.

Supplementary Materials

The following supporting information can be downloaded at https://www.mdpi.com/article/10.3390/inorganics13090304/s1, Figure S1: Emission spectra of 1Tb (dark green), 1Tb8/1Eu2 (green), 1Tb6/1Eu4 (orange), 1Tb1.5/1Eu8.5 (red), and 1Eu (dark red), all measured at 329 nm excitation at ambient temperature. Figure S2: (a) Emission spectra of 1Tb measured under 330 nm excitation in the 293–353 K temperature range; (b) the corresponding temperature dependence of the intensity (surface area) for 5D47F5 (Tb3+) transition. The solid line represents a second-degree polynomial fitting. Integrated areas: 530–560 nm. Insert: Temperature dependence of Sr. The error bars correspond to the standard error of the mean value determined from three consecutive temperature cycles. Figure S3: Thermal uncertainties for (a) 1Tb (intensity method), (b) 1Eu (intensity method), (c) 1Tb1.5/1Eu8.5 (intensity method), (d) 1Eu (lifetime method), (e) 1Yb (intensity method). Figure S4: Size distribution histograms for (a) PB, (b) PB@SiO2, (c) PB@SiO2-acac, (d) PB@SiO2-acac/(1Eu), (e) PB@SiO2-acac/(1Tb2/Eu8), (f) PB@SiO2-acac/(1Yb) nano-objects. Figure S5: IR spectra of PB, PB@SiO2, PB@SiO2-acac, and PB@SiO2-acac/(1Eu) nano-objects. Figure S6: IR spectra of 1Eu (red) and PB@SiO2-acac/(1Eu) nano-objects (violet) between 500 and 4000 cm−1 (a) and between 500 and 1800 cm−1 (b); IR spectra of 1Tb (dark green), 1Eu (red) and PB@SiO2-acac/(1Tb2/1Eu8) nano-objects (green) between 500 and 4000 cm−1 (c) and between 500 and 1800 cm−1 (d); IR spectra of 1Yb (yellow) and PB@SiO2-acac/(1Yb) nano-objects (orange) between 500 and 4000 cm−1 (e) and between 500 and 1800 cm−1 (f). Figure S7: Absorption spectra for different nano-objects. Figure S8: (a) Photothermal properties presented as ΔT vs. time of PB@SiO2-acac/(1Eu) nano-objects deposited on the glass surface under irradiation at 808 nm (0.70 W·cm−2, 1.16 W·cm−2, 1.76 W·cm−2, 2.23 W·cm−2, and 2.58 W·cm−2) measured over three cycles of irradiation/relaxation with the laser source; (b) ΔT measured for PB@SiO2-acac/(1Eu) nano-objects after 3 min of laser irradiation at 808 nm as a function of laser power. Figure S9: (a) Temperature-dependent emission spectra of PB@SiO2-acac/(1Tb2/1Eu8) under excitation at 315 nm in the 293–333 K range; (b) temperature dependence of the main intensity for the 5D07F2 transition (integrated area). Inset: Temperature dependence of Sr. The solid line represents a second-degree polynomial fitting. Integrated areas: 604–640 nm (Eu3+). The error bars correspond to the standard error of the mean value determined from three consecutive cycles. Figure S10: Temperature-dependent emission spectra of PB@SiO2-acac/(1Yb) under excitation at 313 nm in the 293–333 K range. Insert: In green, temperature dependence of LIR (taken between integrated areas: 955–985 and 990–1075 nm); in red, temperature dependence of the 2F5/22F7/2 transition (taken between integrated areas: 955–1045 nm). Figure S11: IR spectra of acac-Si, PB@SiO2, and PB@SiO2-acac.

Author Contributions

Conceptualization, J.L., G.F. and Y.G.; methodology, S.S., G.F. and Y.G.; software, A.L. and G.F.; validation, J.L., G.F., S.S. and Y.G.; formal analysis, A.L., G.F. and S.S.; investigation, A.L. and G.F.; resources, A.L., G.F. and S.S.; data curation, A.L. and G.F.; writing—original draft preparation, J.L., G.F. and A.L.; writing—review and editing, J.L., G.F. and A.L.; visualization, S.S. and Y.G.; supervision, S.S. and G.F.; project administration, J.L. and S.S.; funding acquisition, S.S. All authors have read and agreed to the published version of the manuscript.

Funding

The authors thank the University of Montpellier, CNRS, and the ANR program within the frame of the HotSpot project (ANR-23-CE09-0017) for funding.

Data Availability Statement

The data supporting this article have been included as part of the Supplementary Information.

Acknowledgments

Authors are grateful to the UAR2041 Platform of Analysis and Characterization (PAC Balard) and the platform MEA (Microscopie Electronique et Analytique) at the University of Montpellier for analyses and measurements.

Conflicts of Interest

The authors declare no conflicts of interest.

References

  1. Dramićanin, M.D. Trends in Luminescence Thermometry. J. Appl. Phys. 2020, 128, 040902. [Google Scholar] [CrossRef]
  2. Quintanilla, M.; Henriksen-Lacey, M.; Renero-Lecuna, C.; Liz-Marzán, L.M. Challenges for Optical Nanothermometry in Biological Environments. Chem. Soc. Rev. 2022, 51, 4223–4242. [Google Scholar] [CrossRef]
  3. Jaque, D.; Rosal, B.D.; Rodríguez, E.M.; Maestro, L.M.; Haro-González, P.; Solé, J.G. Fluorescent Nanothermometers for Intracellular Thermal Sensing. Nanomedicine 2014, 9, 1047–1062. [Google Scholar] [CrossRef]
  4. Ansari, A.A.; Parchur, A.K.; Nazeeruddin, M.K.; Tavakoli, M.M. Luminescent Lanthanide Nanocomposites in Thermometry: Chemistry of Dopant Ions and Host Matrices. Coord. Chem. Rev. 2021, 444, 214040. [Google Scholar] [CrossRef]
  5. Qiu, X.; Zhou, Q.; Zhu, X.; Wu, Z.; Feng, W.; Li, F. Ratiometric Upconversion Nanothermometry with Dual Emission at the Same Wavelength Decoded via a Time-Resolved Technique. Nat. Commun. 2020, 11, 4. [Google Scholar] [CrossRef] [PubMed]
  6. Savchuk, O.A.; Haro-González, P.; Carvajal, J.J.; Jaque, D.; Massons, J.; Aguiló, M.; Díaz, F. Er:Yb:NaY2F5O up-Converting Nanoparticles for Sub-Tissue Fluorescence Lifetime Thermal Sensing. Nanoscale 2014, 6, 9727–9733. [Google Scholar] [CrossRef]
  7. Bettinelli, M.; Carlos, L.; Liu, X. Lanthanide-Doped Upconversion Nanoparticles. Phys. Today 2015, 68, 38–44. [Google Scholar] [CrossRef]
  8. Goderski, S.; Runowski, M.; Woźny, P.; Lavín, V.; Lis, S. Lanthanide Upconverted Luminescence for Simultaneous Contactless Optical Thermometry and Manometry–Sensing under Extreme Conditions of Pressure and Temperature. ACS Appl. Mater. Interfaces 2020, 12, 40475–40485. [Google Scholar] [CrossRef]
  9. Cui, Y.; Xu, H.; Yue, Y.; Guo, Z.; Yu, J.; Chen, Z.; Gao, J.; Yang, Y.; Qian, G.; Chen, B. A Luminescent Mixed-Lanthanide Metal–Organic Framework Thermometer. J. Am. Chem. Soc. 2012, 134, 3979–3982. [Google Scholar] [CrossRef]
  10. Zhang, L.; Xie, Y.; Xia, T.; Cui, Y.; Yang, Y.; Qian, G. A Highly Sensitive Luminescent Metal–Organic Framework Thermometer for Physiological Temperature Sensing. J. Rare Earths 2018, 36, 561–566. [Google Scholar] [CrossRef]
  11. Zhao, D.; Rao, X.; Yu, J.; Cui, Y.; Yang, Y.; Qian, G. Design and Synthesis of an MOF Thermometer with High Sensitivity in the Physiological Temperature Range. Inorg. Chem. 2015, 54, 11193–11199. [Google Scholar] [CrossRef] [PubMed]
  12. Trannoy, V.; Carneiro Neto, A.N.; Brites, C.D.S.; Carlos, L.D.; Serier-Brault, H. Engineering of Mixed Eu3+/Tb3+ Metal-Organic Frameworks Luminescent Thermometers with Tunable Sensitivity. Adv. Opt. Mater. 2021, 9, 2001938. [Google Scholar] [CrossRef]
  13. Rocha, J.; Brites, C.D.S.; Carlos, L.D. Lanthanide Organic Framework Luminescent Thermometers. Chem. Eur. J. 2016, 22, 14782–14795. [Google Scholar] [CrossRef]
  14. Cadiau, A.; Brites, C.D.S.; Costa, P.M.F.J.; Ferreira, R.A.S.; Rocha, J.; Carlos, L.D. Ratiometric Nanothermometer Based on an Emissive Ln3+-Organic Framework. ACS Nano 2013, 7, 7213–7218. [Google Scholar] [CrossRef]
  15. Li, L.; Zhu, Y.; Zhou, X.; Brites, C.D.S.; Ananias, D.; Lin, Z.; Paz, F.A.A.; Rocha, J.; Huang, W.; Carlos, L.D. Visible-Light Excited Luminescent Thermometer Based on Single Lanthanide Organic Frameworks. Adv. Funct. Mater. 2016, 26, 8677–8684. [Google Scholar] [CrossRef]
  16. Lyubov, D.M.; Neto, A.N.C.; Fayoumi, A.; Lyssenko, K.A.; Korshunov, V.M.; Taydakov, I.V.; Salles, F.; Guari, Y.; Larionova, J.; Carlos, L.D.; et al. Employing Three-Blade Propeller Lanthanide Complexes as Molecular Luminescent Thermometers: Study of Temperature Sensing through a Concerted Experimental/Theory Approach. J. Mater. Chem. C 2022, 10, 7176–7188. [Google Scholar] [CrossRef]
  17. Suzuki, M.; Tseeb, V.; Oyama, K.; Ishiwata, S. Microscopic Detection of Thermogenesis in a Single HeLa Cell. Biophys. J. 2007, 92, L46–L48. [Google Scholar] [CrossRef]
  18. Nexha, A.; Carvajal, J.J.; Pujol, M.C.; Díaz, F.; Aguiló, M. Lanthanide Doped Luminescence Nanothermometers in the Biological Windows: Strategies and Applications. Nanoscale 2021, 13, 7913–7987. [Google Scholar] [CrossRef]
  19. Brites, C.D.S.; Balabhadra, S.; Carlos, L.D. Lanthanide-Based Thermometers: At the Cutting-Edge of Luminescence Thermometry. Adv. Opt. Mater. 2019, 7, 1801239. [Google Scholar] [CrossRef]
  20. Brites, C.D.S.; Millán, A.; Carlos, L.D. Chapter 281—Lanthanides in Luminescent Thermometry. In Handbook on the Physics and Chemistry of Rare Earths; Jean-Claude, B., Vitalij, K.P., Eds.; Including Actinides; Elsevier: Amsterdam, The Netherlands, 2016; Volume 49, pp. 339–427. [Google Scholar]
  21. Brites, C.D.S.; Lima, P.P.; Silva, N.J.O.; Millán, A.; Amaral, V.S.; Palacio, F.; Carlos, L.D. Thermometry at the Nanoscale. Nanoscale 2012, 4, 4799–4829. [Google Scholar] [CrossRef]
  22. Jaque, D.; Vetrone, F. Luminescence Nanothermometry. Nanoscale 2012, 4, 4301–4326. [Google Scholar] [CrossRef]
  23. Luminescence Thermometry: Methods, Materials and Applications—1st Edition. Available online: https://www.elsevier.com/books/luminescence-thermometry/dramicanin/978-0-08-102029-6 (accessed on 13 June 2022).
  24. Bünzli, J.-C.; Eliseeva, S. Basics of Lanthanide Photophysics. In Lanthanide Luminescence; Publisher: City, Country, 2010; Volume 7, pp. 1–45. ISBN 978-3-642-21022-8. [Google Scholar]
  25. Bünzli, J.-C.G.; Piguet, C. Taking Advantage of Luminescent Lanthanide Ions. Chem. Soc. Rev. 2005, 34, 1048–1077. [Google Scholar] [CrossRef]
  26. Tcelykh, L.O.; Kozhevnikova, V.Y.; Goloveshkin, A.S.; Latipov, E.V.; Gordeeva, E.O.; Utochnikova, V.V. Sensing Temperature with Tb-Eu-Based Luminescent Thermometer: A Novel Approach to Increase the Sensitivity. Sens. Actuators Phys. 2022, 345, 113787. [Google Scholar] [CrossRef]
  27. Sharma, A.R.; Singh, A.R.; Kongasseri, A.A.; Garain, S.; Babu, A.M.; Lonibala, R.; Laishram, R. A Ratiometric Luminescence Thermometer Based on Lanthanide Encapsulated Complexes. Dalton Trans. 2025, 54, 1377–1383. [Google Scholar] [CrossRef]
  28. Kharcheva, A.V.; Bozhko, A.A.; Sokolovskaya, Y.G.; Borisova, N.E.; Ivanov, A.V.; Patsaeva, S.V. Bimetallic Eu/Tb Complexes for Ratiometric Temperature Sensing with Unusual Enhancement of Eu Luminescence with Temperature. Photonics 2023, 10, 1171. [Google Scholar] [CrossRef]
  29. Zhao, D.; Yue, D.; Zhang, L.; Jiang, K.; Qian, G. Cryogenic Luminescent Tb/Eu-MOF Thermometer Based on a Fluorine-Modified Tetracarboxylate Ligand. Inorg. Chem. 2018, 57, 12596–12602. [Google Scholar] [CrossRef] [PubMed]
  30. Popelensky, T.Y.; Utochnikova, V.V. How Does the Ligand Affect the Sensitivity of the Luminescent Thermometers Based on Tb–Eu Complexes. Dalton Trans. 2020, 49, 12156–12160. [Google Scholar] [CrossRef]
  31. Calado, C.M.S.; Gálico, D.A.; Murugesu, M. Intra-Cluster Energy Transfer Editing in a Dual-Emitting System to Tap into Lifetime Thermometry. Chem. Commun. 2023, 59, 13715–13718. [Google Scholar] [CrossRef] [PubMed]
  32. Jia, R.; Zhou, X.; Wu, J.; Li, L.; Wang, Y.; Xiang, G.; Tang, X.; Yang, Z.; Gao, H. Luminescent Properties of Multi-Stimuli-Responsive Ln-BPDC-Phen Lanthanide Complexes. Dyes Pigments 2024, 222, 111871. [Google Scholar] [CrossRef]
  33. Yang, X.; Zou, H.; Sun, X.; Sun, T.; Guo, C.; Fu, Y.; Wu, C.-M.L.; Qiao, X.; Wang, F. One-Step Synthesis of Mixed Lanthanide Metal-Organic Framework Films for Sensitive Temperature Mapping. Adv. Opt. Mater. 2019, 7, 1900336. [Google Scholar] [CrossRef]
  34. Tang, H.; Cheng, S.; Zhang, Z.; He, M.; Qian, J.; Li, L. Tailoring Energy Transfer in Mixed Eu/Tb Metal–Organic Frameworks for Ratiometric Temperature Sensing. Molecules 2024, 29, 3914. [Google Scholar] [CrossRef]
  35. Wang, H.; Zhao, D.; Cui, Y.; Yang, Y.; Qian, G. A Eu/Tb-Mixed MOF for Luminescent High-Temperature Sensing. J. Solid State Chem. 2017, 246, 341–345. [Google Scholar] [CrossRef]
  36. Outis, M.; Laia, C.A.T.; Oliveira, M.C.; Monteiro, B.; Pereira, C.C.L. A Europium(III) Complex with an Unusual Anion-Cation Interaction: A Luminescent Molecular Thermometer for Ratiometric Temperature Sensing. ChemPlusChem 2020, 85, 580–586. [Google Scholar] [CrossRef]
  37. Souza, A.S.; Nunes, L.A.O.; Silva, I.G.N.; Oliveira, F.A.M.; da Luz, L.L.; Brito, H.F.; Felinto, M.C.F.C.; Ferreira, R.A.S.; Júnior, S.A.; Carlos, L.D.; et al. Highly-Sensitive Eu3+ Ratiometric Thermometers Based on Excited State Absorption with Predictable Calibration. Nanoscale 2016, 8, 5327–5333. [Google Scholar] [CrossRef]
  38. Wei, W.; Li, X.; Zhang, Y.-Y.; Zhang, J.-W. Rational Construction of Luminescent Eu-Doped Y-MOF for Ratiometric Temperature Sensing. RSC Adv. 2024, 14, 28340–28344. [Google Scholar] [CrossRef]
  39. Kitagawa, Y.; Kumagai, M.; Nakanishi, T.; Fushimi, K.; Hasegawa, Y. The Role of π-f Orbital Interactions in Eu(III) Complexes for an Effective Molecular Luminescent Thermometer. Inorg. Chem. 2020, 59, 5865–5871. [Google Scholar] [CrossRef] [PubMed]
  40. de Souza, K.M.N.; Silva, R.N.; Silva, J.A.B.; Brites, C.D.S.; Francis, B.; Ferreira, R.A.S.; Carlos, L.D.; Longo, R.L. Novel and High-Sensitive Primary and Self-Referencing Thermometers Based on the Excitation Spectra of Lanthanide Ions. Adv. Opt. Mater. 2022, 10, 2200770. [Google Scholar] [CrossRef]
  41. Kitos, A.A.; Gálico, D.A.; Castañeda, R.; Ovens, J.S.; Murugesu, M.; Brusso, J.L. Stark Sublevel-Based Thermometry with Tb(III) and Dy(III) Complexes Cosensitized via the 2-Amidinopyridine Ligand. Inorg. Chem. 2020, 59, 11061–11070. [Google Scholar] [CrossRef] [PubMed]
  42. Errulat, D.; Marin, R.; Gálico, D.A.; Harriman, K.L.M.; Pialat, A.; Gabidullin, B.; Iikawa, F.; Couto, O.D.D.; Moilanen, J.O.; Hemmer, E.; et al. A Luminescent Thermometer Exhibiting Slow Relaxation of the Magnetization: Toward Self-Monitored Building Blocks for Next-Generation Optomagnetic Devices. ACS Cent. Sci. 2019, 5, 1187–1198. [Google Scholar] [CrossRef]
  43. Kumar, K.; Abe, D.; Komori-Orisaku, K.; Stefańczyk, O.; Nakabayashi, K.; R. Shakirova, J.; P. Tunik, S.; Ohkoshi, S. Neodymium β-Diketonate Showing Slow Magnetic Relaxation and Acting as a Ratiometric Thermometer Based on near-Infrared Emission. RSC Adv. 2019, 9, 23444–23449. [Google Scholar] [CrossRef] [PubMed]
  44. Zhou, X.; Wang, Y.; Wang, H.; Xiang, L.; Yan, Y.; Li, L.; Xiang, G.; Li, Y.; Jiang, S.; Tang, X.; et al. Nd3+ and Nd3+/Yb3+-Incorporated Complexes as Optical Thermometer Working in the Second Biological Window. Sens. Bio-Sens. Res. 2020, 29, 100345. [Google Scholar] [CrossRef]
  45. Brunet, G.; Marin, R.; Monk, M.-J.; Resch-Genger, U.; Gálico, D.A.; Sigoli, F.A.; Suturina, E.A.; Hemmer, E.; Murugesu, M. Exploring the Dual Functionality of an Ytterbium Complex for Luminescence Thermometry and Slow Magnetic Relaxation. Chem. Sci. 2019, 10, 6799–6808. [Google Scholar] [CrossRef]
  46. Karachousos-Spiliotakopoulos, K.; Tangoulis, V.; Panagiotou, N.; Tasiopoulos, A.; Moreno-Pineda, E.; Wernsdorfer, W.; Schulze, M.; Botas, A.M.P.; Carlos, L.D. Luminescence Thermometry and Field Induced Slow Magnetic Relaxation Based on a near Infrared Emissive Heterometallic Complex. Dalton Trans. 2022, 51, 8208–8216. [Google Scholar] [CrossRef] [PubMed]
  47. Yang, D.; Liu, D.; Tian, C.; Wang, S.; Li, H. Flexible and Transparent Films Consisting of Lanthanide Complexes for Ratiometric Luminescence Thermometry. J. Colloid Interface Sci. 2018, 519, 11–17. [Google Scholar] [CrossRef] [PubMed]
  48. Rodrigues, M.; Piñol, R.; Antorrena, G.; Brites, C.D.S.; Silva, N.J.O.; Murillo, J.L.; Cases, R.; Díez, I.; Palacio, F.; Torras, N.; et al. Implementing Thermometry on Silicon Surfaces Functionalized by Lanthanide-Doped Self-Assembled Polymer Monolayers. Adv. Funct. Mater. 2016, 26, 200–209. [Google Scholar] [CrossRef]
  49. Galyametdinov, Y.G.; Krupin, A.S.; Knyazev, A.A. Temperature-Sensitive Chameleon Luminescent Films Based on PMMA Doped with Europium(III) and Terbium(III) Anisometric Complexes. Inorganics 2022, 10, 94. [Google Scholar] [CrossRef]
  50. Lapaev, D.V.; Nikiforov, V.G.; Lobkov, V.S.; Knyazev, A.A.; Galyametdinov, Y.G. Reusable Temperature-Sensitive Luminescent Material Based on Vitrified Film of Europium(III) β-Diketonate Complex. Opt. Mater. 2018, 75, 787–795. [Google Scholar] [CrossRef]
  51. de Freitas Silva, G.; da Silva Filho, J.C.; de Castro Andrade, A.A.; Otaguro, H.; Ferri, L.; de Lima Rezende, T.K.; Pasquini, D.; Ferrari, J.L. Synthesis and Luminescent Properties of Cellulose Acetate Butyrate Films Doped with Europium Complex Eu(TTA)3 for Optical Thermometry. Opt. Mater. 2024, 152, 115393. [Google Scholar] [CrossRef]
  52. Brites, C.D.S.; Lima, P.P.; Silva, N.J.O.; Millán, A.; Amaral, V.S.; Palacio, F.; Carlos, L.D. Thermometry at the Nanoscale Using Lanthanide-Containing Organic–Inorganic Hybrid Materials. J. Lumin. 2013, 133, 230–232. [Google Scholar] [CrossRef]
  53. Brites, C.D.S.; Lima, P.P.; Silva, N.J.O.; Millán, A.; Amaral, V.S.; Palacio, F.; Carlos, L.D. A Luminescent Molecular Thermometer for Long-Term Absolute Temperature Measurements at the Nanoscale. Adv. Mater. 2010, 22, 4499–4504. [Google Scholar] [CrossRef]
  54. Mara, D.; Kaczmarek, A.M.; Artizzu, F.; Abalymov, A.; Skirtach, A.G.; Van Hecke, K.; Van Deun, R. Luminescent PMMA Films and PMMA@SiO2 Nanoparticles with Embedded Ln3+ Complexes for Highly Sensitive Optical Thermometers in the Physiological Temperature Range**. Chem. Eur. J. 2021, 27, 6479–6488. [Google Scholar] [CrossRef] [PubMed]
  55. Fedorenko, S.; Gilmanova, D.; Mukhametshina, A.; Nizameev, I.; Kholin, K.; Akhmadeev, B.; Voloshina, A.; Sapunova, A.; Kuznetsova, S.; Daminova, A.; et al. Silica Nanoparticles with Dual Visible–NIR Luminescence Affected by Silica Confinement of Tb(III) and Yb(III) Complexes for Cellular Imaging Application. J. Mater. Sci. 2019, 54, 9140–9154. [Google Scholar] [CrossRef]
  56. Takei, Y.; Arai, S.; Murata, A.; Takabayashi, M.; Oyama, K.; Ishiwata, S.; Takeoka, S.; Suzuki, M. A Nanoparticle-Based Ratiometric and Self-Calibrated Fluorescent Thermometer for Single Living Cells. ACS Nano 2014, 8, 198–206. [Google Scholar] [CrossRef]
  57. Pelluau, T.; Sene, S.; Ali, L.M.A.; Félix, G.; Manhes, F.; Neto, A.N.C.; Carlos, L.D.; Albela, B.; Bonneviot, L.; Oliviero, E.; et al. Hybrid Multifunctionalized Mesostructured Stellate Silica Nanoparticles Loaded with β-Diketonate Tb3+/Eu3+ Complexes as Efficient Ratiometric Emissive Thermometers Working in Water. Nanoscale 2023, 15, 14409–14422. [Google Scholar] [CrossRef] [PubMed]
  58. Harrington, B.; Ye, Z.; Signor, L.; Pickel, A.D. Luminescence Thermometry Beyond the Biological Realm. ACS Nanosci. Au 2024, 4, 30–61. [Google Scholar] [CrossRef]
  59. Piñol, R.; Brites, C.D.S.; Bustamante, R.; Martínez, A.; Silva, N.J.O.; Murillo, J.L.; Cases, R.; Carrey, J.; Estepa, C.; Sosa, C.; et al. Joining Time-Resolved Thermometry and Magnetic-Induced Heating in a Single Nanoparticle Unveils Intriguing Thermal Properties. ACS Nano 2015, 9, 3134–3142. [Google Scholar] [CrossRef] [PubMed]
  60. Piñol, R.; Zeler, J.; Brites, C.D.S.; Gu, Y.; Téllez, P.; Carneiro Neto, A.N.; da Silva, T.E.; Moreno-Loshuertos, R.; Fernandez-Silva, P.; Gallego, A.I.; et al. Real-Time Intracellular Temperature Imaging Using Lanthanide-Bearing Polymeric Micelles. Nano Lett. 2020, 20, 6466–6472. [Google Scholar] [CrossRef] [PubMed]
  61. Gu, Y.; Piñol, R.; Moreno-Loshuertos, R.; Brites, C.D.S.; Zeler, J.; Martínez, A.; Maurin-Pasturel, G.; Fernández-Silva, P.; Marco-Brualla, J.; Téllez, P.; et al. Local Temperature Increments and Induced Cell Death in Intracellular Magnetic Hyperthermia. ACS Nano 2023, 17, 6822–6832. [Google Scholar] [CrossRef]
  62. Nigoghossian, K.; Bouvet, B.; Félix, G.; Sene, S.; Costa, L.; Milhet, P.-E.; Carneiro Neto, A.N.; Carlos, L.D.; Oliviero, E.; Guari, Y.; et al. Magneto-Induced Hyperthermia and Temperature Detection in Single Iron Oxide Core-Silica/Tb3+/Eu3+(Acac) Shell Nano-Objects. Nanomaterials 2022, 12, 3109. [Google Scholar] [CrossRef]
  63. Brites, C.D.S.; Fuertes, M.C.; Angelomé, P.C.; Martínez, E.D.; Lima, P.P.; Soler-Illia, G.J.A.A.; Carlos, L.D. Tethering Luminescent Thermometry and Plasmonics: Light Manipulation to Assess Real-Time Thermal Flow in Nanoarchitectures. Nano Lett. 2017, 17, 4746–4752. [Google Scholar] [CrossRef]
  64. Larquey, A.; Bellahsene, H.; Félix, G.; Beaudhuin, M.; Pelluau, T.; Bouvet, B.; Guari, Y.; Sene, S.; Larionova, J. New Heater@luminescent Thermometer Nano-Objects: Prussian Blue Core@silica Shell Loaded with a β-Diketonate Tb3+/Eu3+ Complex. Mater. Chem. Front. 2024, 9, 131–146. [Google Scholar] [CrossRef]
  65. Binnemans, K. Interpretation of Europium(III) Spectra. Coord. Chem. Rev. 2015, 295, 1–45. [Google Scholar] [CrossRef]
  66. Anderson, B.R.; Gunawidjaja, R.; Eilers, H. Soluble Sm-Based Ternary Complexes for Non-Contact Molecular Thermometry. J. Lumin. 2018, 204, 341–348. [Google Scholar] [CrossRef]
  67. Anderson, B.R.; Gunawidjaja, R.; Eilers, H. Two-Color Thermosensors Based on [Y1−xDyx(Acetylacetonate)3(1,10-Phenanthroline)] Molecular Crystals. Appl. Phys. B 2017, 123, 62. [Google Scholar] [CrossRef]
  68. Katagiri, S.; Hasegawa, Y.; Wada, Y.; Yanagida, S. Thermo-Sensitive Luminescence Based on the Back Energy Transfer in Terbium(III) Complexes. Chem. Lett. 2004, 33, 1438–1439. [Google Scholar] [CrossRef]
  69. Vanden Bussche, F.; Kaczmarek, A.M.; Veerapandian, S.K.P.; Everaert, J.; Debruyne, M.; Abednatanzi, S.; Morent, R.; De Geyter, N.; Van Speybroeck, V.; Van Der Voort, P.; et al. N-Rich Porous Polymer with Isolated Tb3+-Ions Displays Unique Temperature Dependent Behavior through the Absence of Thermal Quenching. Chem. Eur. J. 2020, 26, 15596–15604. [Google Scholar] [CrossRef]
  70. Shen, C.; Fan, Y.; Liu, G.; Wang, Y.; Lu, P. The crystal and molecular structures of gadolinium, terbium, erbium And thulium acetylacetonate trihydrate. J. Chin. Univ. 1983, 4, 769. [Google Scholar]
  71. Bednarkiewicz, A.; Marciniak, L.; Carlos, L.D.; Jaque, D. Standardizing Luminescence Nanothermometry for Biomedical Applications. Nanoscale 2020, 12, 14405–14421. [Google Scholar] [CrossRef]
  72. Zatryb, G.; Klak, M.M. On the Choice of Proper Average Lifetime Formula for an Ensemble of Emitters Showing Non-Single Exponential Photoluminescence Decay. J. Phys. Condens. Matter 2020, 32, 415902. [Google Scholar] [CrossRef] [PubMed]
  73. Sillen, A.; Engelborghs, Y. The Correct Use of “Average” Fluorescence Parameters. Photochem. Photobiol. 1998, 67, 475–486. [Google Scholar] [CrossRef]
  74. Puccini, A.; Liu, N.; Hemmer, E. Lanthanide-Based Nanomaterials for Temperature Sensing in the near-Infrared Spectral Region: Illuminating Progress and Challenges. Nanoscale 2024, 16, 10975–10993. [Google Scholar] [CrossRef]
  75. Yuan, B.; He, X.; Chen, Y.; Wang, K. Preparation of Nanosilica/Polynorbornene Nanocomposite by Covalently Immobilized Silica-Supported Acetylacetonate Palladium(II) Dichloride Catalyst. Macromol. Chem. Phys. 2011, 212, 2378–2388. [Google Scholar] [CrossRef]
  76. Hu, J.-J.; Chen, Y.; Li, Z.-H.; Peng, S.-Y.; Sun, Y.; Zhang, X.-Z. Augment of Oxidative Damage with Enhanced Photodynamic Process and MTH1 Inhibition for Tumor Therapy. Nano Lett. 2019, 19, 5568–5576. [Google Scholar] [CrossRef] [PubMed]
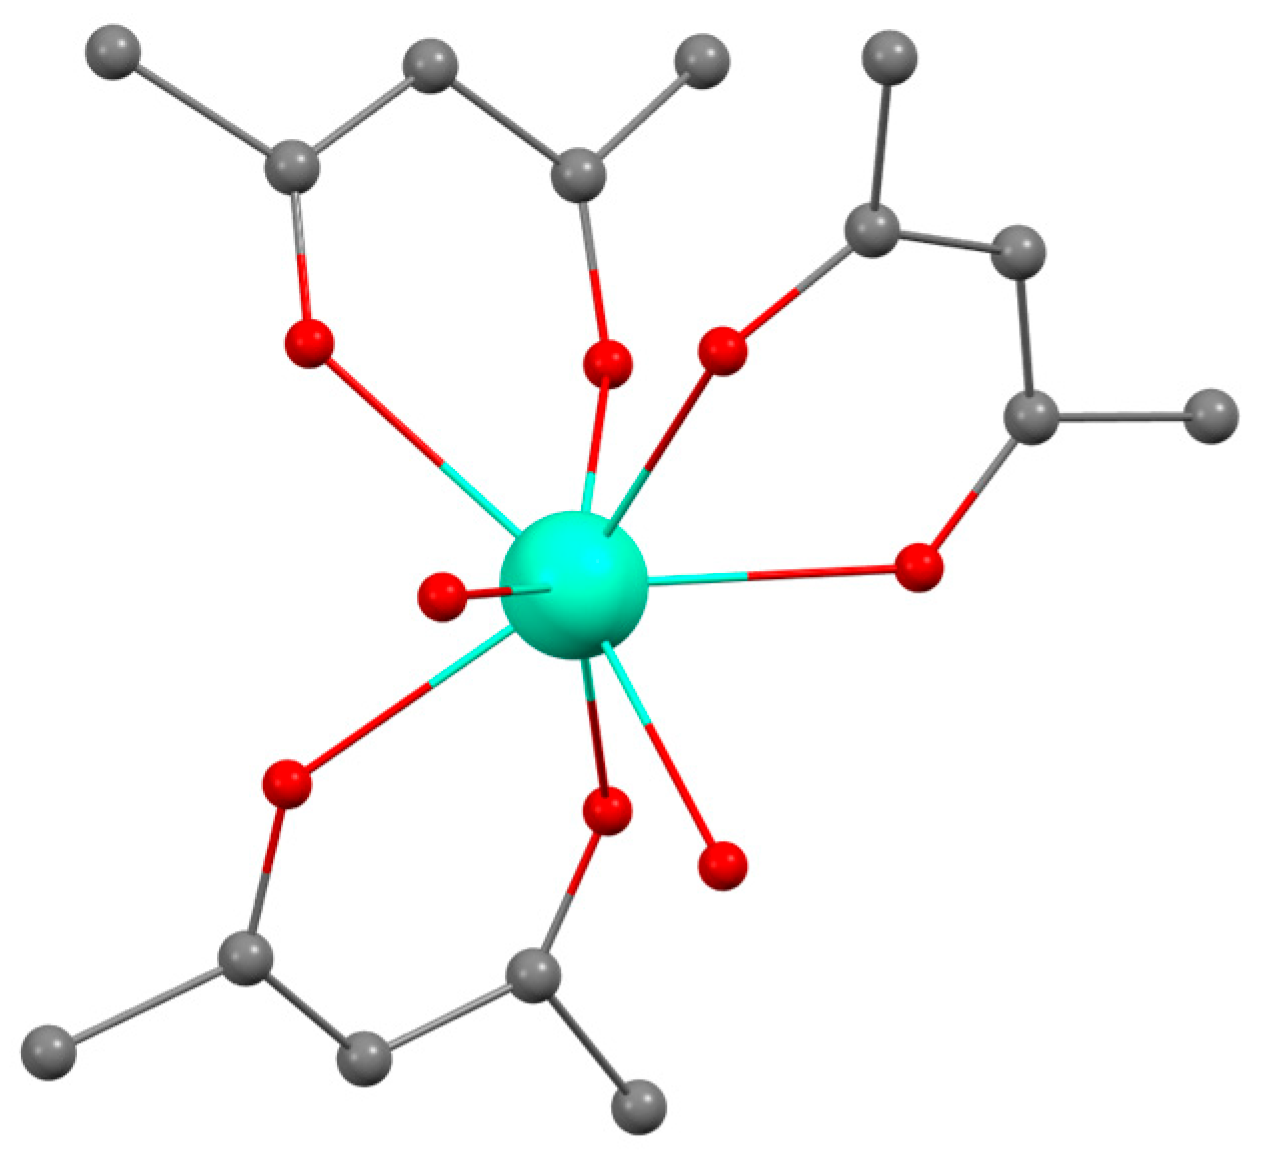
Figure 1. Crystal structure of the Gd(acac)3(H2O)2 compound (C in grey, O in red, and Ln in cyan). Hydrogen atoms are omitted for clarity [70].
Inorganics 13 00304 g001
Figure 2. (Left) Room temperature solid-state excitation spectra of 1Eu (red) performed with λem = 611 nm, 1Tb1.5/1Eu8.5 (black) monitored with λem = 545 nm, and 1Tb (green) performed with λem = 545 nm; (Right) solid-state room temperature emission spectra (λex = 330 nm) of 1Eu (red), 1Tb1.5/1Eu8.5 (brown), and 1Tb (green).
Inorganics 13 00304 g002
Figure 3. (a) Temperature-dependent emission spectra of 1Eu under excitation at 330 nm in the 293–353 K range (from blue to red color); (b) temperature dependence of the main intensity for the 5D07F2 transition (integrated area) for 1Eu. Inset: Temperature dependence of Sr. The solid line represents a second-degree polynomial fitting. Integrated areas: 604–614 nm (Eu3+). The error bars correspond to the standard error of the mean value determined from three consecutive cycles; (c) temperature-dependent emission spectra of 1Tb1.5/1Eu8.5 solid powder under excitation at 330 nm in the 293–353 K range; (d) the corresponding temperature dependence of the LIR for the main Tb3+ (5D47F5) and Eu3+ (5D07F2) transitions for 1Tb1.5/Eu8.5. Inset: Temperature dependence of Sr. The solid line represents a second-degree polynomial fitting. Integrated areas: 530–560 nm (Tb3+) and 604–614 nm (Eu3+). The error bars correspond to the standard error of the mean value determined from three consecutive cycles.
Inorganics 13 00304 g003
Figure 4. (a) Lifetime (λex = 330 nm, λem = 611 nm) of 1Eu at different temperatures ranging from 293 (blue) to 353 K (red) measured in the solid state; (b) corresponding amplitude-averaged lifetime. The solid line represents a second-degree polynomial fitting. Insert: Temperature dependence of Sr. The error bars correspond to the standard error of the mean determined from three consecutive temperature cycles.
Inorganics 13 00304 g004
Figure 5. (a) Schematic diagram of energy levels influenced by thermal population, leading to hot band emissions for Yb3+: blue arrows represent zero-phonon line components (E′0 → G0–G3); red arrows represent hot band transitions (E′1/E′2 → G0); and the violet double arrow corresponds to Boltzmann population exchange between E′0 and E′2. Level spacings are not to scale; (b) solid-state room temperature excitation spectrum (black) monitored at 976 nm and emission spectrum (orange) for 1Yb performed with excitation at 336 nm.
Inorganics 13 00304 g005
Figure 6. (a) Emission spectra of 1Yb in the 293–353 K temperature range (from blue to red) measured under excitation at 336 nm; (b) temperature dependence of LIR (taken between integrated areas: 970–985 and 1040–1060 nm). The solid line represents a second-degree polynomial fitting. Inset: Temperature dependence of Sr. The error bars correspond to the standard error of the mean value determined from three consecutive temperature cycles.
Inorganics 13 00304 g006
Figure 7. (a) TEM images for the pristine PB nano-objects and (b) PB@SiO2-acac/(1Eu), (c) PB@SiO2-acac/(1Tb2/1Eu8), and (d) PB@SiO2-acac/(1Yb) nano-objects.
Inorganics 13 00304 g007
Figure 8. (a) Left: Excitation spectra of PB@SiO2-acac/(1Eu) (red) monitored at λem = 615 nm and PB@SiO2-acac/(1Tb2/1Eu8) (black) monitored at λem = 615 nm; Right: Emission spectra of PB@SiO2-acac/(1Eu) (red) performed with λexc = 313 nm and of PB@SiO2-acac/(Tb2/Eu8) (maroon) performed with λexc = 300 nm. All spectra were measured at 293 K in the solid state. (b) Room temperature excitation (black) and emission (orange) spectra (under excitation at 336 nm) for the PB@SiO2-acac/(1Yb) compound.
Inorganics 13 00304 g008
Figure 9. (a) Temperature-dependent emission spectra of PB@SiO2-acac/(1Eu) under excitation at 315 nm in the 293–333 K range (from blue to red); (b) temperature dependence of the main intensity for the 5D07F2 transition (integrated area). Inset: Temperature dependence of Sr. The solid line represents a second-degree polynomial fitting. Integrated areas: 604–640 nm (Eu3+). The error bars correspond to the standard error of the mean determined from three consecutive cycles. (c) Lifetime (λex = 315 nm, λem = 615 nm) of PB@SiO2-acac/(1Eu) at different temperatures ranging from 293 to 333 K measured in the solid state; (d) corresponding amplitude-averaged lifetime. The solid line represents a second-degree polynomial fitting. Insert: temperature dependence of Sr. The error bars correspond to the standard error of the mean determined from three consecutive temperature cycles.
Inorganics 13 00304 g009
Figure 10. (a) Lifetime (λex = 300 nm, λem = 615 nm) for PB@SiO2-acac/(1Tb2/1Eu8) at different temperatures ranging from 293 (blue) to 333 K (red) measured in the solid state; (b) corresponding amplitude-averaged lifetime. The solid line represents a second-degree polynomial fitting. Insert: Temperature dependence of Sr. The error bars correspond to the standard error of the mean determined from three consecutive temperature cycles.
Inorganics 13 00304 g010
Table 1. Summary of the studied nanothermometers and their characteristics.
ThermometerSignal TypeReadout ModeWindowSrmaxδT δ T ¯
1TbIntensityNon-ratiometricVisible1.0%·K−1
(at 353 K)
1.7 K
(at 353 K)
5.7 K
1EuIntensityNon-ratiometricVisible6.5%·K−1
(at 338 K)
0.1 K
(at 303 K)
0.2 K
LifetimeSelf-referenced2.9%·K−1
(at 340 K)
0.02 K
(at 313 K)
0.5 K
1Tb1.5/1Eu8.5IntensityRatiometric
(double-band approach)
Visible3.2%·K−1
(at 320 K)
1.1 K
(at 333 K)
1.5 K
1YbIntensityRatiometric
(single-band approach)
NIR0.5%·K−1
(at 293 K)
0.5 K
(at 303 K)
1.6 K
Table 2. Main thermometric parameters of the studied hybrid nanoparticles.
SamplesLoadingSignal TypeReadout ModeWindowSrmaxδT δ T ¯
PB@SiO2-acac/(1Eu)0.28IntensityNon-ratiometricVisible2.1%·K−1
(at 333 K)
6.7 K
(at 313 K)
7.6 K
LifetimeSelf-referenced1.2%·K−1
(at 315 K)
7.2 K
(at 318 K)
8.1 K
PB@SiO2-acac/(1Tb2/1Eu8)0.48IntensityRatiometricVisible0.6%·K−1
(at 293 K)
21 K
(at 323 K)
21.6 K
LifetimeSelf-referenced0.9%·K−1
(at 333 K)
0.21 K
(at 303 K)
1.1 K
PB@SiO2-acac/(1Yb)0.31IntensityRatiometric
(Single band approach)
NIR---
Disclaimer/Publisher’s Note: The statements, opinions and data contained in all publications are solely those of the individual author(s) and contributor(s) and not of MDPI and/or the editor(s). MDPI and/or the editor(s) disclaim responsibility for any injury to people or property resulting from any ideas, methods, instructions or products referred to in the content.