Article

Structural Water Accommodation in Co3O4: A Combined Neutron and Synchrotron Radiation Diffraction and DFT Study

1
Dipartimento di Chimica, Università degli Studi di Milano, via C. Golgi, 19, 20133 Milano, Italy
2
Dipartimento di Chimica, Università di Pavia, via Taramelli, 16, 27100 Milano, Italy
3
Istituto di Scienze e Tecnologie Chimiche “Giulio Natta” (SCITEC) del Consiglio Nazionale delle Ricerche (CNR), via C. Golgi, 19, 20133 Milano, Italy
*
Authors to whom correspondence should be addressed.
Inorganics 2025, 13(9), 288; https://doi.org/10.3390/inorganics13090288
Submission received: 28 July 2025 / Revised: 21 August 2025 / Accepted: 22 August 2025 / Published: 27 August 2025

Abstract

Spinels like Co3O4 have acquired relevance because of their photocatalytic, electrocatalytic, optical and magnetic properties. In this context, we investigated the defect structure evolution of compounds synthetized using the nitrate precursor method and after annealing cycles at temperatures ranging from 260 to 650 °C by means of thermogravimetric analysis (TGA), neutron powder diffraction (NPD), X-ray powder diffraction (XRPD) coupled to Pair Distribution Function (PDF) analysis, and Density Functional Theory (DFT) calculations. Deuterated and hydrogenated precursors were adopted to produce the samples for NPD and XRPD experiments, respectively. TGA measurements displayed weight losses, the extent of which increased on lowering the preparation annealing temperature, suggesting that the adopted wet synthesis introduces structural water in the sample. Both XRPD and NPD revealed the presence of vacancies in tetrahedral cobalt sites ( V C o 1 ) whose concentration at RT decreases on raising the annealing temperatures, while octahedral cobalt and oxygen sites were fully occupied in all the samples. In addition, the V C o 1 presence induces a shrinking of the volume of the CoO4 tetrahedra. The combination of DFT calculation and diffraction revealed that deuterium/hydrogen ions ( D i / H i ), introduced during the synthesis by the nitrate precursor balanced the V C o 1 . Finally, DFT calculations revealed that ( D i / H i ) in Co3O4 forms hydroxyl groups.

Graphical Abstract

1. Introduction

In recent years, cobalt spinel, Co3O4, has acquired relevance because of its catalytic [1,2,3,4,5,6,7,8,9], electrocatalytic [9,10,11,12], optical [13,14,15,16], magnetic [17,18,19] and photocatalytic properties [14,20,21]. Moreover, it has promising applications in innovative devices [22].
When coupled with additional phases to form a heterostructure, Co3O4 reveals interesting dielectric and electrode properties [11,22,23,24].
Many available preparation routes exist for Co3O4, spanning from comparatively simple to complex ones, e.g., the decomposition of many inorganic salts [17,18,25] or organometal complexes [26] that have recently been adopted to produce nanosized compounds [16,17,18,19,20,21,25,27]. Nitrate-based reactions are also widely used to obtain supported and unsupported Co3O4 due to the low cobalt nitrate decomposition temperature (T < ~200 °C) and self-sustaining oxidizing atmosphere (from NO3 decomposition) that simplify operations, also alleviating any concern for thermal substrate stability. The preparation is also of interest for fundamental Co3O4 features.
Co3O4 is commonly accepted to be anhydrous regardless of preparation, and to contain excess oxygen in amounts that vary by an approximately inverse temperature dependence, from limiting low values at T ≈ 600–800 °C, where the nominal composition (O/Co = 4/3) is approached, to much greater ones (usually unspecified) near ambient temperature. Excess oxygen is believed to be charge-compensated, promoting cobalt ions to higher valence, either Co2+ to Co3+ [28,29,30] or Co3+ to Co4+ [31,32,33,34,35,36,37], depending on the assumed defect model.
According to other authors, the synthesis method influences composition, the presence of defects and vacancies, and finally the overall properties of synthesized materials [17,18,19,32,34,38,39,40,41]. As an example, Gautier [42] and Formaro [43] have evidenced the presence of “structural water” accommodation in the mixed valence oxide Co3O4 prepared using nitrate precursors. Cobalt-coordinated water from the nitrate precursor is likely at the origin of “structural water”, left over in reaction products in spite of the wide variations in preparation conditions reported in the literature.
However, these two different positions in the literature refer to the same oxide, thus highlighting that Co3O4 is characterized by a complex defectivity that has not been fully understood yet. Given the importance of defectivity in the electronic properties of Co3O4 and, therefore, in the catalytic and electrocatalytic behaviour of this material, which is frequently used as an effective catalyst in both gas–solid and liquid-solid applications [5,8,9,10,12,24,44], it is believed that further investigation is necessary to clarify its defectivity.
Thus, in this paper we report a contribution to the problem of “structural water” accommodation in the mixed valence oxide Co3O4. The paper relies on structural investigations by means of both neutron and synchrotron radiation powder diffraction, to take advantage of their complementarity [45], coupled to ab initio DFT calculations to check the structure and the formation energies of different possible defects. Deuterated samples were produced for neutron diffraction to take advantage of the large scattering length of D (and O) and avoid the undesired incoherent scattering of H.
We will show that sizeable water amounts are present in Co3O4 produced by the thermal decomposition of Co(NO3)2∙6H2O, in the form of hydroxyl groups which balance cobalt vacancies in tetrahedral sites of the cobalt oxide spinel structure. Thus, H+/OH (with H+ binding to a different O ion forming a second OH group) are actually meant for “structural water”, these ions being presumably distributed in the structure, in some as-yet-unexplored relation with the characteristic O/Co oxide defectivity.

2. Results and Discussion

2.1. Thermogravimetric Measurements

Figure 1 reports the TGA curves on all the deuterated samples. In this figure, samples D550 and D650 show straightforward behaviour, with profiles that are almost flat from room temperature to T ≈ 700 °C where mass loss begins, this being completed at T = 820 °C. The mass loss of both samples (Δw = 6.6 ± 0.01%) reasonably agrees with the calculated value for Co3O4→ 3CoO + ½O2 transformation (Δw = 6.64%). The same process also occurs with the same temperature range and mass loss on samples from lower annealing temperatures Tann., even though it is shifted to lower initial mass percentage at 700 °C: this becomes smaller with decreasing Tann. of the samples, due to superposition with other processes taking place at lower temperatures with decreasing Tann. TGA results on hydrogenated samples produced with the same synthetic path as the present ones are reported in Ref. [43].

2.2. Average Structure

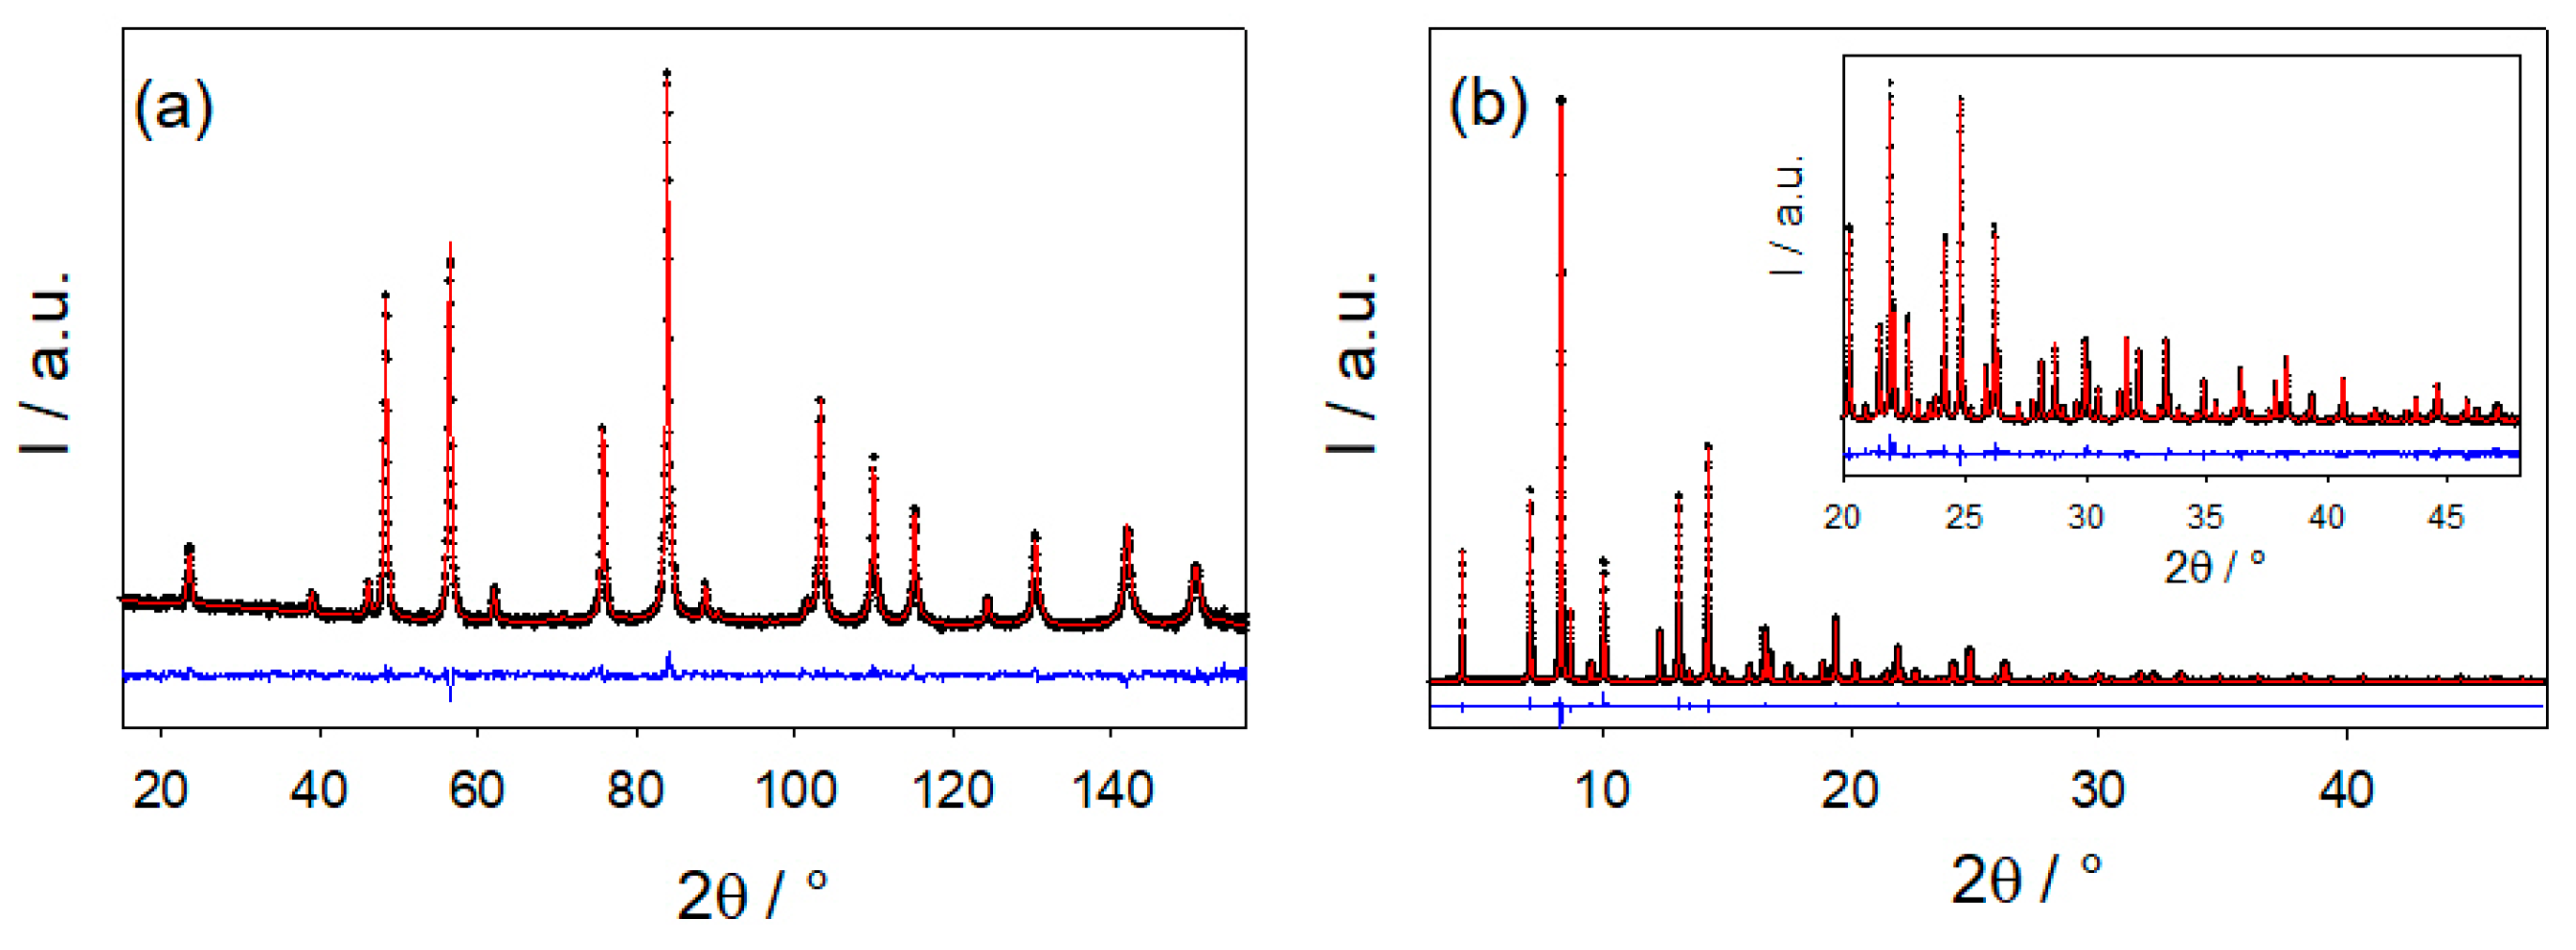
The structure of all the deuterated samples was investigated by means of neutron diffraction. Figure 2a reports the experimental neutron diffraction pattern collected on the D260 sample (black crosses). In addition, high-resolution synchrotron radiation diffraction patterns were also collected on the H260 and H650 samples to reveal complementary structural information at the lowest and highest Tann. values. The pattern of the H260 sample is reported in Figure 2b, as an example.
For these selected samples, we will take advantage of the different scattering power of the involved atoms using neutrons or X-rays In fact, while the atomic form factor for X-ray scattering at Q = 0 is strictly related to Z (=1, 8 and 27 for H, O and Co, respectively), the neutron scattering lengths for D, O and Co are 6.671, 5.803 and 2.49 fm, respectively. X ray diffraction is mostly sensitive to Co scattering, while information on D and O structures is likely recovered from neutron diffraction.
The Rietveld refinement performed on neutron diffraction patterns revealed the presence of the spinel-like Co3O4 phase (cubic system, space group F d 3 ¯ m , n. 227). Figure S1 reports, as an example, the structure resulting from the refinement of D260 sample neutron data. In this structure, two non-equivalent Co sites exist; positioning the cell origin at 3 ¯ m (choice 2), the tetrahedral Co1 site (Co2+ ions, green spheres and tetrahedra in Figure S1) is at 8a (⅛, ⅛, ⅛), while the octahedral Co2 site (Co3+ ions, blue spheres and tetrahedra in Figure S1) is at 16d (½, ½, ½); oxygen ions occupy only one non-equivalent position O at 32e (x, x, x), with x ≈ ¼ [hereafter xO]. xO is the unique positional degree of freedom of this phase, since all the other ones are fixed by symmetry [46,47]. Tetrahedra share corners with octahedra only, while the latter ones additionally share six edges with nearest neighbour octahedra. Finally, it is worth citing the tetrahedral 8b (3/8, 3/8, 3/8) and 48f (≈3/8, 1/8, 1/8) and the octahedral 16c (0, 0, 0) sites that are empty in the spinel structure but could in principle locate interstitial Co ions [46,48].
In addition to the intense Bragg peaks of the spinel phase, a tiny peak around 53.02° appears which could correspond to the 002 reflection of CoO. Attempts to refine the phase fraction in D260 brought the weight fraction value to around 0.4%.
In preliminary refinements (model_1), the cell constant a, xO and three isotropic thermal parameters (UCo1, UCo2 and UO for the Co1, Co2 and O sites, respectively) were varied. UCo1 increased steeply on lowering Tann., as reported in Figure 3a, despite all the measurements being taken at the same (room) temperature. In addition, in the Fourier Difference Density (FDD) maps for all the samples, intense FDD minima centred on the Co1 site were found, whose intensity lowers on rising Tann.
Therefore, in the final structural models, the occupancy of the Co1 site (ofCo1) was allowed to vary in the refinements as well as the cell parameter, xO and the two thermal parameters for Co (UCo) and O (UO) sites, respectively (model_2). This brought a noticeable increase in the fit quality, especially when samples annealed at the lowest Tann. values were involved. Also, Tronel and co-workers detected cobalt vacancies preferentially at the Co1 site in Co3O4-containing electrodic materials, detecting a Co/O ratio smaller than 3/4 [31]. Conversely, attempts to change the occupational factors of Co2, as suggested by Ref. [49], brought values larger than 1. The fit according to model_2 relative to the sample annealed at 260 °C (D260) is displayed in Figure 2a as a red curve. The refined parameters for all the samples are reported in Table 1.
Using this last model, the anomalous trend of the Co thermal parameters is removed (see Figure 3b). The cell parameter a and xO coordinate increase with the annealing temperature as well as ofCo1, as displayed in Figure 3c and Table 1. In the most defective sample (D260), about 9% of the Co ions are vacant; ofCo1 rises on increasing Tann. and for the D650 sample ofCo1 = 0.98.
The value of xO is strictly bound to the geometry and the dimension of the oxygen cages that surround Co ions. When xO becomes larger than ¼, the O-Co2-O angles bend and the six equivalent Co2-O distances decrease, thus causing a distortion and a shrinkage of the octahedral environment of Co2. At the same time, the tetrahedral environment of Co1 remains undistorted but the Co1-O distances increase, as well as the tetrahedron volume (Vtet), according to the following equation [46]:
V t e t = 8 3 a 3 x O 0.125 3
Co1 vacancy formation promotes the shrinkage of the Co1 tetrahedron volume. The tetrahedron volume contraction ΔVtet revealed by NPD passing from the D650 to the D260 samples was quite small (≈0.4%); however, it is worth supposing that the formation of a Co1 vacancy induces the local distortion of the position of the oxygen ions around it. Since only a fraction of the O1 ions should be involved, both xO and Vtet values determined by Rietveld analysis should be the weighted mean for Co1-full and Co1-empty tetrahedra; larger “local” xO and Vtet changes should locally occur around each Co1 vacancy.
The same structural models applied for NPD were also tested for X-ray diffraction, obtaining similar Tann. evolution. In particular, refined ofCo1 < 1 and ofCo2 ≈>1 are found when they are both allowed to vary; moreover, annealing at larger T values increases a, xO, and ofCo1 parameters, as well as Vtet. Finally, a small fraction of CoO is revealed in H260 (wf ≈ 0.04), while it disappears in H650. Table S1 of the Supplementary Information reports the refined parameters applying model_2. We note that the small differences in the absolute values of the refined parameters after the NPD and XRPD data refinements could be attributed to slightly different reaction paths using deuterated and hydrogenated precursors.
As Co1 vacancies ( V C o 1 ) are negatively charged, they must be compensated by some positive charged defect. The possible candidates are as follows: (1) Co ions in interstitial sites ( C o i ), forming Frenkel defects; (2) electronic defects, which can be represented as positive charges on the Co1 (( C o C o 1 ), Co2 ( C o C o 2 ), and O ( O O ) ions; (3) oxygen vacancies ( V O ); and finally (4) interstitial deuterium ions ( D i ) in the proximity of the Co1 vacancies. The last mechanism implies that deuterium ions are introduced during the synthesis and, in other words, that structural water is present in the structure, as proposed in Refs. [42,43].
NPD measurements revealed that high T annealing cycles remove most of the Co1 vacancies, and the ideal spinel structure is approached. This process can be described by different equations, depending on the defect that compensates the negative charge induced by Co1 vacancies. Using the Kröger–Vink notation [50], they are:
V C o 1 + C o i C o C o 1 x
3 V C o 1 + 6 C o C o 1 + 18 C o C o 2 + 36 O O 8 C o 3 O 4 + 2 O 2
3 V C o 1 + 6 C o C o 2 + 12 O O 2 C o 3 O 4 + 2 O 2
3 V C o 1 + 6 C o C o 2 + 6 O O + 6 O O 2 C o 3 O 4 + 2 O 2
3 V C o 1 + 6 C o C o 2 + 9 O O + 3 V O 1 2 C o 3 O 4 + 1 2 O 2
3 V C o 1 + 6 D i + 6 C o C o 2 + 12 O O 2 C o 3 O 4 + 3 D 2 O + 1 2 O 2
where Co3O4 in the equations indicates a defect-free spinel structural unit (SSU) made up of one Co1 site, two Co2 sites and four O sites.
While Equation (1) does not affect the compound stoichiometry Co3O4, in all the remaining cases, the removal of V C o 1 implies weight loss due to oxygen (and water) evolution. Independently of the mechanism, this qualitatively agrees with the trends revealed by TGA measurements: the smaller the Tann., the larger the [ V C o 1 ] and the sample weight loss before the Co3O4 → CoO transformation. In the case of Equation (2a–c), the correct formula to describe our samples is Co3-xO4, while for Equations (3) and (4), it is Co3-yO4-y and Co3-zD2zO4, respectively.
Different defects affect the structure in different ways. Equation (1) implies the presence of interstitial Co ions, that is, the partial occupation of 8b, 16c and/or 48f sites. In Equation (2a–c), the negative charge of V C o 1 is compensated only by electronic defects, without additional atomic point defects. According to Equation (3), the Co1 vacancies are balanced by oxygen, bringing a decrease in the oxygen occupational factor. Finally, Equation (4) implies the presence of D+ ions, which have not been included up to now in the structural models.
To distinguish among different mechanisms of charge compensation, the patterns of the D260 and H260 samples (the most defective ones) were fitted with additional structural models, where C o i , V O or D i ( H i for XRPD measurements) are explicitly introduced.
To account for mechanism (1), we also inserted Co ions into the 8b (test_1), the 16c (test_2) or the 48f (test_3) sites, following Ref. [48]. Neutron diffraction detected very small positive site occupations in the 48f site, without any improvement of the fit quality. Conversely, for X-ray diffraction, their refined values were always slightly smaller than zero. Considering that X-ray data are more sensitive to Co scattering with respect to neutrons, this allows us to discard mechanism 1.
Model 2, adopted to refine the NPD and XRPD data, includes all the defect chemistry of mechanism 2, because V C o 1 are balanced by electronic defects; as a consequence, no further tests are needed.
To detect possible oxygen under-stoichiometry, the occupational factor of the O site (ofO) was varied, obtaining refined values larger than 1 both for neutron and X-rays. This finding agrees with previous investigations on the defect chemistry of the Co3O4 compound as a function of temperature and oxygen partial pressure: the disorder affects mainly the cation structure [51]. As a consequence, we will not consider Equation (3) in the following analysis.
To test mechanism 4, we individuated the position of the highest positive maximum in the Fourier Density Difference (FDD) maps of model_2. In this way, Ammundsen et al. detected structural deuterium in the Li1+xMn2−xO4 spinel after lithium–deuterium ion exchange. They found that deuterium ions were incorporated into the crystal structure as –OD units, with D-O distances in the order of ~1.1 Å with a D concentration of 4.2 D per cell [52]. For each sample, a strong positive maximum appeared in the FDD maps at the ≈0.061, ≈0.061, ≈0.061 sites, with symmetry .3m (site multiplicity = 32) with an intensity that decreases with increasing annealing temperature. In Figure S2 of the Supporting Information, the FDD map relative to the xy, z = 0.061 plane for the sample annealed at 260 °C is shown as an example. However, attempts to include D in the refinements brought about unstable refinements, possibly due to the small D concentration, even in the case where all the V C o 1 defects were compensated by D i s (≈1.4 D/cell for the D260 sample). Consequently, the above neutron diffraction findings alone cannot discriminate among different defect models; additional probes are needed.
To obtain an accurate picture of the defect chemistry and structure of defects of Co3O4 at the local scale, we adopted the real space analysis of X-ray powder diffraction data and performed DFT calculations.

2.3. Local Structure

Experimental PDF patterns on H260, H350, H450 and H650 samples were collected at the ID22 beamline of the ESRF, as described in the experimental section. The reduced total scattering functions F(Q) = [Q(S(Q)−1)] of all the samples are reported in Figure S3 of the SI, where S(Q) is the total scattering function as defined in [53].
The PDF pattern up to r = 200 Å are reported in Figure 4a. The damping of the amplitude of G(r) peaks has both physical and instrumental origins, the latter deriving from the coarse Q resolution of the 2D detector. Figure 4b displays a small portion of the same G(r) functions at high r values. The smaller G(r) amplitude for samples annealed at Tann. ≤ 450 °C with respect to H650 points to a reduced structural coherence of the former ones.
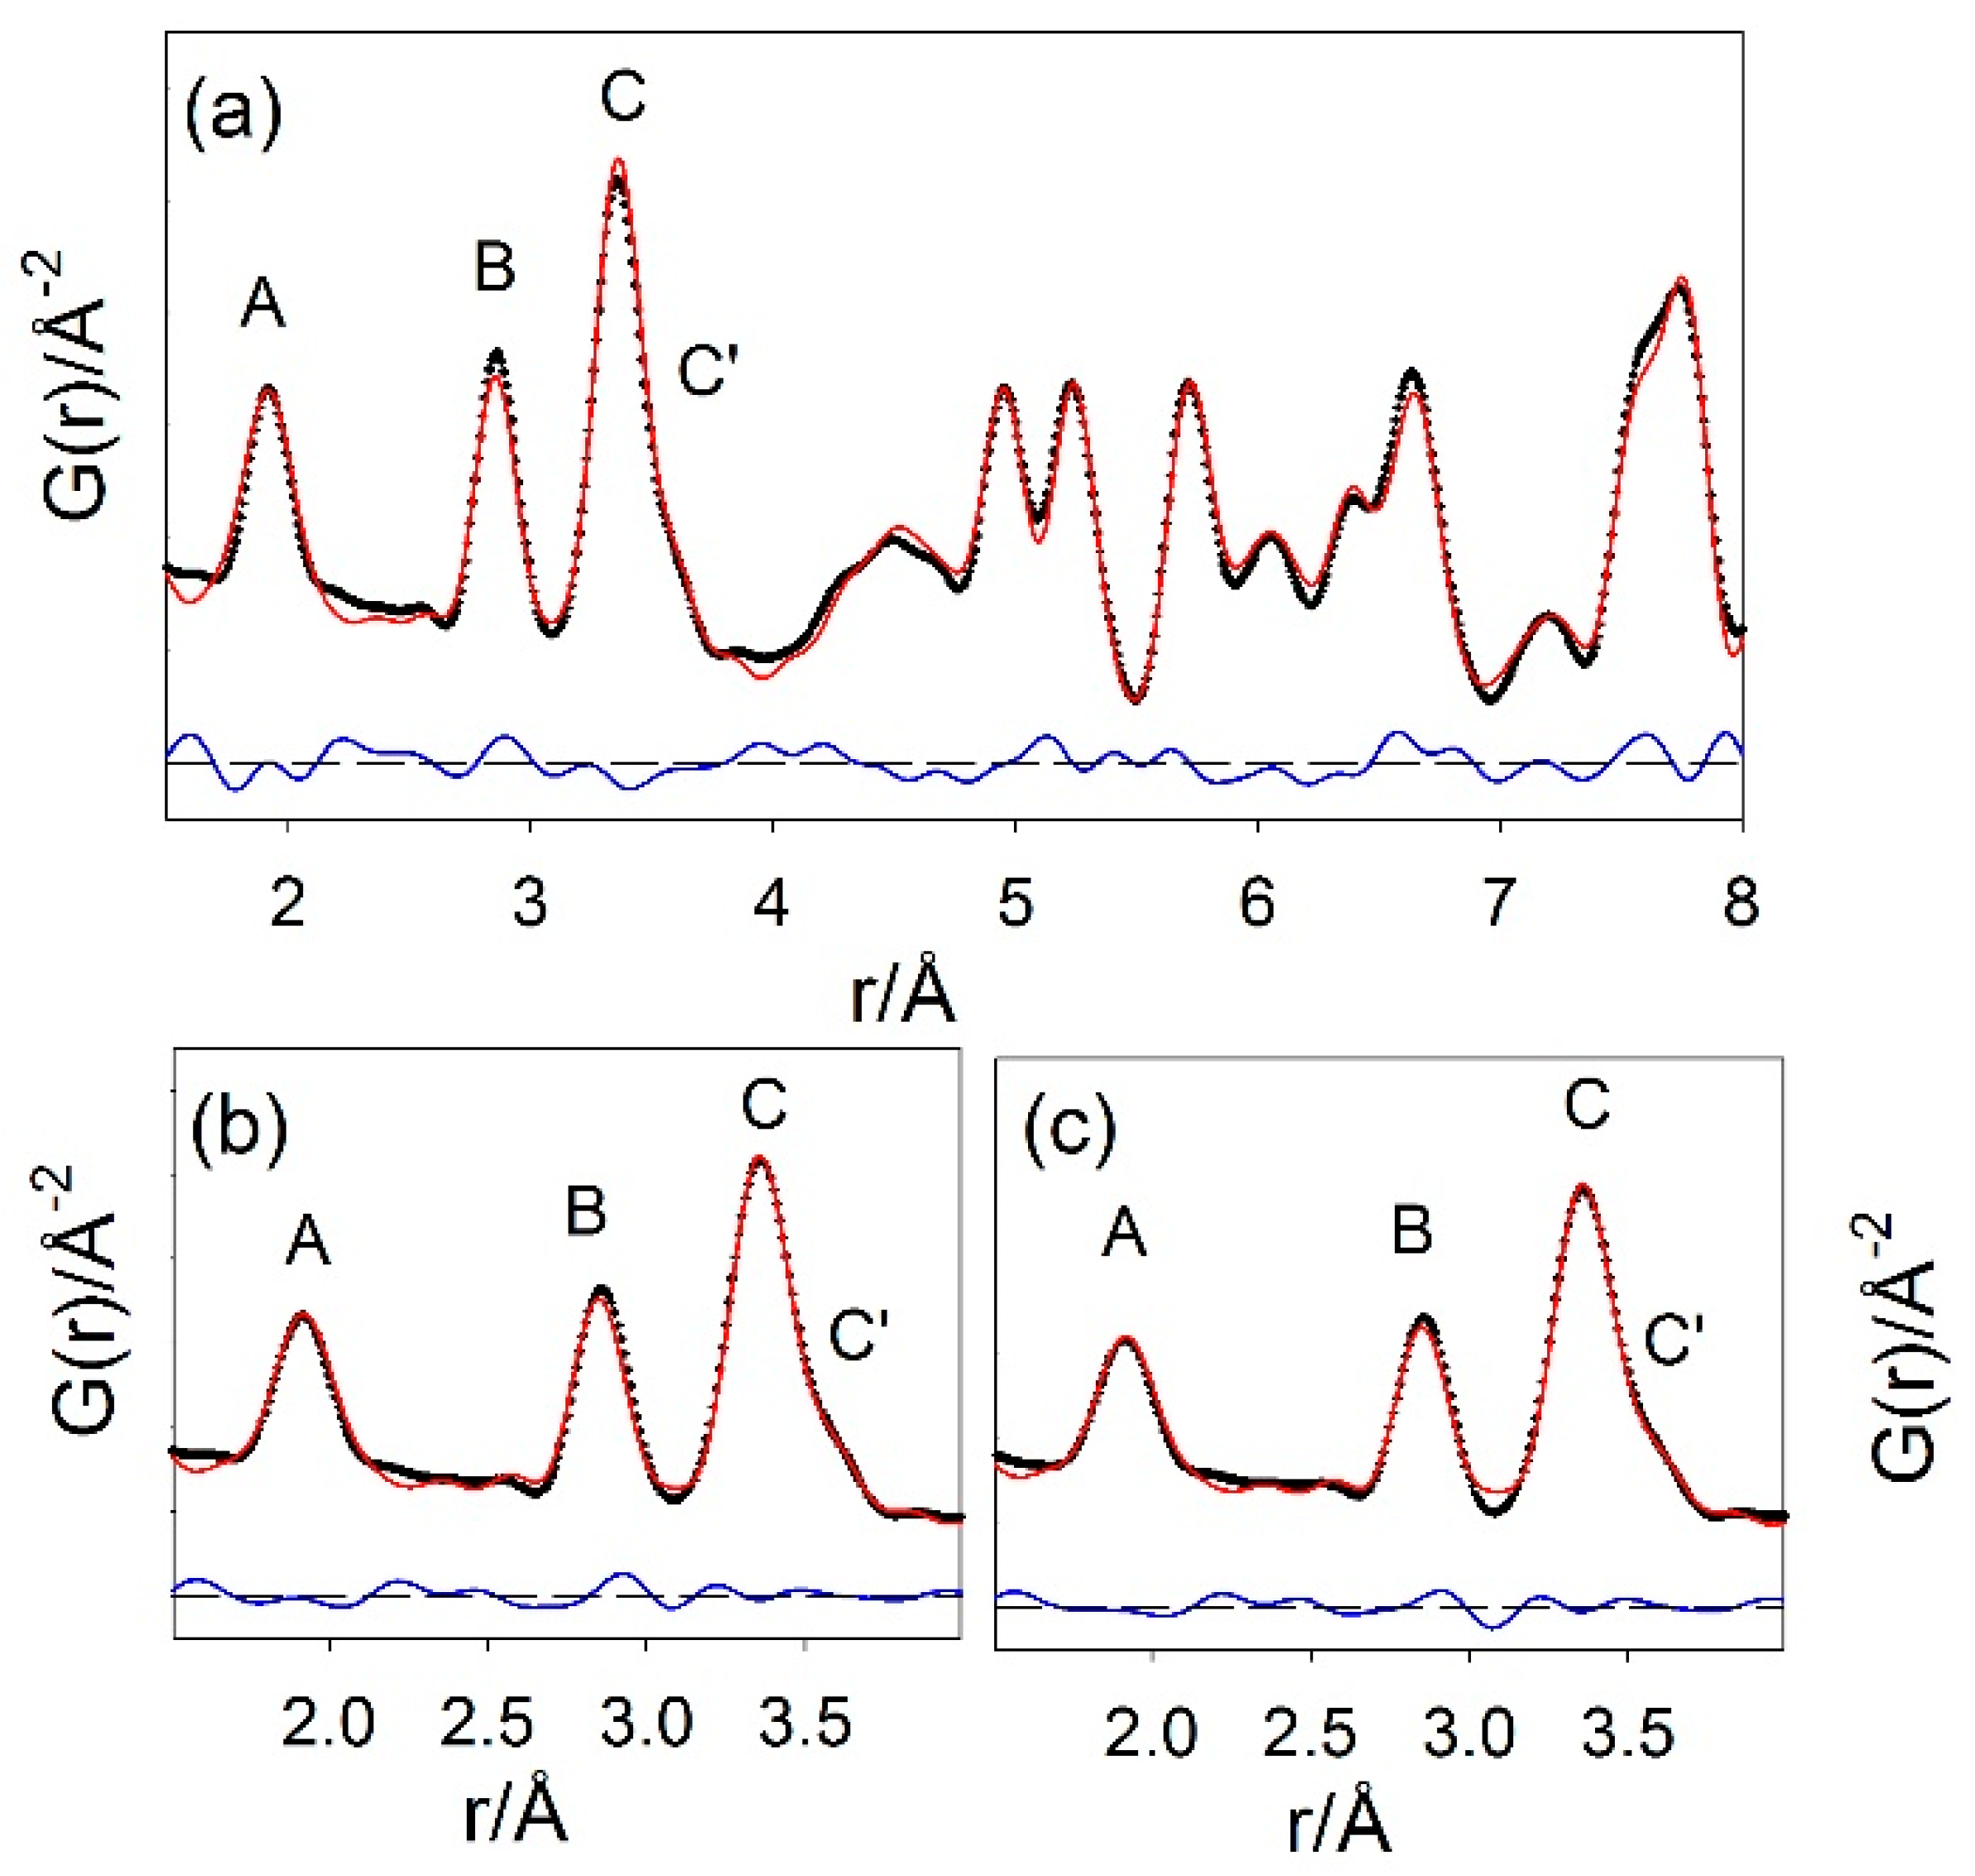
In Figure 4, the shortest interatomic distances of the spinel structure are easily identified: the peak around 1.9 Å, labelled A, encompasses all the nearest Co1/Co2-O distances; the one centred at ≈2.85 Å, labelled B, involves only distances between Co2-Co2 ions at the centre of edge-shearing octahedra. Co1-Co2, Co1-Co1 and Co1-O distances contribute to the following peaks around ≈3.35 Å (labelled C) and to its shoulder at its right side (C’) around 3.55 Å; in Figure 4c, the 2.5 < r < 4.0 interval is shown on an enlarged r scale. G(r) peak amplitudes have been slightly rescaled to equalize the height of the B peak, therefore evidencing the raising of the height of the peak C on increasing Tann.
Peaks A, B, C and C’ at low r values were first fitted using Gaussian functions. An example of fitting in 2.6 ≤ r ≤ 3.8 Å is shown in Figure 5a. The peaks C and C’ were constrained to have the same FWHM in the refinement to minimize correlations among parameters. All the peaks’ positions varied within one standard deviation in the whole Tann. interval. In the (b) panel of Figure 5, the ratio IC+C’/IB between the intensity of peaks around ≈3.35–3.55 Å (IC+C’) and the one around ≈2.85 Å (IB) vs. Tann. is displayed. C and C’ peaks are contributed by interatomic distances involving at least one Co1 ion, while only Co2-Co2 contacts contribute to B. The trend of IC+C’/IB on decreasing Tann. points again to some occupancy depletion of the Co1 site on lowering Tann.
To quantify this depletion in terms of Co1 site occupancy ofCo1, the same G(r) functions were analyzed using the real-space Rietveld analysis [53], applying model_2. First, we fitted the data in wide r ranges (e.g., 1.5–20 and 1.5–8 Å), allowing a, UCo, UO, xO and ofCo2 parameters to vary. In all cases, the fit quality was not very sensitive to the ofCo1 parameters. Figure 6a reports as an example the fit of the H260 sample in the 1.5–8 Å range.
Despite the acceptable fit quality (Rw = 0.132) and a refined value ofCo1 = 0.94 that confirms the presence of Co1 vacancies in the materials, some mismatch exists between data and refinement. In particular, the intensity of the peak around ≈2.85 Å is underestimated, while the one of the peaks around 3.35 Å is overestimated, suggesting that the occupation factor of Co1 is overestimated in the refined model. This effect is magnified when the full occupation of the Co1 site is imposed (see Figure S4 of the SI). In order to obtain distortions at the very local scale, we limited the fitting r interval to the range including the nearest Co-O and Co-Co distances, that is, 1.5–4 Å. To avoid correlations between xO and cell a parameters, the latter was fixed to the values refined in the 1.5–20 Å r range. Figure 6b,c shows the refinements for H260 and H650, while the refined parameters are reported in Table 2.
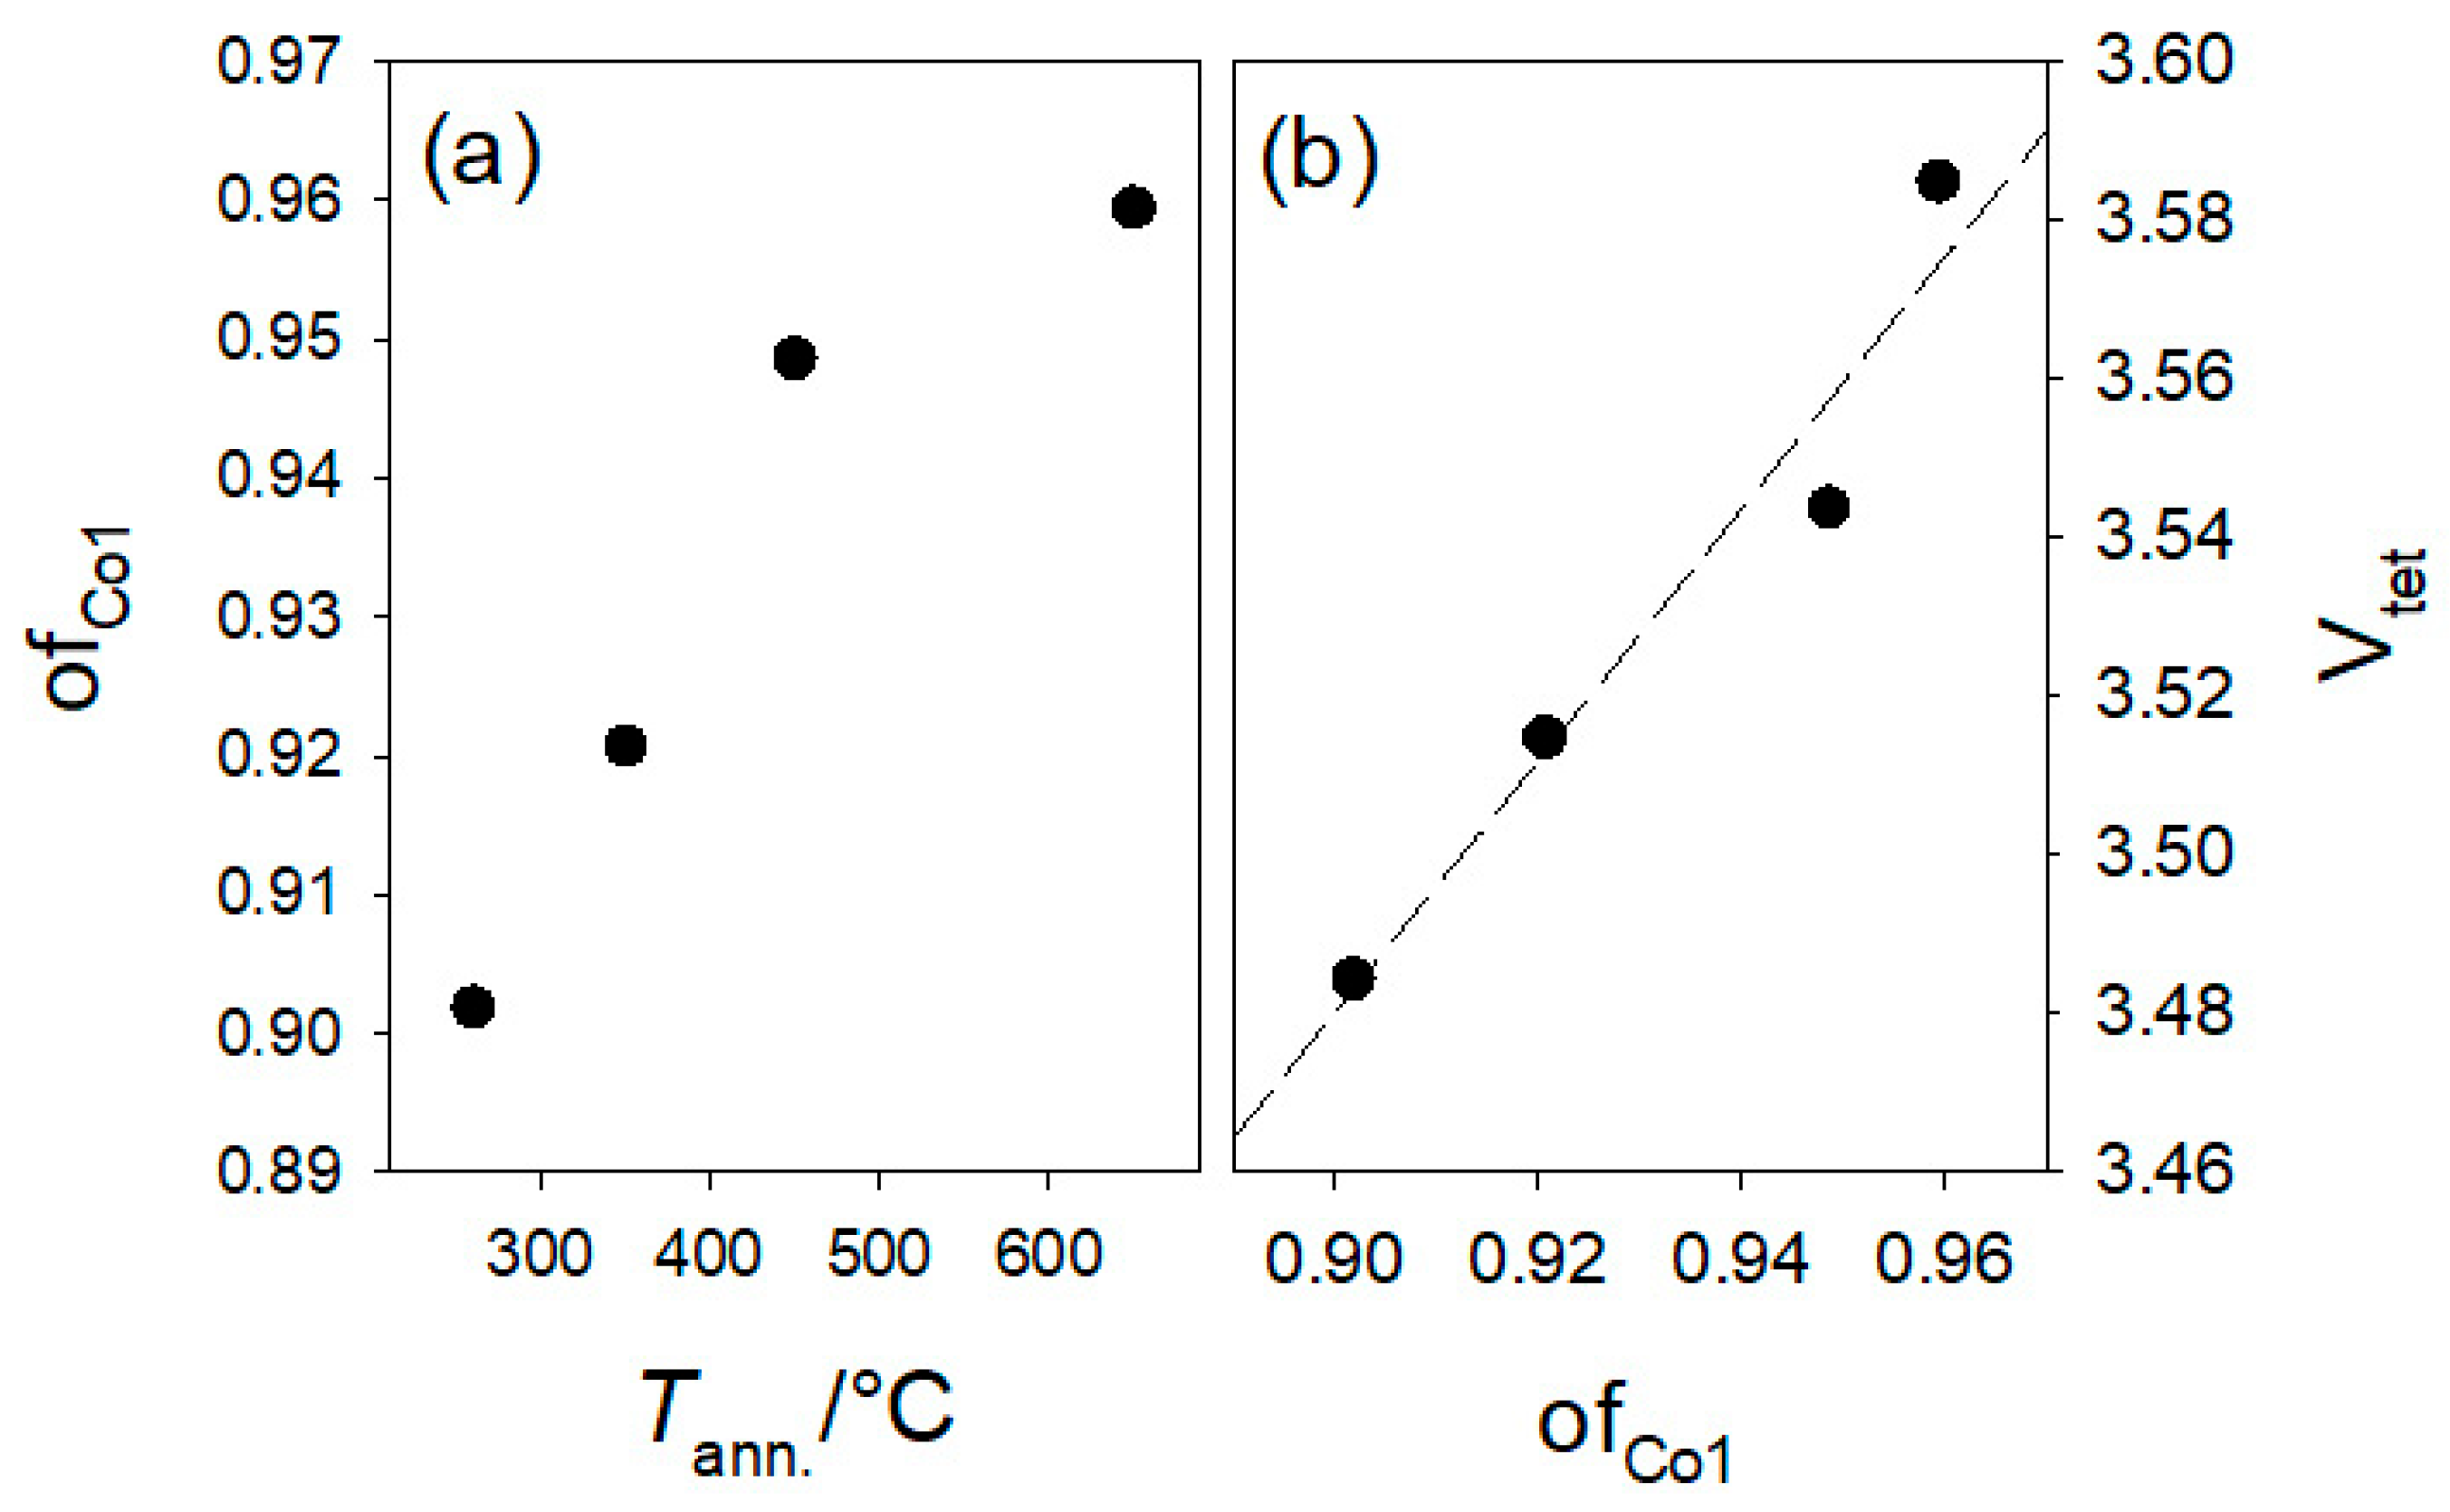
All the trends revealed by neutron diffraction are also confirmed by the PDF analysis at the local scale: a, xO and ofCo1 increase upon raising Tann. OfCo1 obtained by X-ray PDF analysis displayed in Figure 7a are in good accord with the NPD findings (see Figure 3c). Finally, the PDF results also indicate the shrinking of the volume of CoO4 tetrahedron Vtet on depleting ofCo1 (see Figure 7b). More severe effects are revealed by PDF with respect to the reciprocal space NPD analysis, i.e., smaller absolute Vtet values and larger changes upon varying ofCo1. This enforces the idea that Co vacancies heavily affect the structure at the local scale.
As a last comment, in Figure S5 of the SI, the IC+C’/IB ratio obtained by a direct analysis of G(r) peaks is plotted against the ofCo1 values refined by real-space Rietveld analysis of G(r)s in the 1.5–4 Å interval using model_2. The good linear correlation between the two quantities reveals that the IC+C’/IB ratio can be considered a model-free way to compare the site occupancy of the tetrahedral and octahedral sites in different spinel samples as a function of some coordinates, like, in the present case, Tann.
Obviously, X-ray PDFs are not sensitive to interatomic distances involving H atoms. To complete this study and distinguish between models (2) and (4), we performed DFT measurements on ideal and defective spinel-like Co3O4 compounds.

2.4. DFT Calculations

Firstly, DFT calculations were carried out on the ideally defect-free Co3O4 spinel structure. In the Co3O4 spinel structure, the Co2+ ions are coupled anti-ferromagnetically, as described in Ref. [54]. We found a magnetic moment of 2.41 μB on the Co2+, in good agreement with previous calculations [55].
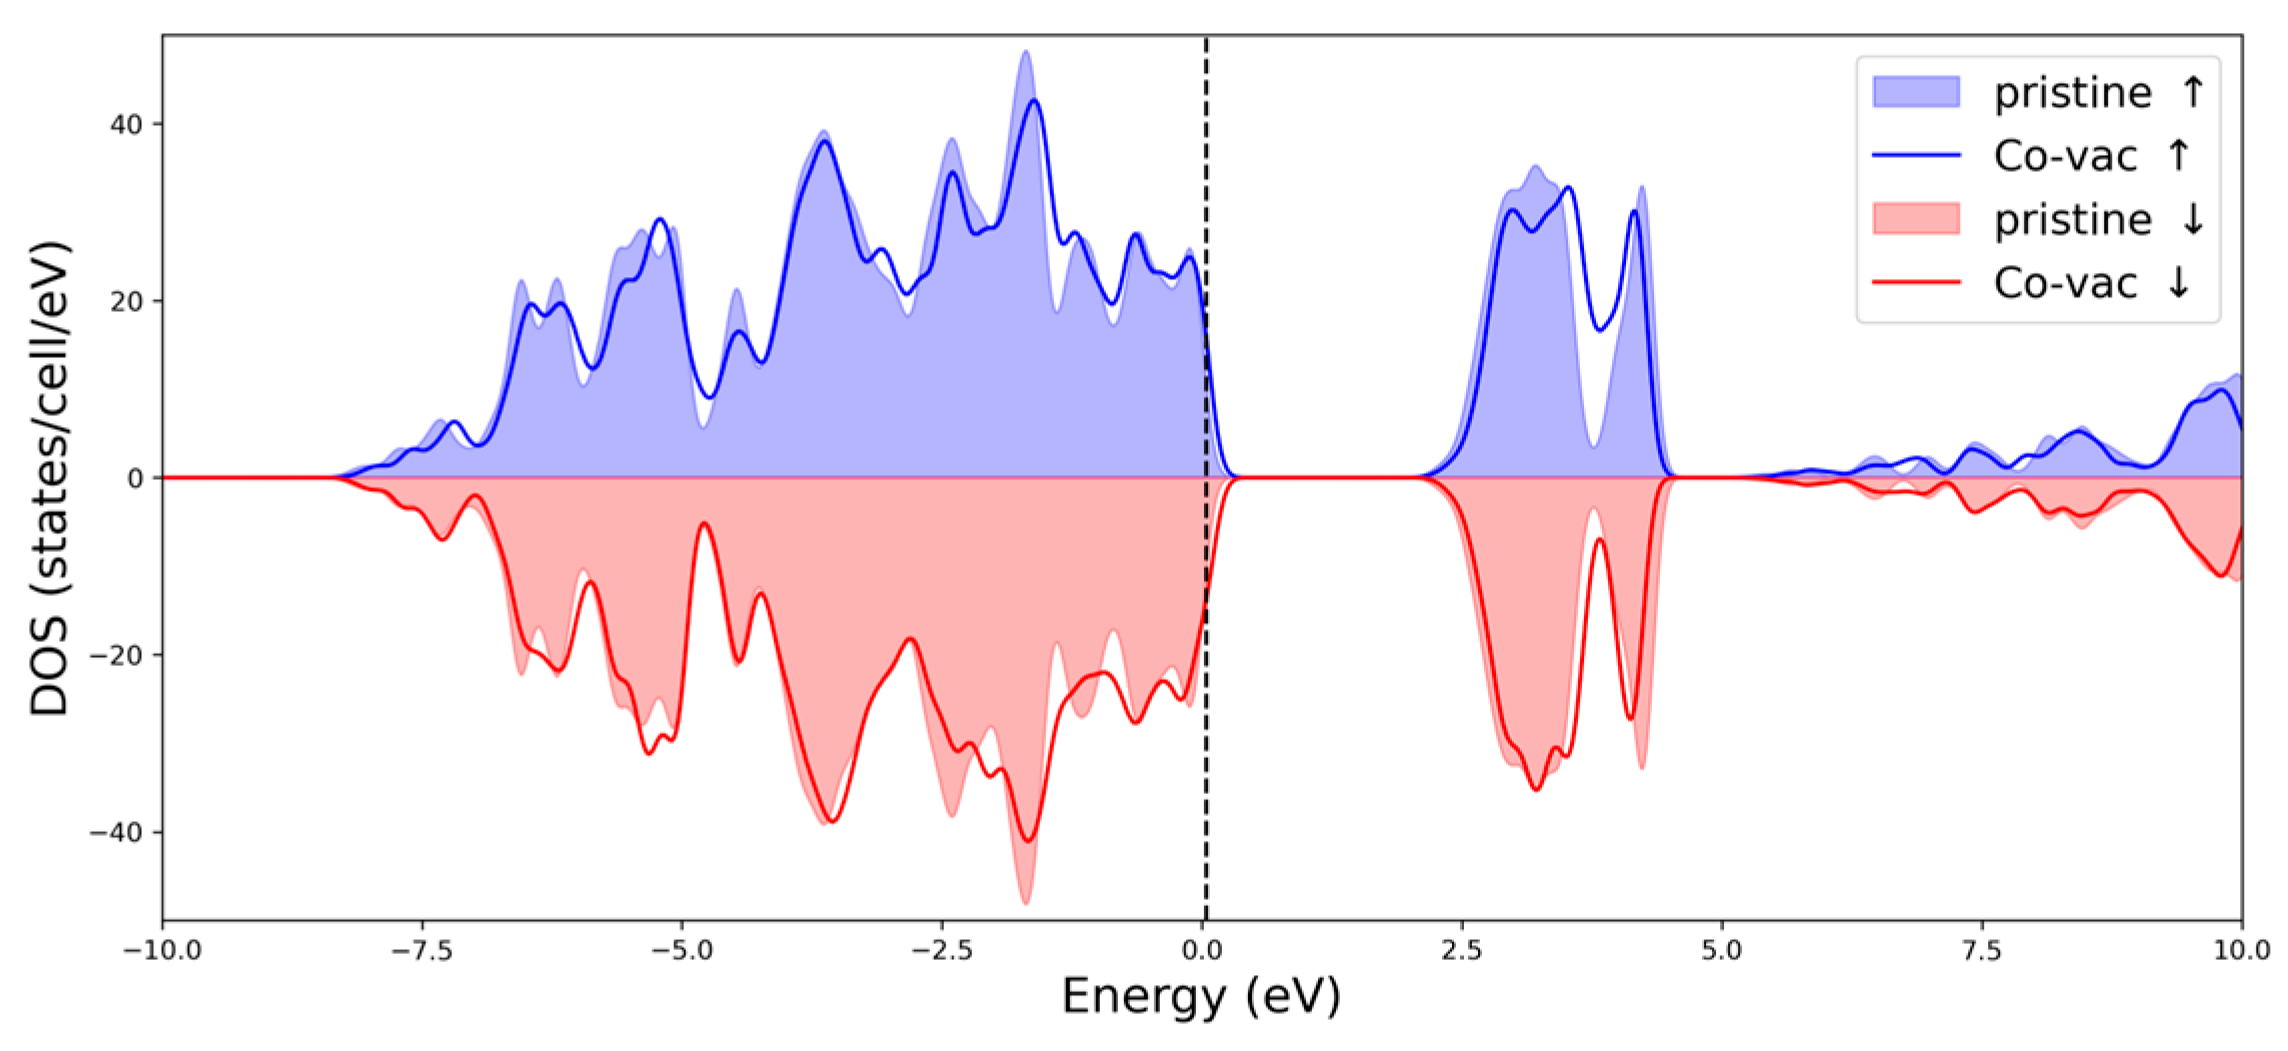
Next, we removed one tetrahedral Co atom, corresponding to a vacancy concentration of 1/8 = 12.5%, and relaxed the structure, keeping the cell volume unchanged. This corresponds to defect formation mechanisms 2a–2c. As shown in Figure 8, the V″Co1 defect has the effect of depleting the valence band, i.e., doping Co3O4 with holes. After projecting the density of states (DOS) onto atomic orbitals, we found that hole wave-function is fairly delocalized on the 55-atom cell. At the end of the relaxation, the four oxygen atoms moved away from the vacant site. The volume of the tetrahedron formed by the four O ions increased by 9.5% with respect to pristine geometry. This result is in contrast with both NPD and XRPD outcomes: passing from Tann. = 650 °C to Tann. = 260 °C, a decrease in Vtet is apparent in all the refined structures and points against the 2a–2c mechanisms.
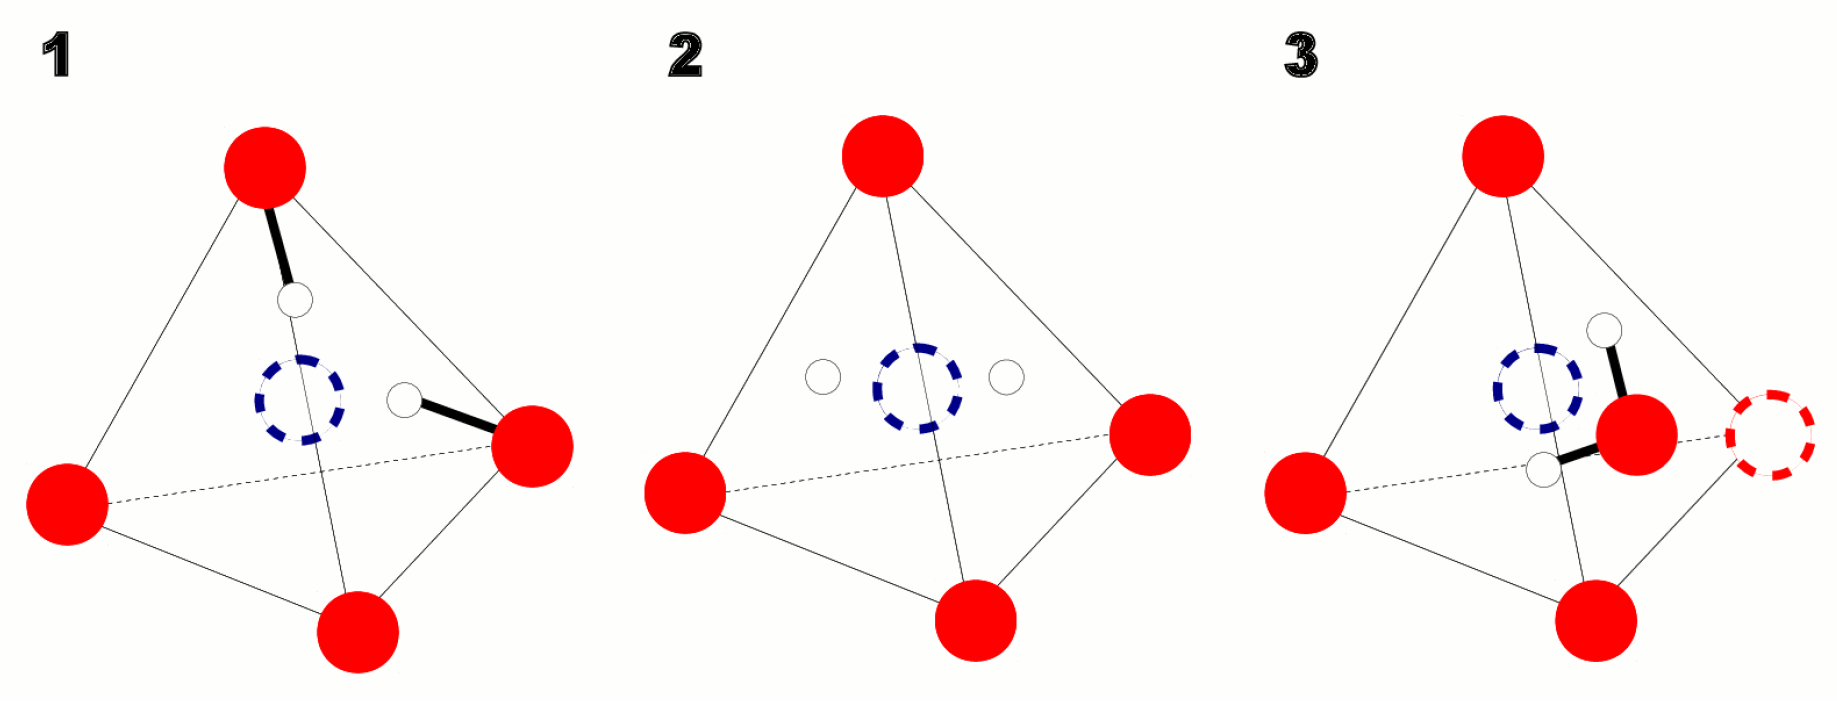
Finally, we added two hydrogen atoms to the Co1 vacancy, creating three starting configurations (see Figure 9). In configuration 1, the two hydrogen atoms bind to the two oxygen ions, forming two -OH groups pointing towards the centre of the vacancy. In configuration 2, the two H atoms end up near the centre of the vacancy, without forming any chemical bonds. In configuration 3, we attach two hydrogen atoms to one oxygen (geminal hydroxyls). The minimization of the DFT energies with respect to atomic positions showed that configurations 2 and 3 are not stable, and they all relaxed to configuration 1. In the fully relaxed configuration 1, the OH distance is 0.988 Å, the Co-O-H angle is 132.2° and the H..H distance is 1.812 Å. In Figure S6 of the SI, the fully relaxed configuration 1 is depicted and briefly described, while file Co3O4-vac-8a-2H.zip of the SI reports the input/output files and atomic parameters of all configurations.
It is worth noting that in configuration 1, the volume of the tetrahedron formed by the O ions decreases by 4.3% with respect to the ideal spinel structure. Since just 1/8 of the tetrahedral sites are involved, the average tetrahedron volume shrinking ΔVtet should be ≈0.54%. This result matches reasonably well with the experimental NPD analysis, which detected ΔVtet ≈ 0.4% passing from the D650 to the D260 sample.
The PDF experimental data of the H260 sample in the 1.5–4.0 Å interval were fitted against the final structure of configuration 1 without changing the relaxed atomic coordinates and varying only the scale factor, the cell parameter and two U parameters for cobalt and oxygen ions, respectively. The fit results are shown in Figure 10. The residuals (Rw = 0.099) were quite close to the ones obtained on the same data applying model_2 (see Table 2), confirming the reliability of mechanism 4, that is, the defect model implying the presence of structural water in the samples annealed at low temperature values.
Thus, DFT calculations contributed to the shedding of light on the defect chemistry of the spinel-like cobalt oxide materials produced through nitrate-based reactions, allowing to exclude the conclusion that C o C o 1 , C o C o 2 , and/or O O positively charged species compensate the negatively charged V C o 1 ones, as proposed by several authors (Refs. [28,29,30,31,32,33,34,35,36,37]) and indicating the presence of structural water, as inferred by Refs. [42,43]. Each hydrogen (or deuterium) ion is bonded to one oxygen ion, forming hydroxylic groups and indicating Co1 vacancy.
The DOS of configuration 1 is shown in Figure 11.
Configuration 1 is characterized by a narrow defect band, 0.3–0.4 eV, above the top of the valence band. The band is fully occupied and spin-polarized (the resulting net magnetic moment is 3.0 μB).
Therefore, if every Co1 vacancy is “passivated” by deuterium, the electric transport properties of Co3O4 would not be affected appreciably by the presence of defects. On the contrary, in the presence of Co1 vacancies without deuterium passivation, the defects band would become partially filled, and magnetic order would develop (at low enough temperatures), meaning that electric conduction can be fully spin-polarized.

3. Materials and Methods

3.1. Synthesis

Deuterated Co(NO3)2·xD2O was used as a Co3O4 precursor. Reactant handling, manipulations and reactions were performed using oven-dried glassware kept in flowing dry N2 (5–9 N2, Sapio) and O2 (5–9 O2, Sapio) as required. Pure Co metal powder (≈15 g, Aldrich) was suspended in D2O (18 mL, 99.9%, Aldrich) by stirring in N2. Deuterated nitric acid (65% DNO3 in D2O, Aldrich) was added dropwise and left to react in N2 at room temperature until complete metal dissolution. The solution was evaporated to a minimum liquid content (T = 55 °C, N2), separating a pink salt that was decomposed to Co3O4 through the two-stage procedure reported in [43,56]. Briefly, cobalt nitrate was first decomposed for 18 h in a rotary tube heated at T = 200 °C under continuously flowing O2 (10 Nl/h) to remove most NOx and D2O. This sample was annealed further in portions in O2 at Tann. = 260, 350, 450, 550, 650 °C for 4 + 4 h with overnight intermediate cooling in flowing O2 to obtain end Co3O4 samples. Immediately after room temperature cooling, samples were put in tightly stoppered glass vials and stored in a room temperature desiccator. These “deuterated” samples were labelled D260, D350, D450, D550 and D650. Also, not-deuterated (“hydrogenated”) materials were synthetized using the same preparation route, using Co(NO3)2·× H2O, H2O and HNO3 instead of D-containing compounds. These samples will be referred to in the following as H260, H350, H450, and H650.
Samples were characterized using the experimental probes described below a few days after their synthesis, because their water content evolves with time [43].

3.2. Sample Characterization

Thermal Gravimetric Analyses were performed on all the deuterated samples by means of a Universal V3 TA instrument at 10 °C/min from room temperature up to 985 °C in dry, high purity N2.
Neutron powder diffraction (NPD) measurements were recorded on the deuterated samples at room temperature on the Debye–Sherrer D1A high-resolution diffractometer at the Institut Laue–Langevin (Grenoble, France) in the 10° < 2θ < 157° 2θ range (Δ2θ = 0.05°). A wavelength of λ = 1.911 Å was selected with a Ge(115) monochromator. In this way, diffraction data were collected up to Qmax = 4πsin θ max/λ = 6.45 Å−1. The powder samples were contained in thin-walled vanadium cans.
XRPD patterns were collected at the ID22 beamline of the European Synchrotron (ESRF) in Grenoble at RT. To this purpose, the powdered deuterium-free samples were loaded into 1.0 mm diameter Kapton® capillaries; samples H260 and H650 were investigated for Rietveld Refinement and line profile analysis using the crystal analyzer setup [57,58], at incident wavelength λ = 0.35438 Å up to 2θ = 48°, reaching Qmax = 14.4 Å−1. A 2D CCD detector (Perkin Elmer XRD 1611CP3) was adopted for PDF quality measurements on samples H 260, H350, H450, and H650. Wavelength (λ 0.177125 Å), sample–detector distance, and azimuthal integration parameters were calibrated on a CeO2 reference that was sintered for 4 h at 1673 K. Calibration and azimuthal integration were all performed using the program pyFAI [59]. PDF data up to Qmax = 27.5 Å−1 were reduced using pdfgetX3 [60] and real-space refinements were carried out by PDFgui [61]. The PDF peak position and integrated intensity were determined via direct analysis using Gaussian functions [62].
NPD and high-resolution synchrotron powder diffraction patterns were analyzed via the Rietveld using the GSAS software suite [63] and its graphical interface EXPGUI [64]. The background was fitted using shifted Chebyshev polynomial. The diffraction peak profiles were fitted with a pseudo-Voight profile function [65]. Absorption correction was performed through the Lobanov empirical formula implemented for the Debye–Scherrer geometry.

3.3. Density-Functional Theory Analysis

DFT calculations were performed with the planewave pseudopotential code Quantum-Espresso [66]. We employed the PBE functional [67] for the exchange and correlation energy and optimized ultrasoft pseudopotentials [68]. The semicore 3s and 3p states of Co were treated as valence electrons. We used a planewave cutoff of 45 Ry, 2 × 2 × 2 k-points in the Brillouin zone. We modelled the system starting from a 56-atom spinel structure, composed of 8 tetrahedral-coordinated Co2+ ions, and 16 octahedral-coordinated Co3+ ions. We applied a Hubbard U of 4.4 eV and 6.7 eV on the Co2+ and Co3+ sites, respectively.

4. Conclusions

We investigated the defect structure evolution of spinel-like cobalt oxide compounds synthetized using the nitrate precursor method and after annealing cycles at temperatures from 260 to 650 °C. To this purpose, a batch of samples produced using deuterated reactants was investigated by means of neutron powder diffraction. Another batch was synthetized using hydrogenated precursors and investigated by means of X-ray pair distribution function analysis. The structural analysis was coupled to DFT calculation.
Both X-ray and neutron diffraction revealed the presence of vacancies in the tetrahedral cobalt sites ( V C o 1 ) whose concentration decreased on heating the samples at higher temperatures, while octahedral cobalt and oxygen sites were fully occupied in all the samples. The evidence of [ V C o 1 ] presence and of its change on varying Tann. came from refinement, but were also easily identified by the visual inspection of the experimental PDFs, observing the changes in the relative intensity of peak B around 2.85 Å, that involved only Co2-Co2 distances, and peaks C and C’ between 3.3 and 3.6 Å, which involved distances including at least one Co1 site.
The good linear correlation between the IC+C’/IB ratio and the ofCo1 values refined by the real-space Rietveld analysis of G(r)s suggests that IC+C’/IB can be considered a model-free way to compare the site occupancy of the tetrahedral and octahedral sites in different spinel samples.
Last but not least, both NPD and X-ray PDFs revealed that V C o 1 presence induces a shrinking in the volume of CoO4 tetrahedra.
In principle, V C o 1 may be balanced by different counter-defects, which are as follows: (1) Co ions in interstitial sites ( C o i ), forming Frenkel defects; (2) holes in the valence band, which could also be expressed as ( C o C o 1 ), ( C o C o 2 ) or O ( O O ); (3) oxygen vacancies ( V O ); and finally (4) interstitial deuterium/hydrogen ions ( D i / H i ). D i / H i defects would be introduced during the synthesis by the nitrate precursor. While the first mechanism does not affect the sample stoichiometry, in the remaining three cases, the compound chemical formulae would be Co3-xO4, Co3-yO4-y and Co3-zO4D2z, respectively.
Neutron and X-ray diffraction allowed the exclusion of mechanisms (1) and (3) because of the negligible occupation of interstitial Co sites and the full occupation of the O site, but they barely distinguished between mechanisms (2) and (4) due to the uncertain experimental evidence of D presence in the structure.
DFT calculations allowed the exclusion of compensation mechanism (2), which should bring an increase in Vtet. Conversely, mechanism (4) caused the experimentally observed shrinking of Vtet. For this reason, we believe that in spinel-like cobalt oxide produced using the nitrate precursor method, Co vacancies are balanced by D i / H i , giving rise to compounds of formula Co3-zO4D2z (or Co3-zO4H2z), with the z value depending on the annealing temperature Tann.
Finally, DFT calculations suggest a model for the insertion of structural water in Co3O4. Water is not present in the structure as D2O molecules, but oxygen ions enter into O1 sites, while deuterium ions enter interstitial sites, so forming two hydroxyl groups. The good fit of the PDF of the H260 sample with the relaxed DFT structure confirms the reliability of mechanism 4 and the presence of structural water in Co3-zO4H2z compounds.

Supplementary Materials

The following supporting information can be downloaded at https://www.mdpi.com/article/10.3390/inorganics13090288/s1. Figure S1: Structure of Co3O4 resulting from the refinement of D260 sample neutron data using model_2; Figure S2: Neutron diffraction on the D260 sample. Contour plots of the Fourier Differences Density maps; Figure S3: Experimental F(Q) functions extracted by XRPD data; Figure S4: G(r) Details of H260 sample; Figure S5: Linear correlation between IC+C’/IB ratio by direct analysis of G(r) peaks and the ofCo1 refined by real-space Rietveld analysis of G(r)s in the 1.5–4 Å interval using model_2; Figure S6: Relaxed structure resulting from the DFT calculations (configuration 1). Table S1: Rietveld refinement results of the high-resolution X-ray diffraction patterns, referring to the final model for Co3O4. Co3O4-vac-8a-2H.zip: input files and relaxed structures derived from DFT calculations of configurations 1, 2 and 3.

Author Contributions

Conceptualization, M.L. and M.S.; Data curation, M.L., M.C., P.G., D.C. and M.S.; Formal analysis, M.L., D.C. and M.S.; Funding acquisition, M.L. and M.S.; Investigation, M.L., M.C., P.G., D.C. and M.S.; Methodology, M.L., D.C. and M.S.; Project administration, M.L.; Supervision, M.L., D.C. and M.S.; Visualization, M.L. and M.S.; Writing—original draft, D.C. and M.S.; Writing—review and editing, M.L., M.C., D.C. and M.S. All authors have read and agreed to the published version of the manuscript.

Funding

The authors gratefully acknowledge the Italian Ministry of Environment and Energy Sustainability (MASE, formerly MITE) for funding the project “RSH2A_000018—Stoccaggio e distribuzione di idrogeno attraverso una strategia power-to-gas/gas-to-power con cattura ed utilizzo completi del carbonio—Hydrogen storage and distribution through power-to-gas strategy, with full carbon capture and utilization” in the frame of the European Union Next-GenerationEU, Piano Nazionale di Ripresa e Resilienza (PNRR)—Missione 2 “Rivoluzione verde e transizione ecologica”, Componente 2 “Energia rinnovabile, idrogeno, rete e mobilità sostenibile”, Investimento 3.5 “Ricerca e sviluppo sull’idrogeno” (bando A).

Institutional Review Board Statement

Not applicable.

Informed Consent Statement

Not applicable.

Data Availability Statement

The original contributions presented in this study are included in the article/Supplementary Material. Further inquiries can be directed to the corresponding authors.

Acknowledgments

The authors acknowledge the kindly granted time and financial support during the experiments from the ILL (experiment 5-21-861, instrument D1A) and the ESRF (exp. Ch5157 at beamline ID22), and the kind help of Emmanuelle Suard during the ILL experiment.

Conflicts of Interest

The authors declare no conflicts of interest.

References

  1. Bi, F.; Wei, J.; Zhou, Z.; Zhang, Y.; Gao, B.; Liu, N.; Xu, J.; Liu, B.; Huang, Y.; Zhang, X. Insight into the Synergistic Effect of Binary Nonmetallic Codoped Co3O4 Catalysts for Efficient Ethyl Acetate Degradation under Humid Conditions. JACS Au 2025, 5, 363–380. [Google Scholar] [CrossRef] [PubMed]
  2. Zhu, W.; Wang, X.; Li, C.; Chen, X.; Li, W.; Liu, Z.; Liang, C. Defect Engineering over Co3O4 Catalyst for Surface Lattice Oxygen Activation and Boosted Propane Total Oxidation. J. Catal. 2022, 413, 150–162. [Google Scholar] [CrossRef]
  3. Bao, L.; Zhu, S.; Chen, Y.; Wang, Y.; Meng, W.; Xu, S.; Lin, Z.; Li, X.; Sun, M.; Guo, L. Anionic Defects Engineering of Co3O4 Catalyst for Toluene Oxidation. Fuel 2022, 314, 122774. [Google Scholar] [CrossRef]
  4. Yang, J.; Li, W.; Chen, J.; Cheng, N.; Wang, T.; Wang, H.; Xu, D.; Zhang, H.; Wang, J.; Bai, L.; et al. Yolk-Shell Structured Co3O4 Catalyst Modified Ceramic Membrane Synergistically Improved Wastewater Purification and Membrane Fouling Mitigation. Chem. Eng. J. 2024, 501, 157690. [Google Scholar] [CrossRef]
  5. Xiong, L.; Zhang, L.; Xie, S.; Lian, D.; Hou, X.; Zhang, M.; Chen, L.; Chang, C.-R. Modulating Co–O Covalency in MOF-Derived Co3O4 to Activate Surface Lattice Oxygen for Enhanced Catalytic Ethane Combustion. Chem. Eng. Sci. 2025, 318, 122184. [Google Scholar] [CrossRef]
  6. Cong, Y.; Wang, Y.; Luo, J.; Fan, L.; Li, X.; Wang, C.; Shen, X.; Xu, Z.; Lv, S.-W. Light-Mediated Enhancement Effect Derived from Carbon Nitrogen Polymer to Regulate Peroxymonosulfate Activation over Co3O4 for Effective Degradation of Fluorinated Pharmaceuticals. Sep. Purif. Technol. 2025, 377, 134254. [Google Scholar] [CrossRef]
  7. Yilmaz Aydin, D. Thermal and Exergetic Performance Analyses of a Heat Pipe Heat Exchanger Using CMC/Co3O4-Based Non-Newtonian Nanofluids. Appl. Sci. 2025, 15, 7831. [Google Scholar] [CrossRef]
  8. Zhang, Y.; Zhang, J.; Xu, Z.; Qu, C.; Chen, Z.; Hong, D.; Wang, C. Citric Acid Modification of Co3O4/CeO2 Catalysts for Enhanced Oxidation of Low Concentration Methane. Appl. Surf. Sci. 2025, 711, 164061. [Google Scholar] [CrossRef]
  9. Li, X.; Su, X.; Pei, Y.; Liu, J.; Zheng, X.; Tang, K.; Guan, G.; Hao, X. Generation of Edge Dislocation Defects in Co3O4 Catalysts: An Efficient Tactic to Improve Catalytic Activity for Oxygen Evolution. J. Mater. Chem. A 2019, 7, 10745–10750. [Google Scholar] [CrossRef]
  10. Zhang, R.; Pan, L.; Guo, B.; Huang, Z.-F.; Chen, Z.; Wang, L.; Zhang, X.; Guo, Z.; Xu, W.; Loh, K.P.; et al. Tracking the Role of Defect Types in Co3O4 Structural Evolution and Active Motifs during Oxygen Evolution Reaction. J. Am. Chem. Soc. 2023, 145, 2271–2281. [Google Scholar] [CrossRef]
  11. Xu, X.; Jeon, S.; Yu, T. Synthesis of Ru/Co3O4 Nanosheets as a Multifunctional Electrocatalyst for Boosting Urea-Assisted Water Electrolysis. Int. J. Hydrogen Energy 2025, 157, 150472. [Google Scholar] [CrossRef]
  12. Xie, F.; Kang, X.; Wu, Z.; Zhu, H.; Gu, L.; Duan, X.; Yang, J. Built–in Electric Field Boosted Tandem Catalysis for Rapid Electrochemical Nitrate Reduction to Nitrogen. ACS Nano 2025, 19, 26217–26228. [Google Scholar] [CrossRef]
  13. Singh, J.; Singh, G.P.; Jain, R.K.; Singh, B.; Singh, K.J.; Singh, R.C. Effect of Calcination Temperature on Structural, Optical and Antibacterial Properties of Ball Mill Synthesized Co3O4 Nanomaterials. J. Mater. Sci. Mater. Electron. 2022, 33, 3250–3266. [Google Scholar] [CrossRef]
  14. Muradov, M.B.; Mammadyarova, S.J.; Eyvazova, G.M.; Balayeva, O.O.; Hasanova, I.; Aliyeva, G.; Melikova, S.Z.; Abdullayev, M.I. The Effect of Cu Doping on Structural, Optical Properties and Photocatalytic Activity of Co3O4 Nanoparticles Synthesized by Sonochemical Method. Opt. Mater. 2023, 142, 114001. [Google Scholar] [CrossRef]
  15. Pandey, V.; Adiba, A.; Munjal, S.; Ahmad, T. Optical Bandgap Tuning of Cubic Spinel Co3O4 by Annealing Temperature. Materialia 2022, 26, 101554. [Google Scholar] [CrossRef]
  16. Ravina; Dalela, S.; Kumar, S.; Choudhary, B.L.; Alvi, P.A. Structural, Optical and Raman Studies of Co3O4 Nano-Particles. Mater. Today Proc. 2023, 79, 165–168. [Google Scholar] [CrossRef]
  17. Ardeshirfard, H.; Elhamifar, D. An Efficient Method for the Preparation of Magnetic Co3O4 Nanoparticles and the Study of Their Catalytic Application. Front. Catal. 2023, 3, 1194977. [Google Scholar] [CrossRef]
  18. Jogdand, S.S.; Joshi, S.S. Effect of Polymer Combustion Synthesis on Thermal, Spectroscopic, Structural, and Magnetic Properties of Co3O4 Nanoparticles. Polyhedron 2025, 269, 117419. [Google Scholar] [CrossRef]
  19. Kumar, G.; Sun, H.-W.; Huang, M.H. Shape-Tunable Co3O4 Nanocrystals Possessing Surface-Dependent Optical and Magnetic Properties. ACS Appl. Nano Mater. 2024, 7, 2155–2163. [Google Scholar] [CrossRef]
  20. Chauhan, A.; Kumar, R.; Devi, S.; Sonu; Raizada, P.; Singh, P.; Ponnusamy, V.K.; Sudhaik, A.; Mishra, A.K.; Selvasembian, R. Recent Advances on Co3O4-Based Nanostructure Photocatalysis: Structure, Synthesis, Modification Strategies, and Applications. Surf. Interfaces 2024, 54, 105152. [Google Scholar] [CrossRef]
  21. Dang, V.D.; Hong Nhung, N.T.; Rabani, I.; Tran, N.T.; Thuy, B.T.P.; Truong, H.B. Advances in Co3O4 Nanomaterial-Based Photocatalysts for Water Purification: Mechanisms, Green Synthesis, Activation of Oxidants, Waste-Derived Sources, and Computational Insights. RSC Adv. 2025, 15, 19088–19103. [Google Scholar] [CrossRef] [PubMed]
  22. Liu, H.; Gao, J.; Huang, W.; Dai, K.; Zheng, G.; Liu, C.; Shen, C.; Yan, X.; Guo, J.; Guo, Z. Electrically Conductive Strain Sensing Polyurethane Nanocomposites with Synergistic Carbon Nanotubes and Graphene Bifillers. Nanoscale 2016, 8, 12977–12989. [Google Scholar] [CrossRef] [PubMed]
  23. Sabbar, G.; Mohammed, W.M.; Al-Nafiey, A. Temperature-Dependent Gas Sensing Properties of Cobalt Oxide, Reduced Graphene Oxide, and Composite Thin Films Synthesized by Pulsed Laser Ablation. Arab. J. Sci. Eng. 2025, 1–15. [Google Scholar] [CrossRef]
  24. Yang, L.; Zhang, C.; Cao, L.; Li, H.; Li, H.; Yang, Z.; Li, J. Versatile 1D-Structured Co3O4–Co/NC@N–Carbon Nanotubes for High-Performance Lithium Storage. Chem. Commun. 2025, 61, 1–10. [Google Scholar] [CrossRef]
  25. Zhao, Y.; Wang, X.; Li, H.; Qian, B.; Zhang, Y.; Wu, Y. Synthesis of Co3O4 Nanospheres for Enhanced Photo-Assisted Supercapacitor. Chem. Eng. J. 2022, 431, 133981. [Google Scholar] [CrossRef]
  26. Roniboss, A.; Sindhu, S.; Kennedy, L.J.; Arockiasamy, S. Synthesis and Thermal Properties of Two Novel Cobalt (II) Schiff’s Base Complexes as Precursors for Coating Cobalt Oxide (Co3O4) Thin Film by a Plasma Enhanced Metallo-Organic Chemical Vapour Deposition. J. Mol. Struct. 2023, 1272, 134189. [Google Scholar] [CrossRef]
  27. Bayati-Komitaki, N.; Ganduh, S.H.; Alzaidy, A.H.; Salavati-Niasari, M. A Comprehensive Review of Co3O4Nanostructures in Cancer: Synthesis, Characterization, Reactive Oxygen Species Mechanisms, and Therapeutic Applications. Biomed. Pharmacother. 2024, 180, 117457. [Google Scholar] [CrossRef]
  28. Trasatti, S. Electrochemistry of Novel Materials; Lipkowski, J., Ross Phil, M.S., Eds.; VCH: Weinheim, Germany, 1994. [Google Scholar]
  29. Švegl, F.; Orel, B.; Hutchins, M.G.; Kalcher, K. Structural and Spectroelectrochemical Investigations of Sol-Gel Derived Electrochromic Spinel Co3O4 Films. J. Electrochem. Soc. 1996, 143, 1532–1539. [Google Scholar] [CrossRef]
  30. de Boer, J.H.; Verwey, E.J.W. Semi-Conductors with Partially and with Completely Filled 3d—Lattice Bands. Proc. Phys. Soc. 1937, 49, 59–71. [Google Scholar] [CrossRef]
  31. Tronel, F.; Guerlou-Demourgues, L.; Ménétrier, M.; Croguennec, L.; Goubault, L.; Bernard, P.; Delmas, C. New Spinel Cobalt Oxides, Potential Conductive Additives for the Positive Electrode of Ni−MH Batteries. Chem. Mater. 2006, 18, 5840–5851. [Google Scholar] [CrossRef]
  32. Ngamou, P.H.T.; Bahlawane, N. Influence of the Arrangement of the Octahedrally Coordinated Trivalent Cobalt Cations on the Electrical Charge Transport and Surface Reactivity. Chem. Mater. 2010, 22, 4158–4165. [Google Scholar] [CrossRef]
  33. Antonyraj, C.A.; Srivastava, D.N.; Mane, G.P.; Sankaranarayanan, S.; Vinu, A.; Srinivasan, K. Co3O4 Microcubes with Exceptionally High Conductivity Using a CoAl Layered Double Hydroxide Precursor via Soft Chemically Synthesized Cobalt Carbonate. J. Mater. Chem. A 2014, 2, 6301–6304. [Google Scholar] [CrossRef]
  34. Belova, I.D.; Roginskaya, Y.E.; Shalaginov, V.V.; Shub, D.M. Effect of Nonstoichiometry on Electrical Properties of Cobalt Oxide (Co3-XO4) Films. Zhurnal Fiz. Khimii 1980, 54, 1789–1793. [Google Scholar]
  35. Wang, R.-P.; Huang, M.-J.; Hariki, A.; Okamoto, J.; Huang, H.-Y.; Singh, A.; Huang, D.-J.; Nagel, P.; Schuppler, S.; Haarman, T.; et al. Analyzing the Local Electronic Structure of Co3O4 Using 2p3d Resonant Inelastic X-Ray Scattering. J. Phys. Chem. C 2022, 126, 8752–8759. [Google Scholar] [CrossRef] [PubMed]
  36. Belova, I.D.; Roginskaya, Y.E.; Shifrina, R.R.; Gagarin, S.G.; Plekhanov, Y.V.; Venevtsev, Y.N. Co (III) Ions High-Spin Configuration in Nonstoichiometric Co3O4 Films. Solid State Comm. 1983, 47, 577–584. [Google Scholar] [CrossRef]
  37. Belova, I.D.; Shalaginov, V.V.; Galyamov, B.S.; Roginskaya, Y.E.; Shub, D.M. Study of the Defect Structure of Nonstoichiometric Cobalt Oxide (Co3O4) Films. Zhurnal Neorg. Khimii 1978, 23, 286–290. [Google Scholar]
  38. Garavaglia, R.; Mari, C.M.; Trasatti, S. Physicochemical Characterization of Co3O4 Prepared by Thermal Decomposition II: Response to Solution PH. Surf. Technol. 1984, 23, 41–47. [Google Scholar] [CrossRef]
  39. Surendranath, Y.; Nocera, D.G. Oxygen Evolution Reaction Chemistry of Oxide-Based Electrodes. Prog. Inorg. Chem. 2011, 57, 505–560. [Google Scholar]
  40. Vittal, R.; Ho, K.-C. Cobalt Oxide Electrodes-Problem and a Solution Through a Novel Approach Using Cetyltrimethylammonium Bromide (CTAB). Catal. Rev. 2015, 57, 145–191. [Google Scholar] [CrossRef]
  41. Ahmad, W.; Noor, T.; Zeeshan, M. Effect of Synthesis Route on Catalytic Properties and Performance of Co3O4TiO2 for Carbon Monoxide and Hydrocarbon Oxidation under Real Engine Operating Conditions. Catal. Commun. 2017, 89, 19–24. [Google Scholar] [CrossRef]
  42. Rios, E.; Zelada, G.; Marco, J.F.; Gautier, J.L. Characterization of Bulk and Surface Composition of Polycrystalline Co3O4 Synthesized at 400 °C for Electrocatalysis. Bol. Soc. Chil. Quim. 1998, 43, 447–459. [Google Scholar]
  43. Longhi, M.; Formaro, L. Water-Dependent Structural and Chemical Relaxation of Bulk Co3O4 from Cobalt Nitrate Decomposition. J. Mater. Chem. 2001, 11, 1228–1232. [Google Scholar] [CrossRef]
  44. Jahandideh-Roudsari, S.R.; Shourian, M.; Homaei, A. Developing Choline Oxidase Immobilization on Co3O4/RGO Nanohybrid Surface as a High-Performance Biosensor for Diazinon Detection. Bioprocess Biosyst. Eng. 2025, 1–15. [Google Scholar] [CrossRef] [PubMed]
  45. Coduri, M.; Scavini, M.; Allieta, M.; Brunelli, M.; Ferrero, C. Local Disorder in Yttrium Doped Ceria (Ce1−xY xO2−x/2) Probed by Joint X-Ray and Neutron Powder Diffraction. J. Phys. Conf. Ser. 2012, 340, 012056. [Google Scholar] [CrossRef]
  46. Sickafus, K.E.; Wills, J.M.; Grimes, N.W. Structure of Spinel. J. Am. Ceram. Soc. 1999, 82, 3279–3292. [Google Scholar] [CrossRef]
  47. Will, G.; Masciocchi, N.; Parrish, W.; Hart, M. Refinement of Simple Crystal Structures from Synchrotron Radiation Powder Diffraction Data. J. Appl. Crystallogr. 1987, 20, 394–401. [Google Scholar] [CrossRef]
  48. Casas-Cabanas, M.; Binotto, G.; Larcher, D.; Lecup, A.; Giordani, V.; Tarascon, J.-M. Defect Chemistry and Catalytic Activity of Nanosized Co3O4. Chem. Mater. 2009, 21, 1939–1947. [Google Scholar] [CrossRef]
  49. Angelov, S.; Zhecheva, E.; Stoyanova, R.; Atanasov, M. Bulk Defects in Co3O4, Pure and Slightly Doped with Lithium, Revealed by EPR of the Tetrahedral Co2+ Ions. J. Phys. Chem. Solids 1990, 51, 1157–1161. [Google Scholar] [CrossRef]
  50. Kroger, F.A.; Stieltjes, F.H.; Vink, H.J. Thermodynamics and Formulation of Reactions Involving Imperfections in Solids. Philips Res. Rep. 1959, 14, 557–601. [Google Scholar]
  51. Kaczmarska, A.; Grzesik, Z.; Mrowec, S. On the Defect Structure and Transport Properties of Co3O4 Spinel Oxide. High Temp. Mater. Process. 2012, 31, 371–379. [Google Scholar] [CrossRef]
  52. Ammundsen, B.; Jones, D.J.; Rozière, J.; Berg, H.; Tellgren, R.; Thomas, J.O. Ion Exchange in Manganese Dioxide Spinel: Proton, Deuteron, and Lithium Sites Determined from Neutron Powder Diffraction Data. Chem. Mater. 1998, 10, 1680–1687. [Google Scholar] [CrossRef]
  53. Egami, T.; Billinge, S.J.L. Underneath the Bragg Peaks. Mater. Today 2003, 6, 57. [Google Scholar] [CrossRef]
  54. Roth, W.L. The Magnetic Structure of Co3O4. J. Phys. Chem. Solids 1964, 25, 1–10. [Google Scholar] [CrossRef]
  55. Chen, J.; Wu, X.; Selloni, A. Electronic Structure and Bonding Properties of Cobalt Oxide in the Spinel Structure. Phys. Rev. B—Condens. Matter Mater. Phys. 2011, 83, 245204. [Google Scholar] [CrossRef]
  56. Longhi, M.; Formaro, L. An Old Workhorse of Oxide Investigations: New Features of Co3O4. J. Electroanal. Chem. 1999, 464, 149–157. [Google Scholar] [CrossRef]
  57. Fitch, A.; Dejoie, C.; Covacci, E.; Confalonieri, G.; Grendal, O.; Claustre, L.; Guillou, P.; Kieffer, J.; de Nolf, W.; Petitdemange, S.; et al. ID22—The High-Resolution Powder-Diffraction Beamline at ESRF. J. Synchrotron Radiat. 2023, 30, 1003–1012. [Google Scholar] [CrossRef]
  58. Dejoie, C.; Coduri, M.; Petitdemange, S.; Giacobbe, C.; Covacci, E.; Grimaldi, O.; Autran, P.-O.; Mogodi, M.W.; Šišak Jung, D.; Fitch, A.N. Combining a Nine-Crystal Multi-Analyser Stage with a Two-Dimensional Detector for High-Resolution Powder X-Ray Diffraction. J. Appl. Crystallogr. 2018, 51, 1721–1733. [Google Scholar] [CrossRef]
  59. Kieffer, J.; Wright, J.P. PyFAI: A Python Library for High Performance Azimuthal Integration on GPU. Powder Diffr. 2013, 28, S339–S350. [Google Scholar] [CrossRef]
  60. Juhás, P.; Davis, T.; Farrow, C.L.; Billinge, S.J.L. PDFgetX3: A Rapid and Highly Automatable Program for Processing Powder Diffraction Data into Total Scattering Pair Distribution Functions. J. Appl. Crystallogr. 2013, 46, 560–566. [Google Scholar] [CrossRef]
  61. Farrow, C.L.; Juhas, P.; Liu, J.W.; Bryndin, D.; Božin, E.S.; Bloch, J.; Proffen, T.; Billinge, S.J.L. PDFfit2 and PDFgui: Computer Programs for Studying Nanostructure in Crystals. J. Phys. Condens. Matter 2007, 19, 335219. [Google Scholar] [CrossRef]
  62. Coduri, M.; Brunelli, M.; Scavini, M.; Allieta, M.; Masala, P.; Capogna, L.; Fischer, H.E.; Ferrero, C. Rare Earth Doped Ceria: A Combined X-Ray and Neutron Pair Distribution Function Study. Z. Krist. 2012, 227, 272–279. [Google Scholar] [CrossRef]
  63. Larson, A.C.; von Dreele, R.B. General Structural Analysis System (GSAS). LAUR 86-748; Los Alamos National Laboratory: Los Alamos, NM, USA, 2004. [Google Scholar]
  64. Toby, B.H. EXPGUI, a Graphical User Interface for GSAS. J. Appl. Crystallogr. 2001, 34, 210–213. [Google Scholar] [CrossRef]
  65. Qiu, X.; Thompson, J.W.; Billinge, S.J.L. PDFgetX2: A GUI-Driven Program to Obtain the Pair Distribution Function from X-Ray Powder Diffraction Data. J. Appl. Crystallogr. 2004, 37, 678. [Google Scholar] [CrossRef]
  66. Giannozzi, P.; Baroni, S.; Bonini, N.; Calandra, M.; Car, R.; Cavazzoni, C.; Ceresoli, D.; Chiarotti, G.L.; Cococcioni, M.; Dabo, I.; et al. QUANTUM ESPRESSO: A Modular and Open-Source Software Project for Quantum Simulations of Materials. J. Phys. Condens. Matter 2009, 21, 395502. [Google Scholar] [CrossRef]
  67. Perdew, J.P.; Burke, K.; Ernzerhof, M. Generalized Gradient Approximation Made Simple. Phys. Rev. Lett. 1996, 77, 3865–3868. [Google Scholar] [CrossRef]
  68. Garrity, K.F.; Bennett, J.W.; Rabe, K.M.; Vanderbilt, D. Pseudopotentials for High-Throughput DFT Calculations. Comput. Mater. Sci. 2014, 81, 446–452. [Google Scholar] [CrossRef]
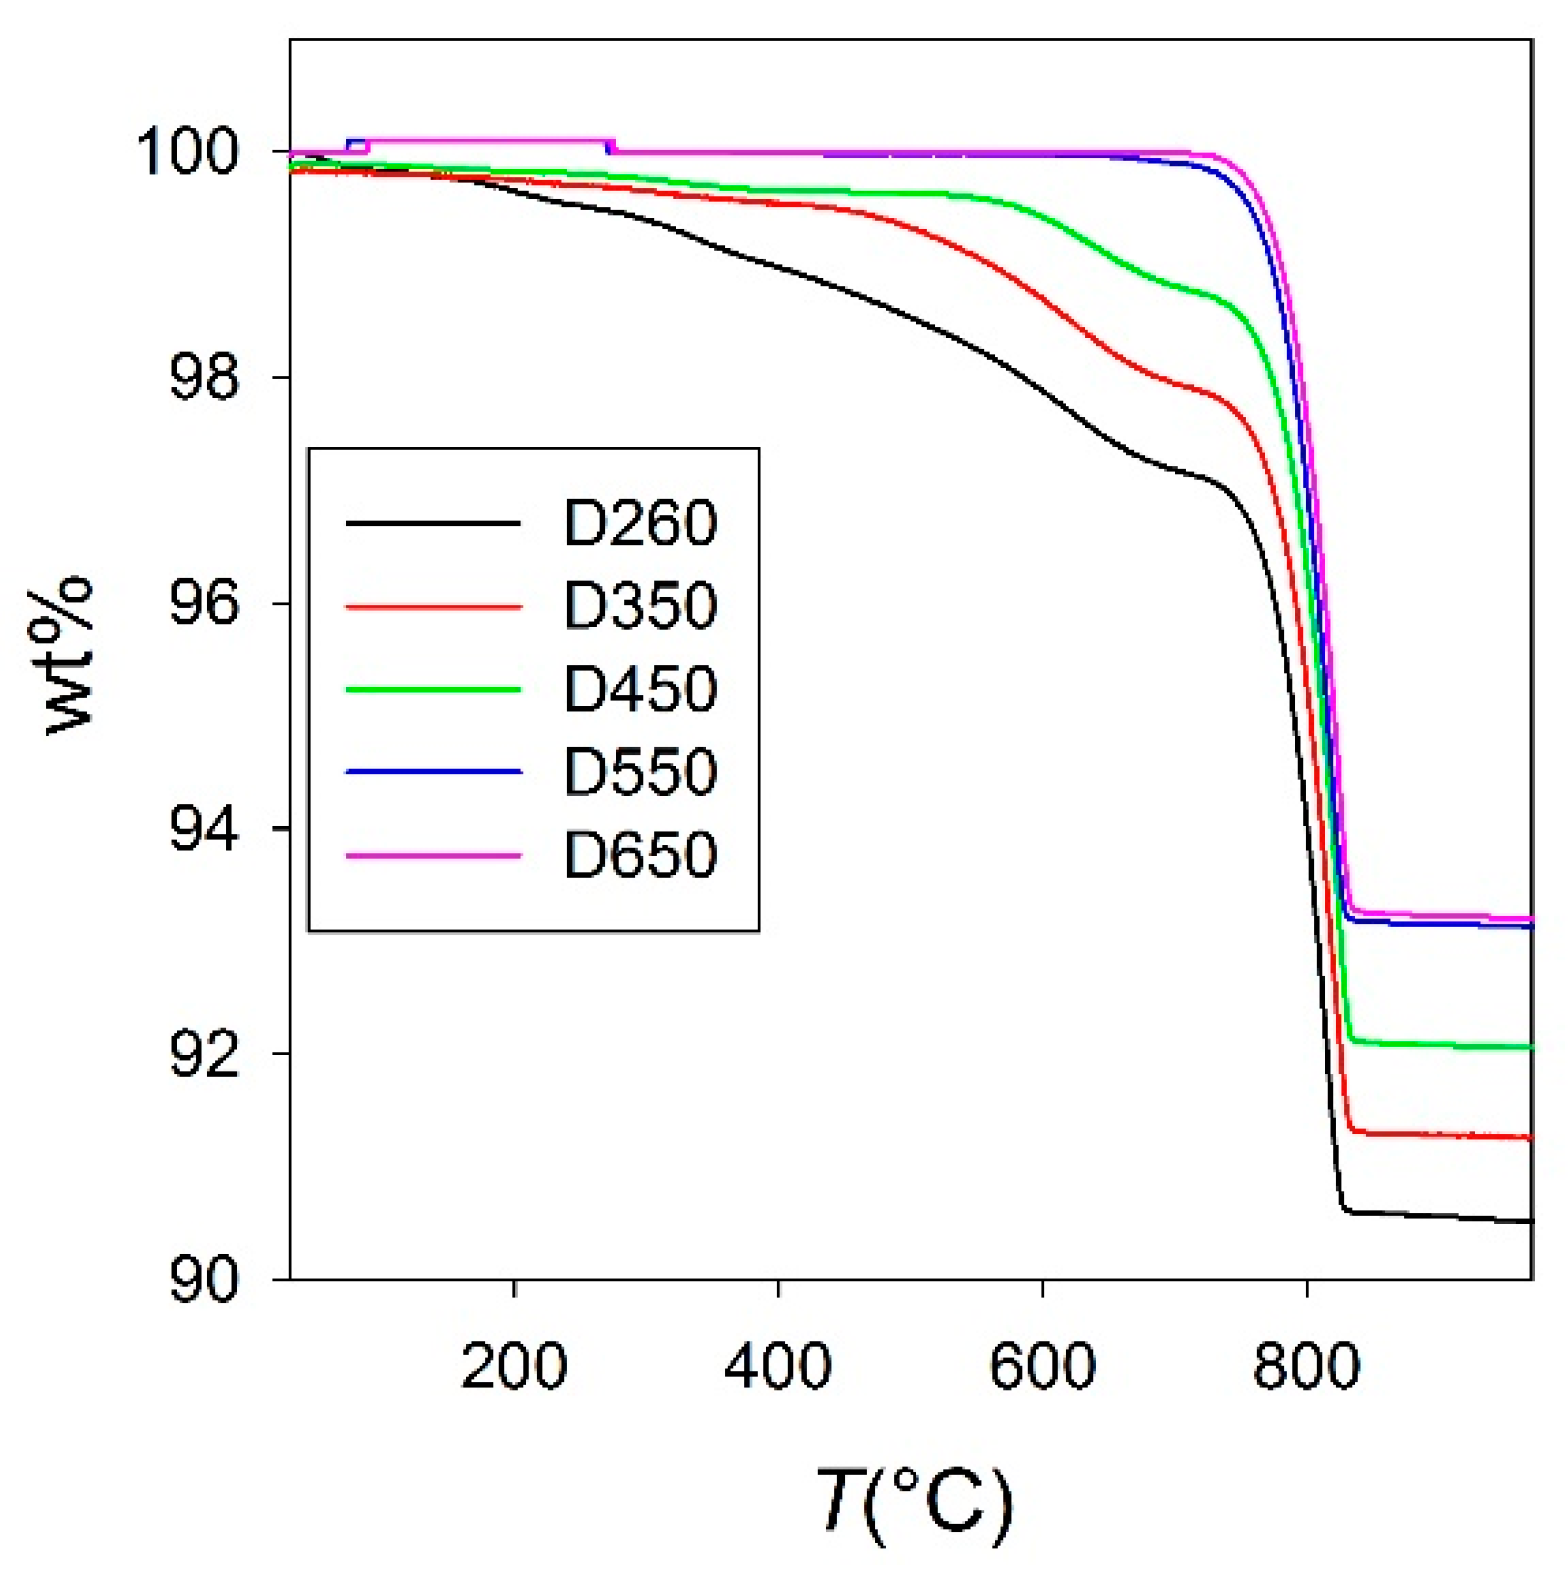
Figure 1. TGA plots for deuterated D260, D350, D450, D550 and D650 samples annealed at 260 °C, 350 °C, 450 °C, 550 °C and 650 °C, respectively.
Inorganics 13 00288 g001
Figure 2. (a) NPD pattern of sample D260 and (b) XRPD pattern of sample H260. In both panels, measured (black crosses) and calculated (red curves) intensities I are reported, as well as the residuals (blue curves). The insert of panel B highlights the high angle (2θ) region of the pattern.
Inorganics 13 00288 g002
Figure 3. Rietveld refinements of NPD data. Panel (a): refined U parameters using different thermal parameters (UCo1, UCo2 and UO) for each site and taking the full occupation of all sites (model_1); panels (bd): refined parameters using different thermal parameters for Co and O (UCo and UO) and varying the occupancy of Co1 site ofCo1 (model_2). (b) Thermal parameters. (c) Occupancy of Co1 site ofCo1. (d) Volume of the CoO4 tetrahedron Vtet vs. ofCo1.
Inorganics 13 00288 g003
Figure 4. (a) Experimental G(r) functions. (b,c) Details of the same G(r)s at large (b) and short (c) r values. A, B, C and C’ label the first G(r) peaks. See main text for details. Additional labels in panel (c) indicate the Co pairs that contribute to each peak. The same colours are attributed to the same measurements in all the panels.
Inorganics 13 00288 g004
Figure 5. (a) Detail of the G(r) of the H260 sample. Labels have the same meaning as in Figure 4. Experimental data (black crosses), fitted curve using three Gaussian functions (black curve) and residuals (blue curve) are reported, as well as the contributions of each function (B: red curve; C: green curve; C’: pink curve). (b): Ratio IC+C’/IB between the sum of the intensities of peaks C and C’ (IC+C’) and that of peak B (IB).
Inorganics 13 00288 g005
Figure 6. Details of H260 and H650 samples’ G(r) functions. Labels A, B, C and C’ have the same meaning as in Figure 4. Experimental data (black crosses) and fitted curves using the real-space Rietveld analysis and model_2 (red curves) are shown, as well as the residuals (blue curves). (a) H260 fitted in the 1.5–8 Å interval; (b) H260 fitted in the 1.5–4 Å interval; (c) H650 fitted in the 1.5–4 Å interval.
Inorganics 13 00288 g006
Figure 7. Real-space Rietveld refinement results of X-ray PDFs in the 1.5–4 Å interval using model_2. (a) Occupancy of Co1 site ofCo1. (b) Volume of the CoO4 tetrahedron Vtet vs. ofCo1.
Inorganics 13 00288 g007
Figure 8. Electronic density of states (DOS) of Co3O4 with Co1 vacancy. The shaded areas represent the DOS of defect-free Co3O4. The vertical dashed line is the Fermi level of defective Co3O4. Removal of Co1 leaves a net magnetic moment of 3.33 μB.
Inorganics 13 00288 g008
Figure 9. Geometrical relaxations obtained after adding two hydrogen atoms to the Co1 vacancy. Numbers 1, 2 and 3 characterized the three different initial configurations. The red filled circles represent the positions of the oxygen in the tetrahedral site. The white circles are the added hydrogen atoms. The blue dashed circle represents the the Co vacancy. In configuration 3, the red dashed circle represents the original position of the oxygen which has been displaced to form the water molecule.
Inorganics 13 00288 g009
Figure 10. Fit of the H260 PDF data in the 1.5–4 Å interval using the relaxed structure of configuration 1. Experimental data (black crosses) and fitted curves (red curve) are shown, as well as the residuals (blue curve).
Inorganics 13 00288 g010
Figure 11. DOS of defective Co3O4 with two hydrogen atoms. The vertical dashed line is the Fermi level.
Inorganics 13 00288 g011
Table 1. Rietveld refinement results and residuals of the neutron diffraction patterns referring to the final model (model_2) for Co3O4. Estimated Standard Deviations (ESDs) are in brackets.
SampleD260D350D450D550D650
Space Group F d 3 ¯ m F d 3 ¯ m F d 3 ¯ m F d 3 ¯ m F d 3 ¯ m
a/Å8.0763(2)8.0787(1)8.0792(2)8.0798(3)8.0794(3)
xO0.26352(4)0.26356(3)0.26358(4)0.26364(3)0.26364(3)
UCo20.0017(5)0.0046(5)0.0051(5)0.0035(4)0.0040(4)
UO20.0021(3)0.0046(5)0.0049(3)0.0040(3)0.0046(2)
ofCo10.912(9)0.937(8)0.957(8)0.961(7)0.980(6)
R(F2)0.02130.01980.01950.02180.0149
Rp0.02850.03060.03030.03020.0292
Table 2. Real-space Rietveld refinement results of the X-ray PDFs, referring to the final model for Co3O4. ESDs are in brackets.
SampleH260H350H450H650
Space Group F d 3 ¯ m F d 3 ¯ m F d 3 ¯ m F d 3 ¯ m
a/Å8.07478.07538.07618.0764
xO0.38540.38580.38610.3867
UCo20.00330.00320.00320.0032
UO20.01510.01490.01480.0156
ofCo10.900.920.950.96
Rp0.0950.0900.0940.097
Disclaimer/Publisher’s Note: The statements, opinions and data contained in all publications are solely those of the individual author(s) and contributor(s) and not of MDPI and/or the editor(s). MDPI and/or the editor(s) disclaim responsibility for any injury to people or property resulting from any ideas, methods, instructions or products referred to in the content.