2. Results and Discussion
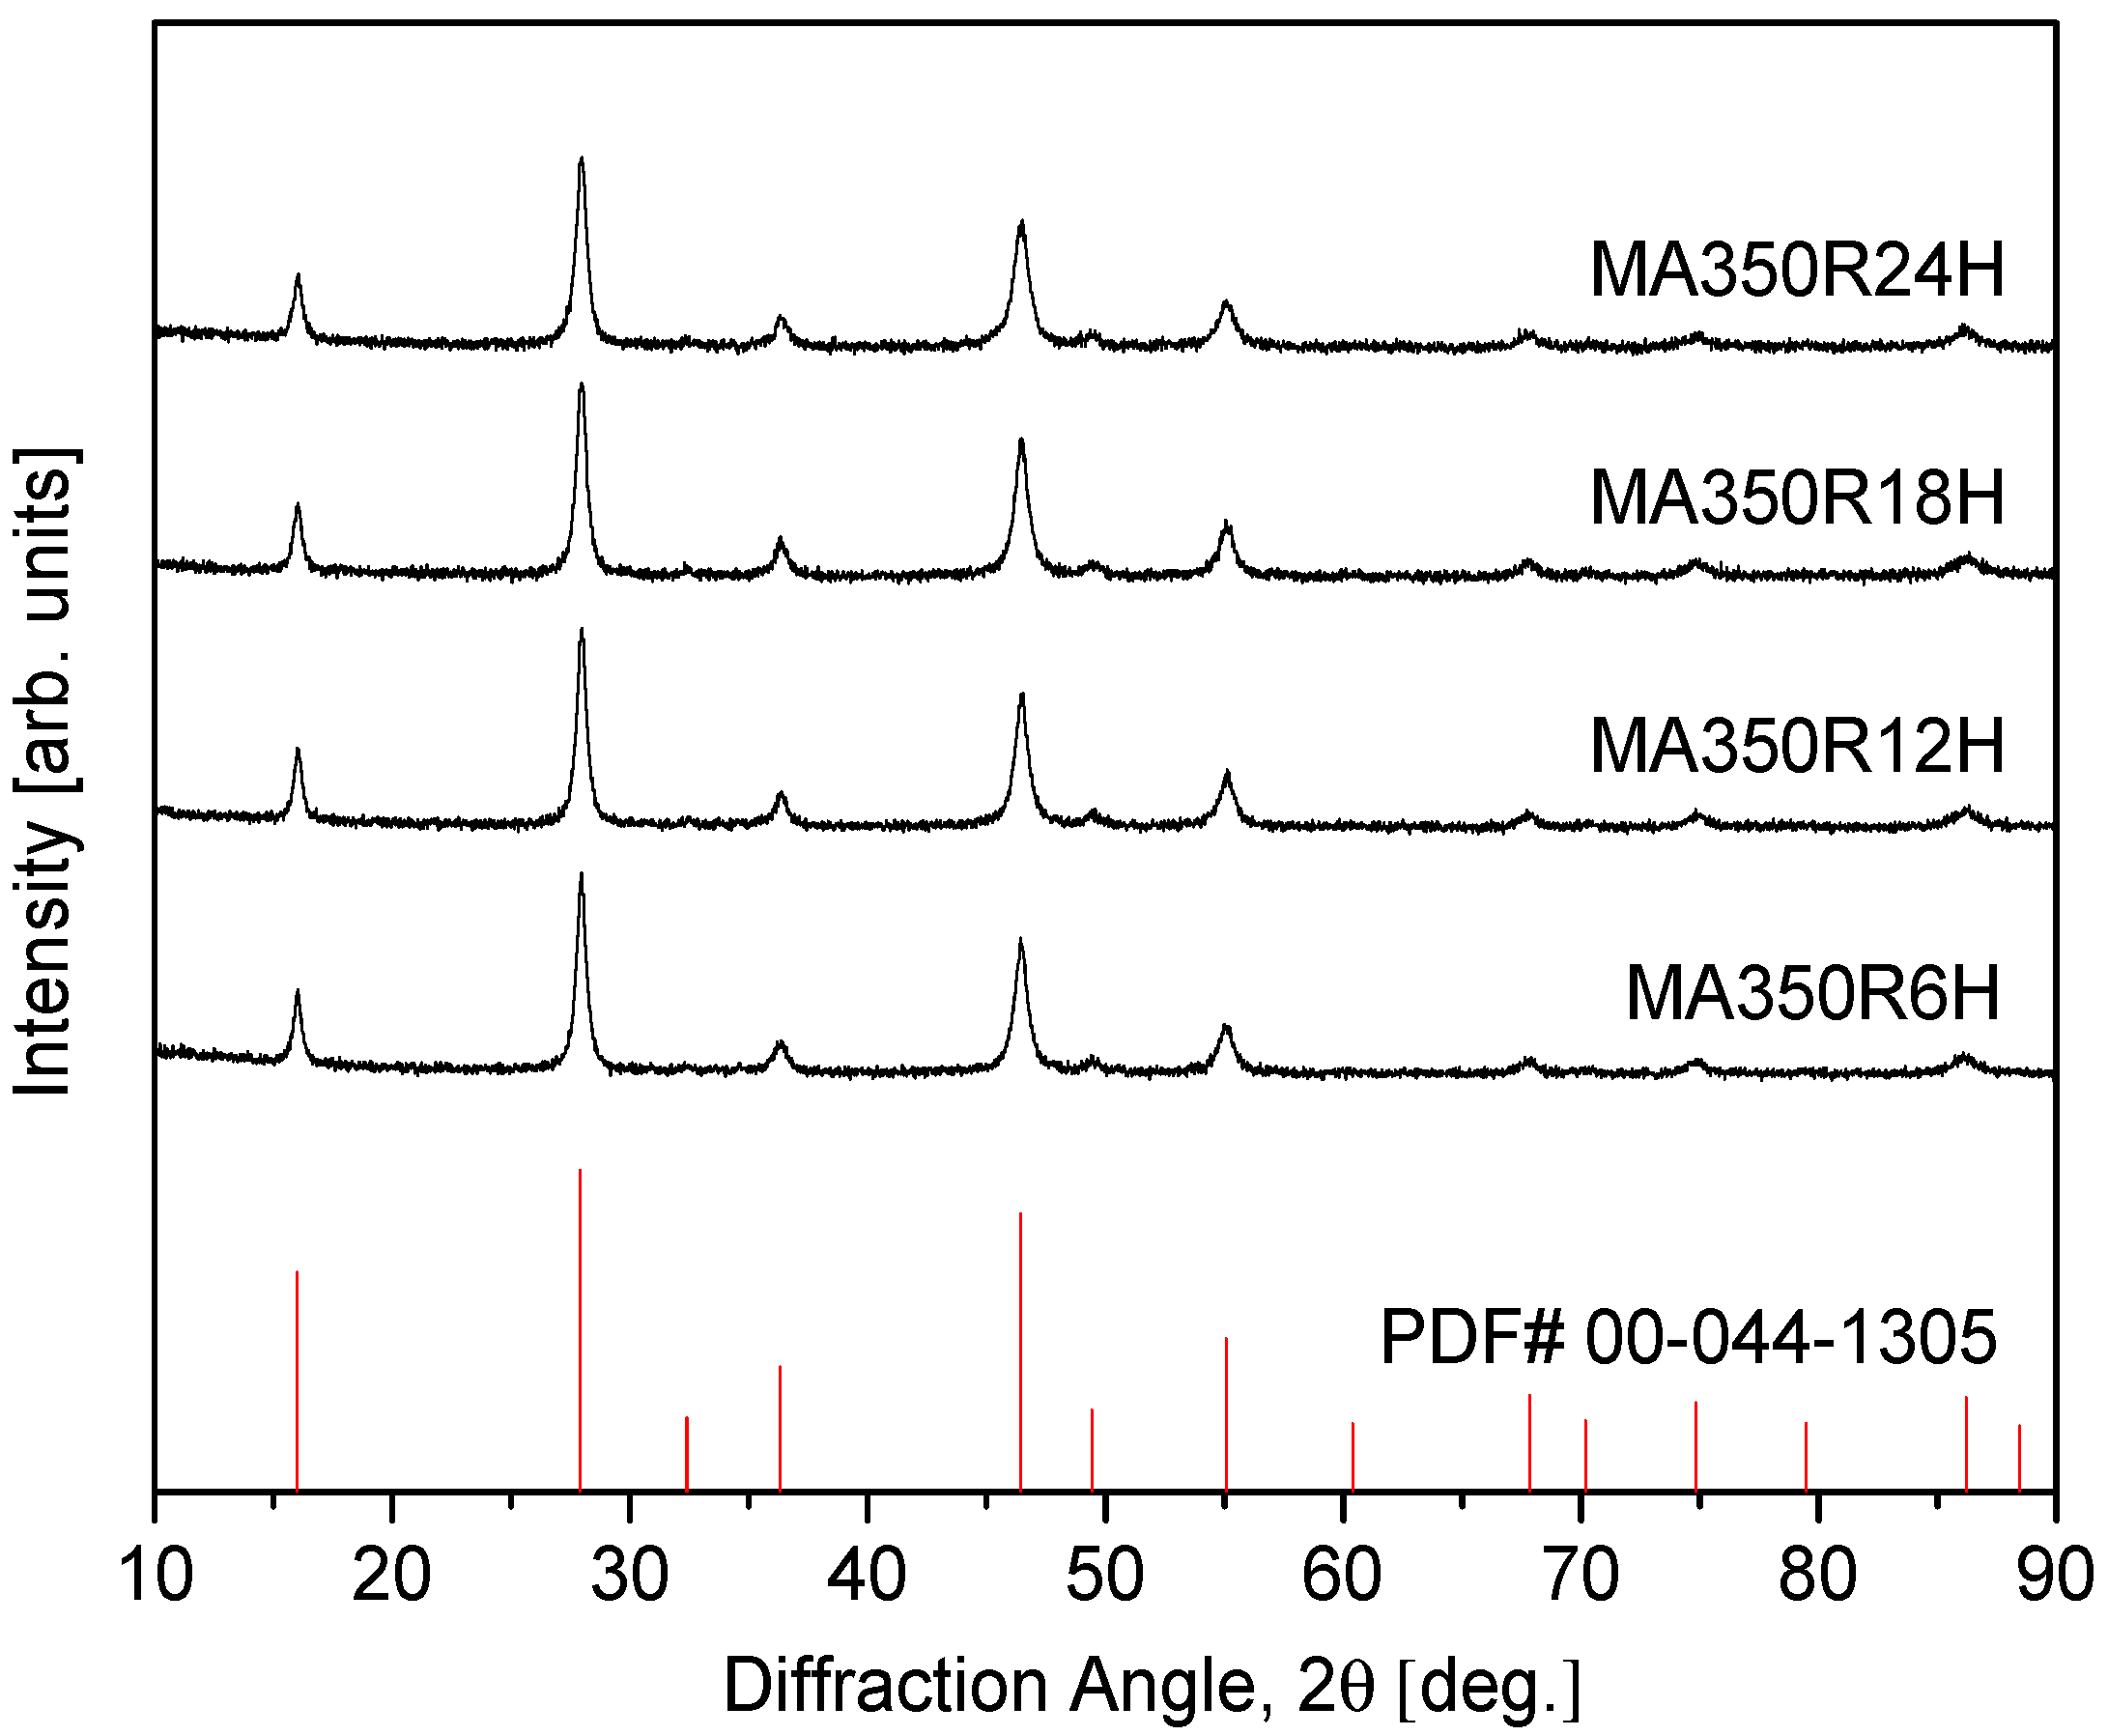
Figure 1 presents the XRD patterns of the synthesized CuFeSe
2 powders, illustrating the influence of MA duration on phase formation. The diffraction peaks observed align closely with the reference pattern for tetragonal eskebornite (CuFeSe
2; PDF# 00–044–1305), affirming the successful synthesis of the target phase. This structural confirmation is in agreement with earlier findings by Delgado et al. [
22], who noted that eskebornite could be considered a derivative of sulvanite (Cu
3VS
4) due to notable similarities in their diffraction signatures. Specifically, the sample processed via MA for 6 h at 350 rpm (denoted MA350R6H) displayed a well-defined single-phase tetragonal structure, indicating that short-duration milling is sufficient to induce solid-state reactions and phase stabilization. When the milling time was extended to 24 h (MA350R24H), no secondary phases were detected, and the diffraction pattern remained consistent, suggesting that prolonged MA does not compromise phase integrity, nor does it induce additional transformations. This stability under extended milling implies a robust structural resilience in CuFeSe
2 against mechanical-induced disorder.
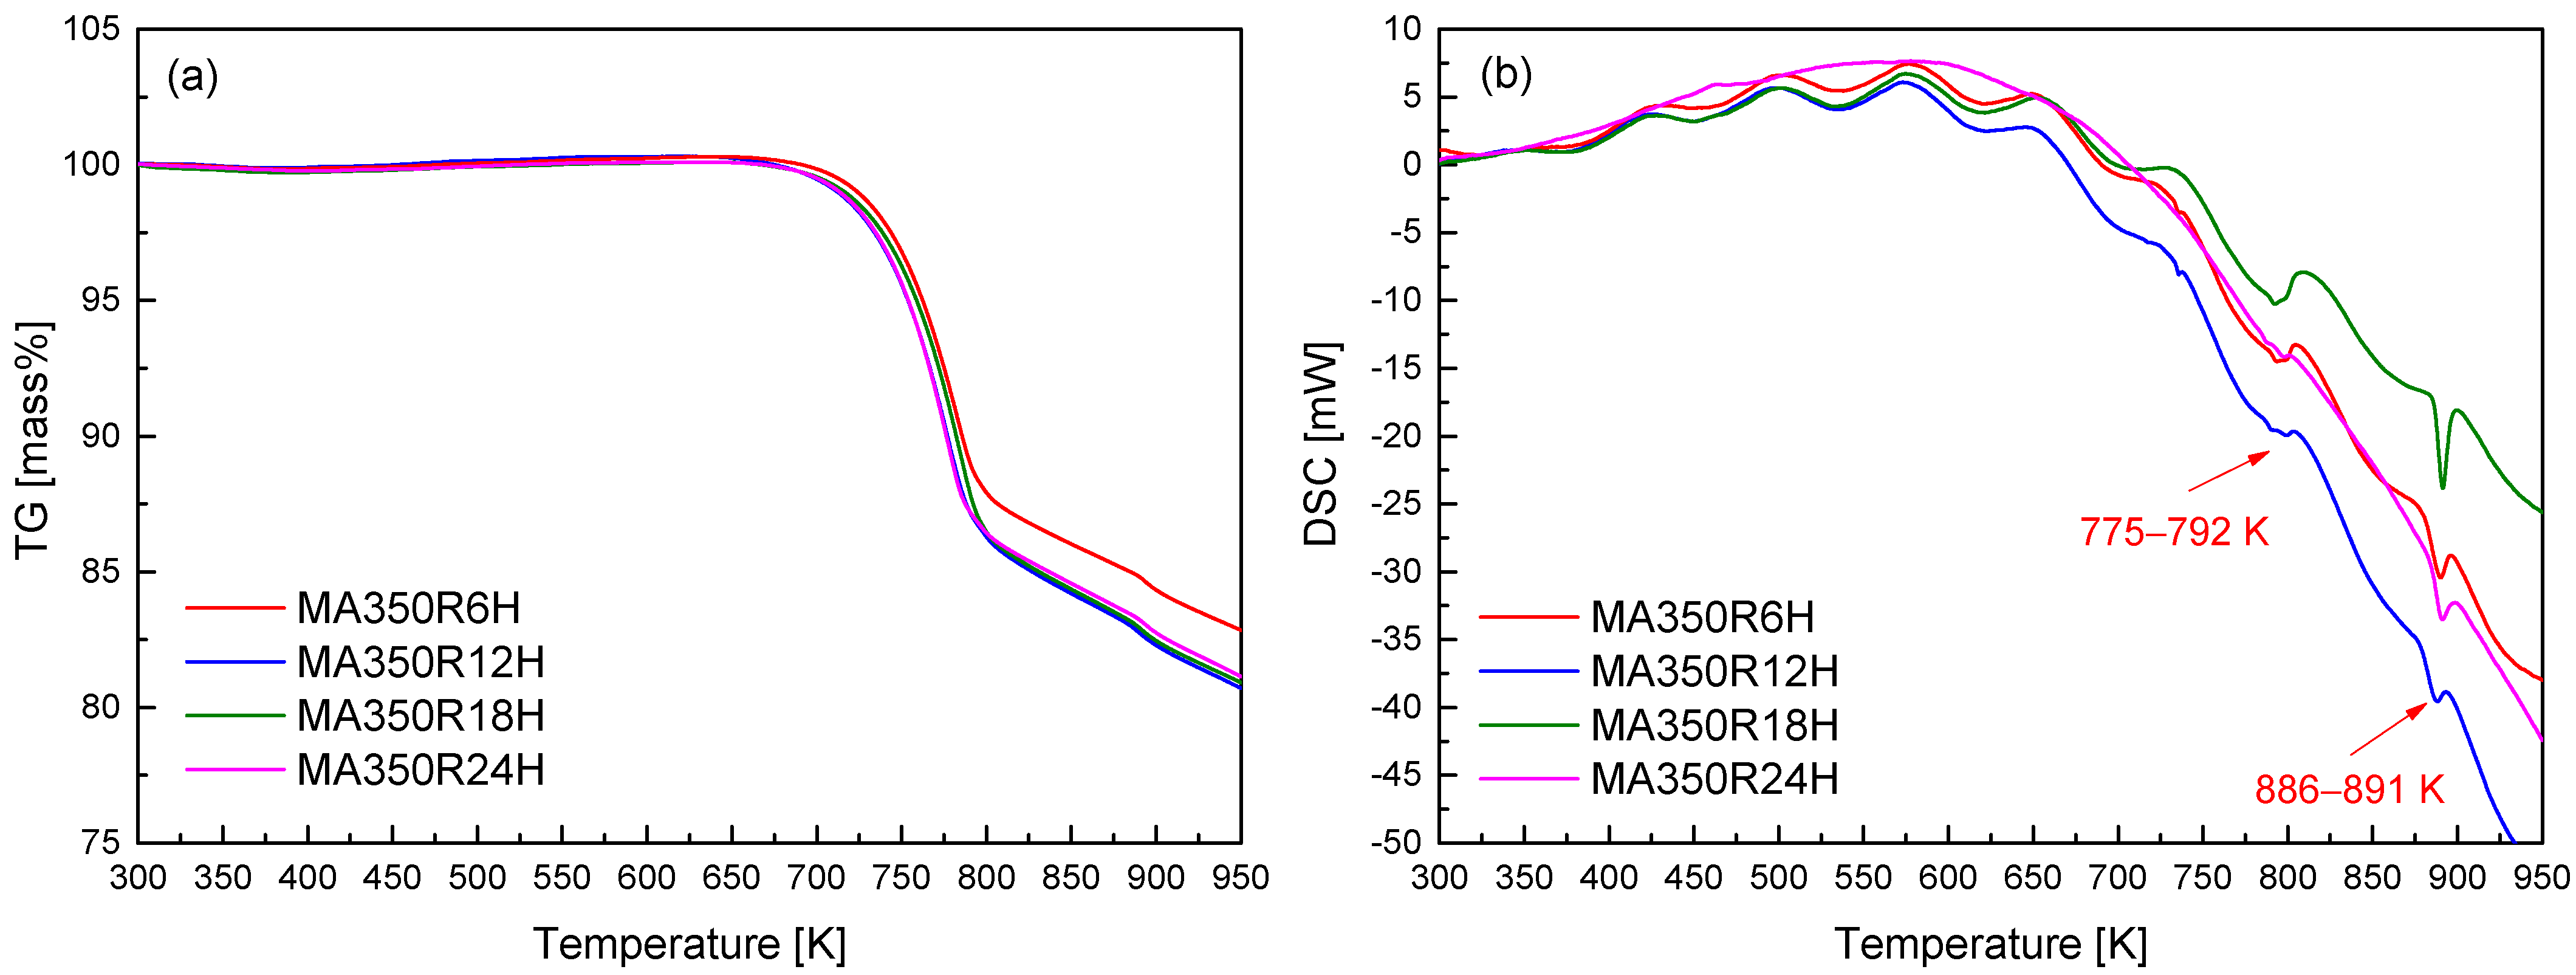
To further elucidate the thermal stability and potential phase transitions of the synthesized CuFeSe
2, thermogravimetric (TG) and differential scanning calorimetry (DSC) analyses were conducted, with the results displayed in
Figure 2. A noticeable mass loss initiates near 723 K, which is attributed to the volatilization of selenium—a volatile component known to influence the stoichiometry and thermal stability of chalcogenide compounds. The tendency of Se to volatilize upon heating represents a crucial factor affecting the compositional stability and thus the thermoelectric performance of CuFeSe
2. The DSC curves exhibit distinct thermal events across all MA powders, characterized by minor endothermic peaks between 775 and 792 K and more pronounced endothermic peaks around 886–891 K. These thermal signatures correspond, respectively, with the onset of decomposition/volatilization and congruent melting of CuFeSe
2. Notably, the observed melting behavior near 850 K is in line with previous reports on the congruent melting point of CuFeSe
2 [
1]. The resolution and reproducibility of these thermal events across samples provide critical information for identifying thermal limits during subsequent sintering or device operation, where phase degradation must be avoided. From the combined XRD and TG–DSC analyses, the optimal MA processing condition was determined to be 350 rpm for 12 h (MA350R12H), balancing effective phase formation with thermal stability. Based on this optimized conditions, further investigations were directed toward exploring how varying HP temperatures influence the microstructural evolution, phase purity, and thermoelectric properties of CuFeSe
2.
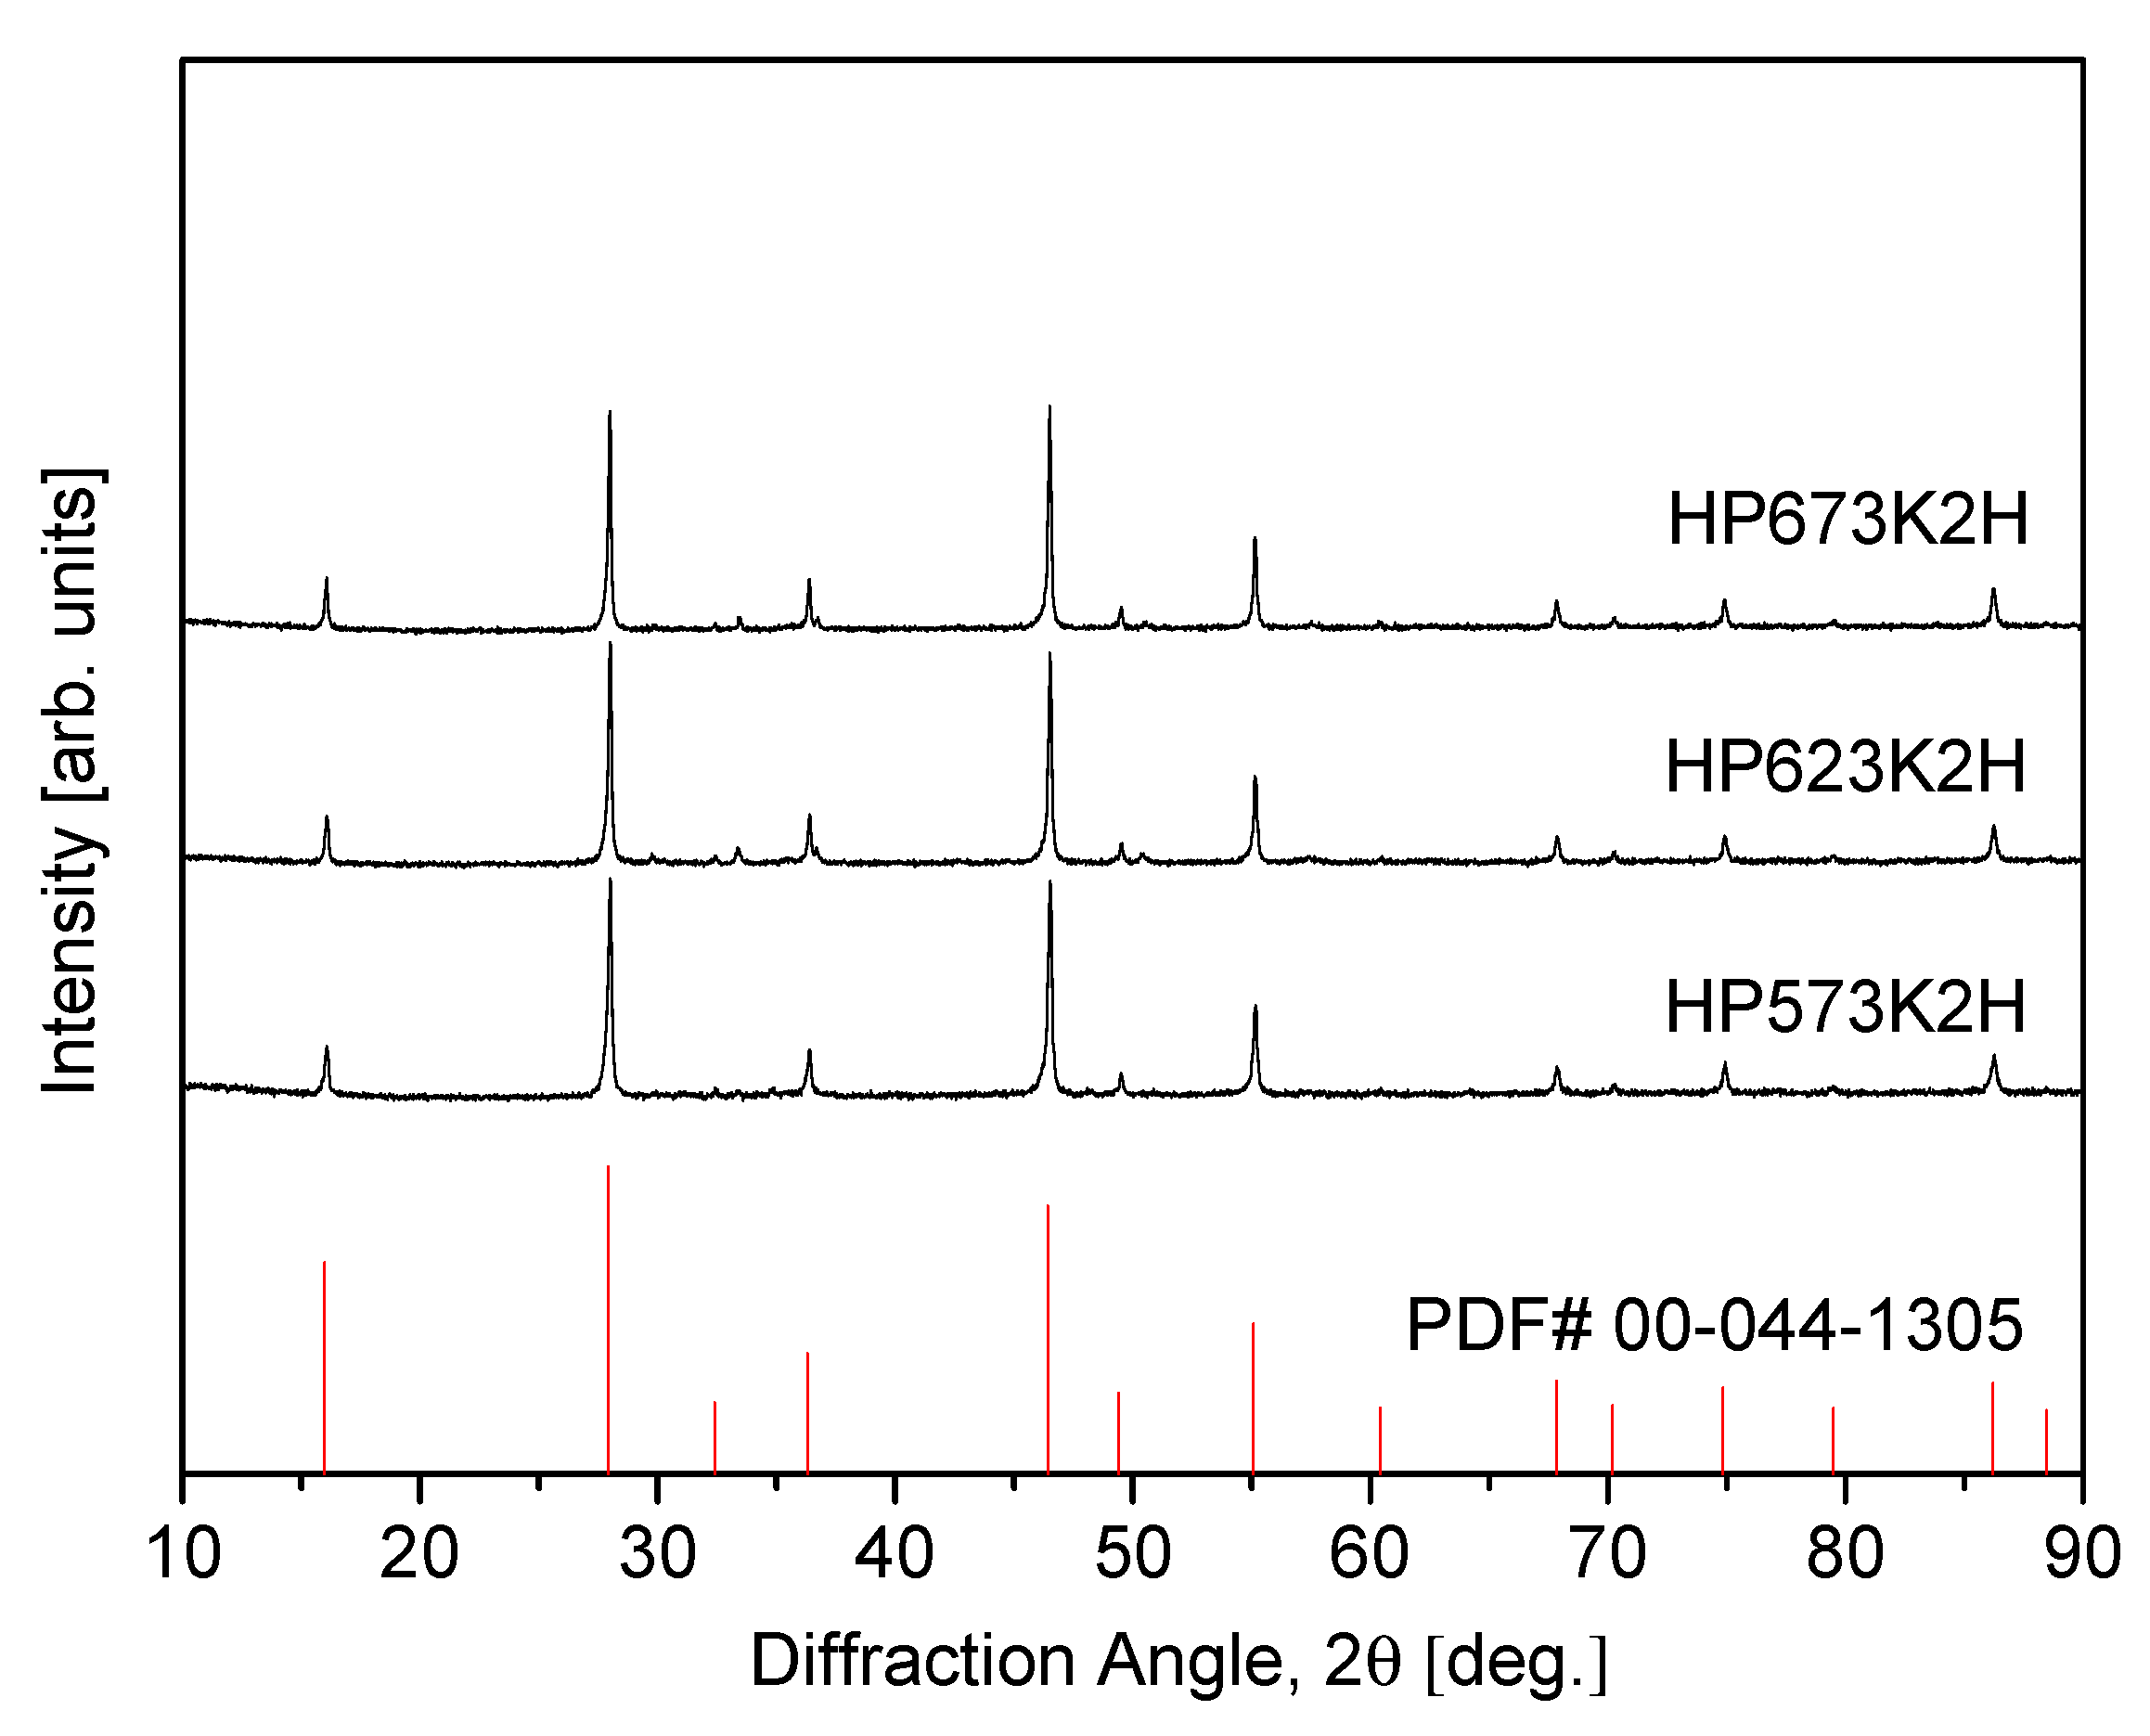
Figure 3 presents the XRD patterns of CuFeSe
2 specimens consolidated by HP at various temperatures, utilizing mechanically alloyed powders synthesized under the optimized milling conditions (MA350R12H). The sample labels, such as “HP623K2H”, denote the specific sintering parameters—hot pressing at 623 K for 2 h. The XRD results verify that the eskebornite phase remains structurally stable throughout the HP process, with no observable phase decomposition or formation of secondary phases. This phase retention under thermal and mechanical compaction conditions is of critical importance, as it ensures the preservation of the material’s intrinsic thermoelectric properties, which are strongly dependent on structural integrity. A comparative analysis of the diffraction patterns reveals that the broadened peaks observed in the as-milled powders (
Figure 1) are likely attributable to nanocrystalline domains and lattice strain induced by mechanical deformation during ball milling. Following HP, the diffraction peaks become noticeably sharper and more intense, indicative of improved crystallinity. This transformation suggests significant crystallite growth and partial strain recovery facilitated by the elevated temperature and pressure conditions during HP. Such structural refinement is beneficial for optimizing carrier mobility and reducing grain boundary scattering, both of which are essential in enhancing thermoelectric performance.
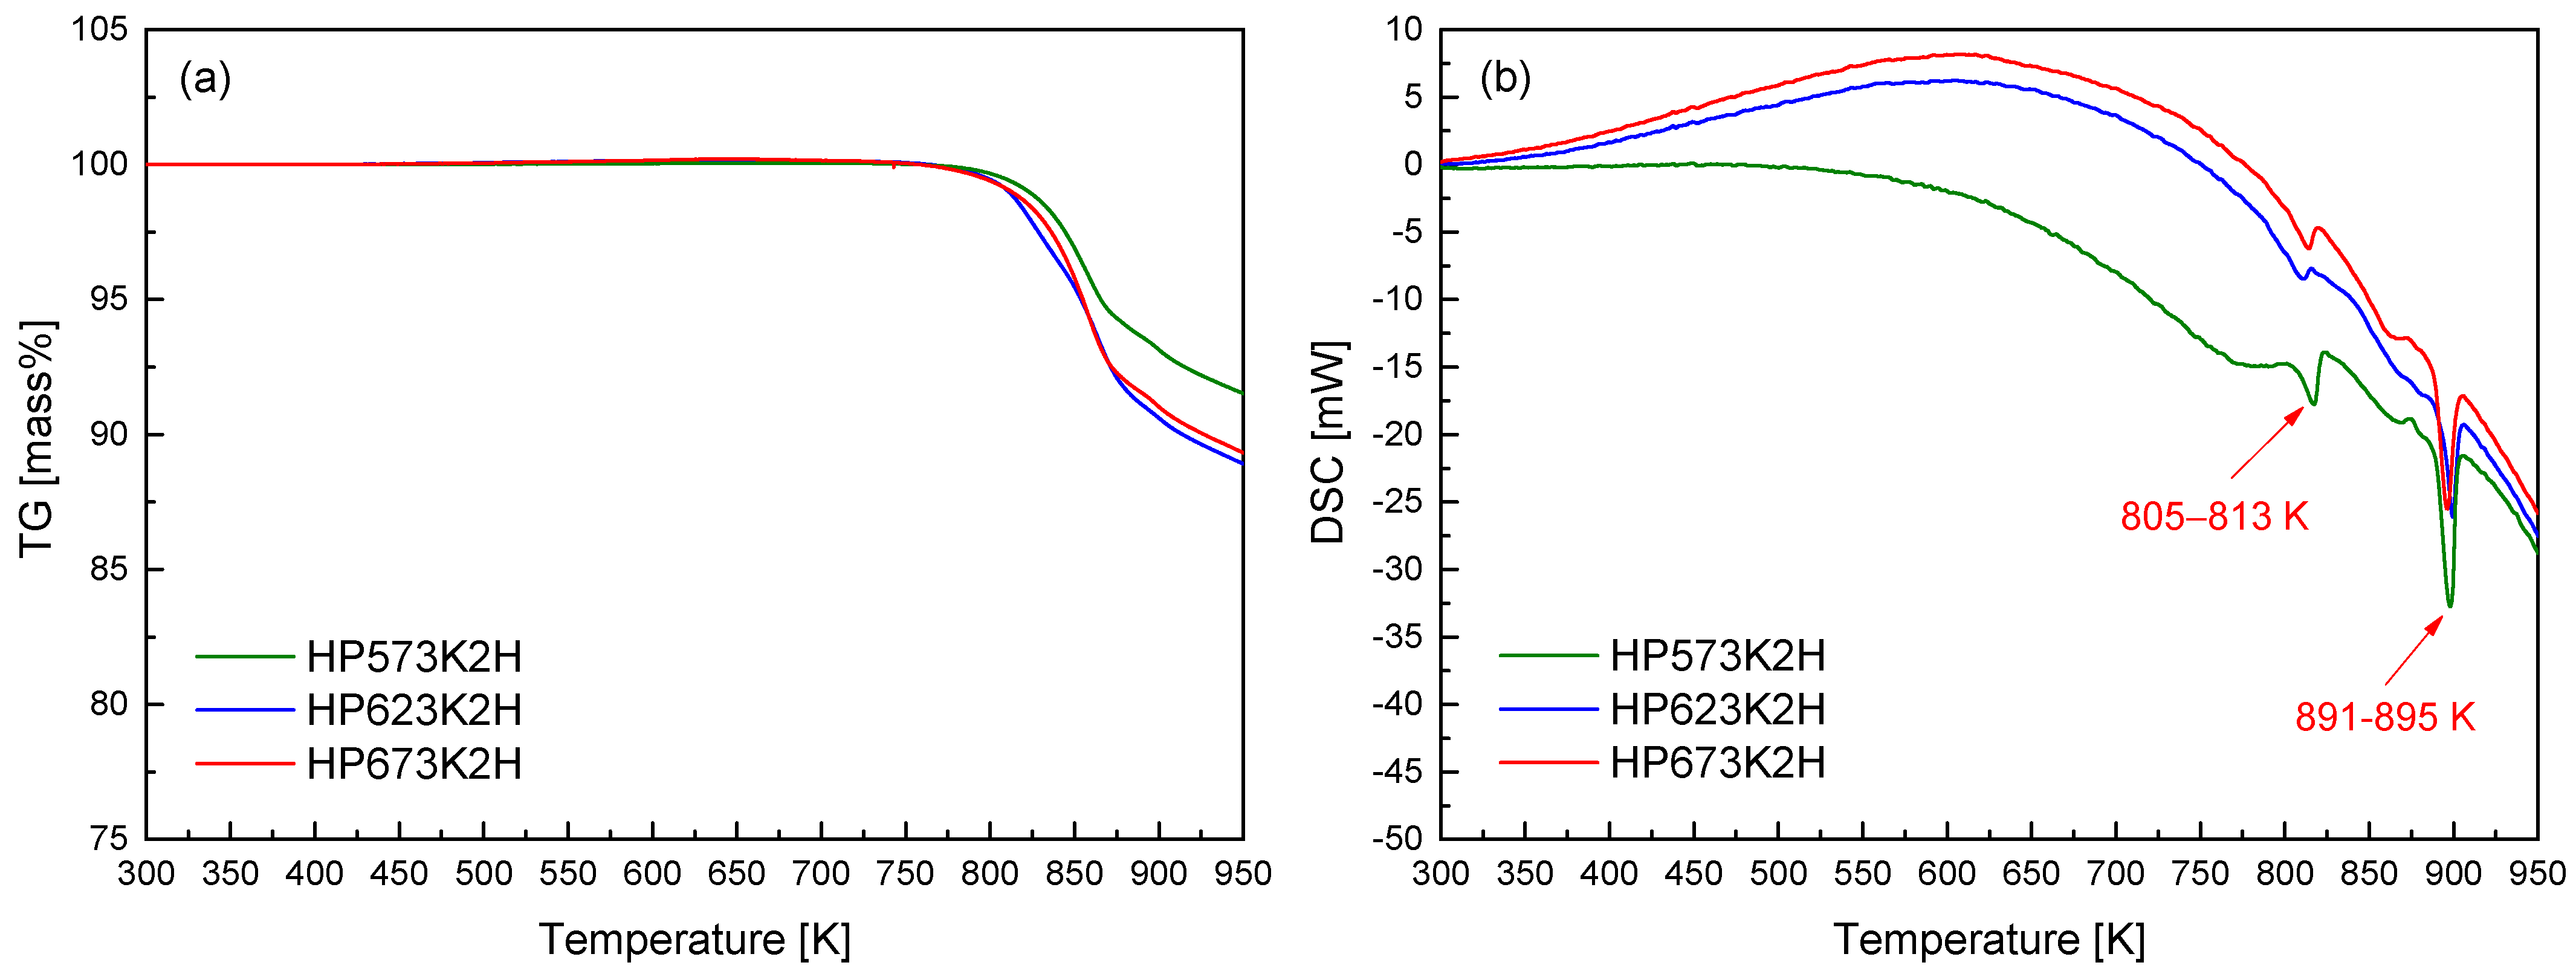
Figure 4 presents the TG–DSC curves for the hot-pressed CuFeSe
2 specimens. A pronounced mass loss was detected at temperatures exceeding approximately 823 K. This onset temperature is notably higher than that observed in the TG profiles of the mechanically alloyed powders (
Figure 2a), suggesting that hot pressing significantly enhances the thermal stability of the material. In addition to the delayed onset, the rate of mass loss in the hot-pressed samples was markedly reduced. This diminished volatilization can be ascribed to the lower specific surface area and increased densification resulting from the HP process. The compact microstructure produced through sintering acts as a diffusion barrier, particularly impeding the escape of volatile elements such as selenium, which is highly susceptible to sublimation at elevated temperatures. The improved retention of Se is particularly important in preserving phase composition and ensuring the long-term thermoelectric reliability of CuFeSe
2 under thermal stress. The DSC thermograms reveal minor endothermic events between 805 and 813 K and more pronounced peaks in the 891–895 K range. These thermal events are associated with phase-related transformations such as incipient volatilization and eventual melting. Importantly, no thermal anomalies were observed below 750 K, indicating that the MA–HP synthesized eskebornite maintains structural stability up to this temperature. Consequently, sintering temperatures for hot pressing should be carefully selected to remain below this thermal threshold in order to prevent undesirable decomposition or phase degradation. This observation aligns with the findings of Zhang et al. [
23], who reported that hot-pressed CuFeSe
2 exhibited thermal stability up to approximately 723 K, as determined via TG analysis. The elevated stability observed in the present study further corroborates the beneficial impact of optimized MA–HP processing conditions on the high-temperature performance of eskebornite.
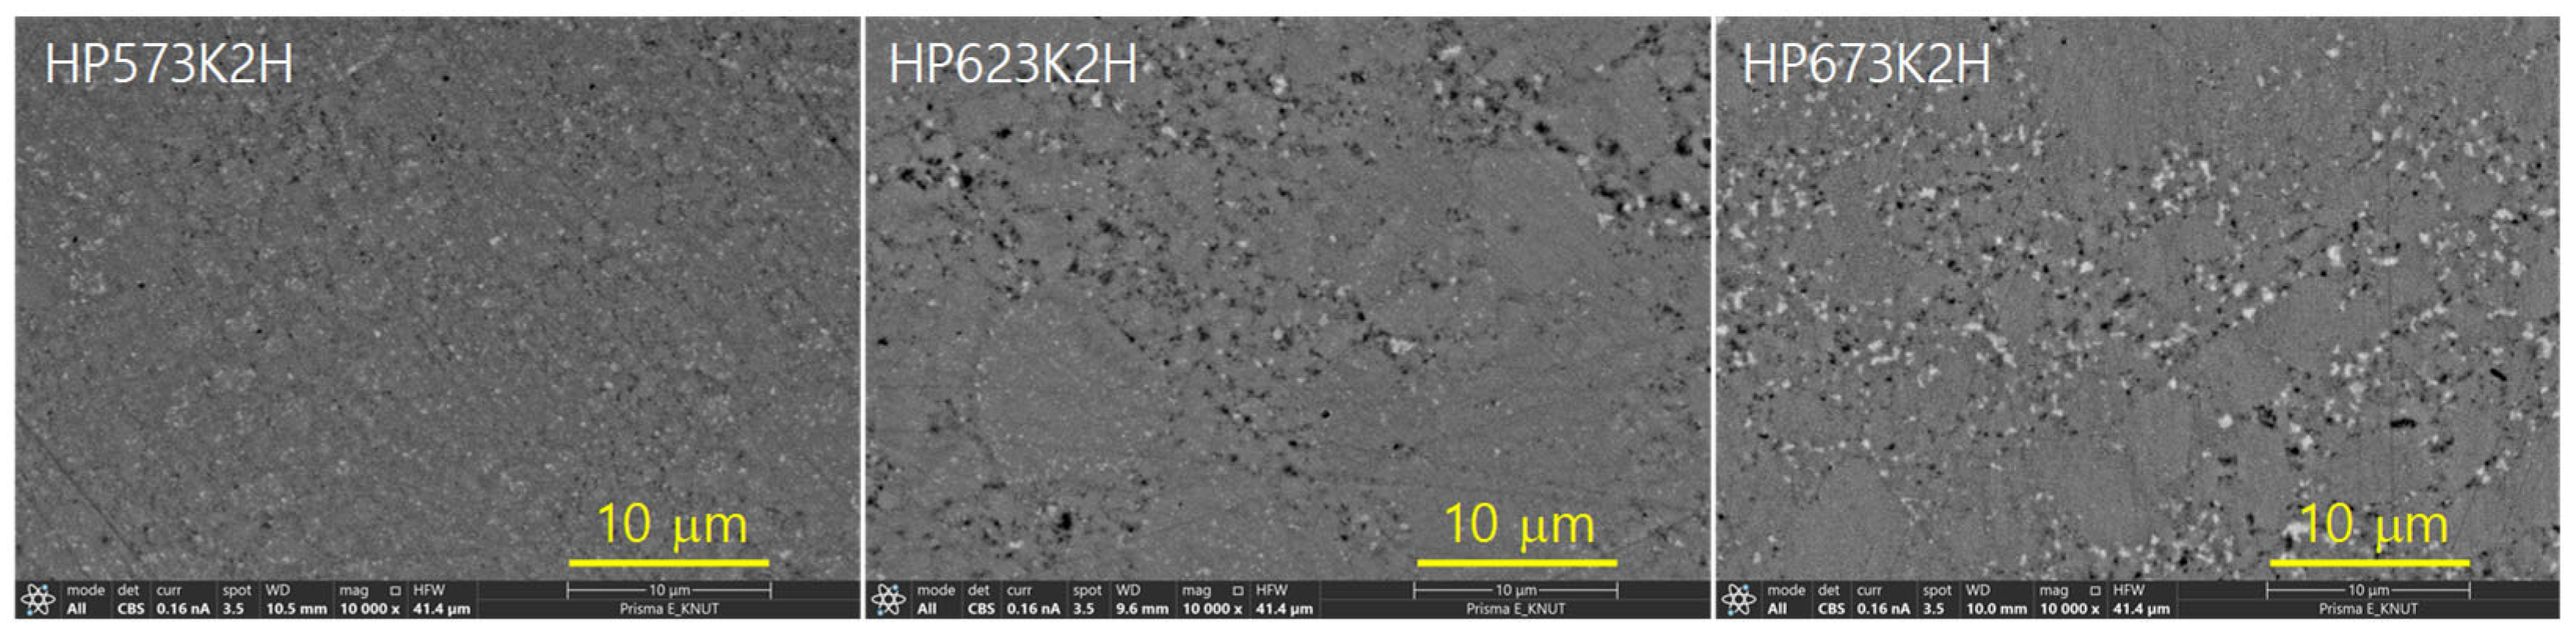
Figure 5 presents the SEM images of sintered CuFeSe
2 specimens, elucidating the microstructural evolution under varying HP temperatures. The samples exhibited dense microstructures, with relative densities ranging from 99.1% to 99.6%, as summarized in
Table 1, relative to the theoretical density of CuFeSe
2 (5.35 gcm
−3) [
24]. These results confirm the effectiveness of the HP process in promoting substantial densification, which is critical in achieving enhanced mechanical robustness and reduced phonon scattering at grain boundaries—key factors in improving thermoelectric performance. Lattice parameters determined via Rietveld refinement were found to be in the ranges of a = 0.5523–0.5525 nm and c = 1.1040–1.1041 nm, corresponding to a tetragonality (c/a) between 1.9984 and 1.9989. These values closely align with those reported by Moorthy et al. [
1] for bulk CuFeSe
2 (a = 0.55272 nm, c = 1.10380 nm), confirming the successful formation of the tetragonal eskebornite phase. The minor deviations observed in the lattice constants may stem from differences in synthesis techniques, such as mechanical alloying versus solid-state reaction, or variations in processing parameters like pressure and temperature during HP. Further comparison with the study by Zhai et al. [
14], who investigated Cu
1+xFeSe
2 with varying Cu content (x = 0.00–0.05), revealed that the lattice parameters for stoichiometric CuFeSe
2 (x = 0) were slightly lower (a = 0.55136 nm, c = 1.10357 nm), indicating that even minor compositional deviations can subtly affect the unit cell dimensions. This trend emphasizes the sensitivity of the crystal lattice to stoichiometric imbalances, especially in transition metal chalcogenides where bonding environments are composition-dependent. Interestingly, Hamdadou et al. [
25] reported relatively invariant lattice constants for CuFeSe
2 across a range of Cu/Fe atomic ratios, with a = 0.5500–0.5506 nm and c = 1.1050–1.1064 nm, suggesting a degree of structural robustness against compositional fluctuations. This apparent discrepancy may reflect differences in sample morphology (e.g., polycrystalline vs. nanocrystalline), synthesis kinetics, or thermal history, which can all influence defect densities and lattice strain. Collectively, the high densification and consistent lattice parameters observed in this study indicate that the MA–HP process effectively produces phase-pure, structurally stable eskebornite.
Figure 6 presents a high-resolution examination of the elemental distribution in the CuFeSe
2 specimen sintered at 623 K for 2 h (designated HP623K2H), along with the corresponding EDS results. Both the one-dimensional line scan profiles and two-dimensional elemental mapping confirm a uniform spatial distribution of Cu, Fe, and Se throughout the microstructure. This homogeneous distribution of elements is critical in maintaining the intrinsic thermoelectric behavior of the material, as compositional uniformity minimizes the potential for compositional inhomogeneities, secondary phase formation, or localized stoichiometric imbalances. The absence of detectable secondary phases in the EDS spectra strongly supports the preservation of the single-phase tetragonal CuFeSe
2 (eskebornite) structure, as corroborated by the XRD results. The microstructural uniformity further indicates that the combination of mechanical alloying and hot pressing successfully facilitated not only intimate mixing at the atomic level but also effective densification, thereby suppressing phase segregation during synthesis and consolidation.
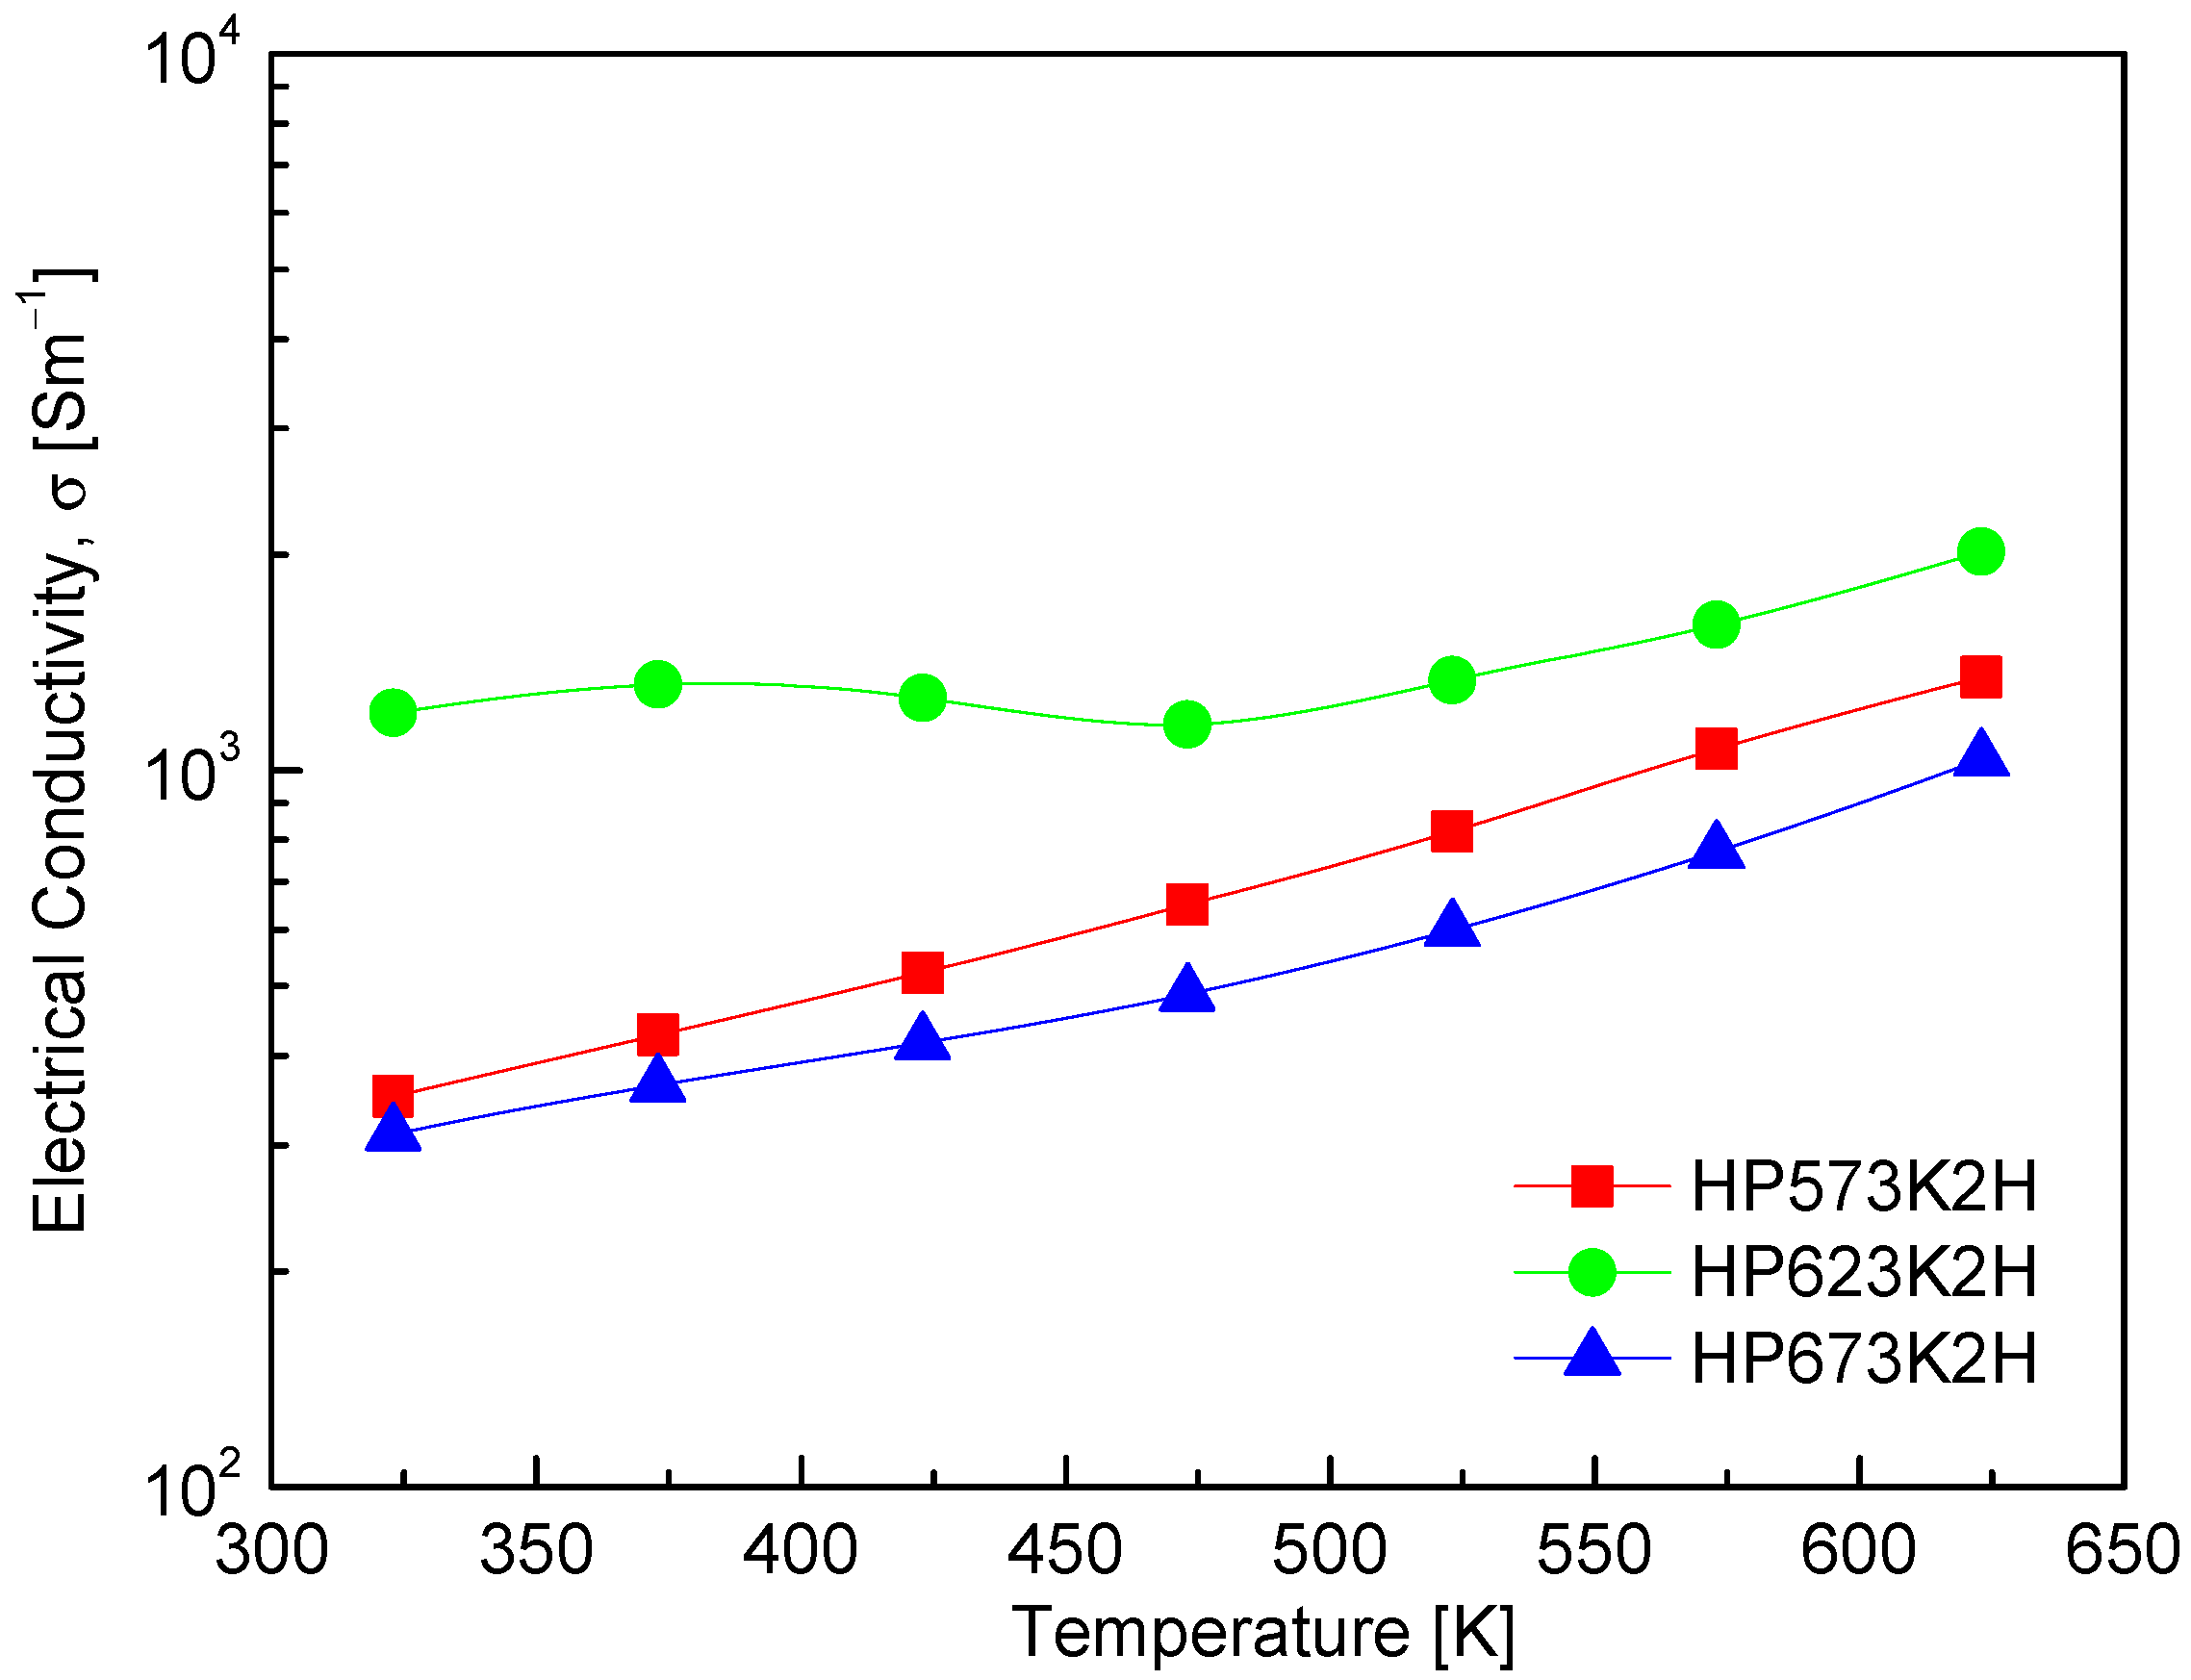
Figure 7 presents the temperature-dependent electrical conductivity of CuFeSe
2, clearly illustrating its semiconducting nature. The observed increase in electrical conductivity with rising temperature is characteristic of non-degenerate semiconductors, wherein thermal excitation promotes charge carriers across the band gap, thereby enhancing electrical transport. A detailed comparison of specimens processed under varying HP temperatures reveals a significant influence of sintering conditions on electrical conductivity. Specifically, increasing the HP temperature from 573 to 623 K results in a marked improvement in electrical conductivity, likely due to enhanced densification, improved grain connectivity, and a reduction in grain boundary scattering. However, further increasing the HP temperature to 673 K leads to a decline in electrical conductivity. This deterioration can be attributed to compositional deviations—particularly Se volatilization at elevated temperatures due to its high vapor pressure. The resulting Se vacancies act as compensating donors, effectively reducing the concentration of majority carriers (holes) in this p-type material. Such a decrease in carrier concentration adversely affects electrical conductivity, highlighting the critical importance of maintaining stoichiometric balance during high-temperature processing [
26,
27]. Among the tested samples, the HP623K2H specimen exhibited the highest electrical conductivity, reaching 1.2 × 10
3 Sm
−1 at 323 K and increasing to 2.0 × 10
3 Sm
−1 at 623 K. This performance indicates that HP at 623 K provides optimal conditions for promoting carrier mobility while minimizing compositional degradation. Comparative insights from previous studies further contextualize these findings. Moorthy et al. [
1] reported a decrease in σ from 6.7 × 10
3 Sm
−1 at 300 K to 6.0 × 10
3 Sm
−1 at 500 K, followed by a subsequent increase beyond 500 K, suggesting more complex transport behavior possibly influenced by the synthesis method, the microstructure, or intrinsic defect chemistry. Additionally, Zhai et al. [
14] observed that electrical resistance was prohibitively high below 425 K, but conductivity rose sharply to 2.7 × 10
3 Sm
−1 at 723 K, reaffirming the strong temperature dependence of charge transport in CuFeSe
2. These variations underscore the sensitivity of electrical conductivity to the synthesis conditions, stoichiometry, and measurement range, reinforcing the significance of fine-tuning processing parameters in thermoelectric optimization.
Figure 8 presents the temperature-dependent Seebeck coefficient of CuFeSe
2, which reveals positive values across the measured temperature range, thereby confirming dominant p-type conduction and the prevalence of holes as majority charge carriers. The Seebeck coefficient initially increases with temperature, reaching a maximum near an intrinsic transition temperature, beyond which it begins to decrease. This behavior is characteristic of semiconductors and aligns with theoretical models of thermoelectric transport, where the Seebeck coefficient is governed by the interplay between carrier concentration, effective mass, and temperature [
28]. At lower temperatures, the increase in the Seebeck coefficient is primarily due to the enhanced thermal excitation of charge carriers, which increases the entropy per carrier and thus the Seebeck coefficient. However, upon reaching the intrinsic transition regime—typically associated with the thermal generation of electron–hole pairs—the rapid rise in carrier concentration leads to bipolar conduction. This phenomenon causes the Seebeck coefficient to decline due to the compensation effect between electrons and holes [
29]. In this study, maximum Seebeck coefficient values for CuFeSe
2 were observed between 423 and 473 K, with the HP573K2H specimen exhibiting the highest Seebeck coefficient of 51.3 μVK
−1 at 473 K. This peak suggests that the sample maintains favorable carrier scattering and a relatively low intrinsic carrier concentration in this temperature window, which is optimal for thermoelectric performance. The comparative literature data reveal significant variability in the Seebeck coefficient values and trends, likely arising from differences in synthesis routes, compositional stoichiometry, and microstructure. Moorthy et al. [
1] reported a steady increase in the Seebeck coefficient from 12.2 μVK
−1 at 300 K to 16.9 μVK
−1 at 645 K, reaffirming hole-dominated transport. In contrast, Zhai et al. [
14] observed a sign inversion of the Seebeck coefficient above 323 K, reaching a peak negative value of −175 μVK
−1 at 473 K, indicative of a p–n transition and suggesting a shift in majority carrier type. Such a transition may stem from a subtle compositional imbalances or phase evolution during synthesis. Similarly, Berthebaud et al. [
30] reported a p–n transition in CuFeSe
2 above 325 K, highlighting the sensitivity of the Seebeck coefficient to synthesis conditions and potential phase changes. Conversely, Zhang et al. [
23] reported only positive Seebeck coefficients from 300 to 660 K, suggesting stable p-type behavior throughout the measured range.
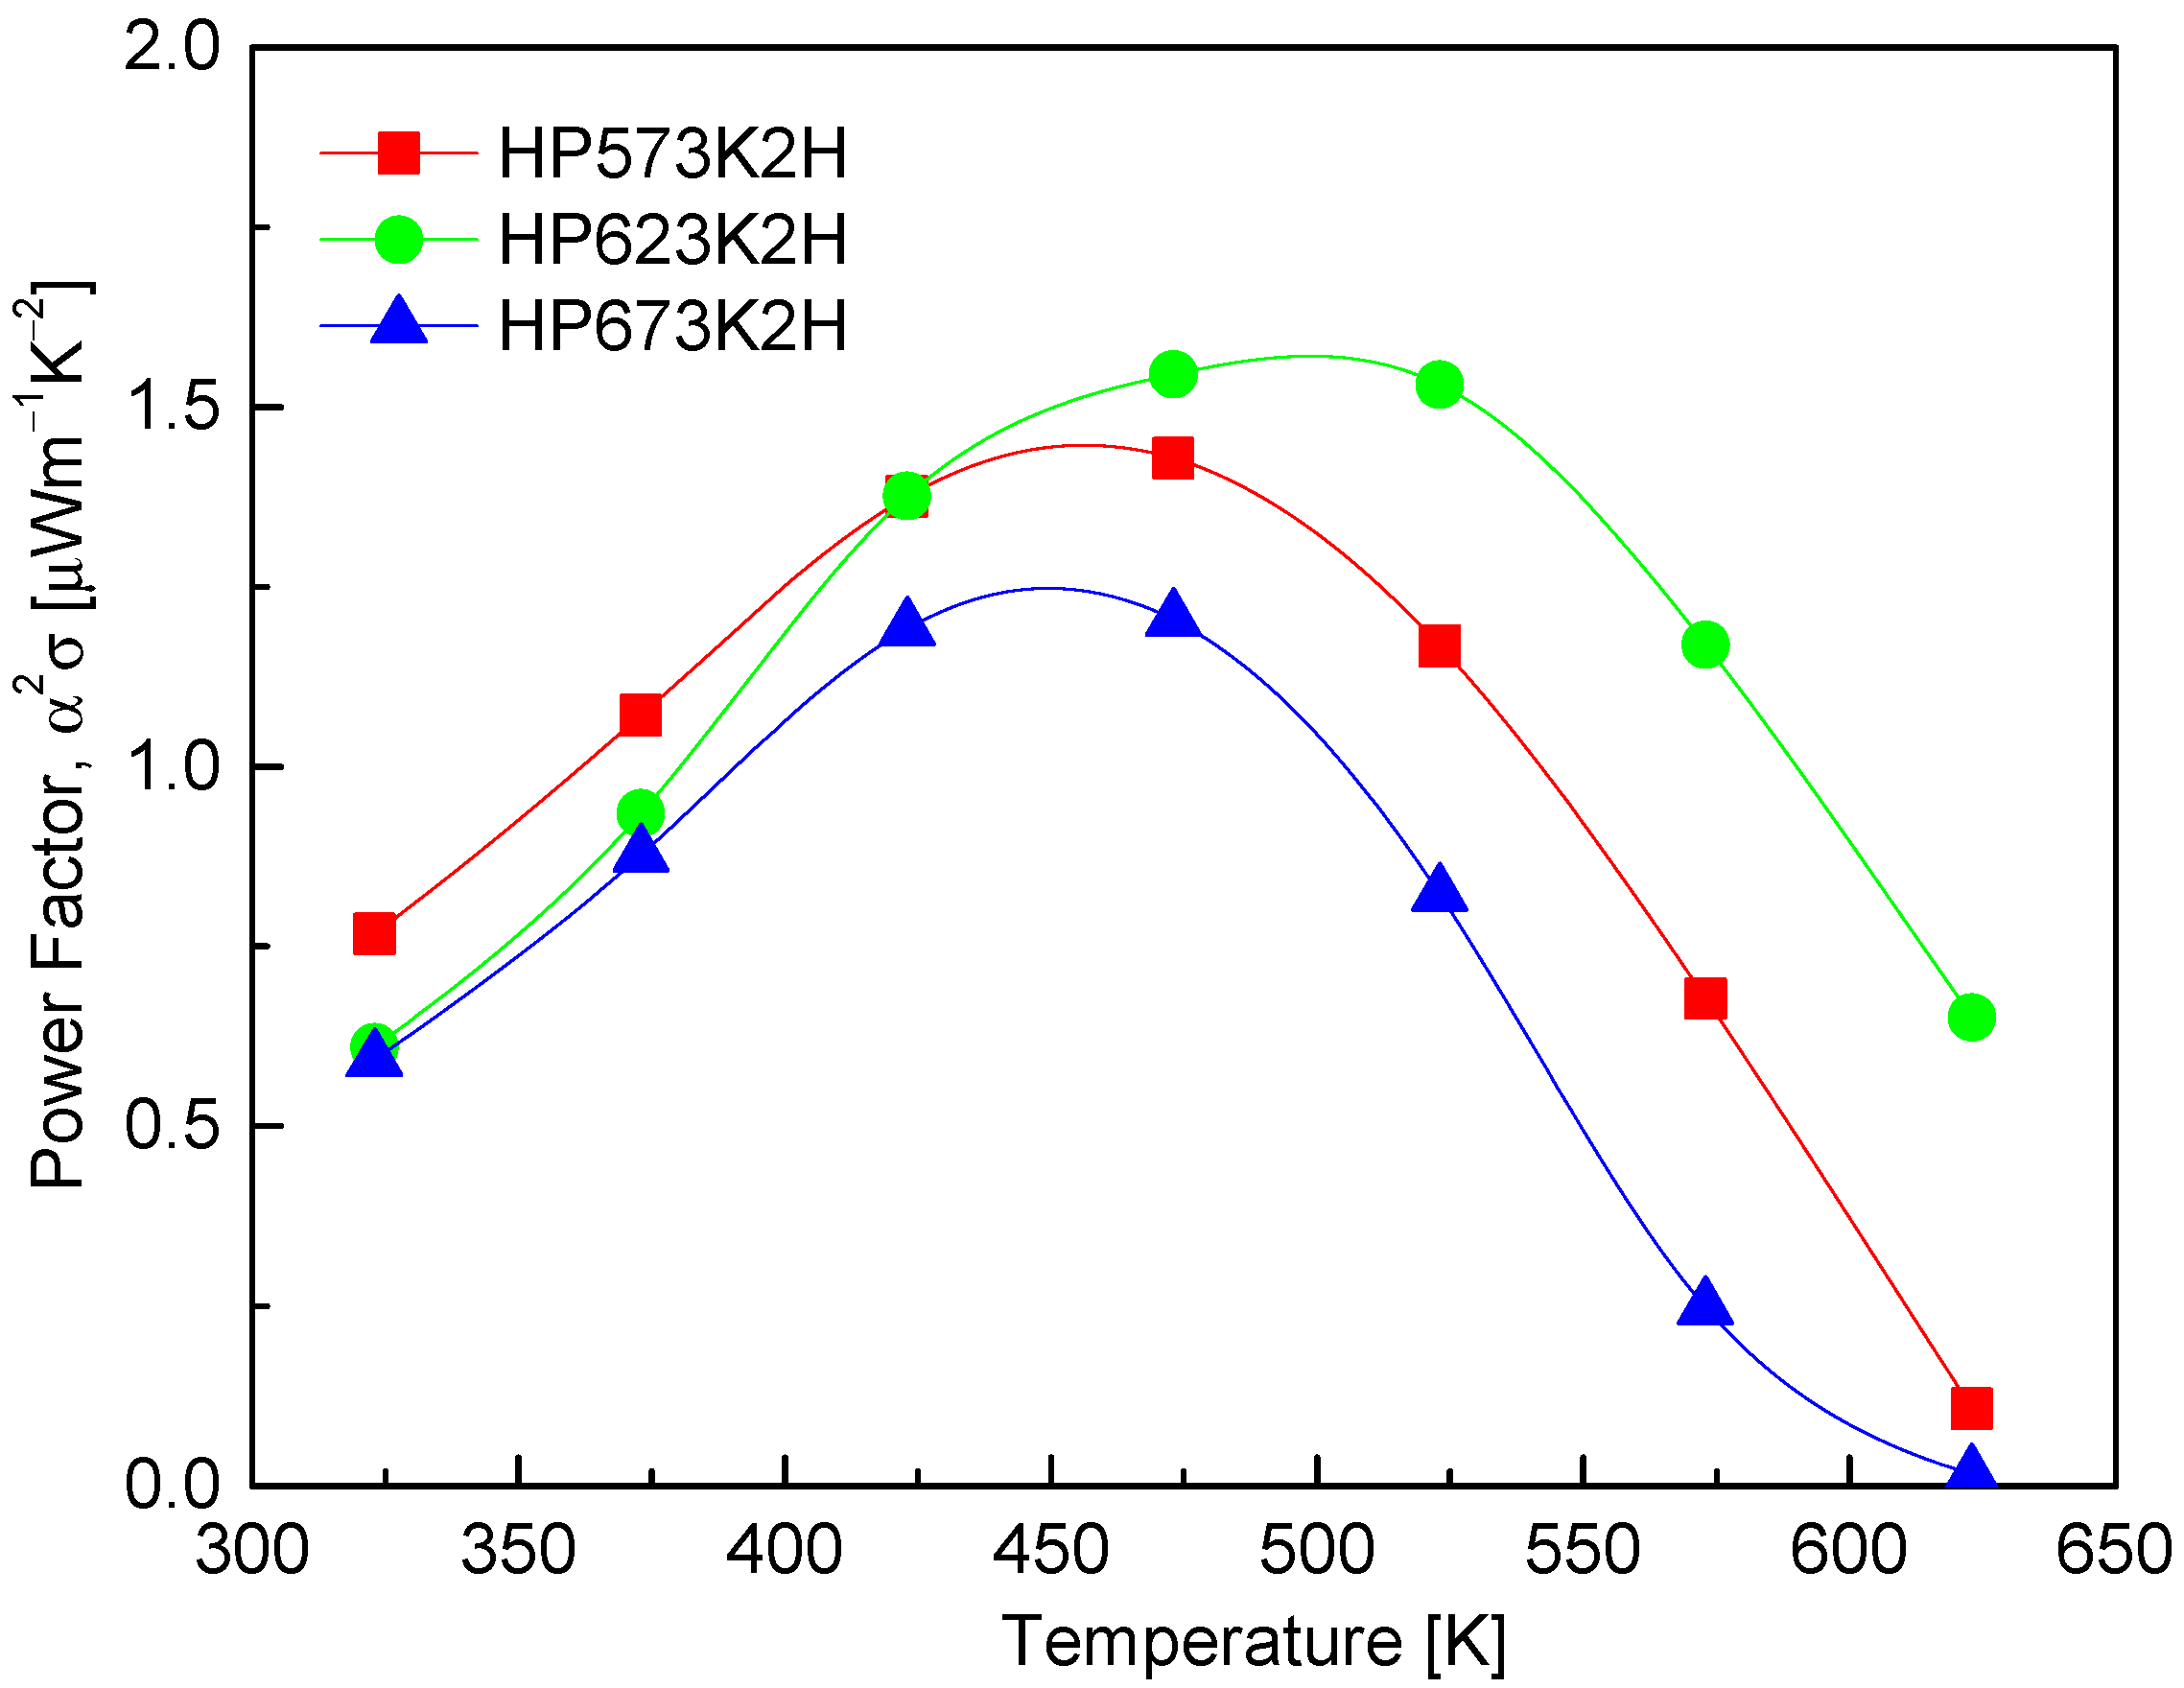
Figure 9 displays the power factor (PF) of CuFeSe
2 as a function of temperature, calculated from the measured Seebeck coefficient and electrical conductivity. The results show that the PF reaches its maximum in the temperature range of 473–523 K, which corresponds with the optimal interplay between charge carrier mobility and carrier concentration. Specifically, the HP573K2H and HP623K2H samples exhibit peak PF values of 1.43 μWm
−1K
−2 at 473 K and 1.55 μWm
−1K
−2 at 523 K, respectively. These values indicate that the hot-pressing process at moderate temperatures enhances thermoelectric performance by simultaneously improving crystallinity and maintaining a near-stoichiometric composition, which is essential in reducing defect-induced carrier scattering. The enhancement in PF within this temperature window highlights a thermoelectric “sweet spot” where the thermal activation of charge carriers contributes positively to transport properties without inducing significant bipolar conduction or Se volatilization. This suggests that CuFeSe
2 synthesized via the MA–HP process exhibits favorable electronic transport properties at intermediate temperatures, making it a promising candidate for mid-temperature thermoelectric applications. When compared to previous studies, the PF values obtained in this work fall within a moderate range. Moorthy et al. [
1] reported a higher maximum PF of 2.07 μWm
−1K
−2 at 645 K for bulk CuFeSe
2 synthesized via solid-state reactions, which may reflect improved grain boundary conductivity or lower defect density. On the other hand, Zhang et al. [
23] observed a significantly lower PF of 0.37 μWm
−1K
−2 at 653 K for CuFeSe
2 synthesized via a colloidal approach, suggesting that nanostructuring or incomplete densification may have hindered electronic transport in their samples. Remarkably, Zhai et al. [
14] reported an exceptionally high n-type PF exceeding 20 μWm
−1K
−2 at 723 K, which stands in stark contrast with the relatively modest values observed in other reports. This anomalously high performance likely stems from compositional tuning or intrinsic structural differences induced by their specific synthesis route, which may have enhanced charge carrier concentration and mobility. Such discrepancies emphasize the sensitivity of PF to subtle variations in stoichiometry, defect chemistry, and microstructure, reinforcing the importance of processing optimization for high-performance thermoelectric materials.
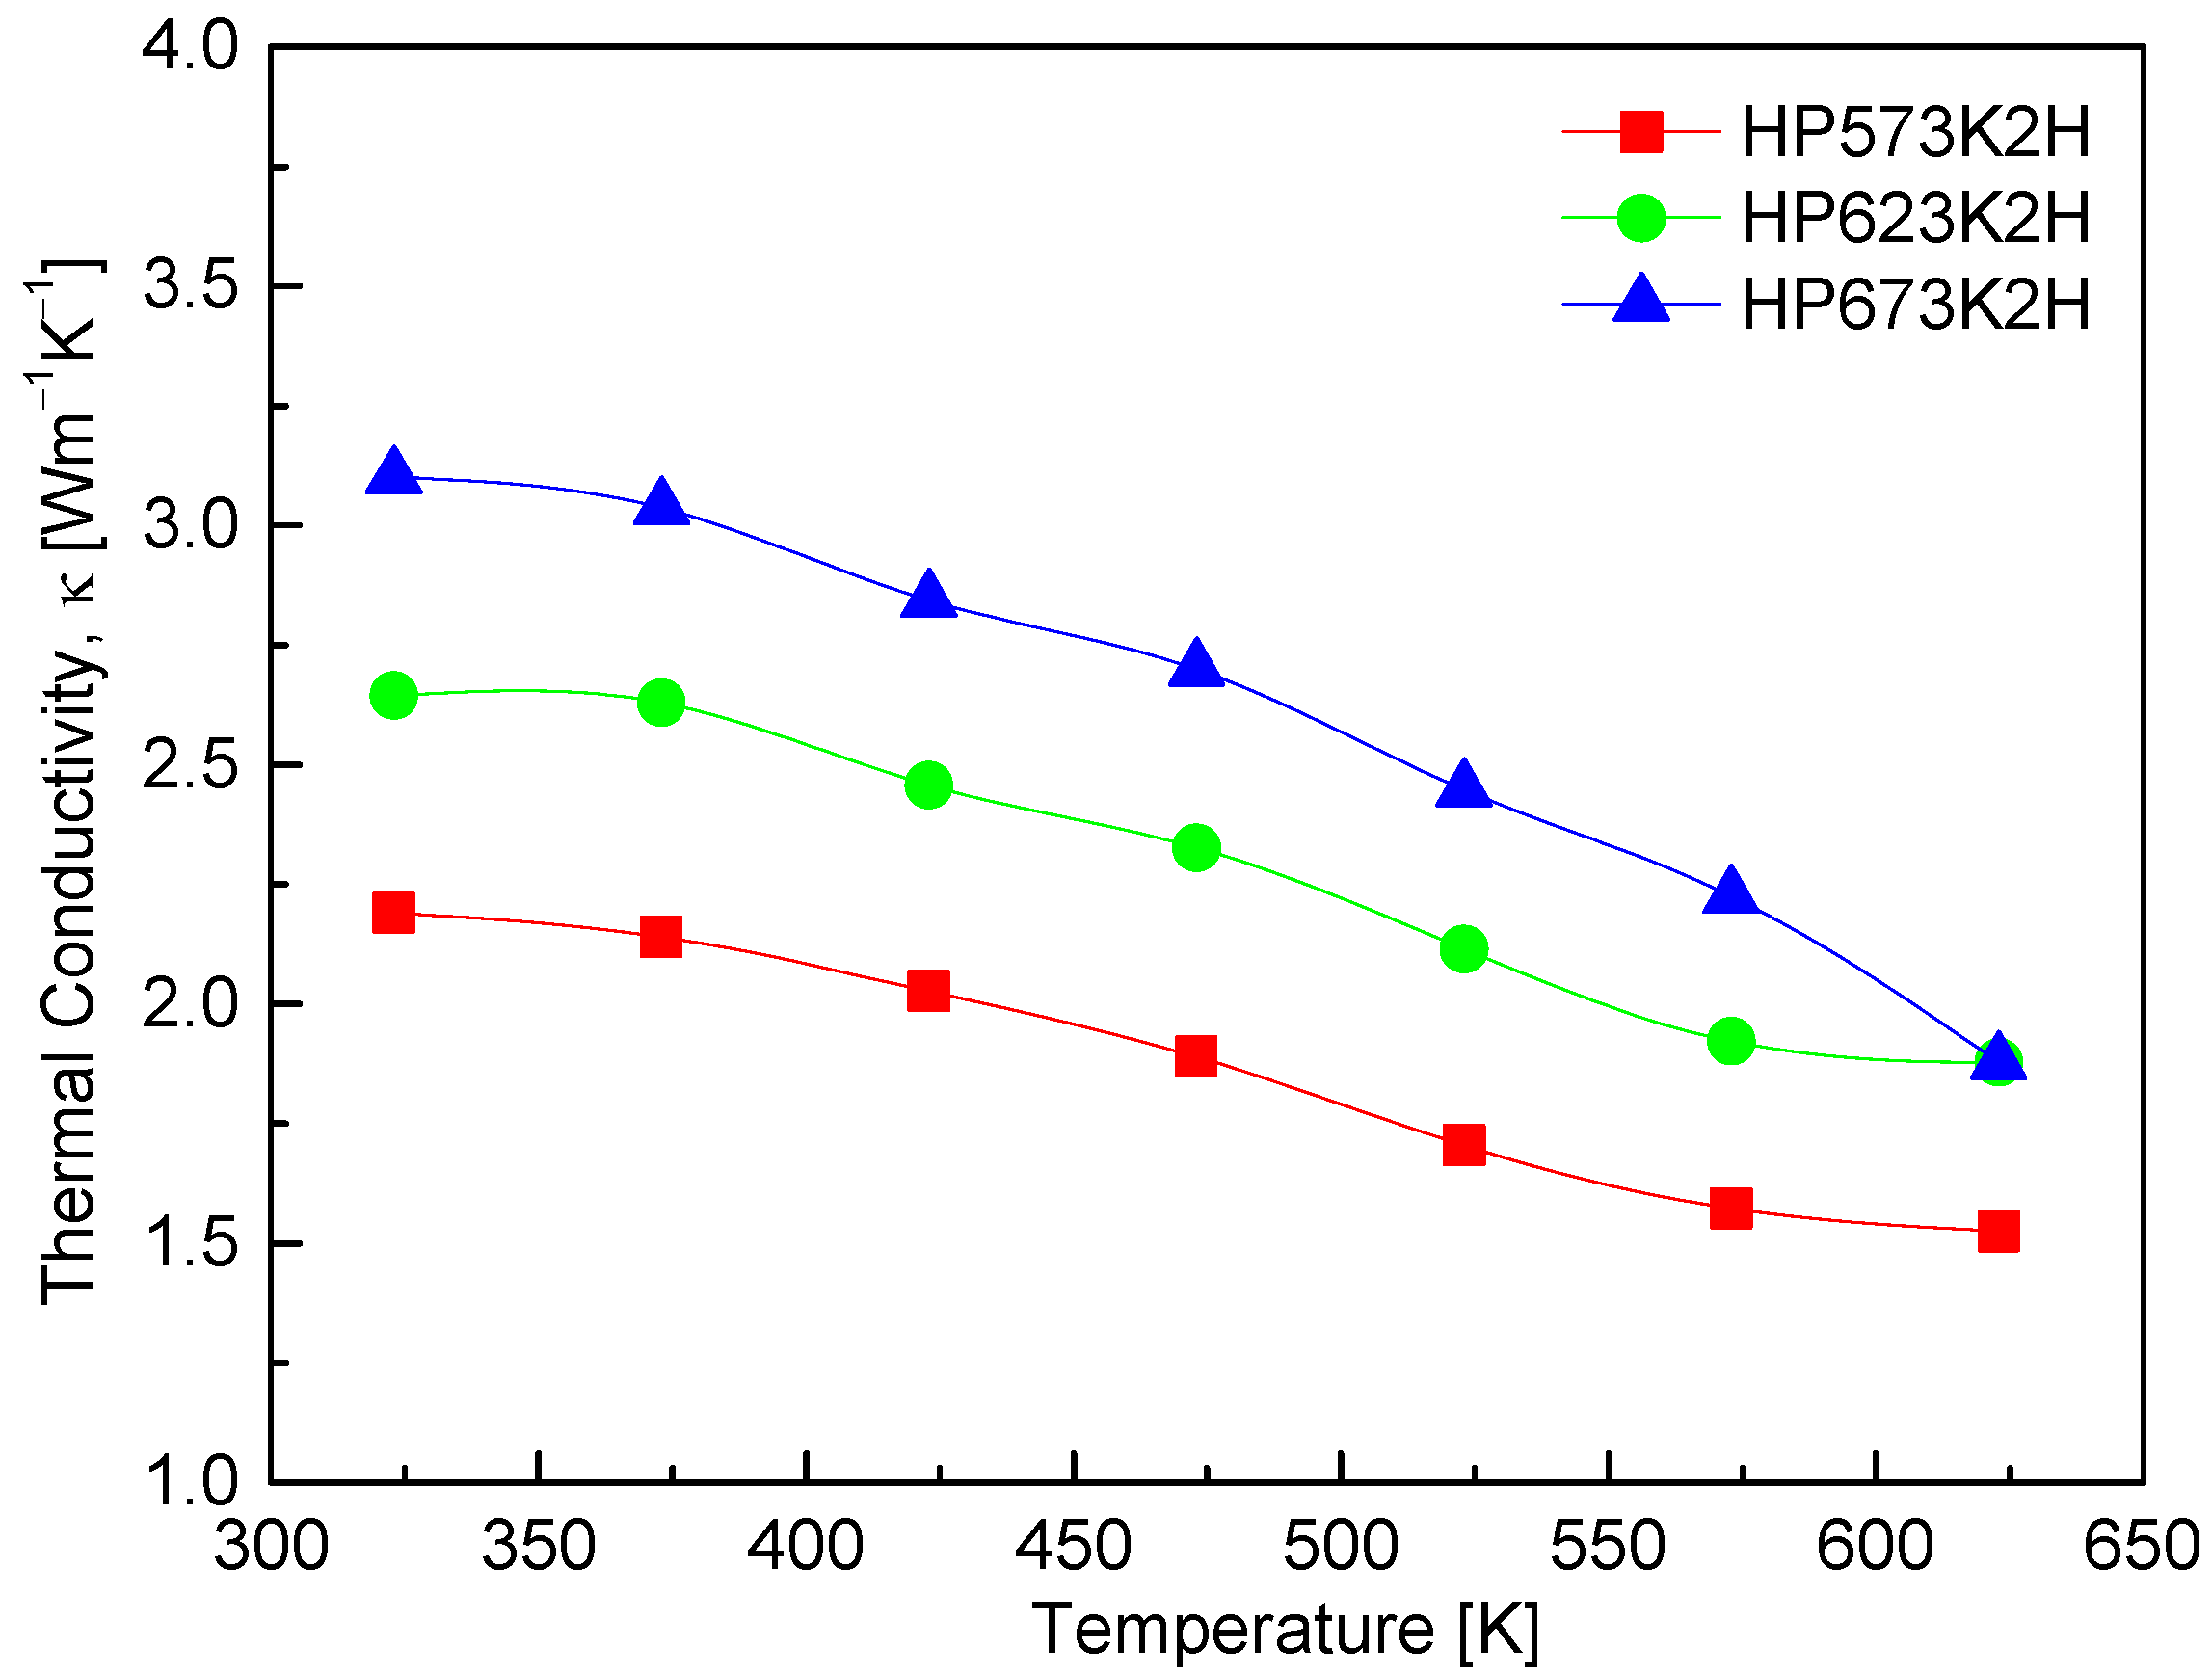
Figure 10 presents the thermal conductivity of CuFeSe
2 as a function of the temperature for samples subjected to different HP conditions. The thermal conductivity ranges from 2.19 to 3.10 Wm
−1K
−1 at 323 K and decreases to between 1.52 and 1.88 Wm
−1K
−1 at 623 K. This downward trend with increasing temperature is characteristic of many thermoelectric materials and is primarily attributed to enhanced phonon–phonon (Umklapp) scattering, which reduces the phonon mean free path at elevated temperatures. Such behavior supports the intrinsic phonon-dominated heat transport mechanism in CuFeSe
2. In addition to temperature effects, the HP temperature also influences thermal conductivity. Higher HP temperatures appear to increase the thermal conductivity across the entire temperature range. For example, the HP573K2H sample shows a reduction in thermal conductivity from 2.19 Wm
−1K
−1 at 323 K to 1.52 Wm
−1K
−1 at 623 K, while the HP673K2H sample exhibits a higher thermal conductivity across the board, decreasing from 2.65 to 1.88 Wm
−1K
−1 over the same temperature range. This increase in thermal conductivity with HP temperature likely results from improved densification and grain growth, which suppress phonon scattering at grain boundaries and increase the effective thermal conductivity. Comparison with the literature further underscores the impact of synthesis conditions on thermal transport. Moorthy et al. [
1] reported a significantly higher room-temperature thermal conductivity of 4.96 Wm
−1K
−1 for bulk CuFeSe
2, which decreased to 1.36 Wm
−1K
−1 at 645 K, reflecting a steep decline in thermal transport likely due to increased phonon scattering at higher temperatures. Zhai et al. [
14], on the other hand, reported an even broader range of 9.4 to 2.7 Wm
−1K
−1 between 323 and 723 K for their nominal CuFeSe
2 samples. These variations are attributable to differences in synthesis techniques, microstructural features, and sample stoichiometry, all of which critically influence lattice thermal conductivity. The relatively low thermal conductivity values obtained in this study—particularly in the HP573K2H sample—highlight the effectiveness of mechanical alloying followed by low-to-moderate temperature hot pressing in suppressing phonon transport.
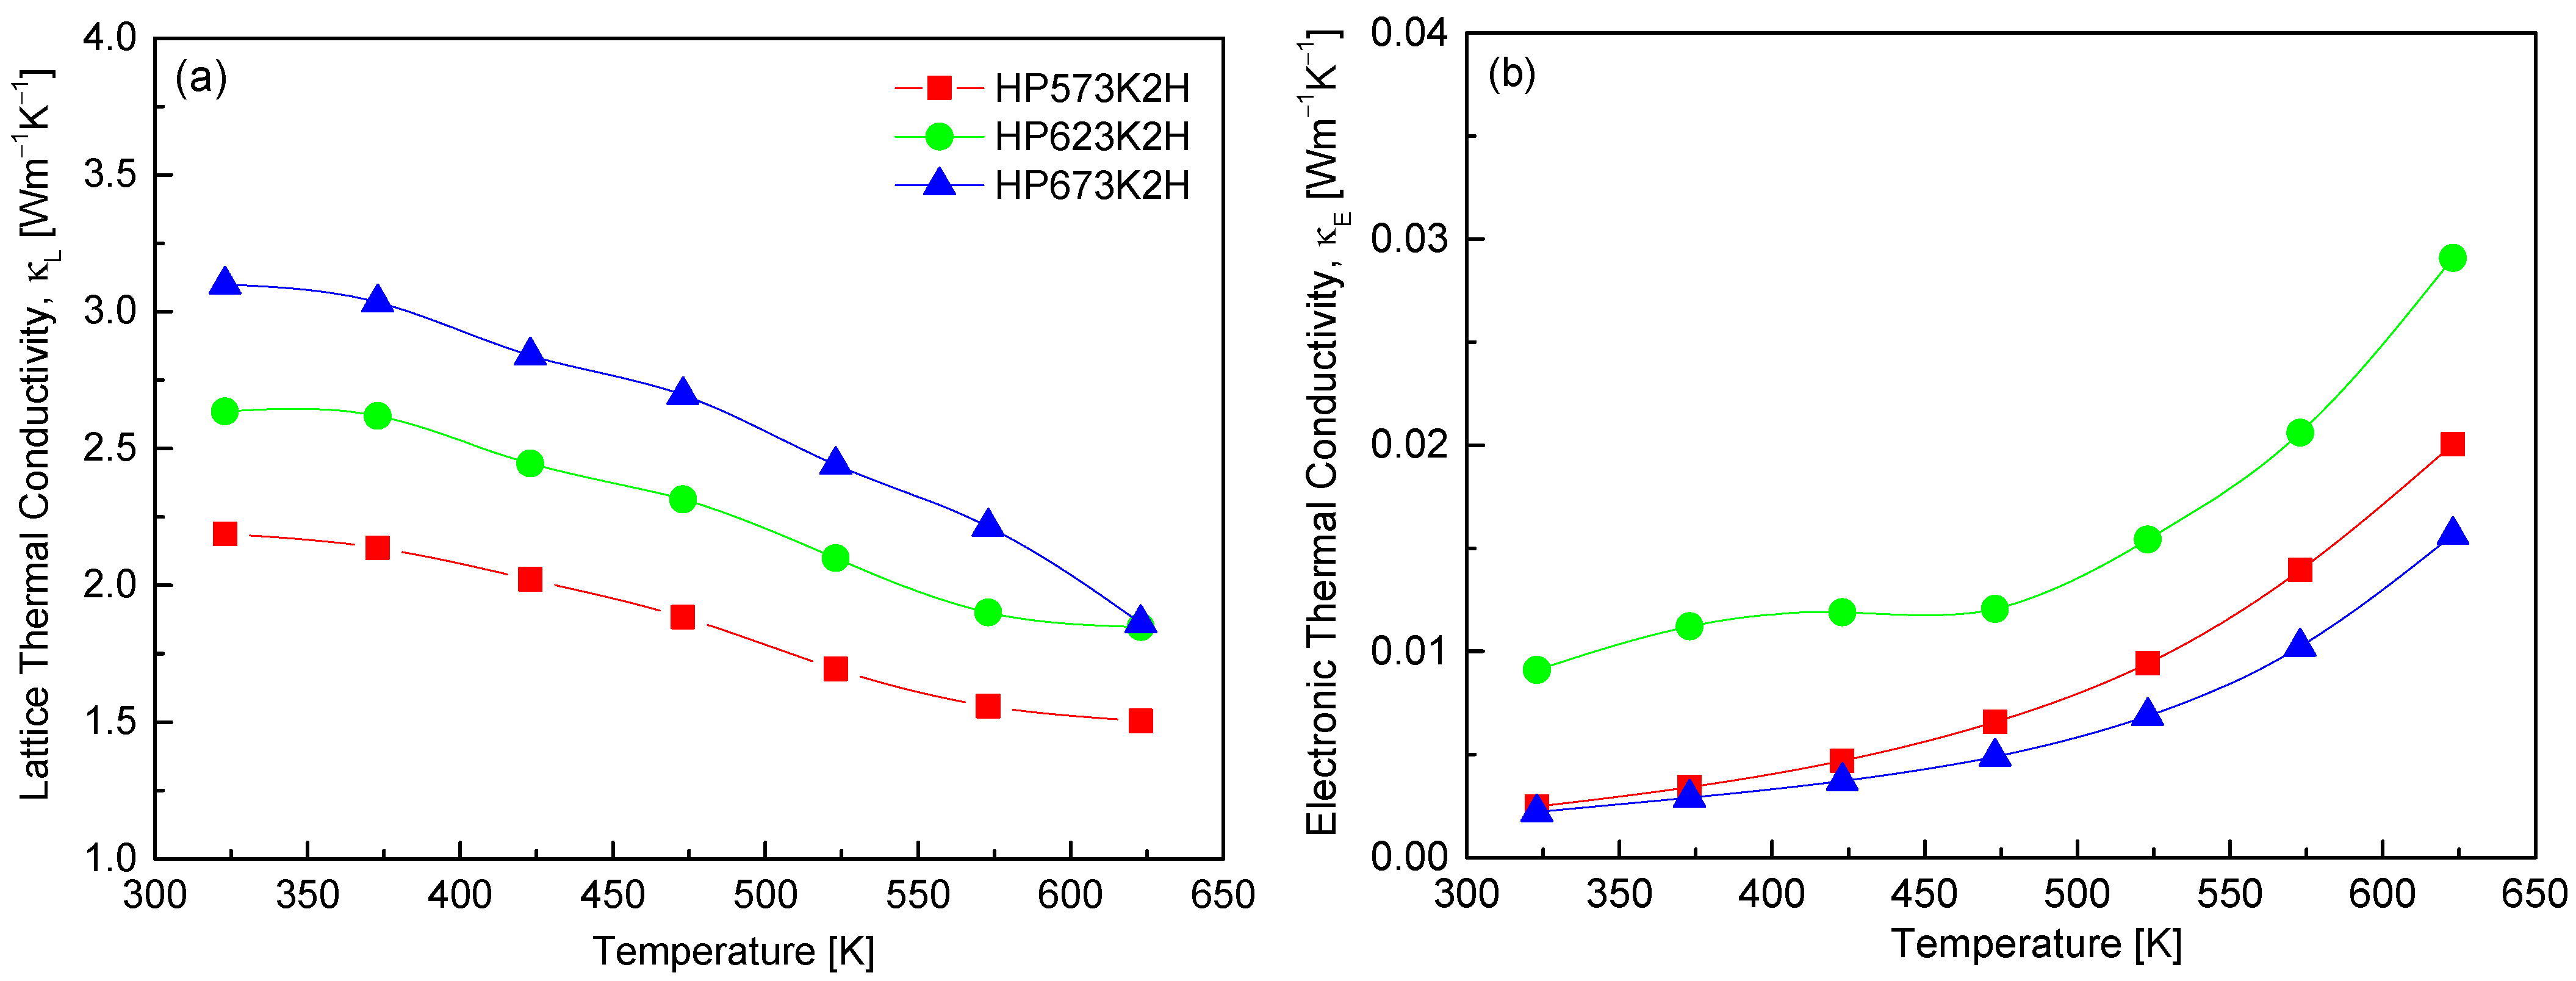
Figure 11 illustrates the separation of the total thermal conductivity into its two primary components, lattice thermal conductivity (κ
L) and electronic thermal conductivity (κ
E), for CuFeSe
2. The total thermal conductivity in thermoelectric materials is generally expressed as the sum of κ
L and κ
E, with negligible contribution from bipolar diffusion in this temperature range. In this study, κ
E was estimated using the Wiedemann–Franz law, defined as κ
E = LσT, where σ is the electrical conductivity, T is the absolute temperature, and L is the Lorenz number [
31]. The results clearly indicate that κ
E contributes minimally to thermal conductivity, owing to the intrinsically low electrical conductivity values in the measured samples. As a result, κ
L dominates the thermal transport, reinforcing the phonon-limited nature of heat conduction in CuFeSe
2. For the HP623K2H specimen, κ
L was found to decrease from 2.64 Wm
−1K
−1 at 323 K to 1.85 Wm
−1K
−1 at 623 K. This temperature-dependent decline in κ
L is typical of crystalline thermoelectric materials, where increased phonon–phonon interactions (Umklapp scattering) at elevated temperatures reduce the phonon mean free path. Comparative analysis with previous reports further supports this trend. Moorthy et al. [
1] reported a significantly higher κ
L of 4.92 Wm
−1K
−1 at 300 K, which dropped to 1.25 Wm
−1K
−1 at 645 K. Similarly, Zhai et al. [
14] observed a decrease from 7.3 Wm
−1K
−1 at 423 K to 2.5 Wm
−1K
−1 at 723 K, attributing this reduction to enhanced phonon scattering induced by intrinsic point defects and selenium vacancies.
Figure 12 presents the dimensionless figure of merit (ZT) of CuFeSe
2 as a function of the temperature. The ZT values exhibit a temperature-dependent increase, peaking in the range of 473–523 K. This trend reflects the interplay of thermoelectric transport parameters—namely, the Seebeck coefficient, electrical conductivity, and thermal conductivity—all of which vary with the temperature. The observed rise in ZT with increasing temperature can be attributed primarily to the enhancement of the Seebeck coefficient and power factor near the intrinsic transition region. Among the samples analyzed, the HP623K2H specimen exhibited the highest ZT value of 0.37 × 10
−3 at 523 K, indicating that hot pressing at 623 K provides favorable conditions for thermoelectric optimization. While this value remains relatively low compared to conventional thermoelectric materials, it shows progress in developing CuFeSe
2-based compounds. For comparison, Moorthy et al. [
1] reported an increase in ZT from 5.9 × 10
−5 at 300 K to 9.8 × 10
−4 at 645 K by employing a combination of melting, annealing, and hot pressing. Zhai et al. [
14] achieved a more substantial enhancement, with ZT reaching 7.0 × 10
−3 at 723 K, facilitated by a multistep synthesis approach involving melting, quenching, grinding, annealing, and hot pressing. Although the ZT values reported in this study are lower than those of state-of-the-art thermoelectric materials [
32,
33], CuFeSe
2 remains a promising candidate due to its narrow band gap and potential for property tuning. The current findings highlight 623 K as the optimal hot-pressing temperature, balancing electrical performance and structural integrity. Further improvements in ZT may be achieved through targeted doping strategies to enhance the carrier concentration and power factor or through solid solution formation to further reduce the lattice thermal conductivity by intensifying phonon scattering. These avenues offer a path toward optimizing CuFeSe
2 for mid-temperature thermoelectric applications.
Table 2 compares the thermoelectric parameters and performance of CuFeSe
2 reported in the literature with the data obtained in this study. Since each parameter depends on temperature, the values presented correspond to those measured at the temperatures where the highest ZT value was observed.
3. Experimental Procedure
High-purity elemental powders of copper (Cu, 99.9%, Kojundo, Japan), iron (Fe, 99.99%, Kojundo, Japan), and selenium (Se, 99.999%, Kojundo, Japan) were employed as precursors for synthesizing CuFeSe2 via a solid-state mechanical alloying (MA) approach, aimed at optimizing the synthesis parameters for enhanced phase formation and thermoelectric performance. The MA process was conducted in an argon atmosphere using a planetary ball mill (Pulverisette5, Fritsch, Pittsboro, NC, USA) equipped with stainless steel jars and balls to prevent oxidation and minimize contamination. Milling was performed at a fixed rotational speed of 350 rpm for durations ranging from 6 to 24 h, providing a systematic evaluation of alloying time on phase evolution and homogeneity. Subsequent densification of the mechanically alloyed powders was achieved through hot pressing (HP; JM-HP20, Jungmin, Seoul, Republic of Korea) at temperatures between 573 and 673 K under a uniaxial pressure of 70 MPa for 2 h in a vacuum. This step enabled the fabrication of dense, bulk samples while preserving the refined microstructure generated during MA.
Phase evolution during both the MA and HP stages was monitored using X-ray diffraction (XRD) analysis with a D8-Advance diffractometer (Bruker, Billerica, MA, USA) with Cu Kα radiation. To corroborate the thermal stability and phase transformation behavior, simultaneous thermogravimetric and differential scanning calorimetry (TG–DSC) analyses were conducted using a TC/DSC1 (Mettler Toledo, Columbus, OH, USA) instrument. The measurements were performed in an argon atmosphere with a heating rate of 5 K/min up to 973 K, enabling the detection of endothermic and exothermic events alongside weight changes associated with decomposition or phase transitions. To refine structural parameters and quantify the phase composition, Rietveld refinement was applied to the XRD data using the TOPAS software (v4.1, Bruker). The microstructural features of the sintered specimens were further characterized by scanning electron microscopy (SEM; Prisma E, Thermo Fisher Scientific, Waltham, MA, USA) in backscattered electron (BSE). Elemental distribution and compositional uniformity were assessed using energy-dispersive X-ray spectroscopy (EDS) with a Quantax200 system (Bruker), providing insights into the homogeneity of the alloyed phases.
Electrical transport measurements, including electrical conductivity and the Seebeck coefficient, were conducted simultaneously using a ZEM-3 instrument (Advance Riko, Yokohama, Japan) in a low-pressure helium atmosphere. The power factor (PF = σα2) was calculated directly from these measurements. Thermal diffusivity (D) was determined via laser flash analysis using a TC-9000H system (Advance Riko), and the total thermal conductivity (κ) was calculated using the relation κ = Dcpd, where cp is the specific heat capacity and d is the bulk density of the sample. The dimensionless figure of merit (ZT) was evaluated over the temperature range of 323 to 623 K to assess the thermoelectric efficiency of CuFeSe2 under varying synthesis conditions. This comprehensive methodology, integrating structural, thermal, and electronic characterizations, provides a robust framework for understanding the interrelationships between processing parameters, phase formation, and thermoelectric properties.


