Article

Experimental Study on Van der Waals Interactions Between Organic Groups of Quaternary Ammonium Salt Surfactants and Montmorillonite in Aqueous Solutions

1
Department of Mineral Processing Engineering, Taiyuan University of Technology, Taiyuan 030024, China
2
Geomicrobiology, Metallurgy Institute, Universidad Autonoma San Luis Potosi, Sierra Leona 550, San Luis Potosí 78210, Mexico
3
Planning and Environmental Management, University of Manchester, Arthur Lewis Building, Manchester M13 9PL, UK
4
Anhui Engineering Research Center for Coal Clean Processing and Carbon Emission Reduction, Huainan 232001, China
5
Taiyuan Shengong Technology Co., Ltd., Taiyuan 030600, China
*
Author to whom correspondence should be addressed.
Inorganics 2025, 13(4), 119; https://doi.org/10.3390/inorganics13040119
Submission received: 27 February 2025 / Revised: 2 April 2025 / Accepted: 6 April 2025 / Published: 8 April 2025

Abstract

:
Obtaining the dielectric constant and refractive index of the siloxane surface of montmorillonite (Mnt) and organic groups is difficult, limiting the study of Van der Waals (VDW) interactions between the hydrophilic end of quaternary ammonium surfactants (QASs) and Mnt. In this study, the average adsorption distance, VDW adsorption energy, and VDW constant of QASs and their groups adsorbed on the montmorillonite surface are obtained by microcalorimeter. Herein, the VDW interactions between five QASs and a Mnt surface are compared. Interactions between QASs with different hydrophilic ends and Mnt in aqueous solution were positively correlated with the dipole moment of the hydrophilic end groups, and the VDW interaction energies differed depending on the superposition of CH2 adsorption at the hydrophobic ends. The electrostatic and VDW adsorption capacities were studied through zeta potential and adsorption capacity experiments. Physical adsorption was determined using Fourier-transform infrared spectroscopy, and the hydrophobic floc morphology was characterized using environmental scanning electron microscopy. Focused beam reflectance measurements, thermogravimetric-differential scanning calorimetry, and light transmittance were used to quantitatively analyze the hydrophobic effect of the QASs.

Graphical Abstract

1. Introduction

Montmorillonite (Mnt)–organic nanocomposites are important in materials science [1]. Clay polymer nanocomposites (CPNs) have incomparable advantages over conventional inorganic filler polymer composites (such as excellent mechanical, thermal, and gas barrier properties) [2]. Surfactants and polymers can change the surface characteristics of Mnt particles and the colloidal dispersion behavior of Mnt. Adding a small number of Mnt nanoparticles into the polymer can enhance its performance [3]. The development of CPNs has attracted much attention [4,5,6,7,8,9]. The organic derivatives formed include sorbents for pollution prevention and control [10], three-dimensional mesh Mnt/salicylic acid composite phase-transition materials directly transformed by solar energy and stored [11], Mnt–nylon nanocomposites used as engineering or structural materials for automotive parts, Mnt–epoxy polymers or epoxy resins as adhesives and structural materials [12], and Mnt–chitosan nanocomposites for the fabrication of biopotential sensor electrodes [9,12]. Previous studies have investigated the interactions between organics and Mnt. In aqueous solution, many organic macromolecules are not directly embedded in Mnt but are introduced through the gradual expansion of the interlayer space (propping-opening process) [1]. A Ca-Mnt ethanol intercalation complex can be used to prepare n-butanol and n-alcohol intercalation. The solid–solid reaction between 2,2-bipyridine and Mnt produces metal–(2,2′-bipyridine) complexes in interlayer spaces [13]; benzene vapors react with copper(II)–Mnt and lithium saponite to replace part of the hydrated water [14]. The π-electrons of benzene interact with copper ions to produce red benzene complexes via single-electron transfer from benzene to interlayer cations [15].
Simple cation exchange via quaternary ammonium surfactants (QASs) for the surface modification of Mnt can make CPNs more versatile and cost-effective [16]. The hydrophobic ends of QASs are mostly long-chain saturated alkanes (-CH2-); therefore, the Van der Waals (VDW) interaction between the hydrophilic end of QASs and Mnt is very important in organic clay science.
VDW forces between substances are dipole–dipole interactions, which can be classified into three types: orientation interaction; induced interaction; dispersion interaction [17]. For VDW forces between interfaces, there are Hamaker-derived general equations for unblocked VDW interactions that apply at all distances [18]. For the many-body effect in media, Lifshitz derived the Hamaker constant for VDW forces between media (in aqueous solution), avoiding the non-summation of VDW forces in the media. However, it is difficult to obtain the related parameters such as the dielectric constant and refractive index of the Mnt and QASs hydrophilic end; thus, the Lifshitz theory is not suitable for studying the VDW interactions between the hydrophilic end of QASs and Mnt in aqueous solutions. Thus, a reliable method for experimentally quantifying the VDW interactions between QASs and Mnt in aqueous solution remains lacking.
In this study, five representative QASs—Dodecyltrimethylammonium chloride (DTAC), Cetyltrimethylammonium chloride (CTAC), Stearyltrimethylammonium chloride (STAC), Hexadecylbenzyldimethylammonium chloride (HDBAC), and Cetylpyridinium chloride (CPC)—were selected to systematically evaluate the VDW interactions with Mnt [19]. DTAC, CTAC, and STAC share the same trimethylammonium head group but differ in alkyl chain length (C12, C16, and C18, respectively), allowing investigation of the effect of hydrophobic chain length on VDW interaction. HDBAC and CPC, on the other hand, have the same hydrophobic alkyl tail (C16) as CTAC, but possess different hydrophilic end groups: benzyl and pyridinium, respectively. This design enables a direct comparison of how the dipole nature and structure of hydrophilic groups influence VDW interactions. The combination of structural variation in both the hydrophilic and hydrophobic segments provides a rational framework for analyzing the influence of molecular dipole moments, chain structure, and functional group chemistry on surfactant–clay interfacial behavior.
Moreover, the selection of these five surfactants was also dictated by the requirement to solve a set of equations (Equations (6)–(10)) used to calculate the Van der Waals interaction energies contributed by different functional groups (e.g., –CH2–, –CH3, and various polar head groups). Since the model involves five unknowns, the use of five QASs with distinct structural features ensured that the system of equations was mathematically solvable and experimentally meaningful.
In the experiment, Fourier-transform infrared (FTIR) spectroscopy was used to determine whether the surfactant was physically adsorbed onto the surface of Mnt. Thereafter, the effect of the surfactant on the hydrophobic floc of Mnt was qualitatively analyzed by Environmental Scanning Electron Microscope (ESEM, FEI QUANTA 200, FEI Company, Hillsboro, OR, USA) under semi-dry conditions. The desorption behavior of water on the surface of modified Mnt and the hydrophobicity of the surface of Mnt were studied using thermogravimetric–differential scanning calorimetry (TG-DSC). The effect of the surfactant on the hydrophobic floc of Mnt was quantitatively compared using Focused Beam Reflectance Measurement (FBRM) and transmittance analyses after sedimentation. The hydrophobic modification of Mnt by surfactants was quantitatively compared with the light transmission rate of the supernatant after sedimentation. The hydration energy of the hydrophobically modified Mnt was obtained using trace heat (C80) mixed in situ, and the VDW effect between the QAS hydrophilic end and Mnt was compared at a macro level. Finally, the interaction between surfactants and Mnt was analyzed through adsorption capacity, C80, and zeta potential (Zetasizer Nano, Malvern Instruments Ltd., Malvern, UK); the adsorption energy, electrostatic adsorption energy, and electrostatic adsorption capacity caused by electrostatic effects were obtained in addition to the VDW adsorption capacity caused by VDW interactions. The VDW interaction energy and interaction constant between QASs and Mnt, QASs hydrophilic end and Mnt, and QASs hydrophobic end and Mnt in aqueous solution, as well as the average adsorption distance between QASs and Mnt were analyzed to determine the effect of the QAS dipole on the QASs–Mnt interaction. This study introduces a novel, integrated method for evaluating weak dipole-dependent interactions in complex aqueous interfaces, and provides a framework for tuning surface interactions in the design of functional clay-based materials. Unlike previous studies that primarily relied on molecular dynamics simulations to estimate Van der Waals interactions between montmorillonite and quaternary ammonium surfactants, this work is the first to experimentally quantify these interactions, offering new insights into the physicochemical basis of organic–inorganic interfacial behavior.

2. Results and Discussion

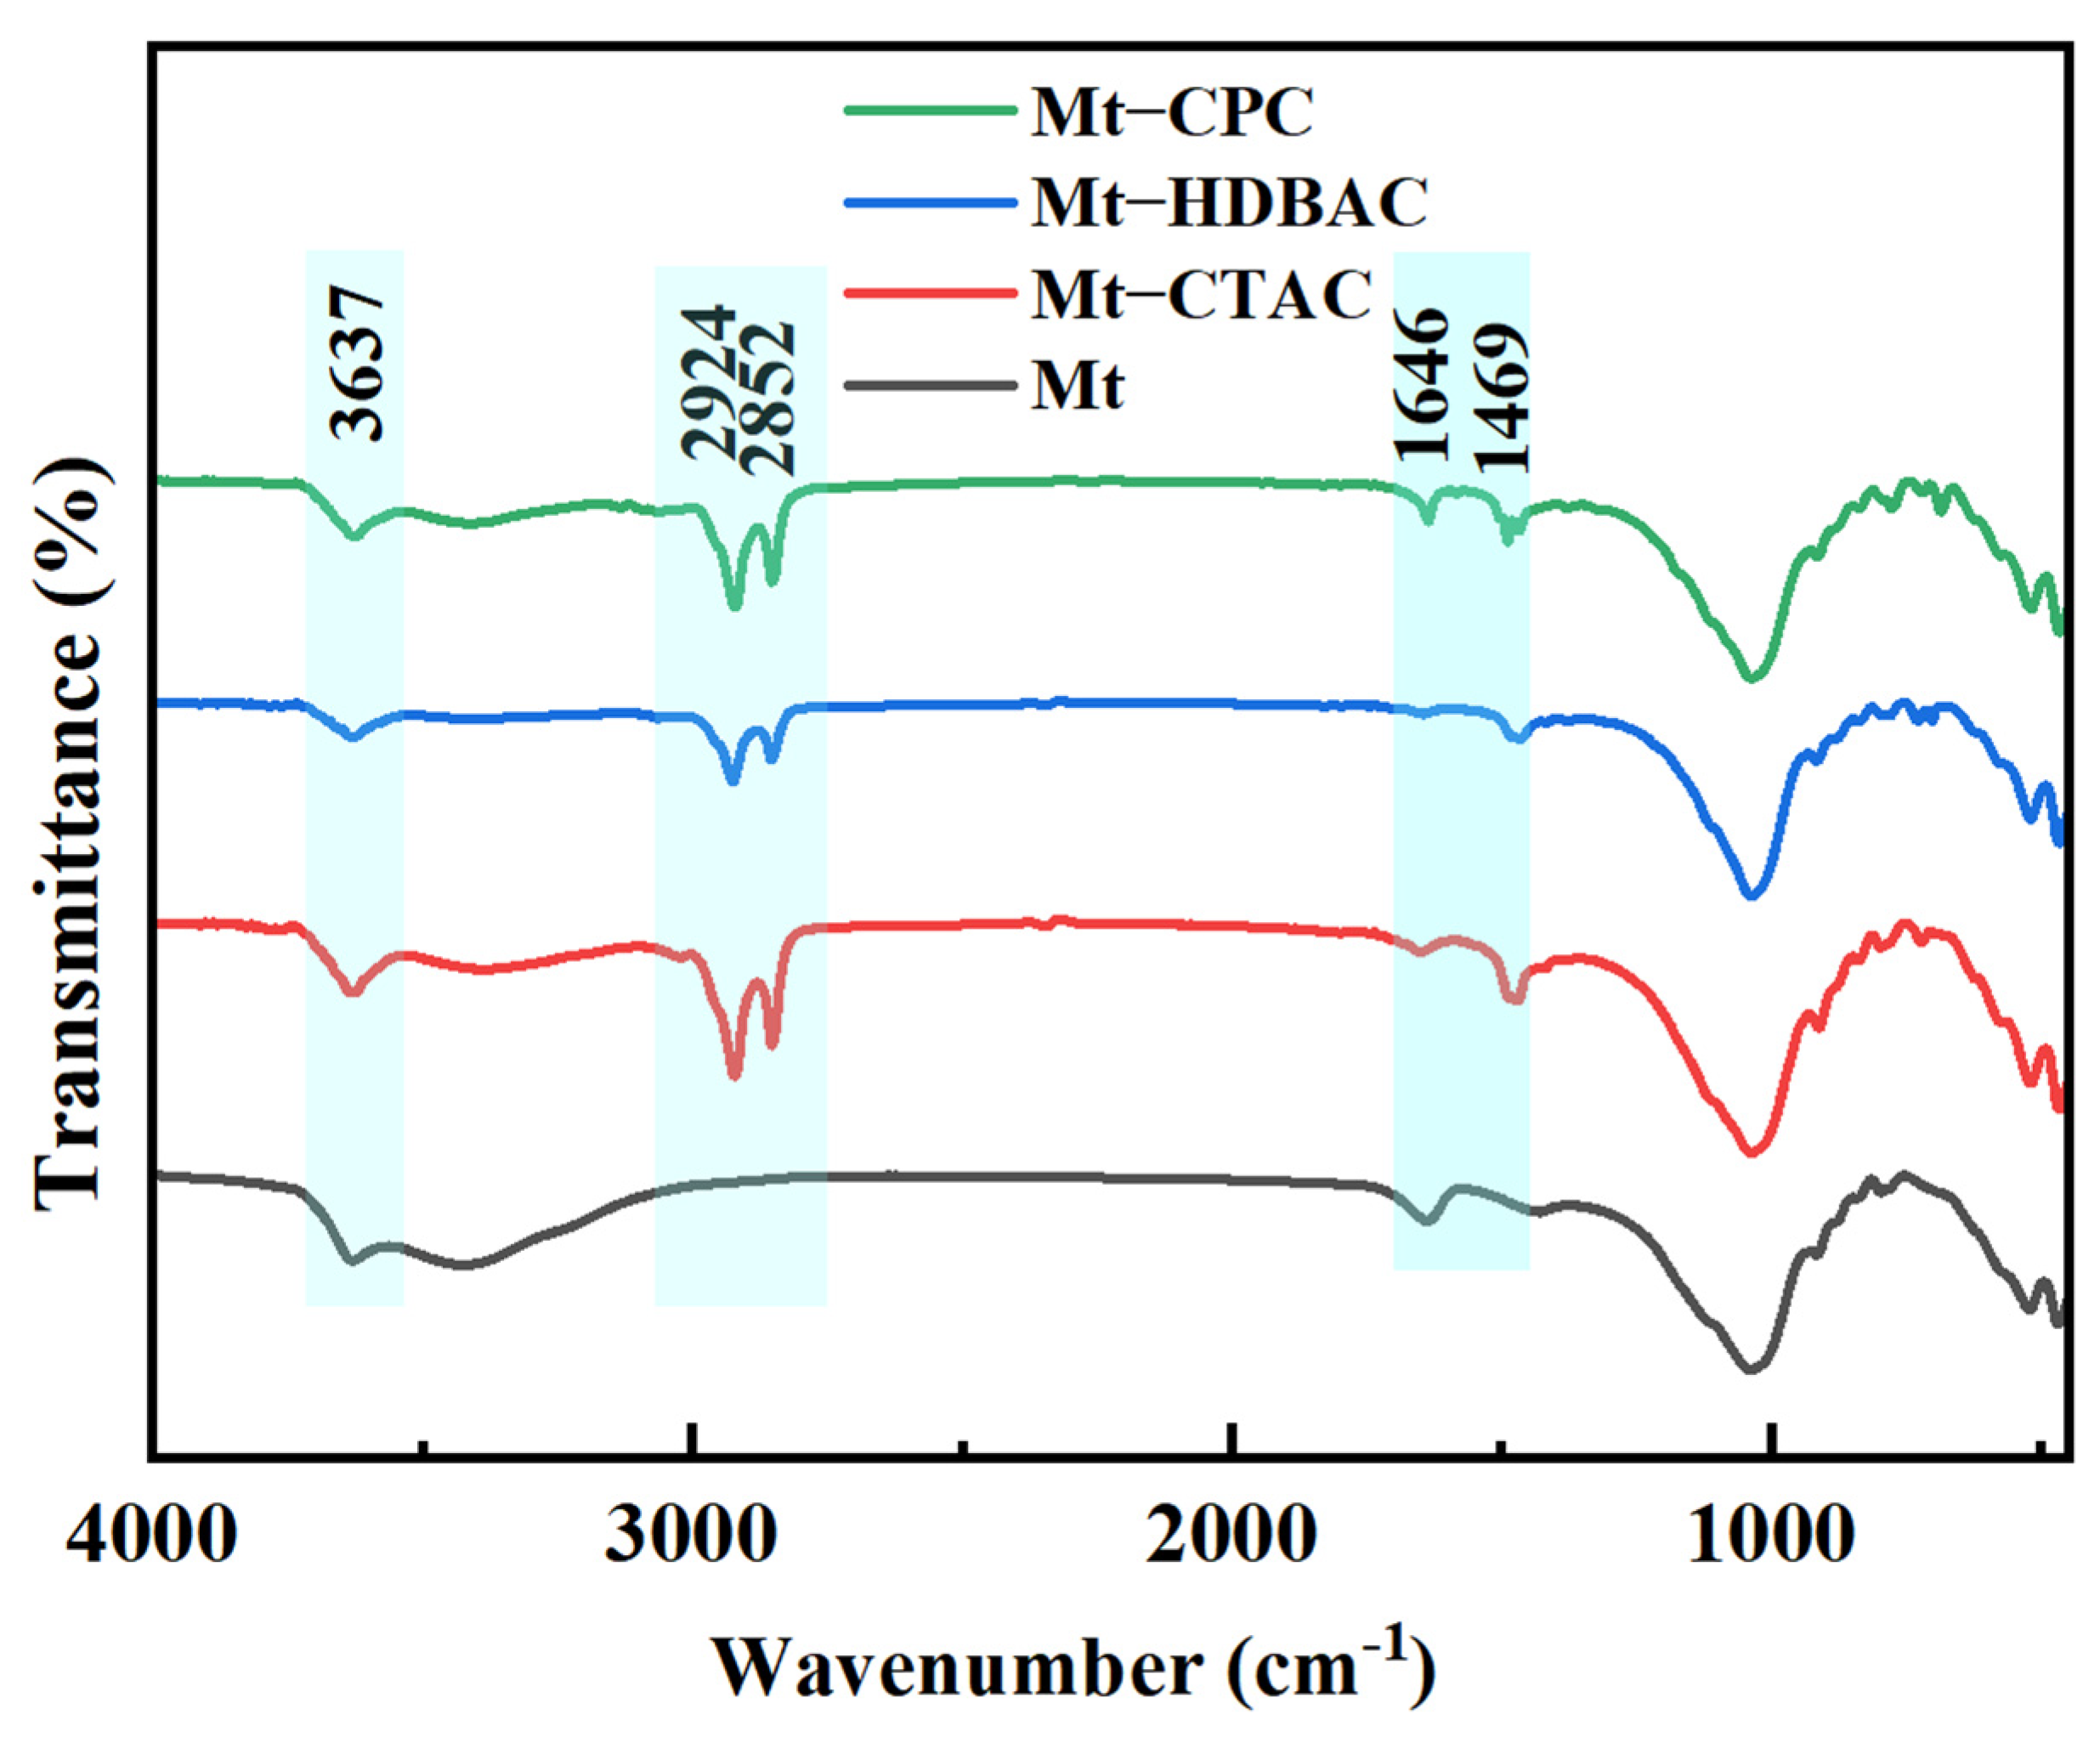
2.1. Physical and Chemical Adsorption Analysis

The purpose of IR spectral analysis is to determine whether CTAC, HDBAC, and CPC are physically adsorbed on the surface of Mnt [20]. The FTIR spectra of the modified Mnt and surfactant are shown in Figure 1. In the Mnt samples without QAS treatment, the hydroxyl stretching vibration for crystallized water in Mnt appeared at 3637 cm−1, while the bending vibrations of hydroxyl, Al-Al-OH, and Al-Mg-OH of crystallized water appeared at 1646 cm−1 [21]. There was no vibration peak at 2924–2852 cm−1 and 1469 cm−1, and after QASs treatment, the absorption peaks of the alkyl, benzyl, and pyridine organic groups appeared in Mnt-CTAC, Mnt-HDBAC, and Mnt-CPC samples, respectively, indicating that the hydrophobic surfactants were adsorbed onto the surface of Mnt. The modified Mnt did not give rise to IR peaks other than those belonging to Mnt and the corresponding surfactants, confirming that the interaction between the alkyl, benzyl, and pyridine groups of the hydrophilic ends of CTAC, HDBAC, CPC, and Mnt is physical adsorption.

2.2. Hydrophobic Floc Effect and Dipole Interaction

Figure 2 shows the ESEM images of Mnt before and after CTAC, HDBAC, and CPC modification in the semi-dry state. The morphology of the semi-dry state helps determine the hydrophobic floc effect of Mnt [22], which can be used to qualitatively estimate the dispersion state of Mnt in an aqueous solution after the adsorption of QASs. From the suspension state to the semi-dry state, the Mnt particles shown in Figure 2a undergo dry shrinkage and bond together, and no large flocs appear. Therefore, it can be inferred that Mnt was dispersed in the aqueous solution, and no flocs were generated. Figure 2b–d show that from the suspension state to the semi-dry state, the modified Mnt is composed of large, loosely arranged particles with a rough surface, which do not bond together. It is thus inferred that the modified Mnt forms flocs in aqueous solution. Therefore, the addition of QASs made the Mnt hydrophobic and formed hydrophobic flocs in water.
Furthermore, TG-DSC tests were conducted on the montmorillonite samples before and after hydrophobic modification to investigate the desorption behavior of surface-adsorbed water during drying, as well as to evaluate the hydrophobic effect on the Mnt surface. Figure 2 shows the TG-DSC results of Mnt in the semi-dry to dry state before and after the hydrophobic modification. Table 1 shows the changes in mass and heat values before and after Mnt modification. Figure 3a shows the TG curve of Mnt after weight loss when the temperature was maintained at 60 °C for 1 h. As shown in Figure 3a and Table 1, the surface water content of the hydrophobically modified Mnt was less than that of the unmodified sample. These findings highlight the presence of a strong dipole–dipole interaction between the hydrophilic moieties of the QASs and the surface of Mnt. This modification makes the surface of the aluminosilicate layer more hydrophobic and reduces the water content of the Mnt [23]. The hydrophobic effect of QASs decreases in the following order: CPC > HDBAC > CTAC, suggesting that Inorganics 13 00119 i001-Mnt interaction > Inorganics 13 00119 i002-Mnt interaction > Inorganics 13 00119 i003-Mnt interaction.
Figure 3b shows the DSC curve of the Mnt heat value change at 60 °C for 1 h. As shown in the figure, the Mnt without QAS modification only has an endothermic peak with a large change in heat, and the endothermic peak is attributed to the loss of free water. Within 0–10 min, the QAS-modified Mnt first appeared as an endothermic peak; at 10–20 min, a large exothermic peak appeared. While the exothermic peak is attributed to the loss of free water, the reagent molecular chain and floc structure follow the principle of lowest energy, structural rearrangement occurs, structural entropy decreases, and an exotherm is generated. Combined with the results in Table 1, the order of the change in heat value caused by the molecular desorption of the Mnt modified by the surfactant is Mnt-CPC < Mnt-HDBAC < Mnt-CTAC. The results showed that the hydrophobic effect of the surfactants on Mnt decreased in the order CPC > HDBAC > CTAC, which also suggested that Inorganics 13 00119 i001-Mnt interaction > Inorganics 13 00119 i002-Mnt interaction > Inorganics 13 00119 i003-Mnt interaction.
To further compare the hydrophobic floc effect, the hydrophobic floc size of Mnt was investigated using FBRM. Figure 4 shows the particle size distribution of the Mnt samples at a surfactant concentration of 0.045 mol/L. The results show that the particle size of the unmodified Mnt is mostly in the range of 0–20 μm, while that of the modified Mnt hydrophobic floc was significantly increased, mostly in the range of 50–100 μm. After the adsorption of surfactants, a hydrophobic attraction is established between the Mnt interfaces [24], which overcomes hydration and electrostatic repulsion and leads to the formation of hydrophobic flocs [25]. The energy of the flocs increased along with the particle size and binding energy [22].
W D = A 6 2 R 1 R 2 2 R 1 + 2 R 2 + D D + 2 R 1 R 2 2 R 1 + D 2 R 2 + D + ln 2 R 1 + 2 R 2 + D D 2 R 1 + D 2 R 2 + D
R1 and R2 represent the particle radii, and D denotes the interparticle distance. The VDW adhesion energy (Ead) and VDW force (Fad) increase linearly with increasing particle radius R, Ead ∝ R [17]. The size of the formed flocs decreased in the order Mnt-CPC > Mnt-HDBAC > Mnt-CTAC, indicating that the hydrophobic energy trend was Mnt-CPC > Mnt-HDBAC > Mnt-CTAC and Inorganics 13 00119 i001-Mnt interaction > Inorganics 13 00119 i002-Mnt interaction > Inorganics 13 00119 i003-Mnt interaction.
The strength of the hydrophobic floc effect of QASs on the Mnt particles was macroscopically compared using the supernatant transmittance of the suspension after settling. Figure 5 shows the light transmission through the supernatants of Mnt suspensions treated with three surfactants at different concentrations. The results show that with an increase in reagent concentration, the adsorption capacity of the reagent increased along with the transmittance, and the dispersibility decreased. In aqueous solution, the Mnt and hydrophilic end of the reagent are attracted to each other, and the hydrophobic end points outward, which reduces the hydrophilic surface area of Mnt. The particles are more likely to form flocs and settle under the effect of hydrophobic attraction [26]. With an increase in the QAS concentration, the adsorption capacity of the particles increases, leading to an enhancement of the hydrophobicity on the particle surface and an improvement in the settling. The hydrophobic effect of the QASs was CPC > HDBAC > CTAC. The FTIR spectra confirmed that the interaction between the organic groups and Mnt was physical adsorption, suggesting that the group dipole had a significant influence on the adsorption effect. The interaction between the hydrophilic end Inorganics 13 00119 i001 of CPC, hydrophilic end Inorganics 13 00119 i002 of HDBAC, hydrophilic end Inorganics 13 00119 i003 of CTAC, and Mnt are the orientation dipole–induced dipole interactions and the instantaneous dipole–instantaneous dipole interaction under the effect of orientation dipole, Inorganics 13 00119 i001-Mnt interaction > Inorganics 13 00119 i002-Mnt interaction > Inorganics 13 00119 i003-Mnt interaction.

2.3. Dipole Interaction and Discussion

2.3.1. Adsorption Capacity Characterization of the Effect of Dipoles on the Adsorption of QASs

Figure 6 shows the standard operating curves of DTAC, CTAC, STAC, HDBAC, and CPC obtained in the experiment. DTAC and STAC were added to analyze the interactions between the hydrophobic end of the QASs and Mnt. It can be seen from Figure 6 that the absorbance value has good linearity with respect to the mass concentration curves of the QASs, indicating that it is feasible to measure the mass concentration of QASs by using the different absorbances of the association formed by the reaction of BTB with QASs at 576 nm.
The effect of the dipole value on the adsorption of QASs was characterized by the adsorption capacity. Table 2 shows the adsorption capacity of the five QASs with the same number of moles on the surface of Mnt particles. QASs are cationic surfactants that can adsorb on the surface of negatively charged Mnt particles. Therefore, the adsorption of QASs on the Mnt surface can be divided into electrostatic adsorption capacity and VDW adsorption capacity, which are discussed further.
Table 2 shows the electrostatic adsorption capacity caused by five QAS electrostatic effects and the VDW adsorption capacity caused by VDW interaction, which is calculated by the correlation between reagent adsorption capacity and zeta potential.
Electrostatic adsorption capacity caused by electrostatic effect in mmol/g:
n = ψ M n t   B l u k ψ M n t   B l u k + ψ M n t   B l u k × A d s
VDW adsorption capacity owing to VDW interactions in mmol/g:
n = ψ M n t   t r e a t e d ψ M n t   t r e a t e d + ψ M n t   B l u k × A d s
where A d s is the reagent adsorption capacity in mmol/g.
To assess structural effects on adsorption, DTAC, CTAC, and STAC—featuring identical hydrophilic heads—were compared. As molecular volume increases, electrostatic adsorption decreases due to steric hindrance at the interface, while VDW adsorption increases with chain length, reflecting greater –CH2– contributions (Table 2).
For CTAC, HDBAC, and CPC, which share the same hydrophobic end, VDW adsorption also rises with molecular size (Table 2), indicating stronger surface interactions and larger QAS dipoles.

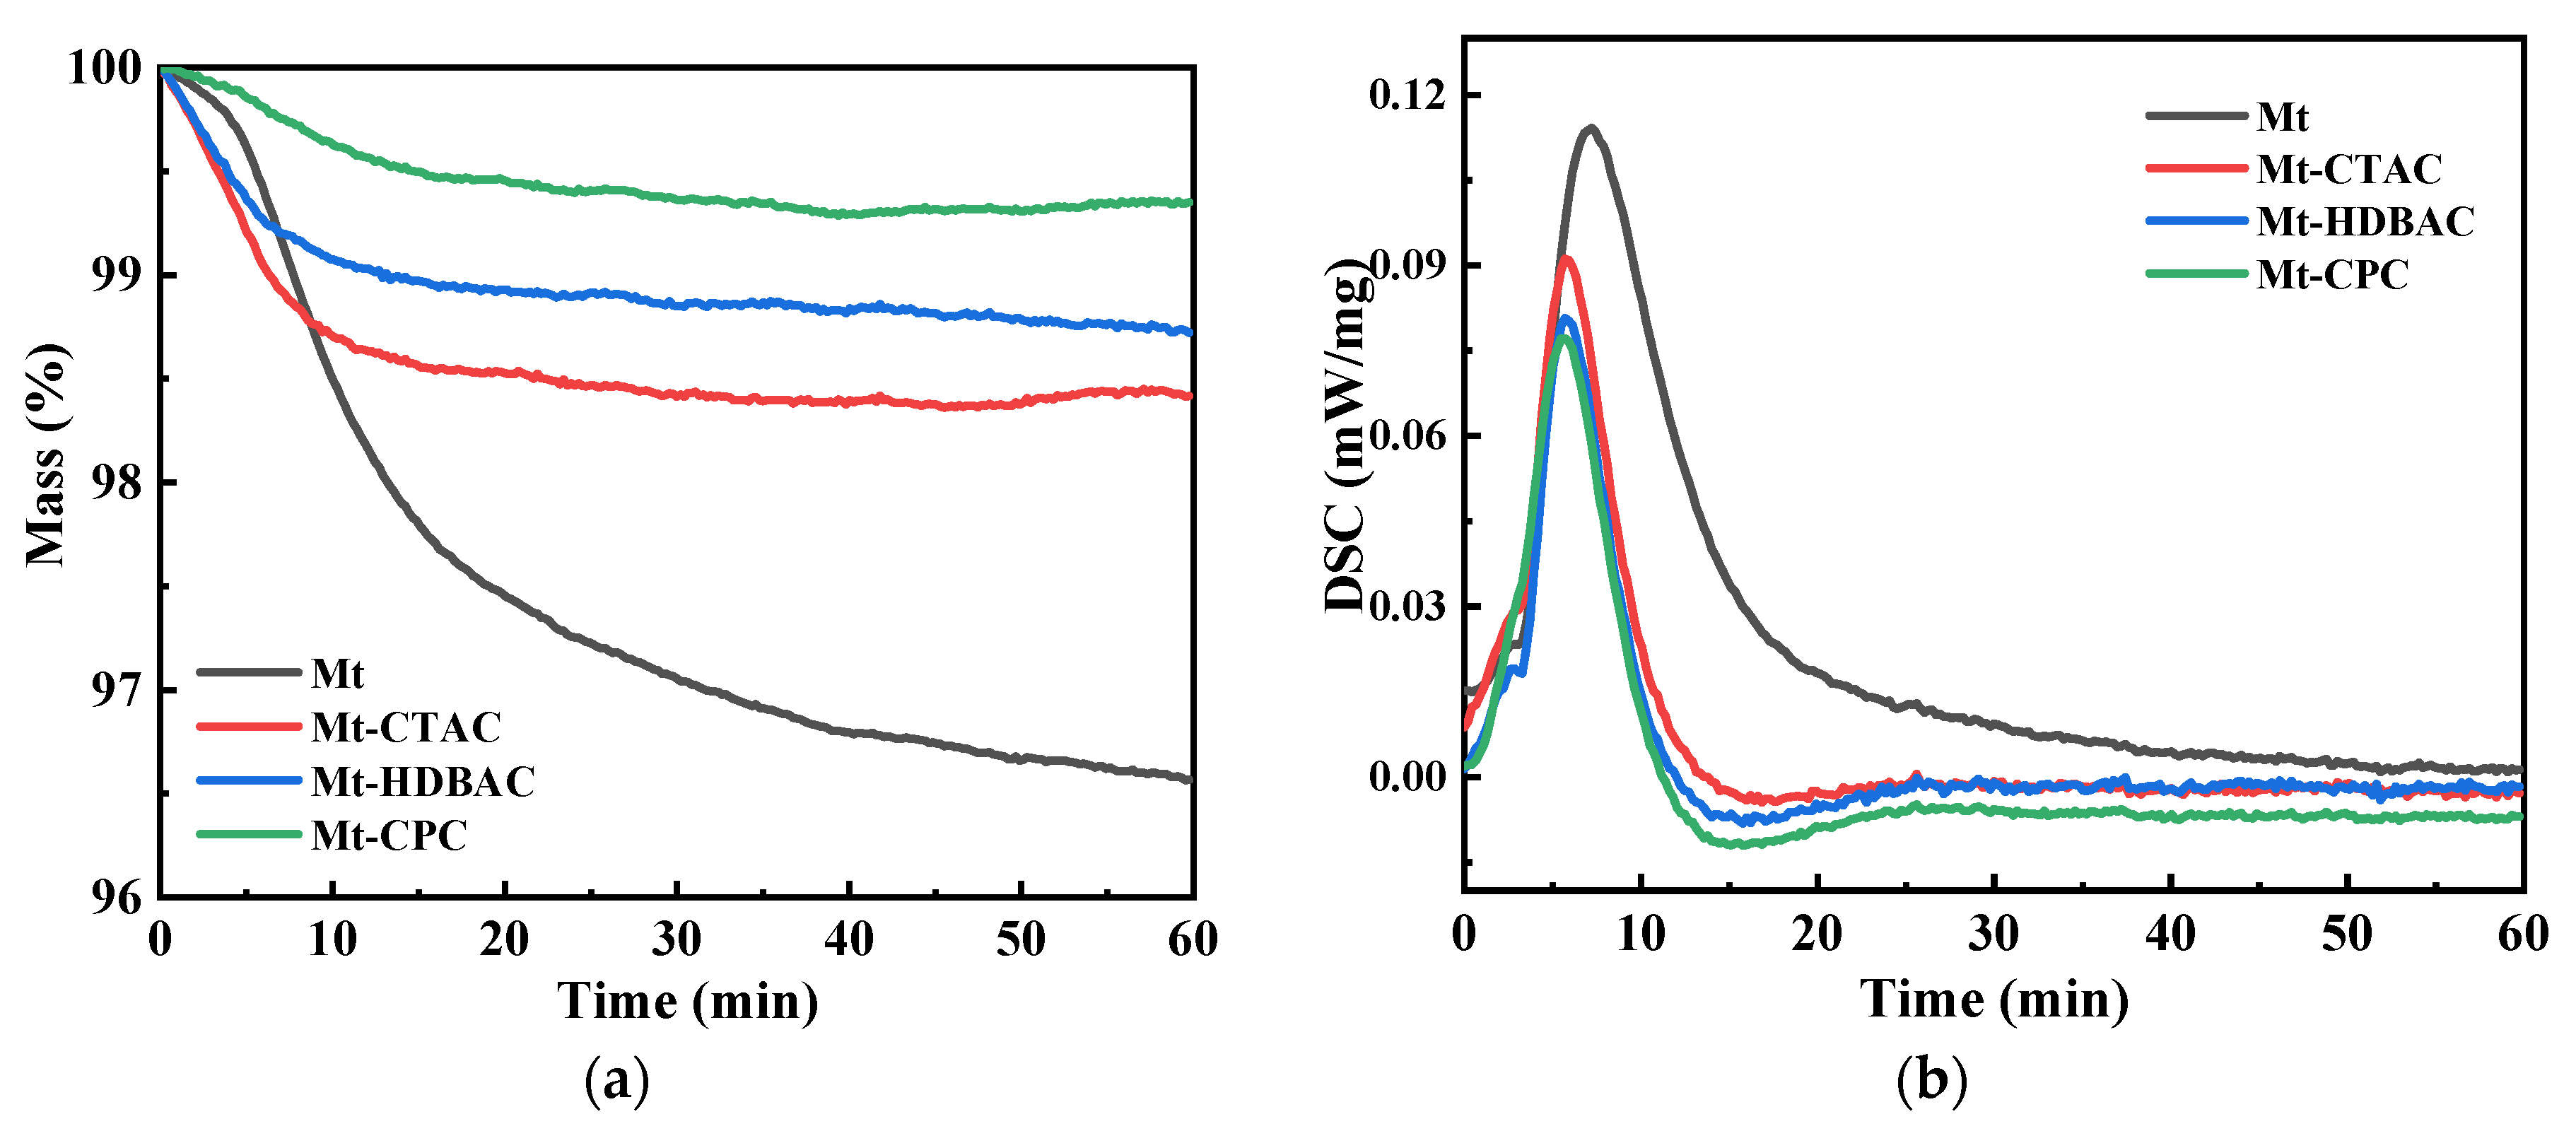
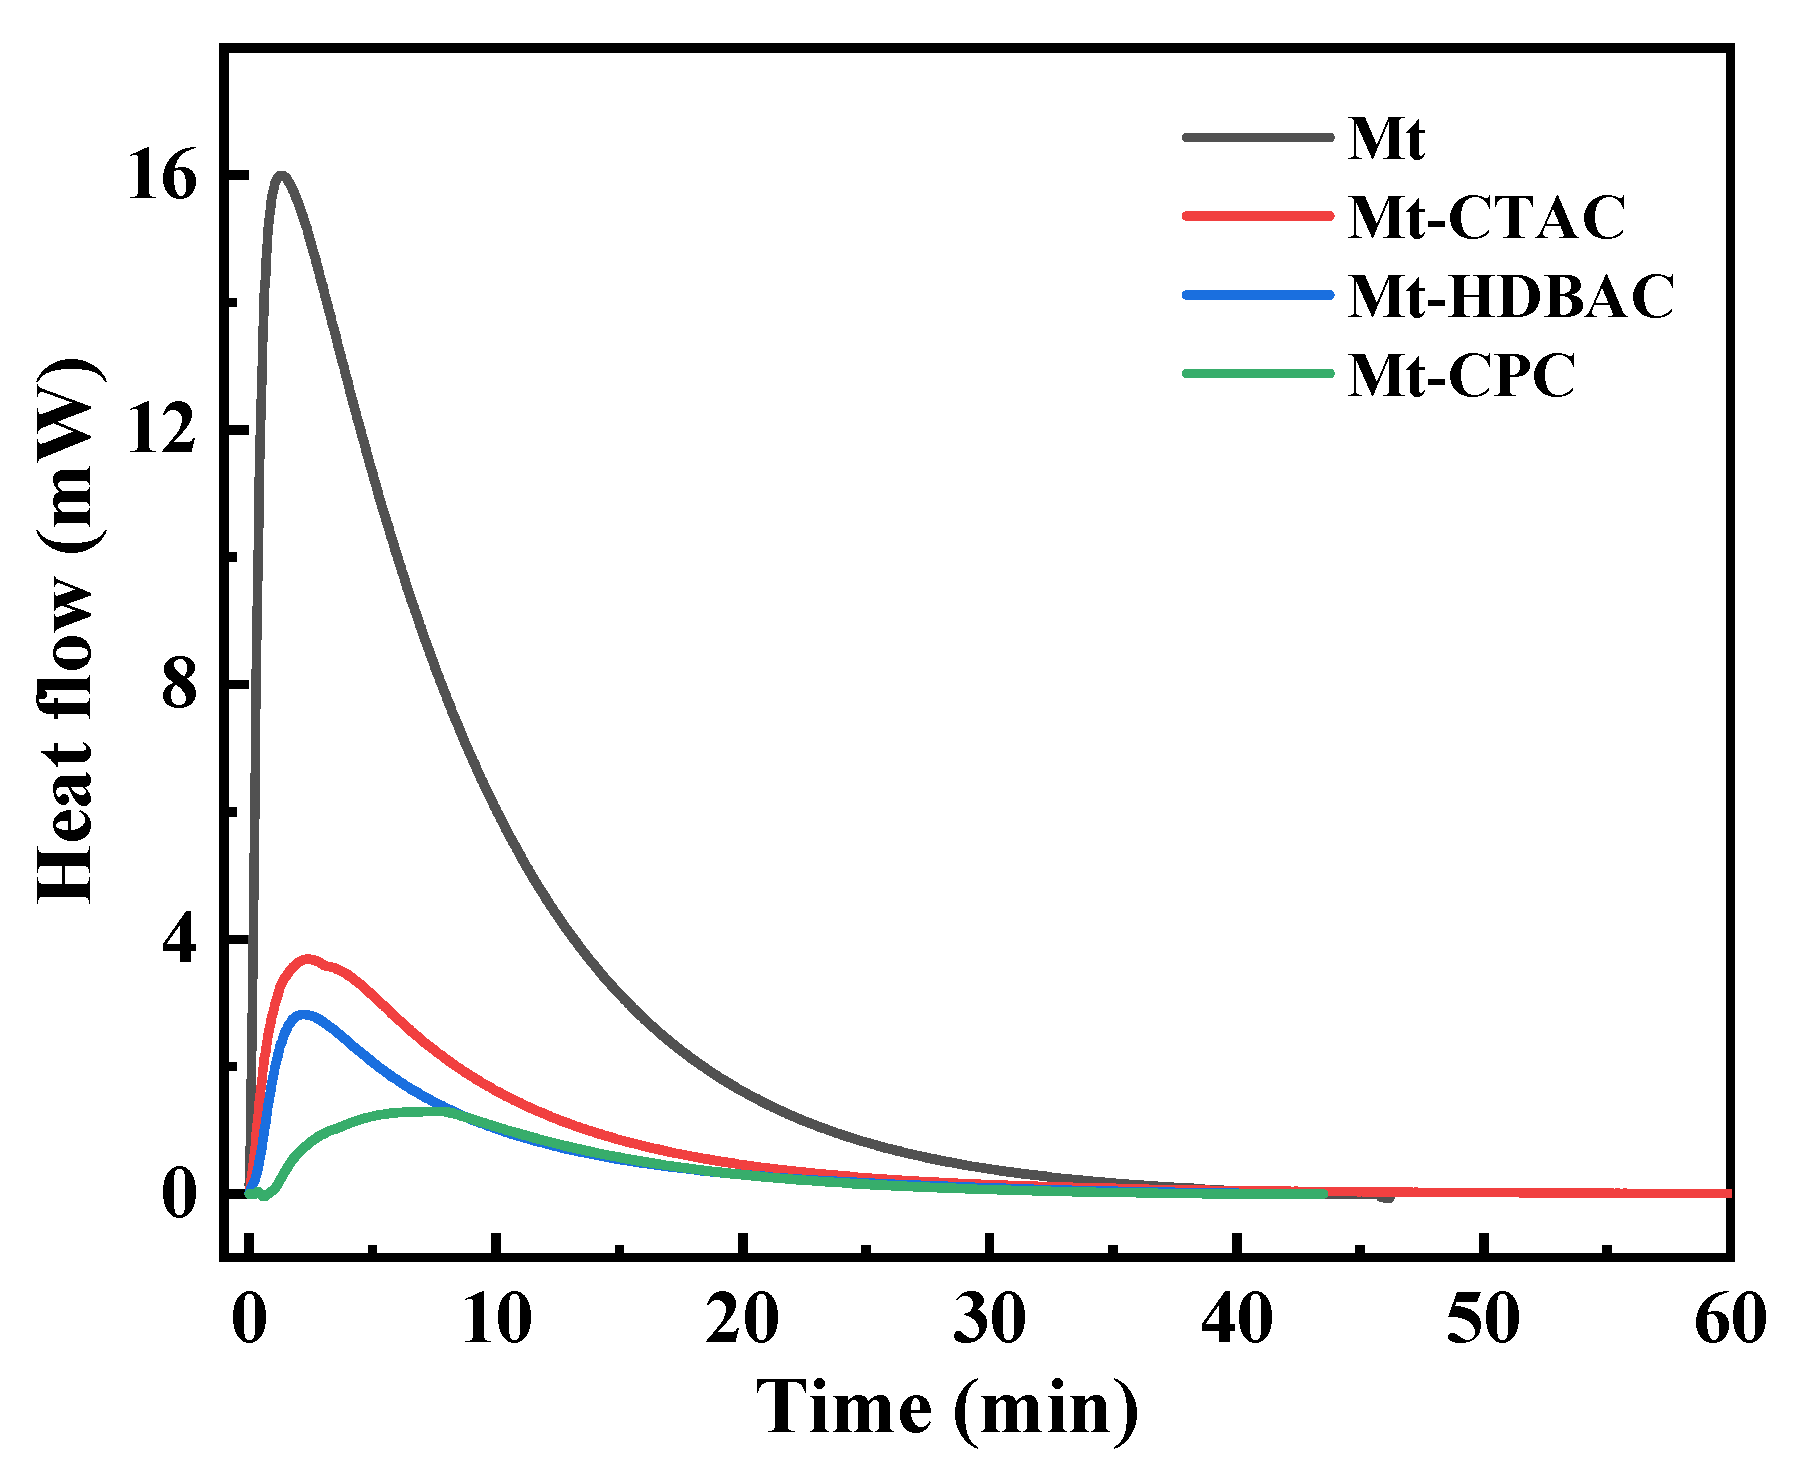
2.3.2. Characterization of the Effect of Dipole on QASs Adsorption Through Energy Measurement

To quantitatively compare the hydrophilic and hydrophobic properties of Mnt before and after modification, the hydration heat of Mnt was measured before and after modification by QASs in an aqueous solution using microcalorimetry [27]. Figure 7 shows the hydration heat curves of Mnt particles under the action of the three types of QASs. As shown in the figure, the hydration heat rate on the surface of modified Mnt is significantly lower than that of unmodified Mnt, confirming that QASs are adsorbed on the surface of Mnt and the hydrophobicity of the Mnt surface is improved.
Table 3 shows the hydration heat of the three types of QASs on the Mnt surface under the same molarity. Since the hydration heat is negative, the interaction between water molecules and the Mnt surface is exothermic, indicating that the adsorption of water molecules by the Mnt surface is a spontaneous process. For this interaction, the wetting process often involves the spreading of liquid on the solid surface and is accompanied by energy changes; thus, the wetting phenomenon and thermal effects allow for a comprehensive characterization of the wettability of the solid surface [28]. The hydration heat values were Mnt > Mnt-CTAC > Mnt-HDBAC > Mnt-CPC. A higher hydration heat value indicates a stronger interaction between the water molecules and solid surfaces [29]. The results show that the absolute value of the surface hydration heat of the modified Mnt was less than that of unmodified Mnt. Therefore, the interaction between the modified Mnt and water molecules is weakened and the hydrophobicity of the modified Mnt is improved, where Mnt-CPC > Mnt-HDBAC > Mnt-CTAC.
To confirm the law of dipole interaction, the VDW interaction energies between Mnt and the three reagents in aqueous solution were measured using microcalorimetry. As shown in Figure 8, the adsorption heats of different QASs (DTAC, CTAC, STAC, HDBAC, and CPC) interacting with Mnt at the same molarity were compared. Under identical concentration conditions, the absolute values of adsorption heat followed the order STAC > CTAC > DTAC. This trend indicates that increasing the alkyl chain length enhances the likelihood of contact between reagent molecules and Mnt particles in aqueous solution, thereby strengthening the interaction and resulting in greater heat release. Corresponding data are summarized in Table 3.
According to the results of the reagent adsorption capacity and reagent adsorption heat, the reagent adsorption energies of different QASs adsorbed on the surface of Mnt particles can be calculated.
W A d s = Q A d s R d c
where Q A d s is the C80 test value (J/g) and R d c the reagent adsorption capacity is in mmol/g.
According to calculations, for the same hydrophobic QAS-Mnt effective heat, the reagent adsorption energy of QASs adsorbed on the Mnt surface is CPC-Mnt > HDBAC-Mnt > CTAC-Mnt. As shown in Table 4, this result implies that the interaction between the dipole and the Mnt surface is proportional to the value of the dipole, and the larger the dipole, the greater the interaction.

2.3.3. Average Adsorption Distance, Electrostatic Adsorption Energy, VDW Adsorption Energy, and VDW Constant (C) of QASs

Table 5 summarizes the key interfacial parameters characterizing the interactions between QASs and montmorillonite (Mnt), including zeta potential, electrostatic adsorption energy, Van der Waals (VDW) energy, average adsorption distance, and the VDW interaction constant. After adsorption of positively charged QASs onto negatively charged Mnt surfaces, the zeta potential becomes positive, indicating charge reversal and excess adsorption driven predominantly by VDW attraction. The magnitude of the zeta potential in these cases exceeds that of pristine Mnt, suggesting that the net electrostatic contribution is repulsive, while the total interaction is stabilized by VDW forces.
The electrostatic adsorption energy (calculated from zeta potential values) and the corresponding average adsorption distances (representing the mean distance between the Mnt surface and the reagent charge center) were derived using equations provided in Table 5. Where z = 1 , F = 96,485   C / mol , ε = ε r · ε 0 , ε r = 78.5   F / m , ε 0 = 8.854187817 × 10 12   F / m , q 1 = e = 1.6 × 10 19   c , q 2 = ψ M n t t r e a t e d + ψ M n t B l u k ψ M n t B l u k , d M N T = 0.96   nm , and Ψ M t t r e a t e d and Ψ M t B l u k are the zeta potential test values of Mnt after adsorption of QASs and untreated Mnt, respectively, in volts (V). Notably, the adsorption distances range from 1.95 to 2.13 nm across QAS types.
By subtracting the electrostatic contribution from the total adsorption energy, the VDW interaction energies for CTAC, HDBAC, and CPC were calculated as –10.863, –14.767, and –19.104 kJ/mol, respectively. These differences are attributed solely to the hydrophilic end groups, as their hydrophobic tails are identical. This trend confirms that stronger dipole moments of hydrophilic groups result in stronger orientation dipole–induced dipole interactions with the Mnt surface.
Finally, VDW interaction constants were determined and are also listed in Table 5. For DTAC, CTAC, and STAC, a larger C value corresponds to smaller molecular volume; for CTAC, HDBAC, and CPC, a larger C value reflects stronger dipole interactions. The results collectively demonstrate that both molecular volume and dipole strength govern QAS–Mnt interfacial behavior.

2.3.4. VDW Energy and VDW Constant C of the Organic Groups

The VDW energy between organic groups and Mnt is calculated as follows.
The structural formula of DTAC is Inorganics 13 00119 i007, and its molecular formula is CH3(CH2)11N(CH3)3Cl. Suppose the VDW energy of -CH2 is x J/mol, and the value of x obtained by combining the three equations according to Equations (5)–(7) is averaged. Then, suppose the VDW energy of -CH3 is 1.5 x J/mol, and the VDW energy of a hydrophilic polar head is a J/mol.
Then, the VDW interaction formula for each organic group is as follows:
11 x + 1.5 x + a = W V D W D T A C / M M N T
The structural formula of CTAC is Inorganics 13 00119 i008
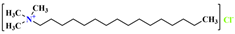
, and its molecular formula is CH3(CH2)15N(CH3)3Cl. Thus, the VDW interaction formula for each organic group is
15 x + 1.5 x + a = W V D W C T A C / M M N T
The structural formula of STAC is Inorganics 13 00119 i009
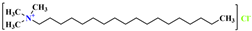
, and its molecular formula is CH3(CH2)17N(CH3)3Cl. The VDW interaction formula for each organic group is
17 x + 1.5 x + a = W V D W S T A C / M M N T
The structural formula of HDBAC is Inorganics 13 00119 i010
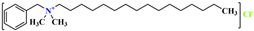
, and its molecular formula is CH3(CH2)15N(CH3)2CH2(C6H5)Cl. C25H46NC6H6Cl. Suppose the VDW interaction energy of the hydrophilic polar head is b , and the VDW interaction formula of each organic group is as follows:
15 x + 1.5 x + b = W V D W H D B A C / M M N T
The structural formula of CPC is Inorganics 13 00119 i011
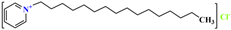
, and its molecular formula is CH3(CH2)17N(CH3)3Cl. C21H38ClN. Suppose the VDW interaction energy of the hydrophilic polar head is c , and the VDW interaction formula of each organic group is as follows:
15 x + 1.5 x + c = W V D W C P C / M M N T
According to Equations (5)–(9), the VDW energy of each organic group in Table 6 is Inorganics 13 00119 i001-Mnt (−17.533 kJ/mol) > Inorganics 13 00119 i005-Mnt (−13.196 kJ/mol) > Inorganics 13 00119 i003-Mnt (−9.305 kJ/mol), CH3-Mnt (−0.143 kJ/mol) > CH2-Mnt (−0.095 kJ/mol). The dipole moment of pyridine was 5.3. Compared with the pyridine group, the electrostatic center of the benzyl group is located outside the carbon ring, and the carbon ring is more symmetrical; therefore, it has a less oriented dipole. Compared with the benzyl group, the methyl group binds the electron cloud more strongly than the six-carbon ring; thus, it has the least oriented dipole. The order of the dipole is Inorganics 13 00119 i001 > Inorganics 13 00119 i005 > Inorganics 13 00119 i003. These results indicate that the larger the hydrophilic dipole of QASs, the greater the interaction between QASs and Mnt, and the greater the VDW energy. CH3 has one more H atom than CH2, and the binding of CH3 on electrons is lower than that of CH2; hence, CH3 has a greater induced dipole and adsorption energy. Additionally, the VDW constants of each functional group can be obtained according to the VDW energy obtained above.
Next, the VDW interaction constant C between each functional group and Mnt was calculated based on the equations provided in Table 5. The VDW constant of each functional group is Inorganics 13 00119 i003 (1.14 × 10−78 J·m6), Inorganics 13 00119 i005 (1.22 × 10)−78 J·m6), Inorganics 13 00119 i001 (1.89 × 10−78 J·m6), CH3 (1.75 × 10−80 J·m6), and CH2 (1.17 × 10−80 J·m6). For the hydrophilic end, the VDW constant   C VDW = C orient + C ind + C disp . C orient is the interaction between the orientation dipole of Inorganics 13 00119 i001, Inorganics 13 00119 i005, Inorganics 13 00119 i003, and the Si-O polar bond of Mnt. C ind is the interaction between the induced dipole between Inorganics 13 00119 i001, Inorganics 13 00119 i005, Inorganics 13 00119 i003 and the Si-O polar bond of Mnt, and C disp is the interaction between the induced dispersion between the instantaneous dipole of Inorganics 13 00119 i001, Inorganics 13 00119 i003, Inorganics 13 00119 i005 and groups and the instantaneous dipole of Mnt surface. Because C Inorganics 13 00119 i001 = 1.89 × 10−78 J·m6 > C Inorganics 13 00119 i005 = 1.22 × 10−78 J·m6 > C Inorganics 13 00119 i003 = 1.14 × 10−78 J·m6, the order of the dipole is Inorganics 13 00119 i001 > Inorganics 13 00119 i005 > Inorganics 13 00119 i003. The difference in attraction between the hydrophilic group and Mnt is caused by the value of the dipole of hydrophilic end; therefore, the VDW energy Inorganics 13 00119 i001-Mnt (−17.533 kJ/mol) > Inorganics 13 00119 i005-Mnt (−13.196 kJ/mol) > Inorganics 13 00119 i003-Mnt (−9.305 kJ/mol). The adsorption difference between QASs and Mnt with the same hydrophobic end is due to the value of the dipole of the hydrophilic end, and the VDW energy decreases in the order CPC > HDBAC > CTAC. Furthermore, the VDW interaction results in the excessive adsorption of QASs on the Mnt surface.
In the hydrophobic ends, CH3 and CH2 are symmetrical structures, the VDW constant C orient + C ind 0 ,   C VDW C disp , CCH3 = 1.75 × 10−80 J·m6, and CCH2 = 1.17 × 10−80 J·m6, while the induced dispersion effect between the two structures and the Mnt surface is mainly instantaneous dipole. For QAS molecules with the same hydrophilic end and different hydrophobic ends, the superposition of the VDW effect of CH2 results in the difference in attraction between QASs and Mnt, namely, WVDWSTAC > WVDWCTAC > WVDWDTAC.

3. Materials and Methods

3.1. Samples and Reagents

Na-Mnt purified from the raw ore of high-purity nano montmorillonite (Inner Mongolia, China) was used in this study. The powder was characterized using X-ray diffraction (XRD, MiniFlex600, Rigaku Corporation, Tokyo, Japan). The results of the analysis are shown in Figure 9. The results show that the Na-Mnt sample is of high purity [30]. Five QASs (DTAC, CTAC, STAC, HDBAC, and CPC), bromothymol blue (BTB) aqueous solution with a concentration of 1.6 × 10⁻⁴ mol/L, the non-ionic surfactant (OP-10) aqueous solution, and phosphate buffer solution (pH = 7.7) were obtained from Shanghai Aladdin Biochemical Technology Co., Ltd (Shanghai, China).

3.2. Experimental Methods

Mnt (90 g) was weighed and placed into a 3 L beaker, and then 3 L of deionized water was added and stirred with an agitator at a shear rate of 350 rad/min for 1 h. The mixture was left to settle for 30 min, and then the upper Na-Mnt suspension was collected. The experimental procedure is illustrated in Figure 10a,b. Briefly, 20 mL of the Na-Mnt suspension was poured into a 100 mL beaker, deionized water was added to dilute it to the 100 mL mark, and then the appropriate 0.15 mol/L CTAC and CPC or 0.08 mol/L HDBAC standard solution was mixed to dilute it to the target concentration. The resulting mixture was stirred with an electric stirrer at a shear speed of 500 rad/min for 5 min. Then, 2 mL of the Mnt supernatant liquid was dispensed into a quartz glass cuvette up to the same level each time, and its transmittance was measured at 930 nm using a UV–Vis spectrophotometer ((JH721, Shanghai Yi Electrical Analysis Instrument Co., Ltd., Shanghai, China), as shown in Figure 10c. The wavelength of 930 nm, located in the near-infrared (NIR) region, was selected because it lies outside the typical absorbance range of montmorillonite and common organic surfactants. As such, any changes in transmission at this wavelength are primarily attributed to light scattering by suspended or flocculated particles, rather than direct molecular absorption. This makes 930 nm a practical accepted choice for assessing turbidity and flocculation behavior in colloidal clay systems following surface modification.

3.3. Characterization

In aqueous solution, Mnt (0.04 mol/L) was mixed with CTAC, HDBAC, and CPC at a concentration of 0.01 mol/L and stirred at a shear rate of 500 rad/min for 30 min with a stirrer. After drying, an FTIR spectroscopy experiment was conducted using the pressing method. In aqueous solution, Mnt (0.04 mol/L) was mixed with the surfactants CTAC, HDBAC, and CPC at a concentration of 0.045 mol/L. The FBRM particle size analysis of the hydrophobic floc was carried out by stirring with an agitator at a shear rate of 500 rad/min for 30 min. After semi-drying, the Mnt solution before and after QAS modification was extracted and filtered, and the sample morphology was analyzed using ESEM. Thermogravimetric analysis was performed using a TG-DSC instrument (STA 449 F5, NETZSCH-Gerätebau GmbH, Selb, Germany) maintained at a constant temperature of 60 °C for 1 h with a temperature increase rate of 10 °C/min and a reaction gas atmosphere of nitrogen. The hydration heat and reagent adsorption heat on the surface of Mnt were determined using a microcalorimeter (C80, Setaram Instrumentation, Caluire, France) at a constant temperature of 30 °C. During the test, 0.2 g of Mnt samples before and after modification, along with 2 mL of deionized water, were placed at the bottom and top of the membrane-mixing reaction tank separated by an aluminum foil membrane. After the temperature reached equilibrium, the aluminum foil film was broken with the top needle of the membrane mixing tank so that the deionized water and Mnt sample were in contact. Data acquisition software (Version 2.0995, Setaram Instrumentation, Caluire, France) was used to record the heat flow curves of the hydration heat process. The data were collected until adsorption equilibrium was reached, and the heat flow curve was integrated to obtain the hydration heat values of the Mnt samples before and after modification. Additionally, 2 mL of Mnt suspension with a concentration of 0.04 mol/L and 2 mL of CTAC, HDBAC, and CPC aqueous solutions with a concentration of 0.045 mol/L were placed at the bottom and top of the membrane-mixing reaction tank, respectively, and separated by an aluminum foil membrane. The subsequent steps were identical to those used for measuring the Mnt hydration heat. The reagent adsorption heat value can be obtained by mixing the Mnt suspension with the reagent.
Zeta potential measurement: 20 mL of the uniform 0.04 mol/L Mnt suspension was measured into a 100 mL beaker, and then 20 mL of 0.045 mol/L surfactant was added. The mixture was then immediately stirred using a magnetic stirrer at a certain speed for a certain time and then analyzed using a Zetasizer Nano potential tester. Each sample was cycled three times and averaged.
The adsorption capacity was determined as follows:
(1)
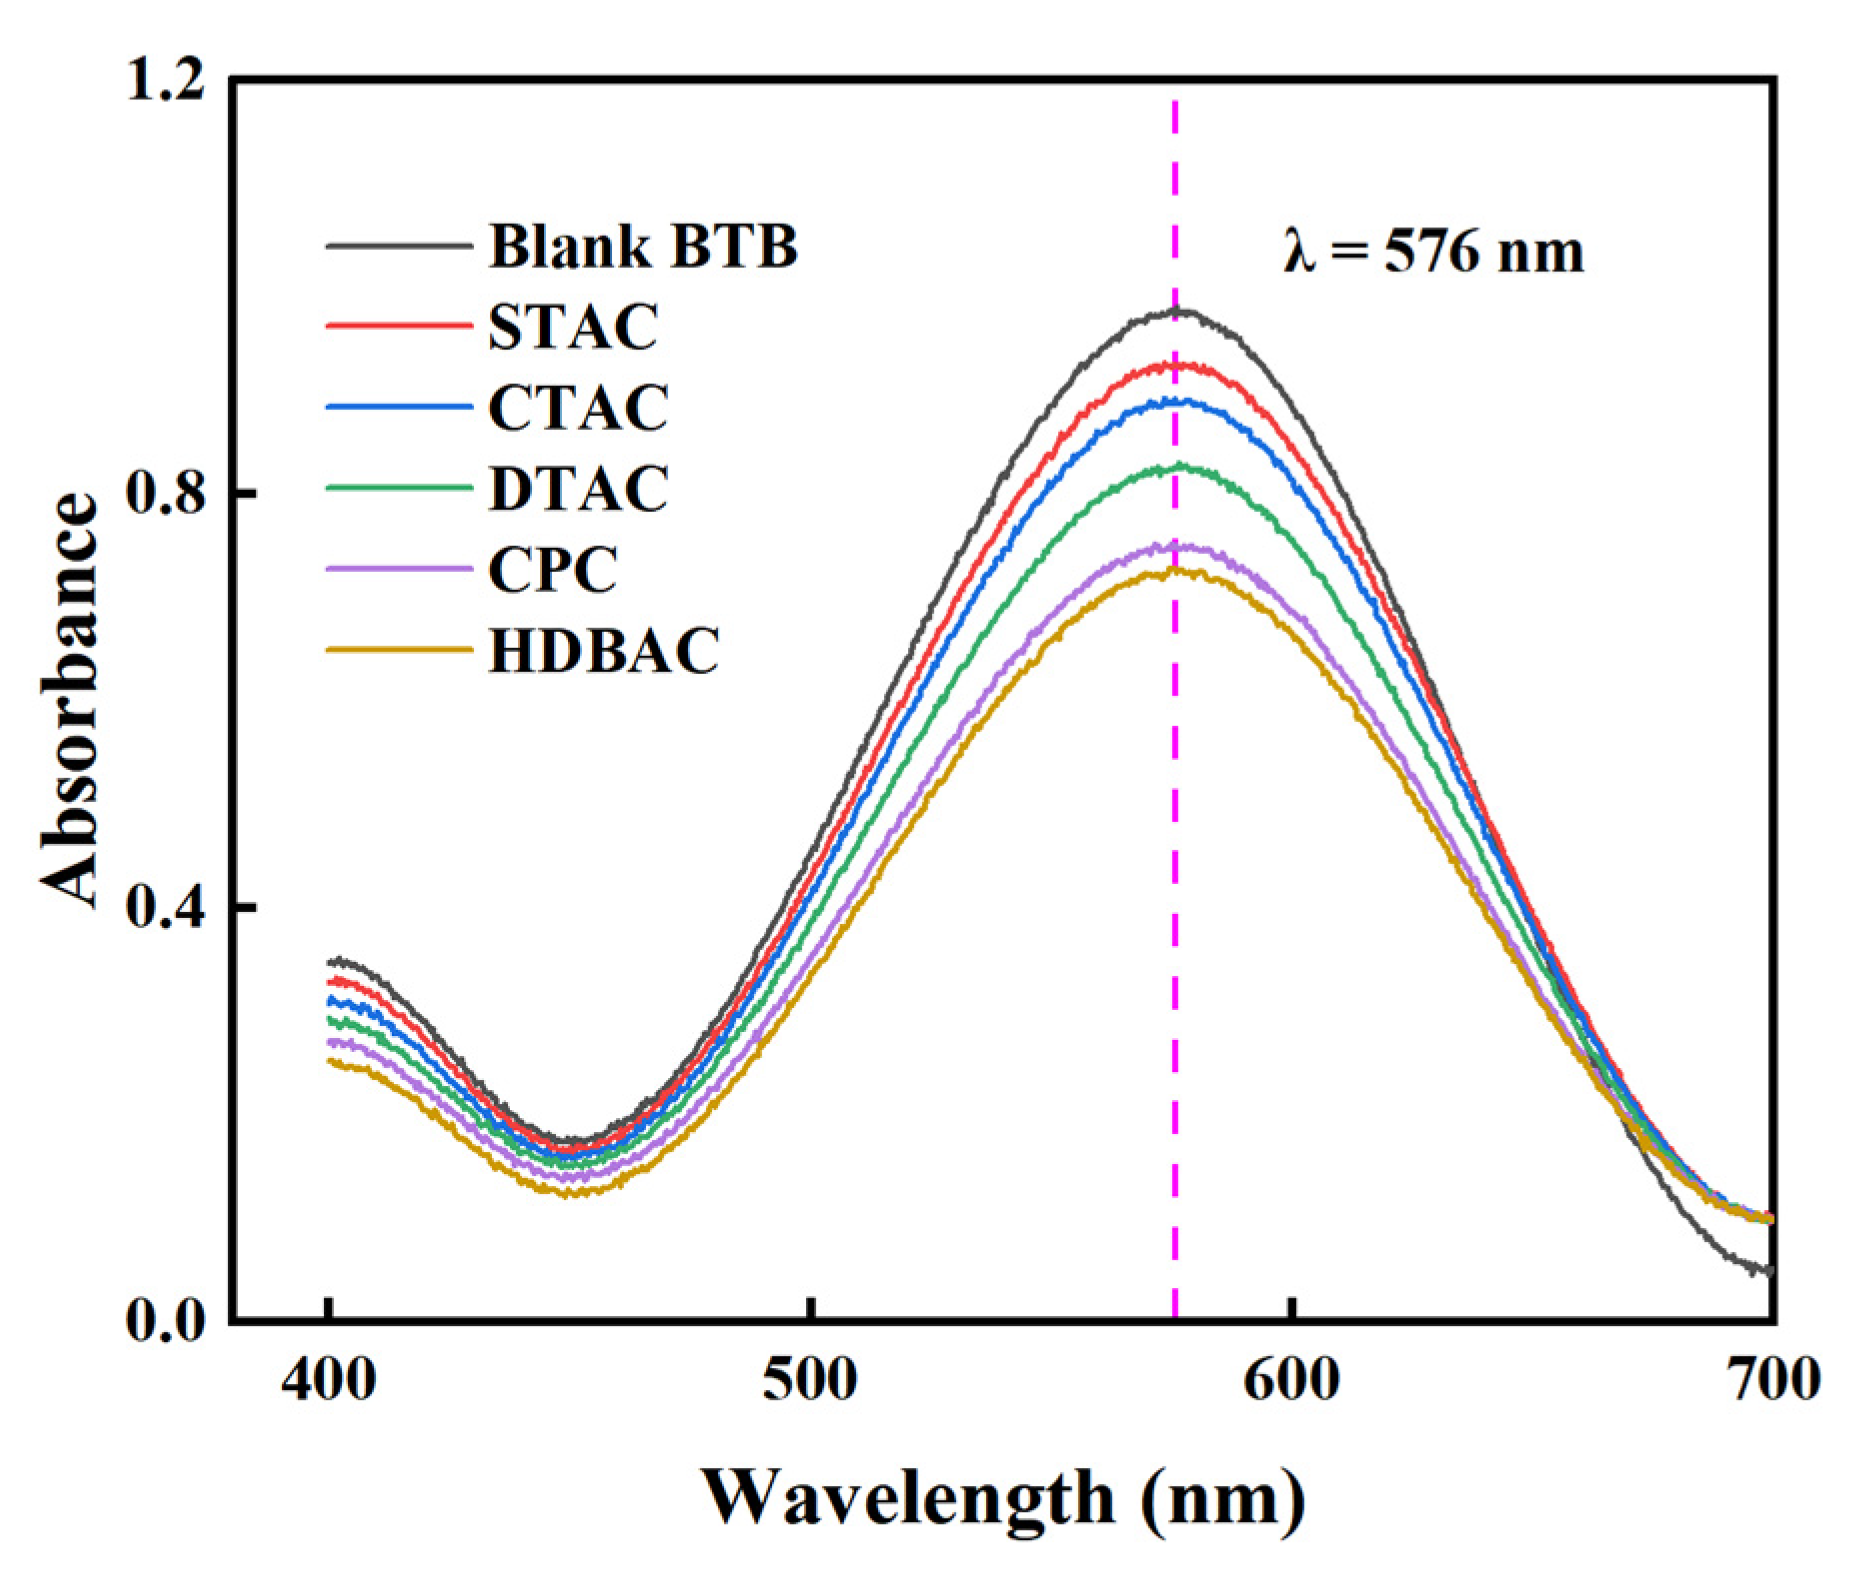
The determination wavelength was first identified through spectral analysis. In a 50 mL volumetric flask, 2 mL of a QAS solution (0.045 mol/L) was mixed with 2 mL of 0.15% OP-10 solution, 10 mL of 1.6 × 10⁻⁴ mol/L bromothymol blue (BTB) solution, and 5 mL of phosphate buffer (pH = 7.7). The mixture was then diluted to volume with deionized water and shaken thoroughly. Using a JH721 UV–Vis spectrophotometer and a 1 cm pathlength cuvette, the absorption spectra of both the blank BTB solution and the BTB–QAS mixture were recorded over the wavelength range of 400–700 nm, with deionized water as the reference.
The maximum absorption wavelength (λ = 576 nm) corresponding to the BTB–QAS complex was selected for subsequent measurements. This wavelength ensured optimal sensitivity, accuracy, and reproducibility in quantifying the adsorption capacity of QASs on montmorillonite. The absorption spectra are presented in Figure 11.
(2)
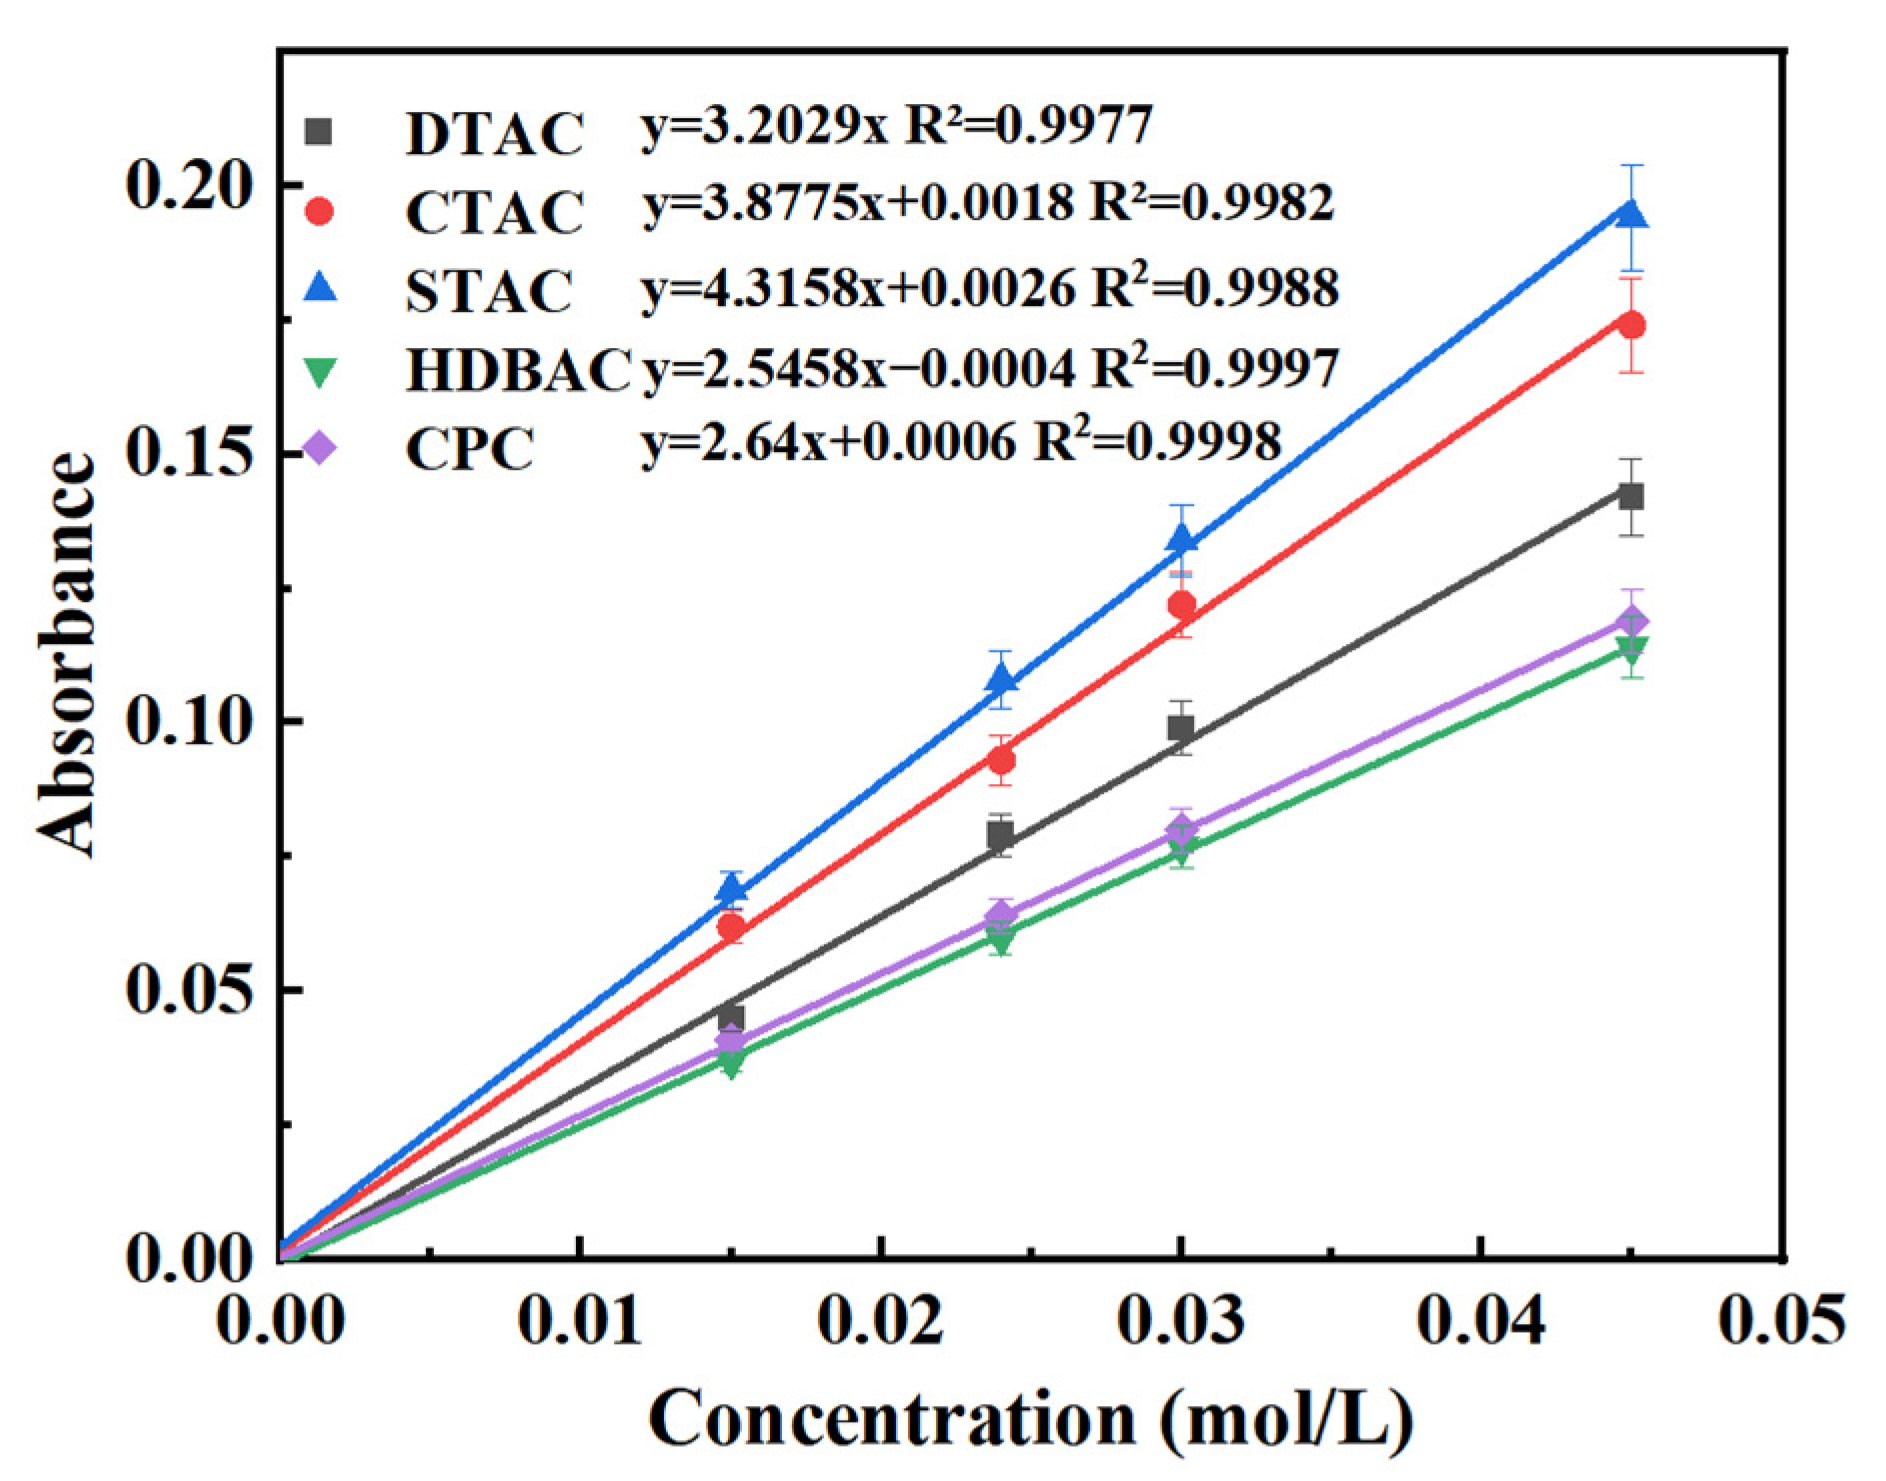
The standard working curve was determined. Each of these QAS aqueous solutions with mass concentrations of 0.015, 0.024, 0.03, and 0.045 mol/L were prepared with deionized water. Additionally, 2 mL of QAS solutions with different mass concentrations were dyed by BTB, and the absorbance was measured using a JH721 UV-Vis spectrophotometer at the determination wavelength using deionized water as the reference solution. The obtained absorbance decrease was used to draw the working curve of the QAS mass concentration, and the standard working curve was obtained by linear fitting of the working curve.
(3)
The adsorption capacity was determined. Twenty-five milliliters of the 0.04 mol/L Mnt suspension and 25 mL of the five reagents of 0.045 mol/L were taken, stirred at 400 rad/min for 5 min (magnetic stirrer), allowed to stand for 30 min, and 20 mL of supernatant was centrifuged at 2000 rad/min for 5 min. Then, 2 mL of the supernatant liquid was mixed with the above-prepared solution and shaken well. Deionized water was used as the reference, and the absorbance of each reagent was measured three times at 576 nm, and the final value was averaged. Using the obtained QAS working curve, the adsorption capacity of QASs on the surface of the Mnt particles was calculated using the residual concentration method, and the calculation formula is
A = 1000 ω v ρ ( V m / ρ 1 ) c / 1000 m
where A is the adsorption capacity (mmol/g), ω is the mass percentage of the reagent aqueous solution (0.5%), v is the volume of reagent aqueous solution (mL), ρ is the density of the reagent aqueous solution (1 g/cm3), V is the volume of Mnt suspension (25 mL), m is the mass of Mnt (0.35 g), ρ 1 is the density of Mnt (2 g/cm3), and c is the reagent concentration obtained according to the working curve (mol/L).
All experimental measurements were conducted in triplicate (n = 3). Data are presented as mean ± standard deviation (SD).

4. Conclusions

The dipole interaction between the hydrophilic end of QASs and Mnt in aqueous solutions was studied experimentally. In aqueous solutions, the larger the orientation dipole of the hydrophilic end of QASs, the stronger the interaction with Mnt. Five surfactants (i.e., CTAC, HDBAC, CPC, STAC, and DTAC) were selected to interact with Mnt. Among them, the VDW interaction between QASs and Mnt were as follows: CPC-Mnt (WVDW = −19.104 kJ/mol, C = 2.06 × 10−72 J·m6) > HDBAC-Mnt (WVDW = −14.767 kJ/mol, C = 1.37 × 10−72 J·m6) > CTAC-Mnt (WVDW = −10.863 kJ/mol, C = 1.26 × 10−72 J·m6), Inorganics 13 00119 i001-Mnt (WVDW = −17.533 kJ/mol, C = 1.89 × 10−78 J·m6) > Inorganics 13 00119 i005-Mnt (WVDW = −13.196 kJ/mol, C = 1.22 × 10−78 J·m6) > Inorganics 13 00119 i003-Mnt (WVDW = −9.305 kJ/mol, C = 1.14 × 10−78 J·m6). The larger the hydrophilic dipole, the stronger the VDW interaction between QASs and Mnt, including orientation dipole–orientation dipole, induced dipole–orientation dipole, and induced dipole–induced dipole. The VDW interaction between QASs and Mnt with different hydrophobic ends decreased in the order STAC > CTAC > DTAC, and the VDW interaction energy between them was STAC-Mnt (WVDW = −11.062 kJ/mol, C = 1.11 × 10−72 J·m6) > CTAC-Mnt (WVDW = −10.863 kJ/mol, C = 1.26 × 10−72 J·m6) > DTAC-Mnt (WVDW = −10.496 kJ/mol, C = 1.62 × 10−72 J·m6), which was due to the superposition of CH2 at the hydrophobic end during adsorption. However, CH3-Mnt (WVDW = −0.143 kJ/mol, C = 1.75 × 10−80 J·m6) > CH2-Mnt (WVDW = −0.095 kJ/mol, C = 1.17 × 10−80 J·m6), and the interaction between these two groups and Mnt mainly induced dipole–induced dipole interactions.
The study also showed that VDW interaction between Mnt and QASs hydrophilic groups was positively correlated with dipole strength. As molecular volume increased, electrostatic adsorption capacity decreased due to steric hindrance, while the VDW adsorption capacity increased due to stronger dipolar attraction. The calculated adsorption distances further supported this trend: rCPC = 2.00 nm, rHDBAC = 1.95 nm, rCTAC = 2.03 nm, rSTAC = 1.98 nm, and rDTAC = 2.13 nm. Moreover, results from ESEM, TG-DSC, FBRM, and hydration heat analyses confirmed that CPC, HDBAC, and CTAC induced effective hydrophobic modification and flocculation of Mnt. For example, CPC modification led to the highest light transmittance (84%) and lowest hydration heat (–1.9 kJ/mol), indicating superior hydrophobic performance, followed by HDBAC and CTAC.
While previous studies have predominantly relied on molecular dynamics simulations or theoretical models to estimate VDW interactions between Mnt and QASs, this work represents the first experimental quantification of such interactions in aqueous environments. This constitutes a key methodological advancement, bridging the gap between computational predictions and experimentally measurable interfacial behaviors.
Overall, this study establishes a novel quantitative framework for understanding dipole-regulated VDW interactions at organic–inorganic interfaces in aqueous systems. By effectively decoupling electrostatic and VDW contributions, it highlights the critical role of hydrophilic dipole strength in governing QAS–Mnt interfacial behavior. These findings not only deepen the fundamental understanding of surfactant–clay interactions, but also lay the groundwork for future research on Van der Waals forces—supporting, on the one hand, the refinement of molecular models, and on the other, the development of experimental strategies for direct quantification of interfacial interactions.
In terms of practical relevance, this work provides guidance for the rational design of functionalized clays with tunable surface properties, which may benefit applications in polymer nanocomposites, wastewater treatment, oil–water separation, and controlled-release systems. Future studies could extend this experimental approach to other soft matter systems and investigate the synergistic effects of VDW and hydrogen bonding interactions in complex interfacial environments.

Author Contributions

Conceptualization, H.L.; Methodology, W.X., R.L. and H.L.; Validation, M.C., Y.P., W.X., R.L. and H.L.; Formal analysis, Y.F., M.C., W.Z. and H.L.; Investigation, M.C., W.X., R.L., W.Z. and H.L.; Resources, W.X.; Data curation, Y.F., M.C., W.X. and H.L.; Writing—original draft, M.C. and W.X.; Writing—review & editing, Y.F., W.X. and H.L.; Visualization, M.C. and W.X.; Supervision, H.L.; Project administration, H.L.; Funding acquisition, H.L. All authors have read and agreed to the published version of the manuscript.

Funding

This work was supported by the Anhui Engineering Research Center for Coal Clean Processing and Carbon Reduction (CCCE-2023002), National Natural Science Foundation of China (51804213), Fundamental Research Program of Shanxi Province (202203021221041), and High-Level Overseas Talent Return Funding Project Translation of Ministry of Human Resources and Social Security.

Institutional Review Board Statement

Not applicable.

Informed Consent Statement

Not applicable.

Data Availability Statement

Data are contained within the article.

Conflicts of Interest

Author Hongliang Li is employed by Taiyuan Shengong Technology Co., Ltd. The remaining authors declare that the research was conducted in the absence of any commercial or financial relationships that could be construed as potential conflicts of interest.

References

  1. Lagaly, G.; Ogawa, M.; Dékány, I. Clay Mineral-Organic Interactions. In Handbook of Clay Science; Elsevier: Amsterdam, The Netherlands, 2013; Volume 5, ISBN 9780080982588. [Google Scholar] [CrossRef]
  2. Liu, L.; Kong, C.; Zhao, H.; Lu, F. Elucidating the enhancement of kaolinite flotation by iron content through density functional theory: A study on sodium oleate adsorption efficiency. Int. J. Min. Sci. Technol. 2024, 34, 855–866. [Google Scholar] [CrossRef]
  3. Bergaya, F.; Detellier, C.; Lambert, J.F.; Lagaly, G. Introduction to Clay-Polymer Nanocomposites (CPN), 2nd ed.; Elsevier Ltd.: Amsterdam, The Netherlands, 2013; Volume 5. [Google Scholar] [CrossRef]
  4. Huang, X.; Lewis, S.; Brittain, W.J.; Vaia, R.A. Synthesis of polycarbonate-layered silicate nanocomposites via cyclic oligomers. Macromolecules 2000, 33, 2000–2004. [Google Scholar] [CrossRef]
  5. Annabi-Bergaya, F. Layered clay minerals. Basic research and innovative composite applications. Microporous Mesoporous Mater. 2008, 107, 141–148. [Google Scholar] [CrossRef]
  6. Giannelis, E.P.; Krishnamoorti, R.; Manias, E. Polymer-silicate nanocomposites: Model systems for confined polymers and polymer brushes. Adv. Polym. Sci. 1999, 138, 108–147. [Google Scholar] [CrossRef]
  7. Lebaron, P.C.; Wang, Z.; Pinnavaia, T.J. Polymer-layered silicate nanocomposites: An overview. Appl. Clay Sci. 1999, 15, 11–29. [Google Scholar] [CrossRef]
  8. Fournaris, K.G.; Karakassides, M.A.; Petridis, D.; Yiannakopoulou, K. Clay—Polyvinylpyridine nanocomposites. Chem. Mater. 1999, 11, 2372–2381. [Google Scholar] [CrossRef]
  9. Carrado, K.A. Carrado Synthetic organo- and polymer- clays: Preparation, characterization, and materials applications. Appl. Clay Sci. 2000, 17, 1–23. [Google Scholar] [CrossRef]
  10. Zhang, T.; Zhao, Y.; Kang, S.; Bai, H.; Gu, W.; Fang, D.; Komarneni, S.; Zhang, Q. Mechanical activation of zero-valent iron (ZVI) in the presence of CaCO3: Improved reactivity of ZVI for enhancing As(III) removal from water. J. Clean. Prod. 2021, 286, 124926. [Google Scholar] [CrossRef]
  11. Yi, H.; Ai, Z.; Zhao, Y.; Zhang, X.; Song, S. Design of 3D-network montmorillonite nanosheet/stearic acid shape-stabilized phase change materials for solar energy storage. Sol. Energy Mater. Sol. Cells 2020, 204, 110233. [Google Scholar] [CrossRef]
  12. Lambert, J.F.; Bergaya, F. Smectite-Polymer Nanocomposites, 2nd ed.; Elsevier Ltd.: Amsterdam, The Netherlands, 2013; Volume 5. [Google Scholar] [CrossRef]
  13. Darder, M.; Colilla, M.; Ruiz-Hitzky, E. Biopolymer-clay nanocomposites based on chitosan intercalated in montmorillonite. Chem. Mater. 2003, 15, 3774–3780. [Google Scholar] [CrossRef]
  14. Ogawa, M.; Hashizume, T.; Kuroda, K.; Kato, C. Intercalation of 2,2’-Bipyridine and Complex Formation in the Interlayer Space of Montmorillonite by Solid-Solid Reactions. Inorg. Chem. 1991, 30, 584–585. [Google Scholar] [CrossRef]
  15. Doner, H.E.; Mortland, M.M. Benzene complexes with copper(II)montmorillonite. Science 1969, 166, 1406–1407. [Google Scholar] [CrossRef] [PubMed]
  16. Shah, K.J.; Mishra, M.K.; Shukla, A.D.; Imae, T.; Shah, D.O. Controlling wettability and hydrophobicity of organoclays modified with quaternary ammonium surfactants. J. Colloid Interface Sci. 2013, 407, 493–499. [Google Scholar] [CrossRef] [PubMed]
  17. Israelachvili, J.N. Intermolecular and Surface Forces; Academic Press: Cambridge, MA, USA, 1981; Volume 53, ISBN 9788578110796. [Google Scholar]
  18. Butt, H.J.; Kappl, M. Surface and Interfacial Forces; John Wiley & Sons: Hoboken, NJ, USA, 2010; ISBN 9783527408498. [Google Scholar] [CrossRef]
  19. Jiang, H.; Gao, Y.; Yang, Q.; Khoso, S.A.; Liu, G.; Xu, L.; Hu, Y. Adsorption behaviors and mechanisms of dodecyltrimethyl ammonium chloride and cetyltrimethyl ammonium chloride on illite flotation. Powder Technol. 2018, 331, 218–225. [Google Scholar] [CrossRef]
  20. Haounati, R.; Ouachtak, H.; El Haouti, R.; Akhouairi, S.; Largo, F.; Akbal, F.; Benlhachemi, A.; Jada, A.; Addi, A.A. Elaboration and properties of a new SDS/CTAB@Montmorillonite organoclay composite as a superb adsorbent for the removal of malachite green from aqueous solutions. Sep. Purif. Technol. 2021, 255, 117335. [Google Scholar] [CrossRef]
  21. Hong, W.; Meng, J.; Li, C.; Yan, S.; He, X.; Fu, G. Effects of Temperature on Structural Properties of Hydrated Montmorillonite: Experimental Study and Molecular Dynamics Simulation. Adv. Civ. Eng. 2020, 2020, 8885215. [Google Scholar] [CrossRef]
  22. Montes-H, G.; Geraud, Y.; Duplay, J.; Reuschlé, T. ESEM observations of compacted bentonite submitted to hydration/dehydration conditions. Colloids Surf. Physicochem. Eng. Asp. 2005, 262, 14–22. [Google Scholar] [CrossRef]
  23. Ezquerro, C.S.; Ric, G.I.; Miñana, C.C.; Bermejo, J.S. Characterization of montmorillonites modified with organic divalent phosphonium cations. Appl. Clay Sci. 2015, 111, 1–9. [Google Scholar] [CrossRef]
  24. Song, S.; Lopez-Valdivieso, A.; Reyes-Bahena, J.L.; Bermejo-Perez, H.I.; Trass, O. Hydrophobic flocculation of galena fines in aqueous suspensions. J. Colloid Interface Sci. 2000, 227, 272–281. [Google Scholar] [CrossRef]
  25. Hu, Y.; Liu, L.; Min, F.; Zhang, M.; Song, S. Hydrophobic agglomeration of colloidal kaolinite in aqueous suspensions with dodecylamine. Colloids Surf. Physicochem. Eng. Asp. 2013, 434, 281–286. [Google Scholar] [CrossRef]
  26. Peng, C.; Zhong, Y.; Min, F. Adsorption of alkylamine cations on montmorillonite (001) surface: A density functional theory study. Appl. Clay Sci. 2018, 152, 249–258. [Google Scholar] [CrossRef]
  27. Rotenberg, B.; Morel, J.-P.; Marry, V.; Turq, P.; Morel-Desrosiers, N. On the driving force of cation exchange in clays: Insights from combined microcalorimetry experiments and molecular simulation. Geochim. Cosmochim. Acta 2009, 73, 4034–4044. [Google Scholar] [CrossRef]
  28. Liu, S.; Liu, X.; Guo, Z.; Liu, Y.; Guo, J.; Zhang, S. Wettability modification and restraint of moisture re-adsorption of lignite using cationic gemini surfactant. Colloids Surf. Physicochem. Eng. Asp. 2016, 508, 286–293. [Google Scholar] [CrossRef]
  29. Zhang, H.; Wang, F. Analysis of surface wettability of synthetic magnetite. J. Wuhan Univ. Technol. Mater. Sci. Ed. 2014, 29, 679–683. [Google Scholar] [CrossRef]
  30. Matusik, J.; Kłapyta, Z. Characterization of kaolinite intercalation compounds with benzylalkylammonium chlorides using XRD, TGA/DTA and CHNS elemental analysis. Appl. Clay Sci. 2013, 83–84, 433–440. [Google Scholar] [CrossRef]
Figure 1. FTIR spectra of Mnt before and after interaction with surfactant.
Inorganics 13 00119 g001
Figure 2. ESEM images of Mnt samples treated with QASs under semi-dry conditions: (a) blank sample, (b) Mnt-CTAC, (c) Mnt-HDBAC, and (d) Mnt-CPC.
Inorganics 13 00119 g002
Figure 3. TG–DSC patterns of water desorption on Mnt before and after hydrophobic modification: (a) TG curves showing weight loss during isothermal holding at 60 °C for 1 h; (b) DSC curves illustrating heat flow variation under the same conditions.
Inorganics 13 00119 g003
Figure 4. FBRM particle size distribution of hydrophobically modified Mnt flocs.
Inorganics 13 00119 g004
Figure 5. Light-transmission curves of Mnt supernatant with time after hydrophobic modification by (a) CTAC, (b) HDBAC, and (c) CPC.
Inorganics 13 00119 g005
Figure 6. Standard operating curves of DTAC, CTAC, STAC, HDBAC, and CPC (λ = 576 nm).
Inorganics 13 00119 g006
Figure 7. Heat of hydration curves on the surface of Mnt particles under the action of QASs (CTAC, HDBAC, and CPC).
Inorganics 13 00119 g007
Figure 8. Reagent adsorption heats of different QASs (DTAC, CTAC, STAC, HDBAC, and CPC).
Inorganics 13 00119 g008
Figure 9. XRD pattern of Na-Mnt.
Inorganics 13 00119 g009
Figure 10. Flowchart of the experimental procedure (a,b) for montmorillonite surface modification and transmittance measurement (c).
Inorganics 13 00119 g010
Figure 11. Absorption spectra of the blank BTB solution and the BTB solution containing added QASs.
Inorganics 13 00119 g011
Table 1. Change in mass and heat values of Mnt before and after modification.
SampleMntMnt-CTACMnt-HDBACMnt-CPC
Mass change (%)3.43 ± 0.081.57 ± 0.041.28 ± 0.050.65 ± 0.02
Heat value change (kJ/mol)10.84 ± 0.266.7 ± 0.195.43 ± 0.153.93 ± 0.12
Table 2. QAS adsorption capacity, electrostatic adsorption capacity, and VDW adsorption capacity.
SampleDTACCTACSTACHDBACCPC
Reagent adsorption capacity (mmol/g)2.496 ± 0.0632.524 ± 0.0482.533 ± 0.0352.541 ± 0.0412.596 ± 0.057
Electrostatic adsorption capacity (mmol/g)0.688 ± 0.0120.672 ± 0.0140.663 ± 0.0080.658 ± 0.0130.685 ± 0.011
VDW adsorption capacity (mmol/g)1.808 ± 0.0211.852 ± 0.0181.87 ± 0.0171.883 ± 0.0161.911 ± 0.018
Table 3. Hydration heat of Mnt particles before and after QAS modification.
SampleMntMnt-CTACMnt-HDBACMnt-CPC
Hydration heat (kJ/mol)−16.569 ± 0.245−4.350 ± 0.128−2.858 ± 0.102−1.900 ± 0.097
Table 4. Adsorption heat of QASs on Mnt surface.
SampleDTACCTACSTACHDBACCPC
Reagent adsorption heat (kJ/mol)−8.045 ± 0.112−8.219 ± 0.103−8.322 ± 0.098−11.969 ± 0.126−16.412 ± 0.147
Table 5. Zeta potential, electrostatic adsorption energy, VDW energy, average adsorption distance, and VDW constant of Mnt and reagents.
SampleFormulasMntMnt-DTACMnt-CTACMnt-STACMnt-HDBACMnt-CPC
Hydrophilic group--Inorganics 13 00119 i004Inorganics 13 00119 i004Inorganics 13 00119 i004Inorganics 13 00119 i005Inorganics 13 00119 i006
Zeta potential (mV)-−15.6 ± 0.841 ± 1.243 ± 1.044 ± 0.944.6 ± 1.143.5 ± 0.7
Electrostatic adsorption energy (kJ/mol) W E = z F ( ψ M n t   t r e a t e d
ψ M n t   B l u k )
-2.4512.6442.7402.7982.692
Average adsorption distance (nm) W E = 1 4 π ε · q 1 q 2 r
r = 1 4 π ε · q 1 q 2 W E 1 2 d M M N T
-2.132.031.981.952.00
VDW energy (kJ/mol) W V D W = W A d s W E -−10.496−10.863−11.062−14.767−19.104
VDW constant C (J·m6) W V D W = C V D W r 6 -1.62 × 10−721.26 × 10−721.11 × 10−721.37 × 10−722.06 × 10−72
Table 6. VDW energy and VDW constant of each functional group.
Functional GroupInorganics 13 00119 i003Inorganics 13 00119 i005Inorganics 13 00119 i001-CH3-CH2-
VDW energy (kJ/mol)−9.305−13.196−17.533−0.143−0.095
VDW constant (J·m6)1.14 × 10−781.22 × 10−781.89 × 10−781.75 × 10−801.17 × 10−80
Disclaimer/Publisher’s Note: The statements, opinions and data contained in all publications are solely those of the individual author(s) and contributor(s) and not of MDPI and/or the editor(s). MDPI and/or the editor(s) disclaim responsibility for any injury to people or property resulting from any ideas, methods, instructions or products referred to in the content.

