Article

Adsorption of CuSO4 on Anatase TiO2 (101) Surface: A DFT Study

1
Departamento de Ciencias de la Educación, Universidad Técnica Particular de Loja, Loja EC-110160, Ecuador
2
Departamento de Química, Facultad de Ciencias Exactas y Naturales, Universidad Técnica Particular de Loja, Loja EC-110160, Ecuador
3
Instituto de Instrumentación para Imagen Molecular (i3M), Universitat Politècnica de València, Consejo Superior de Investigaciones Científicas (CSIC), E-46022 Valencia, Spain
4
Theoretical and Experimental Epistemology Lab, School of Optometry and Vision Science, University of Waterloo, Waterloo, ON N2L 3G1, Canada
5
DGIMA Group, Departamento de Química, Facultad de Ciencias Exactas y Naturales, Universidad Técnica Particular de Loja, Loja EC-110160, Ecuador
*
Authors to whom correspondence should be addressed.
Inorganics 2025, 13(4), 114; https://doi.org/10.3390/inorganics13040114
Submission received: 11 February 2025 / Revised: 16 March 2025 / Accepted: 3 April 2025 / Published: 5 April 2025

Abstract

:
The rapid growth of industrial activities has increased environmental pollution, and solar-driven heterogeneous photocatalysis using TiO2 has emerged as a promising solution. However, its wide band gap limits its efficiency, prompting research into various optimization strategies. One of these approaches is surface functionalization. Thus, this study investigates the adsorption of CuSO4 on the anatase TiO2 (101) surface using density functional theory calculations. The adsorption process induced a magnetic moment of 0.97 µB and a slight reduction in overall bandwidth. A preferential adsorption geometry pattern with an energy of −4.31 eV was identified. Charge transfer analysis revealed a net transfer from the TiO2 surface to the CuSO4 molecule, with increased net atomic charges for atoms involved in new chemical bond formation, indicating a chemisorption process. These electronic structure modifications are expected to influence the electronic and catalytic properties of the material. The findings provide insights into the CuSO4 adsorption mechanism on an anatase TiO2 (101) surface and its impact on the properties of the material, contributing to a deeper understanding of this system.

Graphical Abstract

1. Introduction

The rapid growth of industrial activities and population has accelerated the dispersion of harmful chemicals into the environment, leading to the presence of persistent organic pollutants even in remote areas [1,2]. This global issue calls for cleaner, more sustainable production and consumption policies, along with the development of innovative technologies for air, soil, and water treatment [3].
In this sense, solar-driven heterogeneous photocatalysis is a promising and sustainable solution for removing organic and biological contaminants from water [4,5]. Among materials, titanium dioxide (TiO2) is a key material in several high-technology applications, including photocatalysis, biomaterials, and novel photovoltaic solar cells [6,7,8]. Its use in photoelectrochemical processes is particularly crucial for enabling efficient large-scale solar electricity production, addressing the growing global need for sustainable energy.
TiO2, particularly in its anatase phase, has proven to be a promising material due to its unique electronic and catalytic properties, making it suitable for applications in photocatalysis, sensors, solar cells, and environmental remediation [9,10,11]. The anatase TiO2 (101) surface is known for its high stability and favorable energetic properties [6,12,13]. Studies have demonstrated that the anatase TiO2 (101) surface is the most energetically favorable and commonly observed surface in natural and synthetic anatase crystals [14,15]. By examining how different molecules interact with this surface, researchers can develop insights into improving TiO2-based materials for various applications [16,17].
However, the wide band gap of anatase-phase TiO2 (3.2 eV) significantly constrains its photocatalytic efficiency under solar irradiation [18]. To address this limitation, researchers have explored various strategies, including doping [19], morphological engineering [20,21], surface functionalization [22], and synthesis of substoichiometric titanium oxides, specifically Magnéli phases [23,24]. Also, the formation of TiO2/g-C3N4 heterojunctions constitutes another effective strategy, which has been demonstrated to enhance photocatalytic performance by facilitating charge separation and extending light absorption capabilities [25]. These approaches aim to modulate the electronic structure and optical properties of TiO2, thereby enhancing its photocatalytic performance across a broader spectrum of light.
Photocatalysis is an advanced oxidation process (AOP) that facilitates the degradation of organic compounds by generating hydroxyl radicals (HO•). Nevertheless, optimizing the efficiency of photocatalysts remains challenging, requiring extensive experimental testing, often based on trial-and-error methods.
Furthermore, the oxygen evolution reaction (OER) mechanism on the anatase (101) surface has been extensively studied, providing valuable insights into the surface reactivity and electron transfer processes involved in photocatalysis. For instance, Patra and Meyerstein [26] reported key aspects of this mechanism through analysis that complemented both experimental and theoretical studies, elucidating the role of anatase (101) in catalytic applications. In this context, computational simulation of molecular adsorption on metal oxide surfaces has emerged as a key tool for understanding catalytic and adsorption mechanisms. This study investigates the adsorption of the copper (II) (CuSO4) molecule on the anatase (101) surface of TiO2 using first-principles methods based on density functional theory (DFT).
To the best of our knowledge, no studies based on density functional theory (DFT) have specifically focused on the surface adsorption of this molecule on TiO2. Previous research has addressed other related aspects and has experimentally demonstrated that modifying TiO2 with CuSO4 (copper sulfate) significantly alters its electronic and catalytic properties [27]. In particular, CuSO4 has been used as a dopant in TiO2 with the aim of enhancing its photocatalytic activity under visible light irradiation, especially for the degradation of organic pollutants in water [28]. This line of research emerges from the need to develop more efficient, accessible, and environmentally sustainable catalysts and photocatalysts, both for the reduction of NOx compounds in industrial emissions and for water pollutant treatment [29].
However, these studies lack an in-depth atomic-level analysis of charge redistribution, and the electronic mechanisms involved in the CuSO4/TiO2 interaction. Therefore, the present study aims to complement the experimental findings by providing a more detailed atomic-scale perspective on the adsorption process and the fundamental interactions governing the CuSO4/TiO2 system.

2. Results and Discussion

2.1. Pristine Surface

To model the anatase (101) TiO2 surface a slab was constructed using a (3 × 3) 12-atom primitive unit cell, resulting in a periodic slab containing 144 atoms. The slab consists of three trilayers, each containing upper and bottom layers of O atoms bonded with a middle layer of titanium atoms. Prior to adsorption, the uppermost trilayer was fully relaxed while the underlying layers were constrained to their bulk positions, as illustrated in Figure 1. The top trilayer was relaxed to capture adsorption-induced effects, while the bottom two trilayers were fixed to bulk positions, consistent with studies showing minimal subsurface relaxation influence [6,30]. Our calculated structural parameters demonstrate excellent agreement with both the experimental surface X-ray diffraction (SXRD) measurements and DFT values reported by Treacy et al. [31]. Specifically, our computed lattice parameters (a = 10.26 Å, b = 3.71 Å) closely match the SXRD measurements (a = 10.23 Å, b = 3.79 Å). The atomic displacements within the first trilayer, as illustrated in Figure 1 and quantified in Table 1, show strong concordance with the SXRD experimental data. The only notable exception is the O2 atom, which exhibits a somewhat larger displacement in our calculations; however, this finding aligns with the DFT results obtained by Treacy et al. This structural consistency validates the robustness of our computational framework for modeling the anatase TiO2 (101) surface.
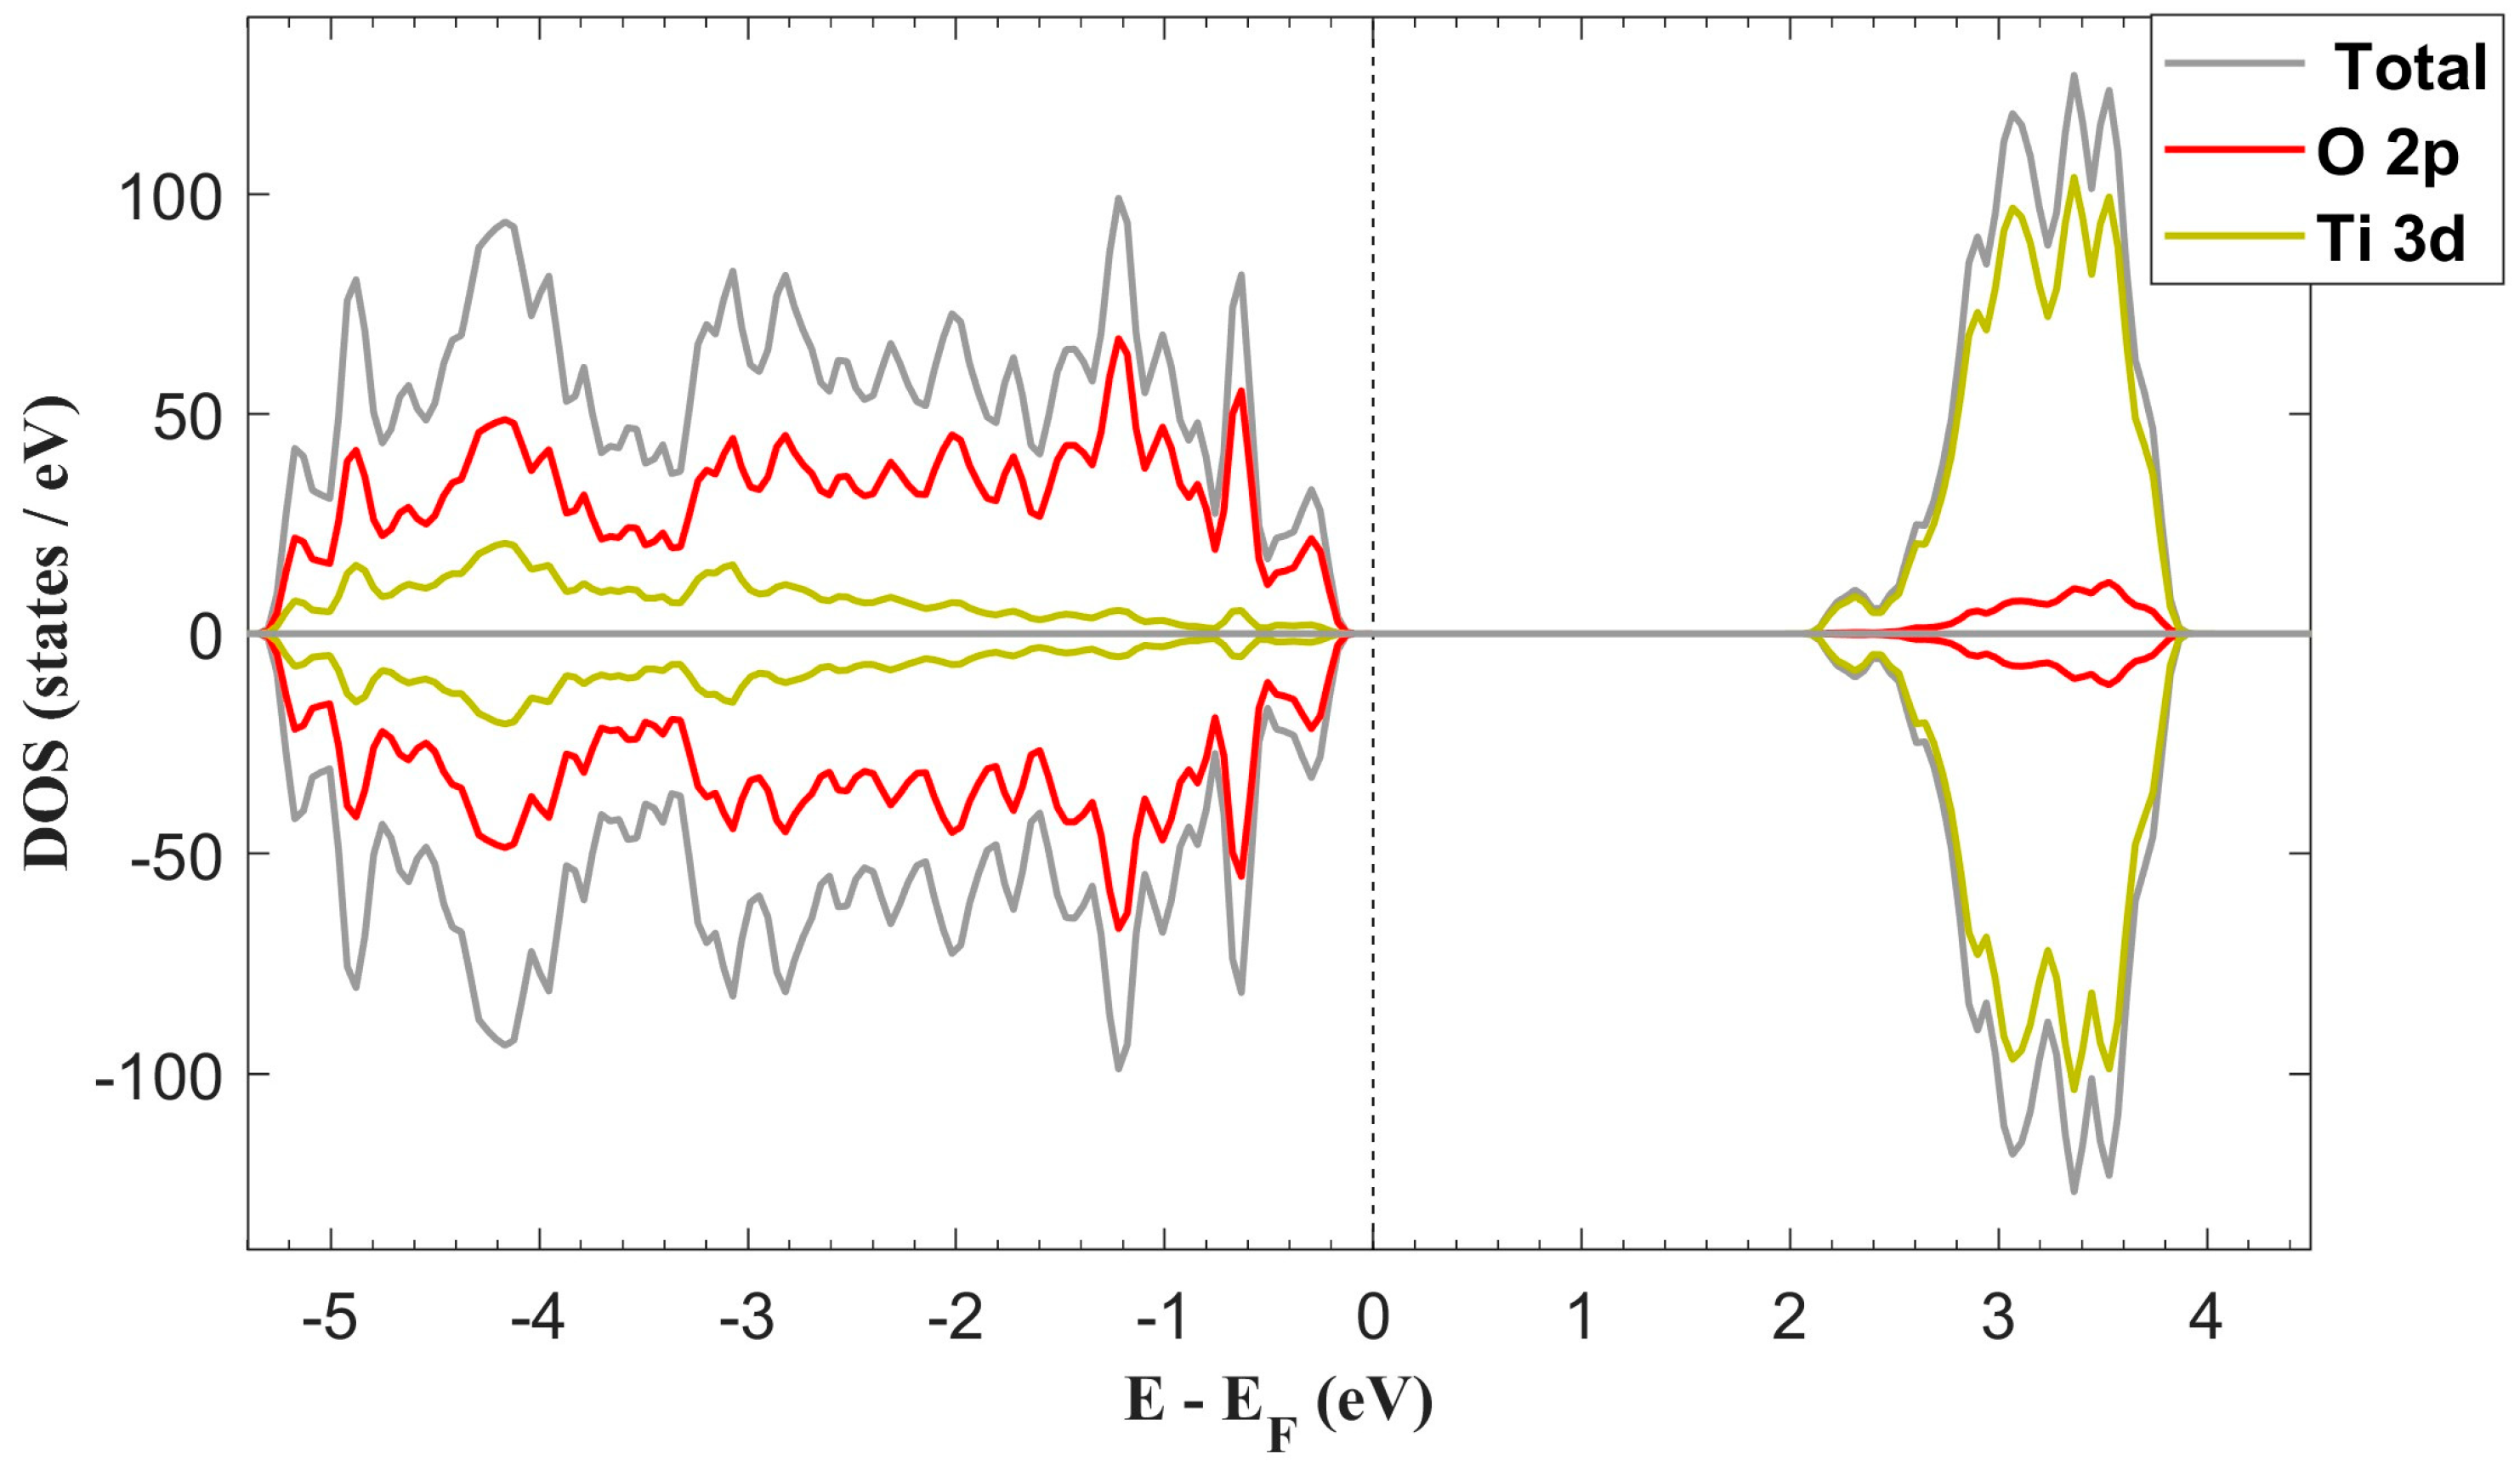
The computed total density of states (DOS) of the pristine surface is presented in Figure 2. It can observe hybridization between O 2p and 3d states in the valence band (VB) with major contributions of O 2p states. In the case of the conduction band (CB), it is primarily constituted of Ti 3d states, with a small contribution from O 2p states. This composition is consistent with previous works [32,33].
The computed band gap width was 2.05 eV, which is smaller than the well-established value of 3.2 eV for bulk anatase TiO2. This underestimation is a known limitation of DFT methodologies. To address this issue, we implemented the Generalized Gradient Approximation plus Hubbard U (GGA + U) approach with U = 3.5 eV. After introducing the U value of 3.5 eV for Ti, we observe only a modest improvement in the calculated band gap of the TiO2 component, increasing from 2.05 eV to 2.27 eV, compared to the experimental band gap of ~3.2 eV for anatase TiO2. While larger U values could further widen the band gap to more closely match experimental findings, we retained U = 3.5 eV because it was previously optimized for TiO2 systems and balances multiple properties critical to our study. Higher U values, although improving the band gap, tend to overestimate lattice parameters and distort the structural integrity of TiO2 surfaces, negatively impacting the accuracy of adsorption energies and geometries for the TiO2 + CuSO4 system.

2.2. Free Molecule

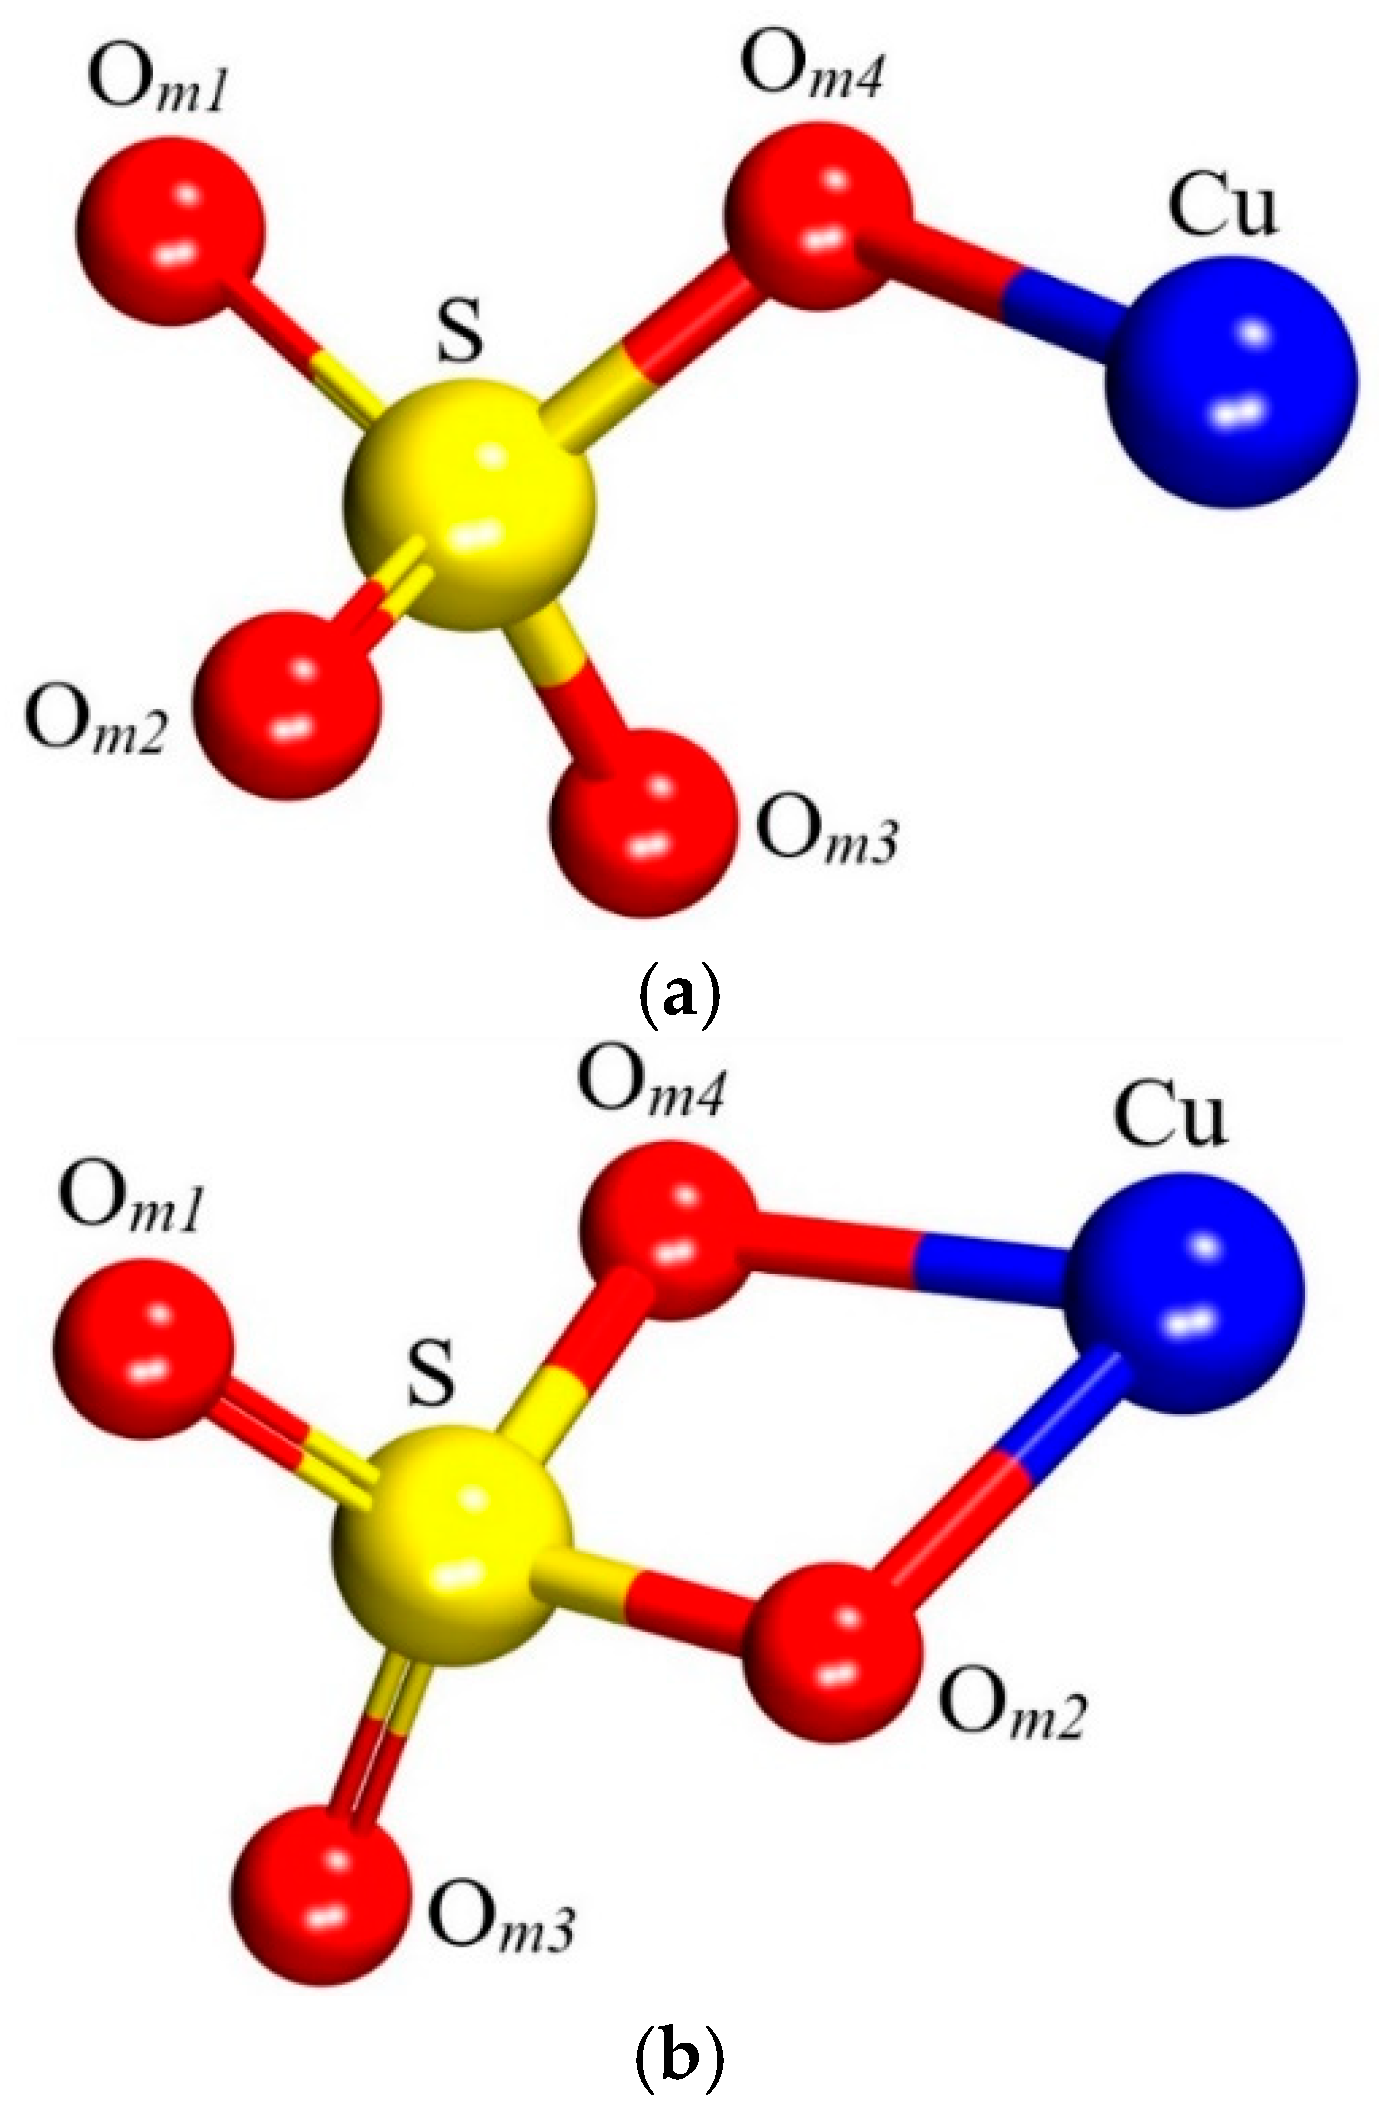
The anhydrous form of CuSO4 was selected to model the molecule, as it simplifies the adsorption study by avoiding the complexity introduced by hydration water molecules. This approach allows for a more direct evaluation of the interaction between CuSO4 and the TiO2 (101) surface, minimizing computational cost and focusing on the fundamental adsorption mechanisms, with its initial geometry based on the experimental crystallographic data reported by Wildner and Giester [34]. The free molecule was constructed by positioning it at the center of a 15 × 15 × 15 Å3 cubic supercell and subjecting it to full atomic relaxation. The optimized molecular structure is presented in Figure 3 and Table 2.
The atomic relaxation within this model led to the approximation of Cu and its nearest O atom, designated as Om2. Prior to optimization, these atoms were separated by 3.25 Å, and afterwards, the distance is found to be 1.85 Å, indicating significant structural relaxation. The initial geometry of the CuSO4 molecule was derived from the bulk crystalline structure of chalcocyanite (CuSO4). In this bulk structure, the Cu–O distances within the CuSO4 unit, such as the 3.25 Å separation noted here, reflect the influence of the crystalline environment, including coordination with oxygen atoms from adjacent units.
For this study, a single CuSO4 unit was extracted from chalcocyanite and placed in a large cubic simulation cell (15 × 15 × 15 Å3) to model the free molecule in a gas-phase environment, devoid of periodic lattice effects. During optimization, the Cu–O distance contracted to 1.85 Å, consistent with the expected adjustment to an isolated molecule, where the absence of bulk coordination allows for shorter, energetically favorable bonds. This transition from the bulk-derived starting geometry to the relaxed gas-phase structure underscores the impact of the local environment on the structural parameters of the molecule, aligning with our objective to investigate the properties of free CuSO4.

2.3. Adsorption on Anatase TiO2 (101) Surface

The anatase phase of TiO2 is widely recognized as the most prevalent form in photovoltaic applications [35], with the (101) surface being particularly significant due to its thermodynamic stability [36]. Consequently, this study employs the anatase TiO2 (101) surface as the substrate for investigating the adsorption behavior of CuSO4.
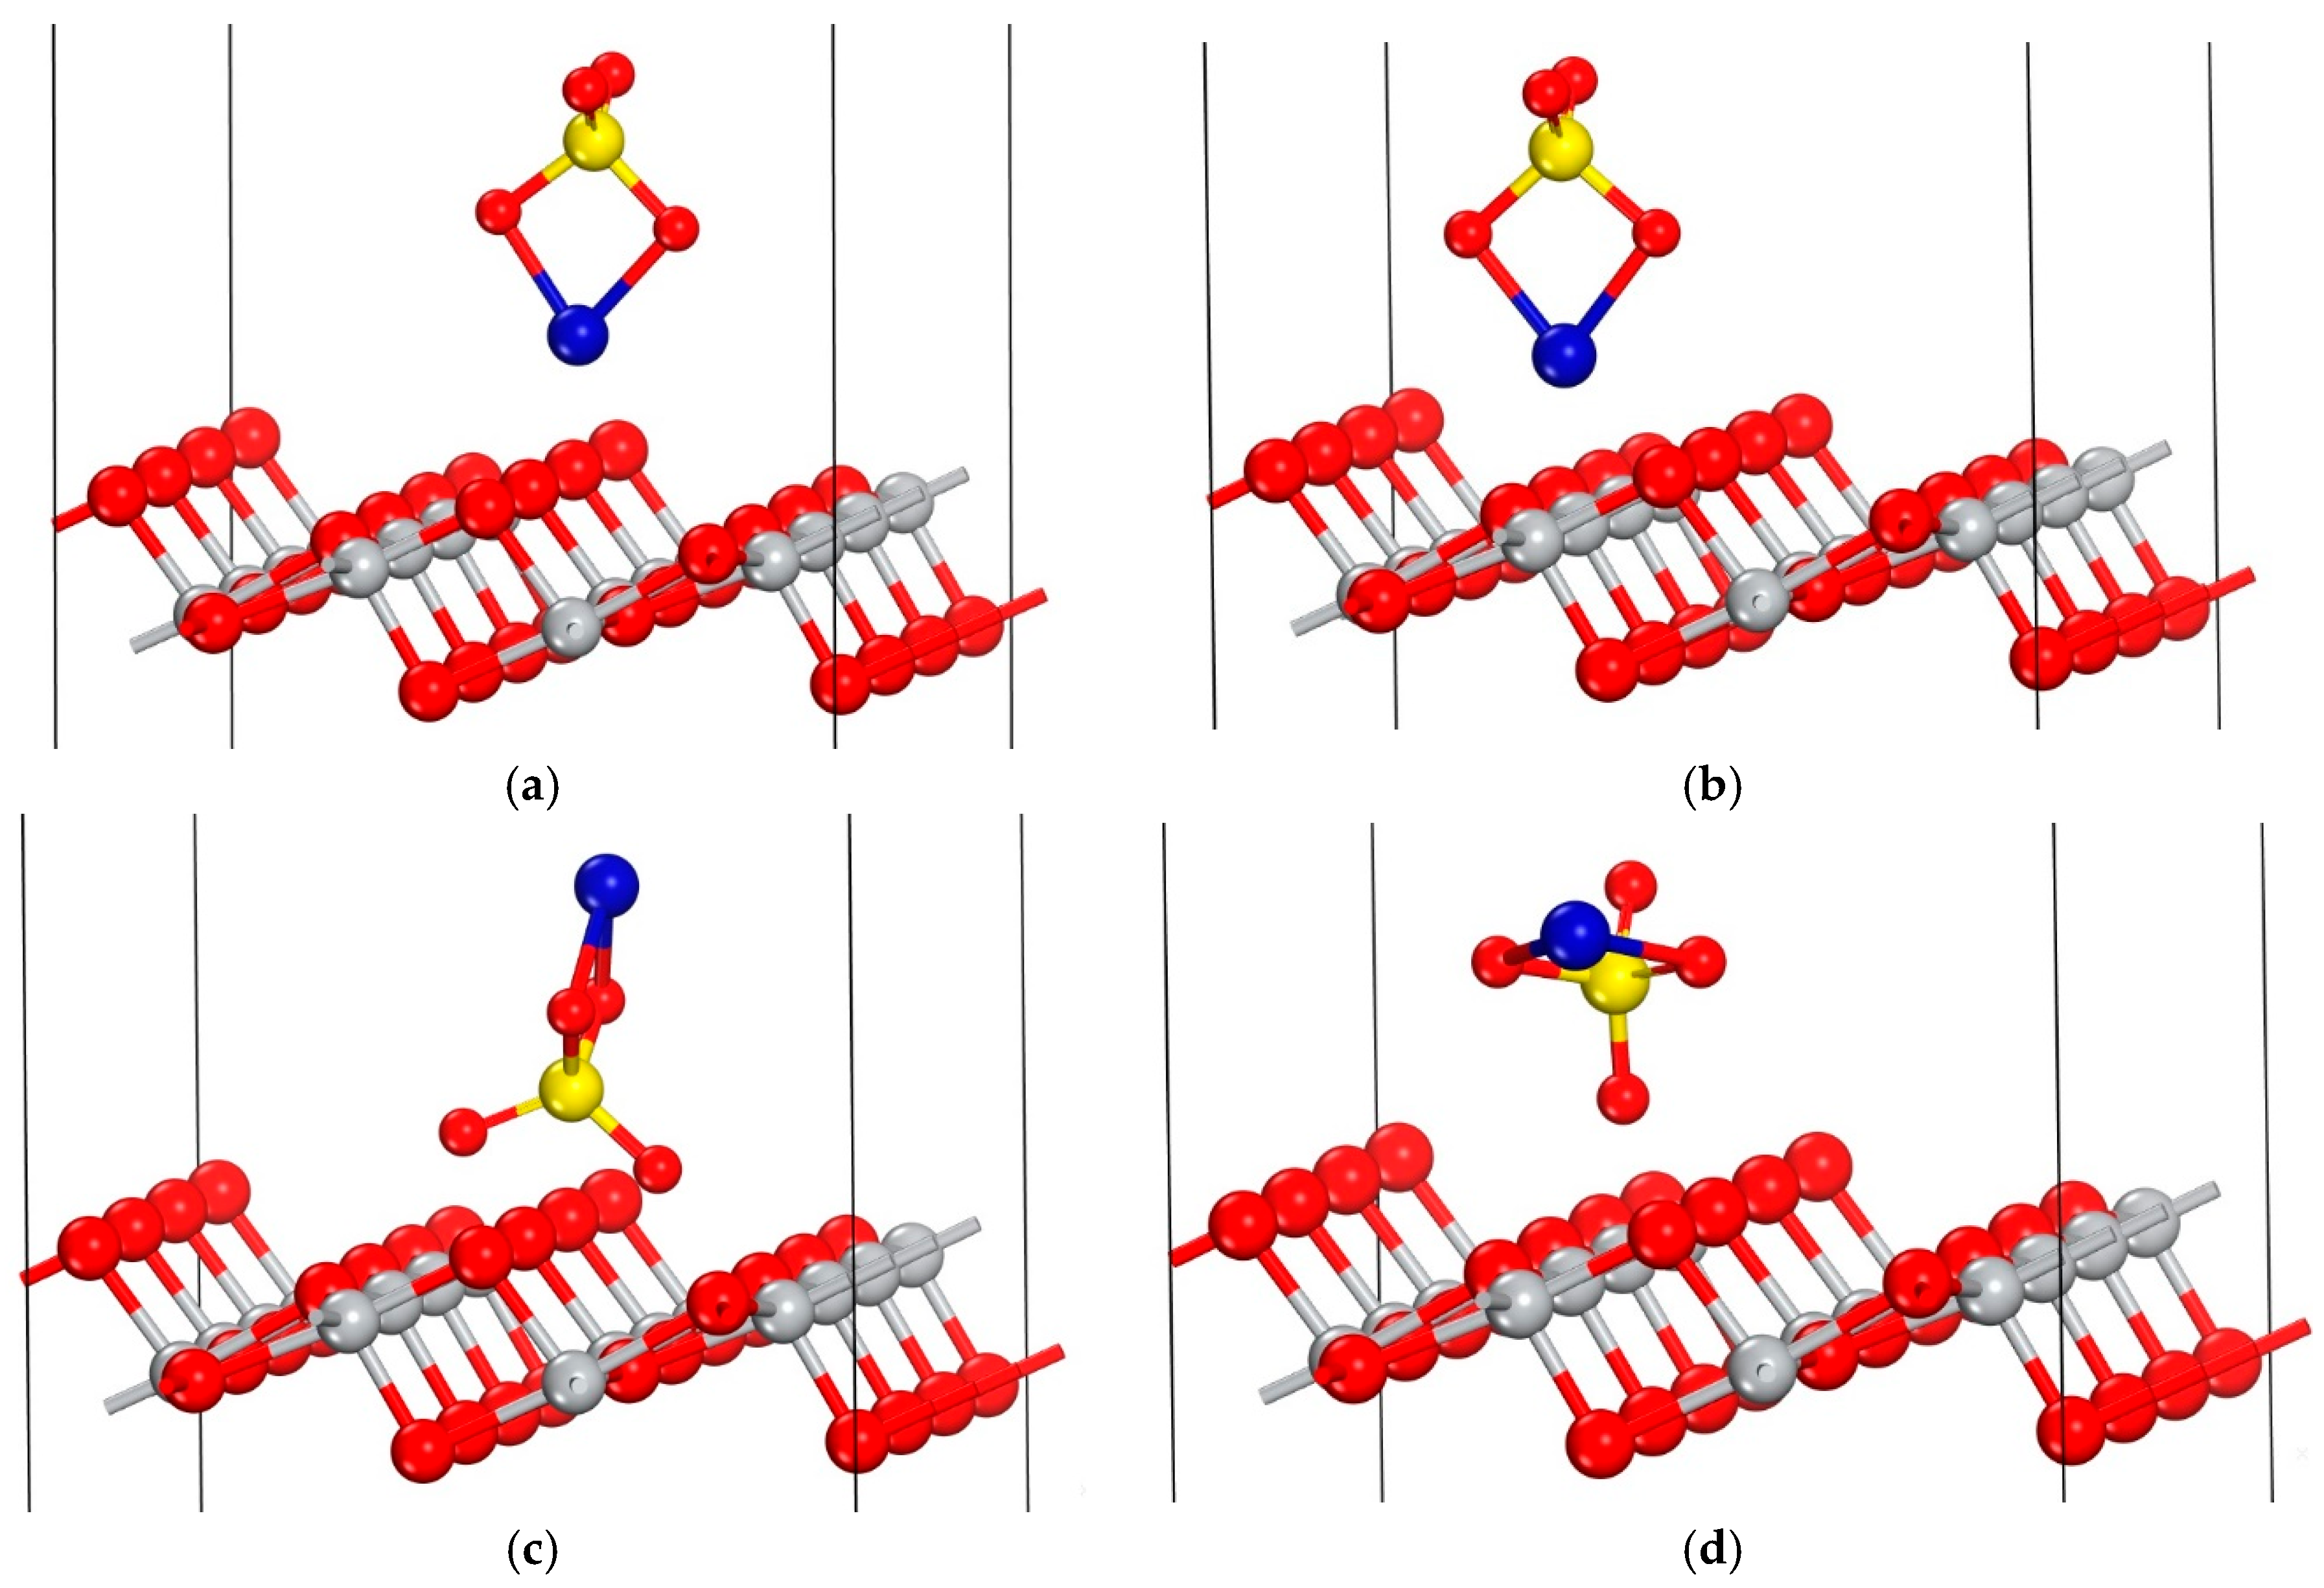
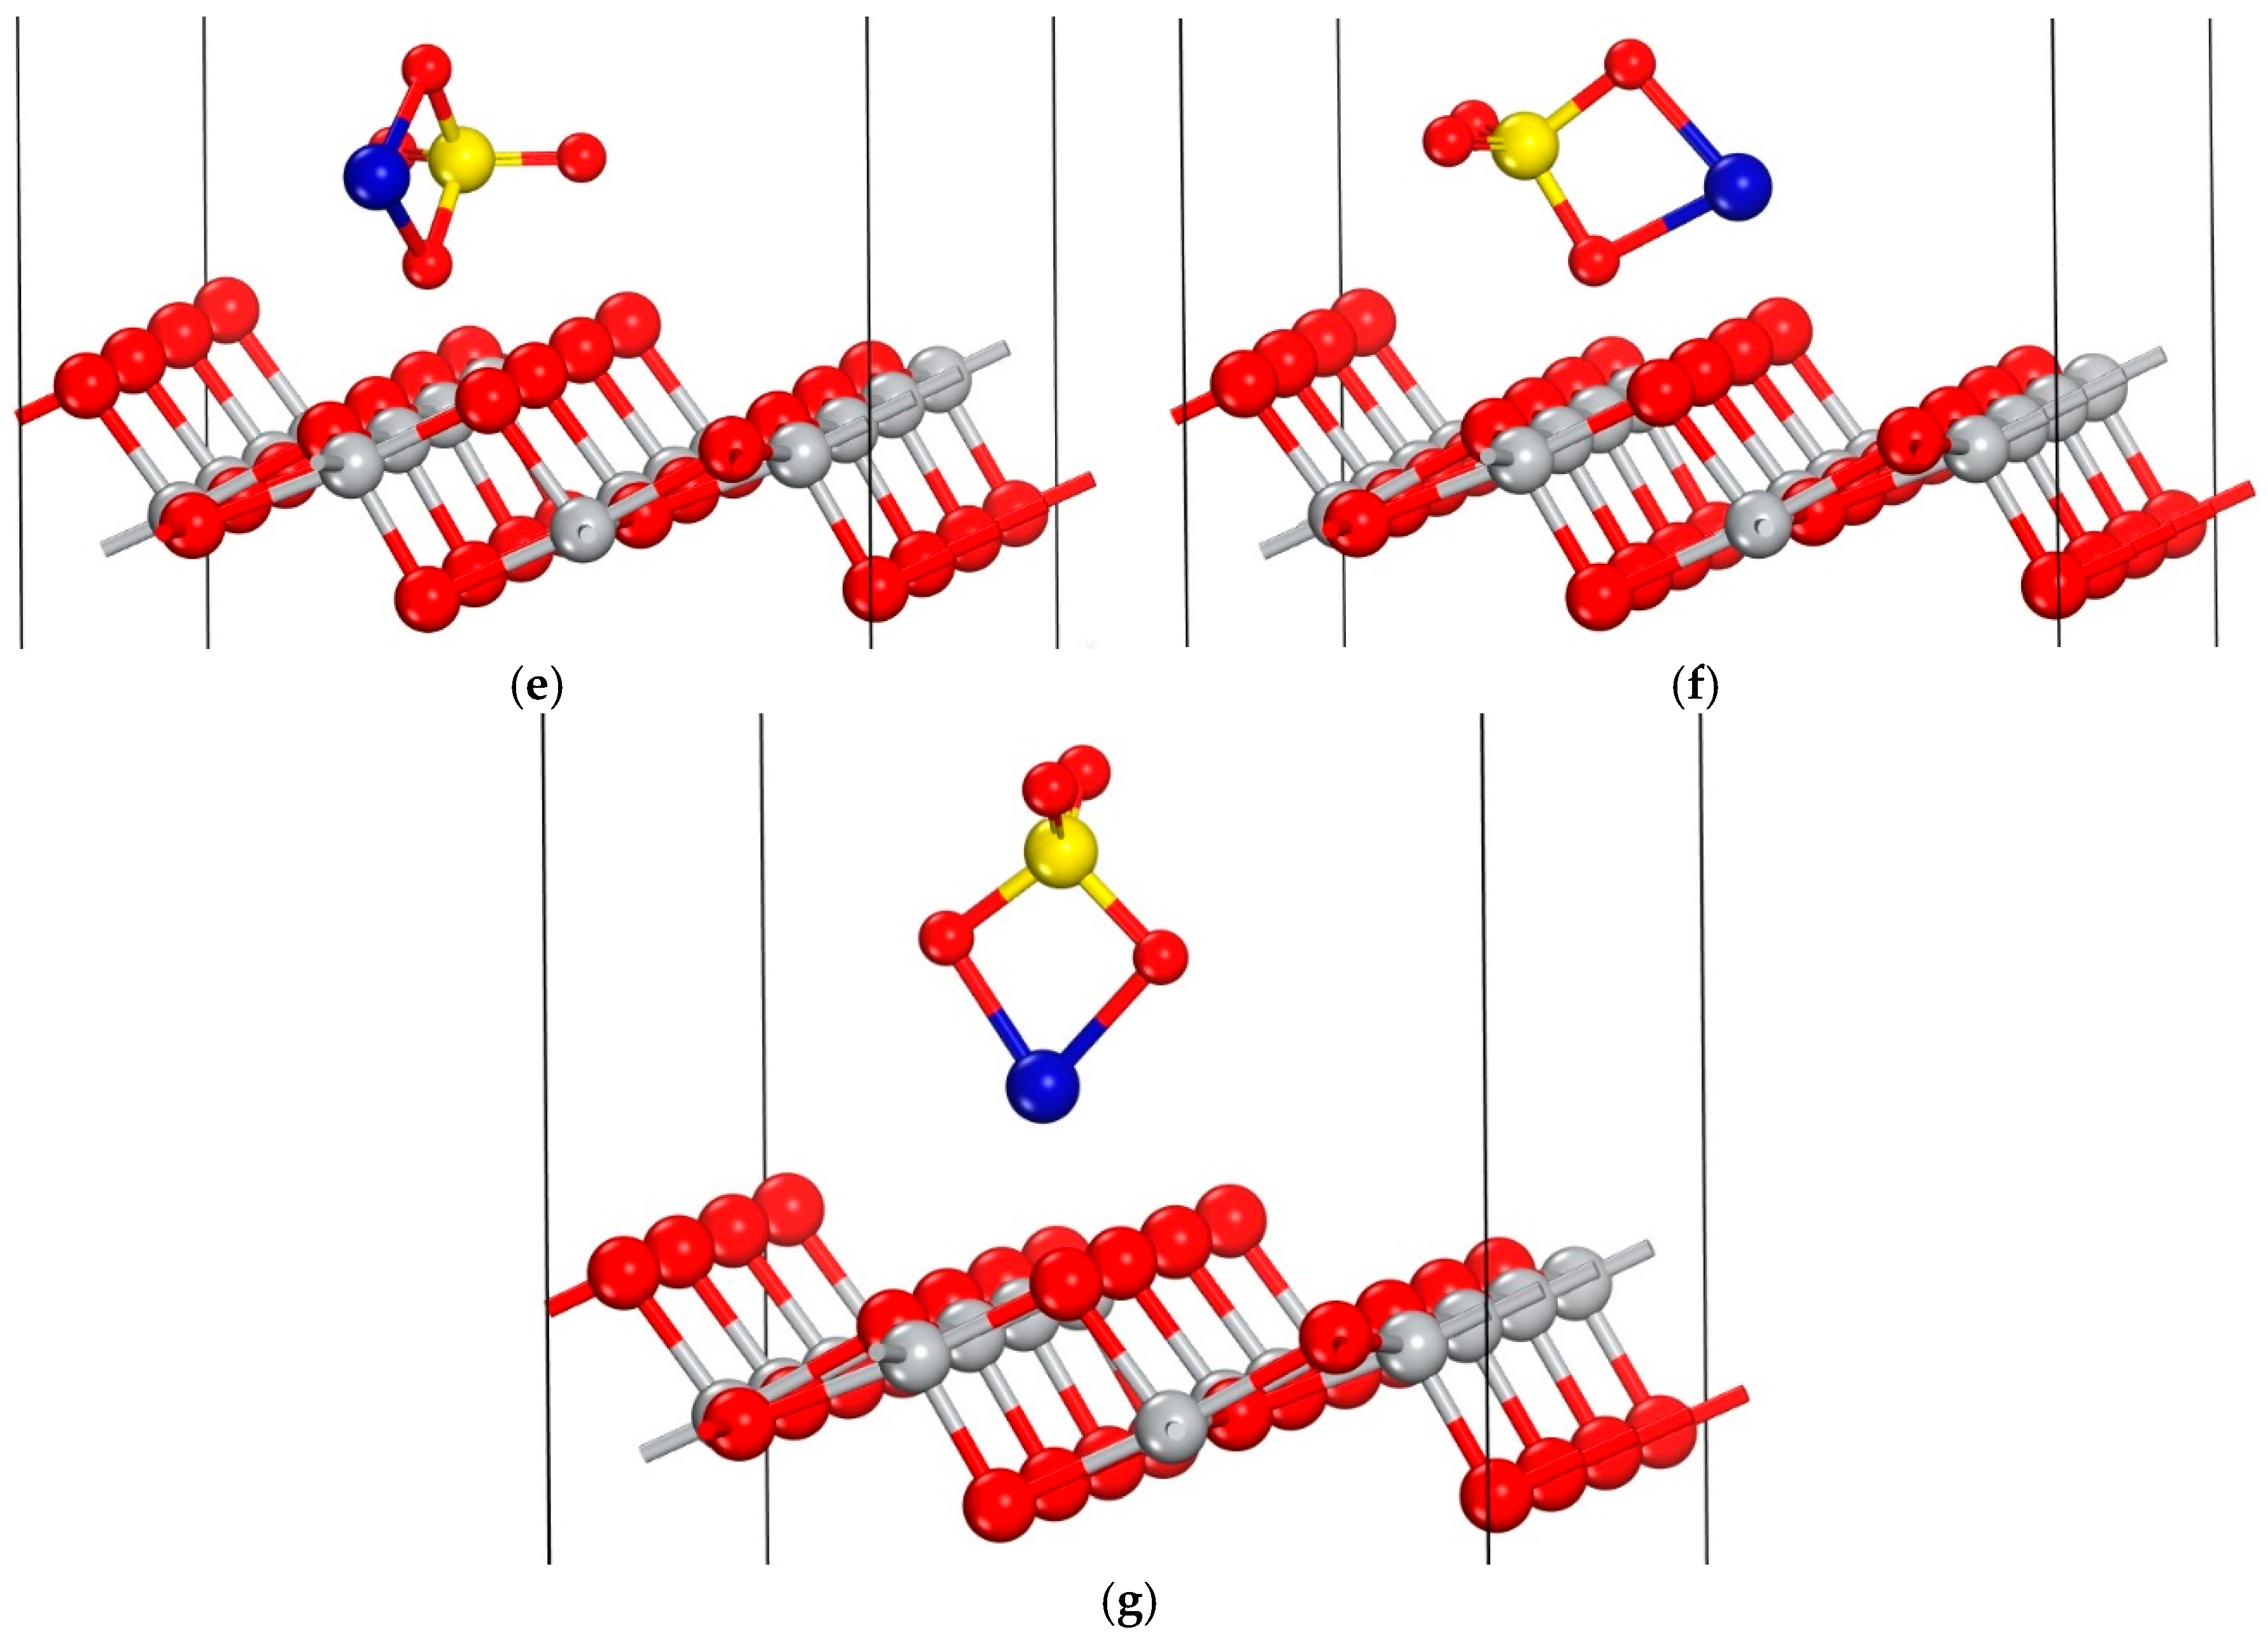
To determine the optimal adsorption geometry of CuSO4 on the anatase TiO2 (101) surface, seven distinct initial orientations of the CuSO4 molecule were systematically explored, each positioned over different adsorption sites on the surface. These initial configurations are illustrated in Figure 4.
Following the initial placement of the CuSO4 molecule, a comprehensive atomic relaxation was performed. This optimization procedure was conducted without imposing any constraints on the atomic displacements of both the adsorbed molecule and the atoms within the uppermost trilayer of the TiO2 surface. Upon completion of the geometry optimization, the adsorption energy (Eads) for each configuration was calculated using the following equation:
E a d s = E s u r f + m o l E s u r f E f r e e m o l
where E s u r f + m o l refers to energy of the surface with the adsorbate, and E s u r f is the energy of the pristine surface while E f r e e m o l represents the energy of the free molecule. Computed adsorption energies are shown in Table 3.
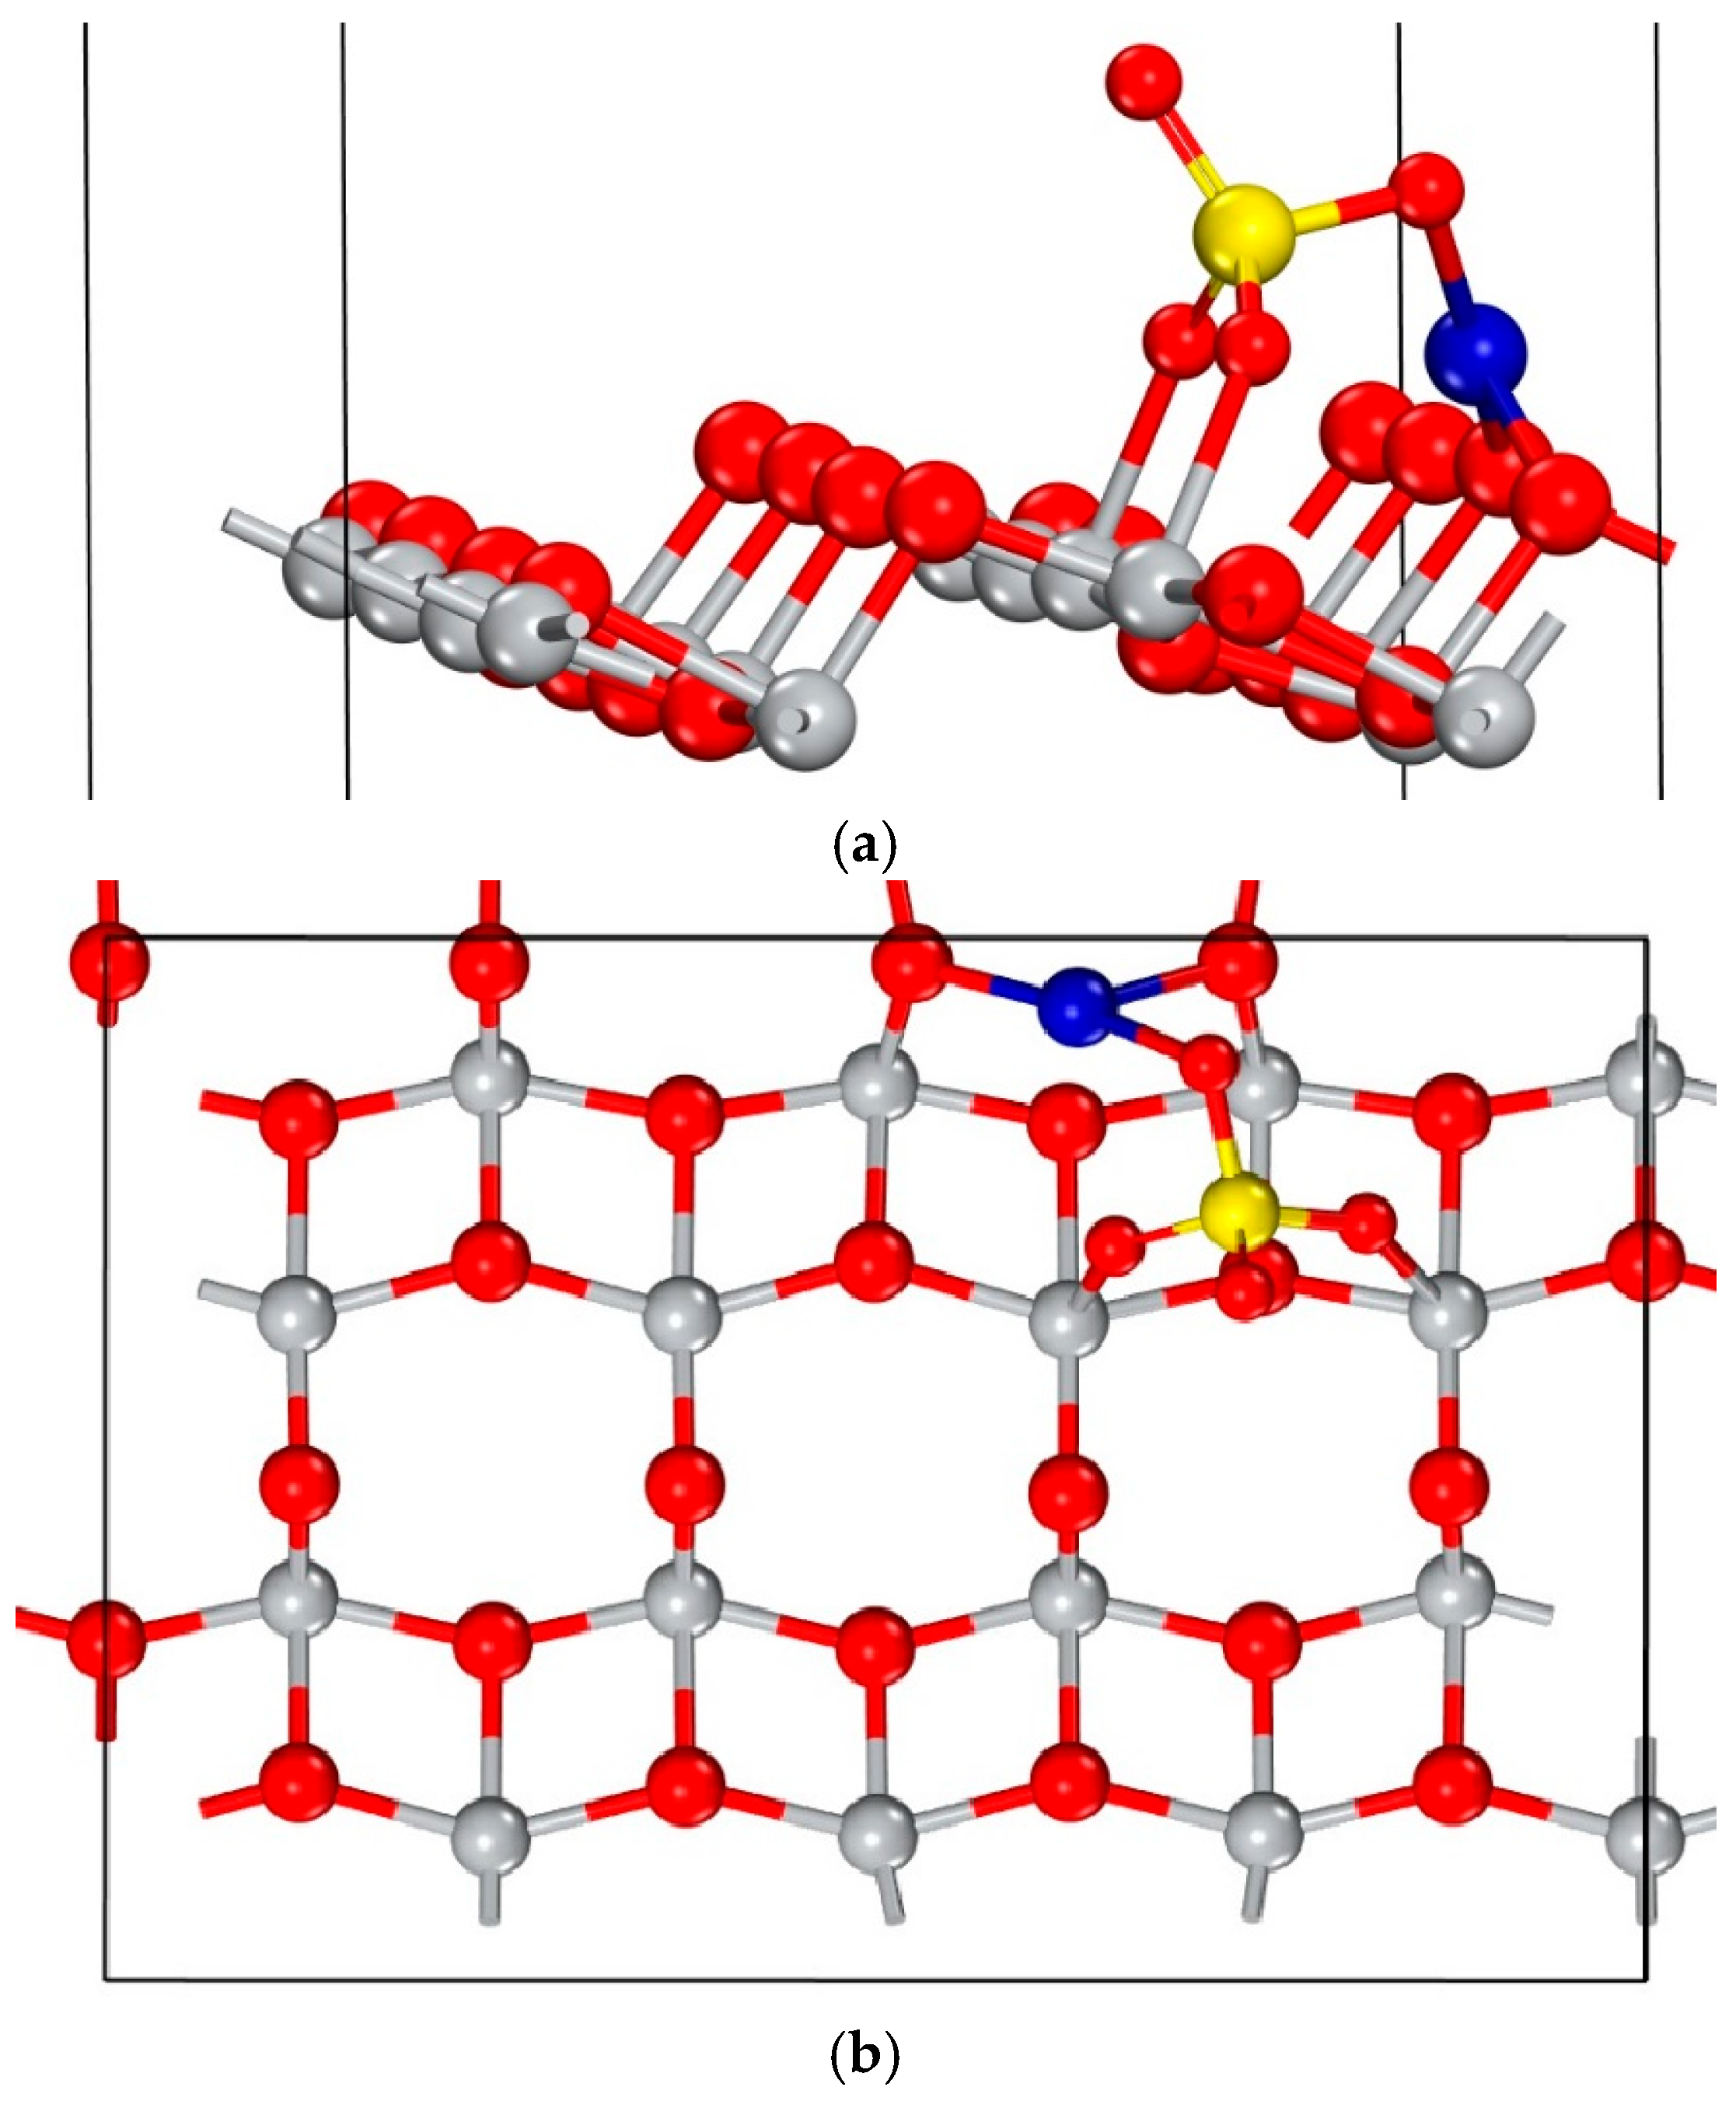
As can be observed in Table 3, configurations that achieved the lowest adsorption energies are b, d, and f, all of which reach an identical adsorption structure after full geometric optimization. These configurations converge to the same final structure, reinforcing the robustness of the adsorption process. The second most favorable configuration was e, which is depicted in Figure 5.
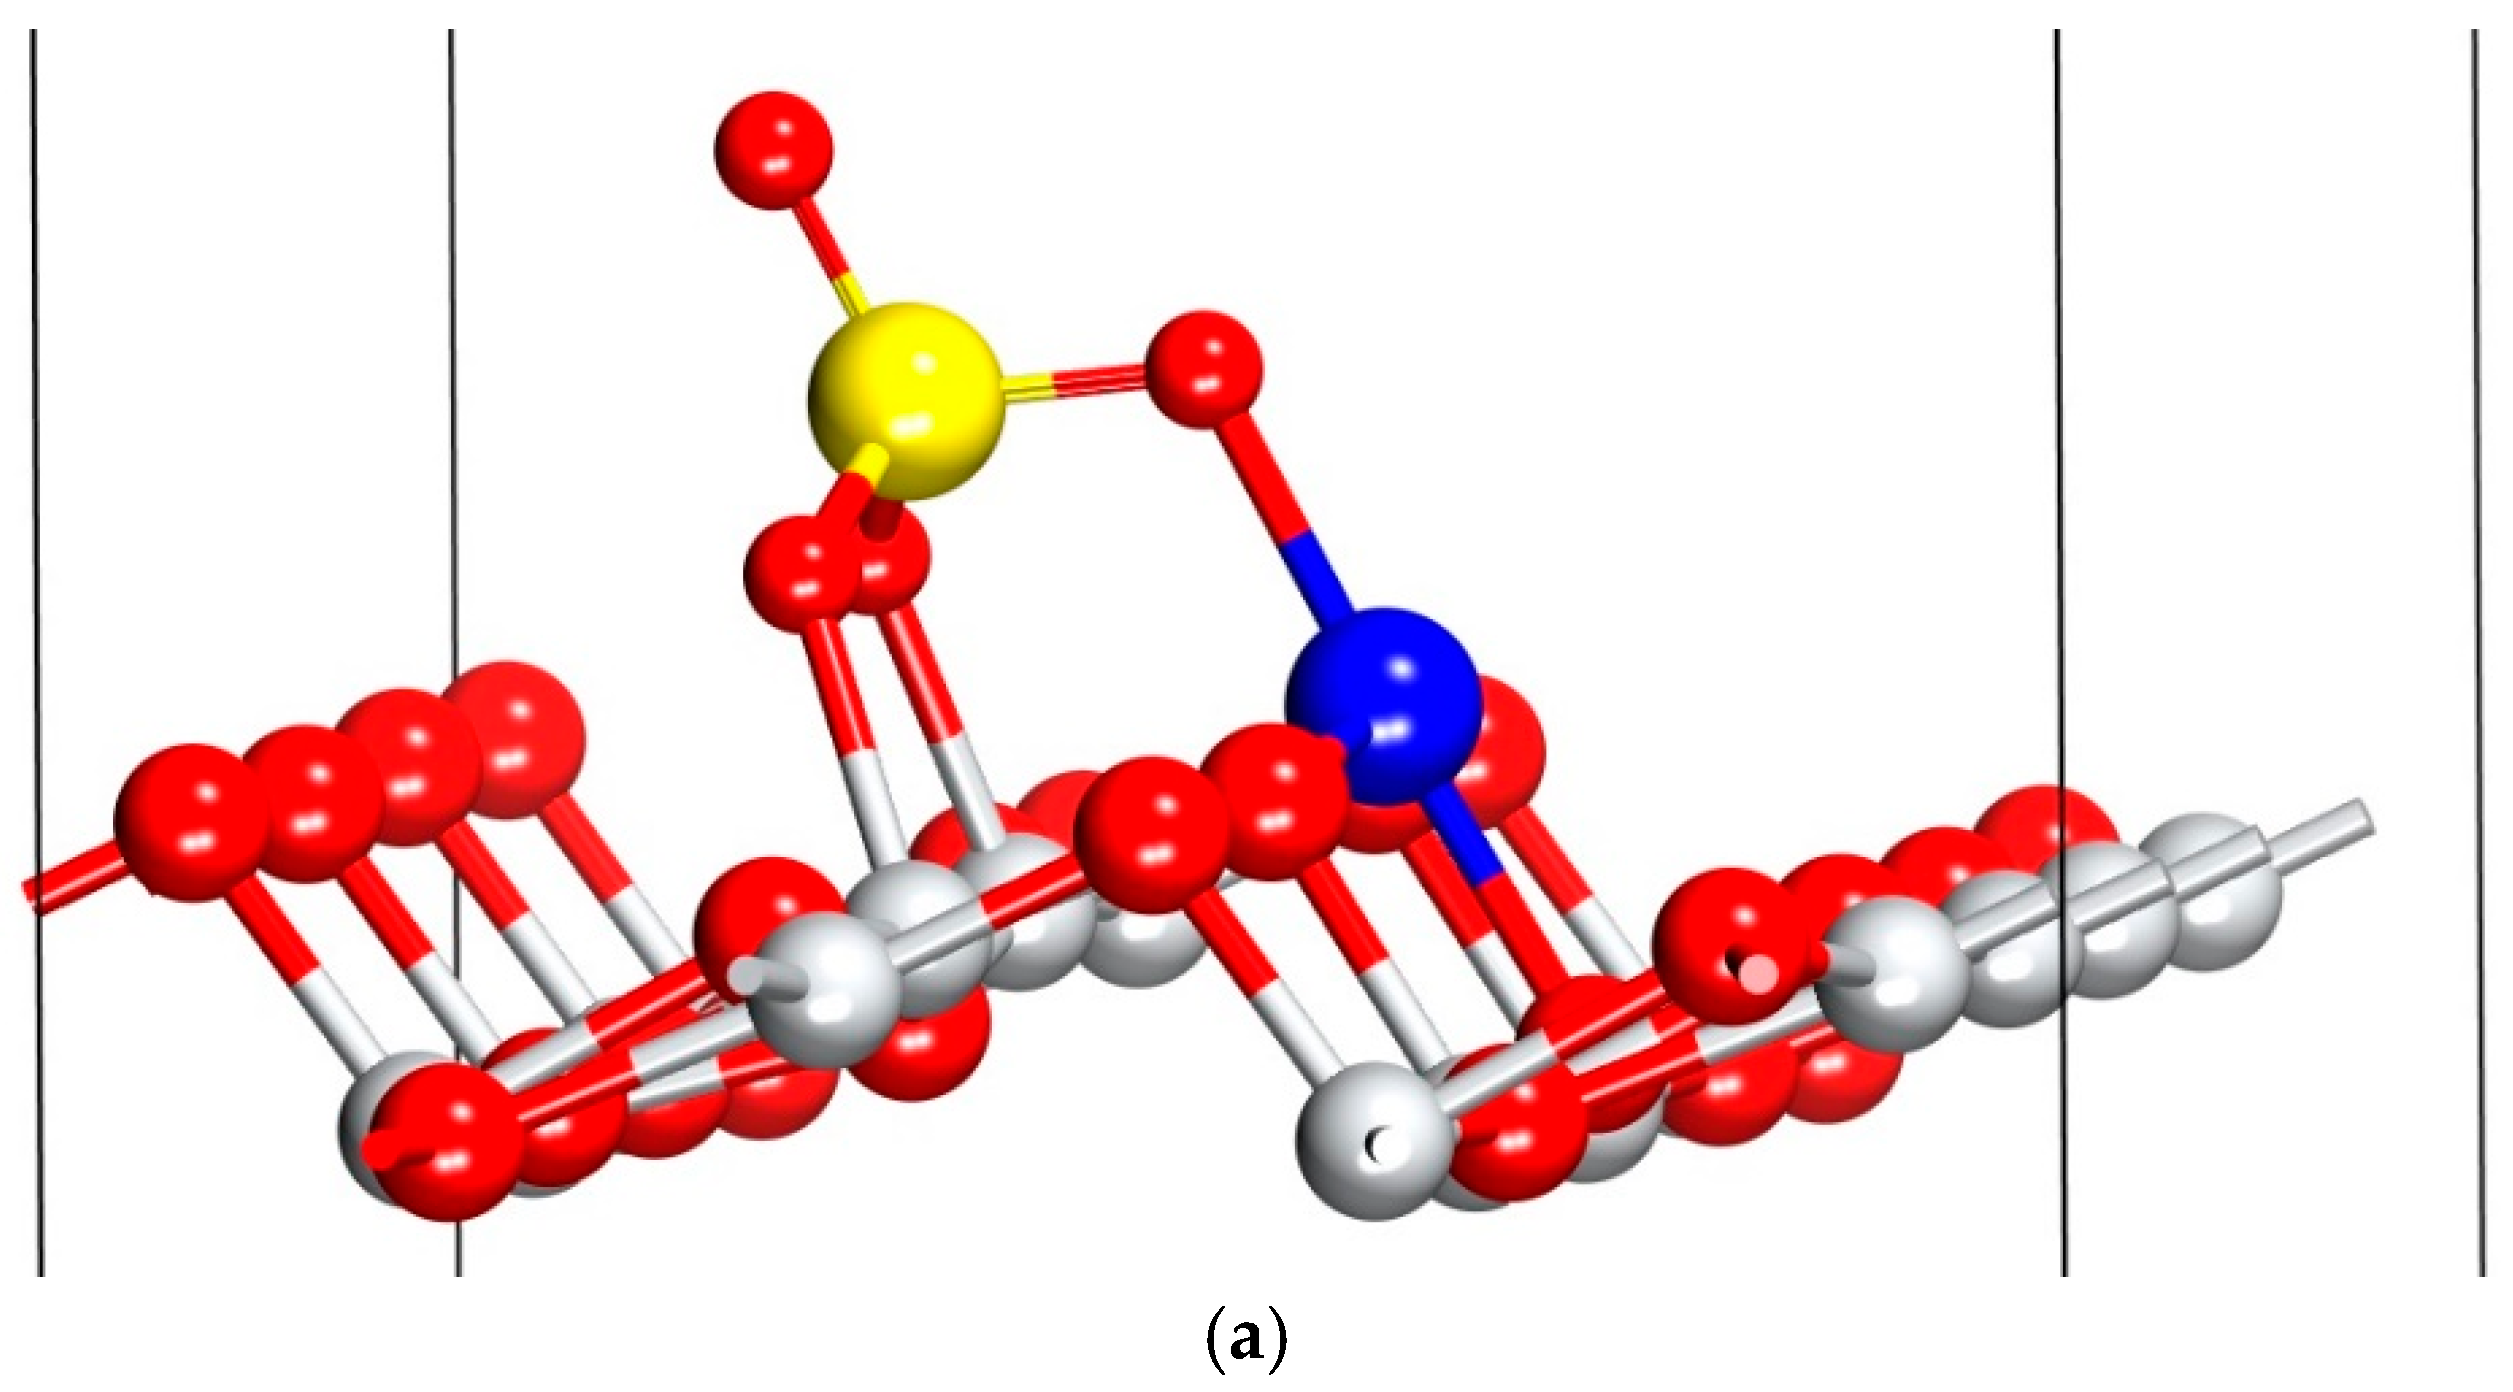
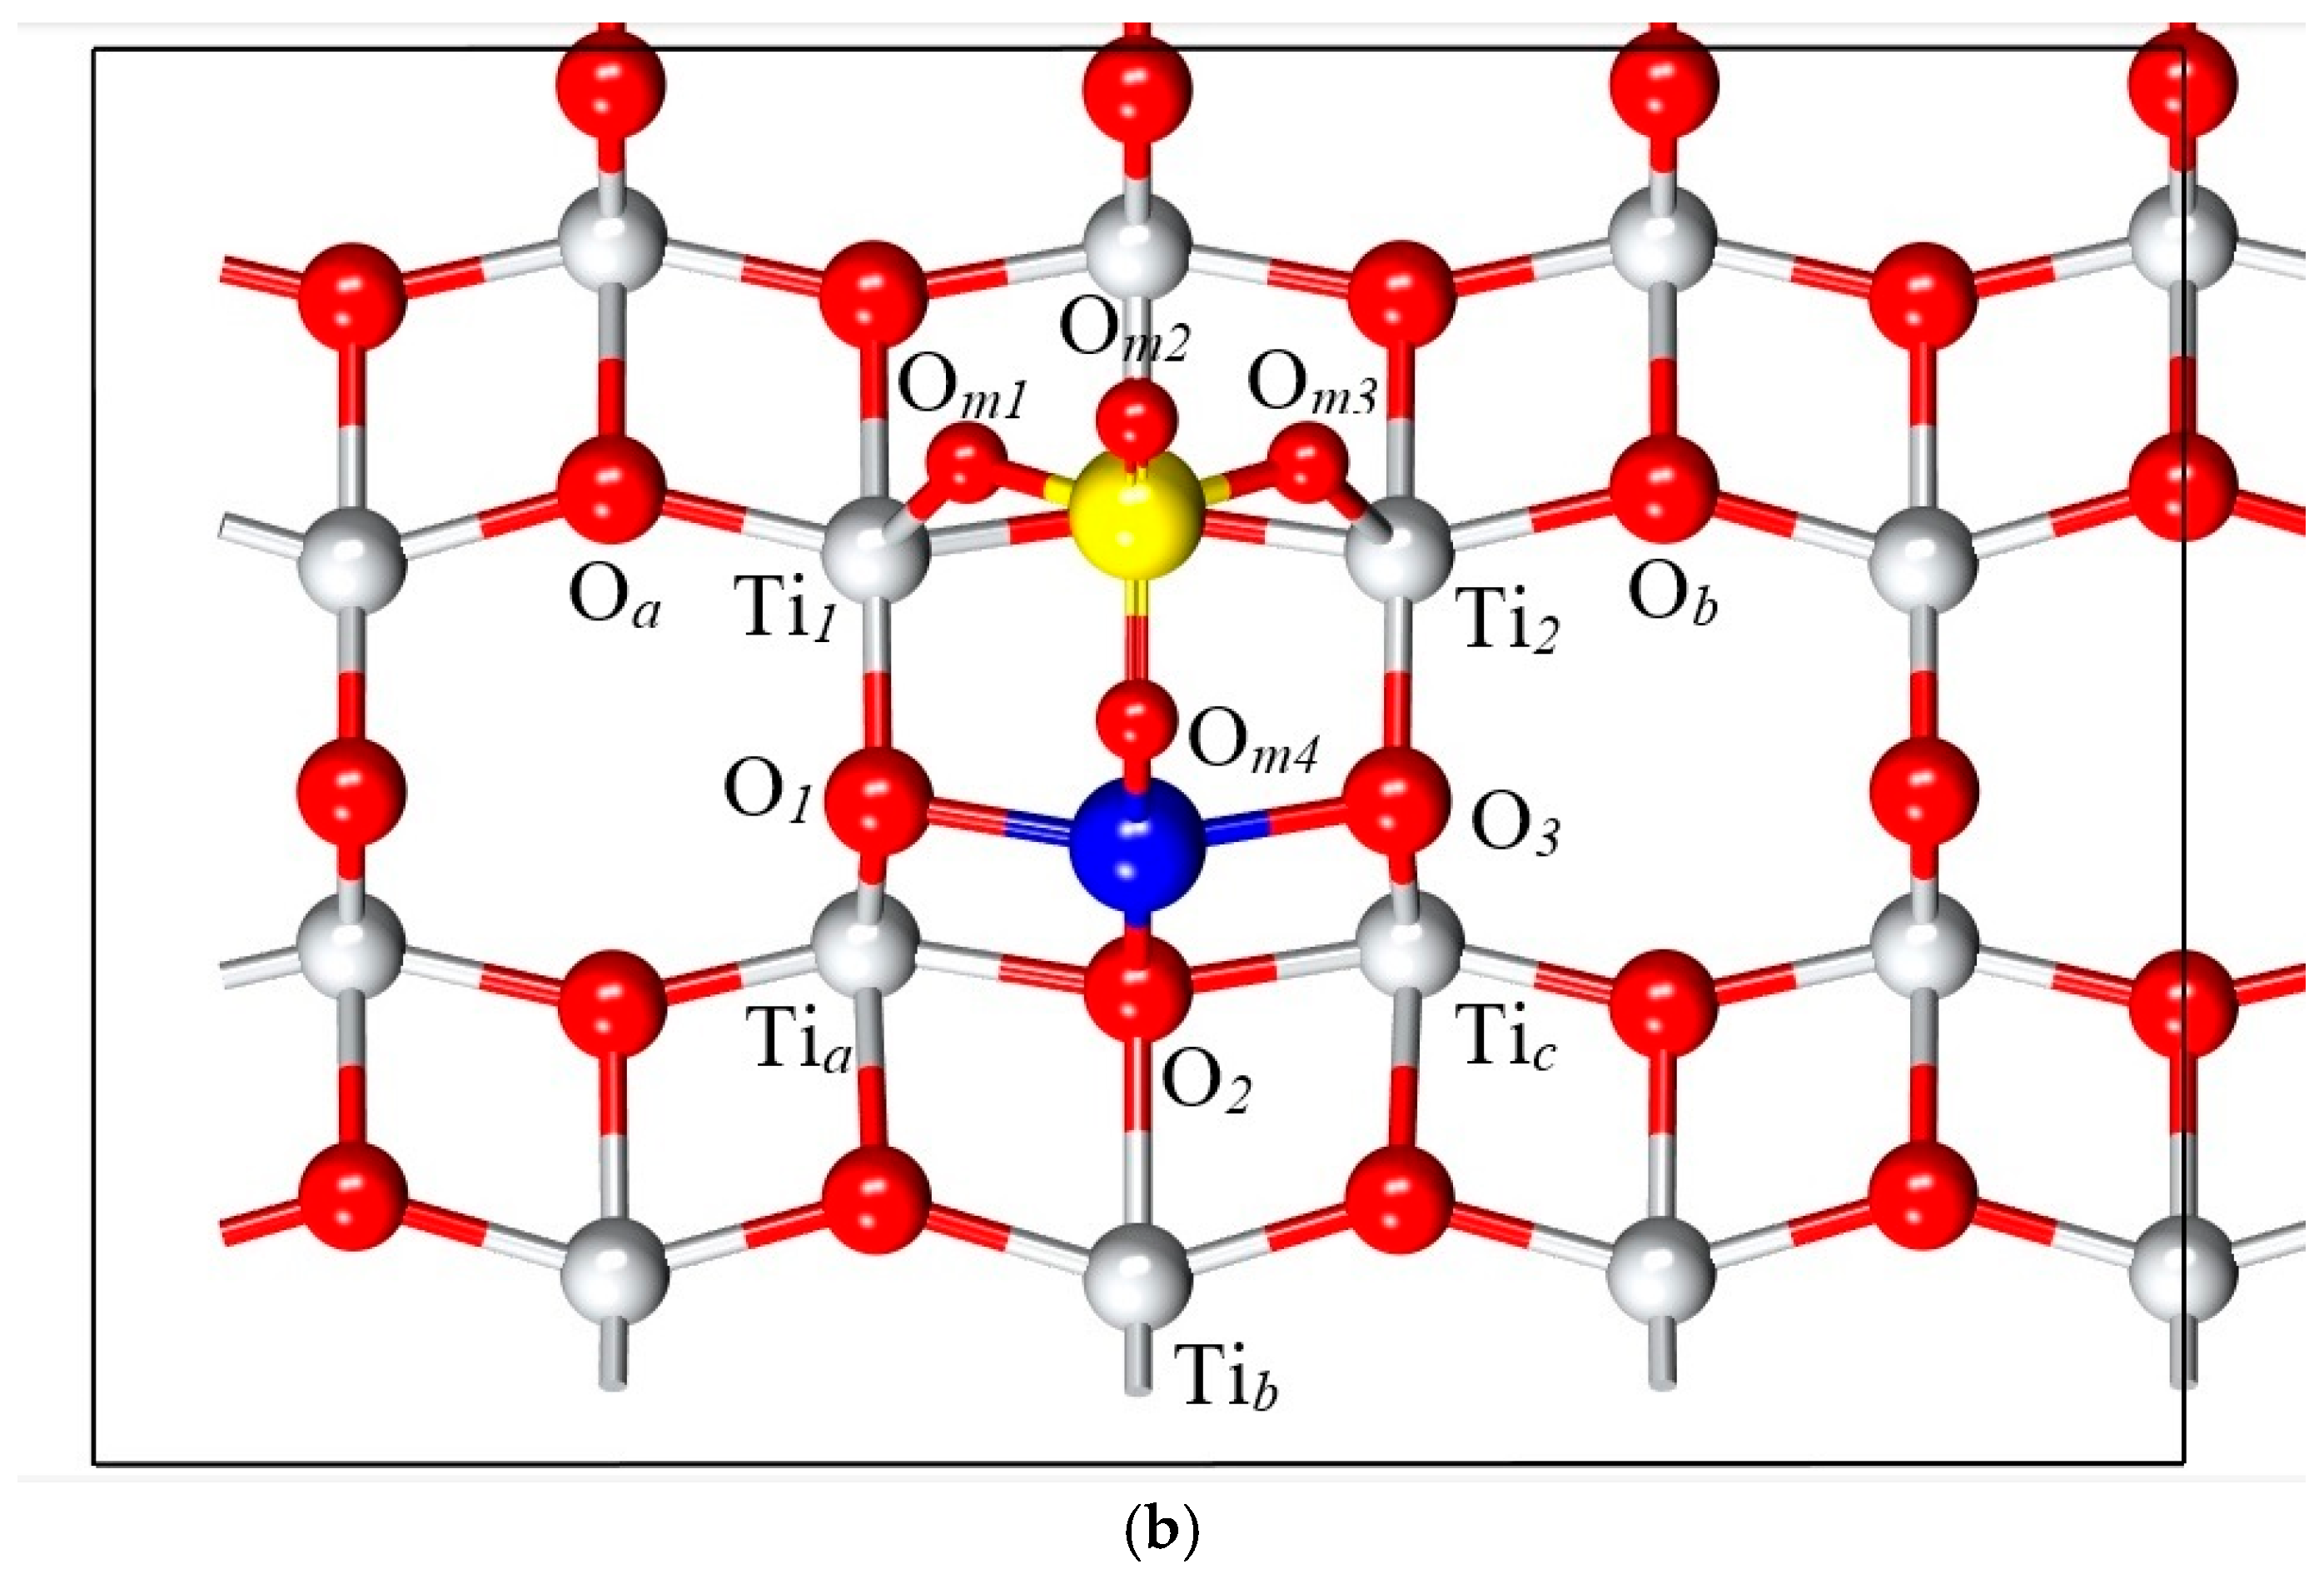
However, the adsorption geometry with the lowest adsorption energy corresponds to configurations b, d, and f, which has been selected for further analysis due to its higher likelihood of occurrence. Its structure closely resembles configuration e, as is illustrated in Figure 6.
Figure 6 illustrates the resulting structure of the adsorption process, highlighting the formation of bonds between the molecule and the surface, which indicates a chemisorption mechanism. Notably, the molecule binds to the surface through its oxygen and copper atoms. This interaction significantly alters the geometry of both the molecule and the uppermost surface layers, inducing atomic displacements in these regions. To quantify these changes, the interatomic distances and angles of the atoms labeled in Figure 6b were measured and are presented in Table 4. The newly formed bonds are between Om1 and Om3 of the molecule with Ti1 and Ti2 on the surface, while the Cu atom interacts with surface oxygen atoms O1, O2, and O3. As a result of this process, the surface atoms tend to displace toward the molecule, predominantly in the upwards direction. Ti1 and Ti2 move about 0.13 Å, while O1 and O3 show a minor displacement of 0.03 Å. O2, located in a deeper layer, experiences a more significant displacement of 0.21 Å.
The bond length between the O1 and O2 atoms with the Cu atom is 1.94 Å which is consistent with the 1.95 Å observed in the monoclinic crystal structure of Copper (II) oxide (CuO) [37]. In the case of Om–Ti bonds measure 2.02 Å, which is close to the experimental within the bulk of 1.98 Å (Table 4) [38].
Atomic charges were calculated using Bader population analysis [39]. Table 5 presents the atomic charge redistribution upon CuSO4 adsorption onto the TiO2 surface. While initial observations suggest an increase in the atomic charge for Cu and variations in O and S, a detailed analysis indicates that these changes do not necessarily imply purely ionic bonding.
The Cu atom exhibits a slight charge increase from +1.00 e to +1.14 e, suggesting partial electron density transfer rather than full charge donation. Similarly, the oxygen atoms (Om1 and Om3) experience marginal changes, which are insufficient to confirm a purely ionic character. The sulfur atom retains a high positive charge of +3.77 e, aligning more closely with covalent bonding rather than full ionic separation.
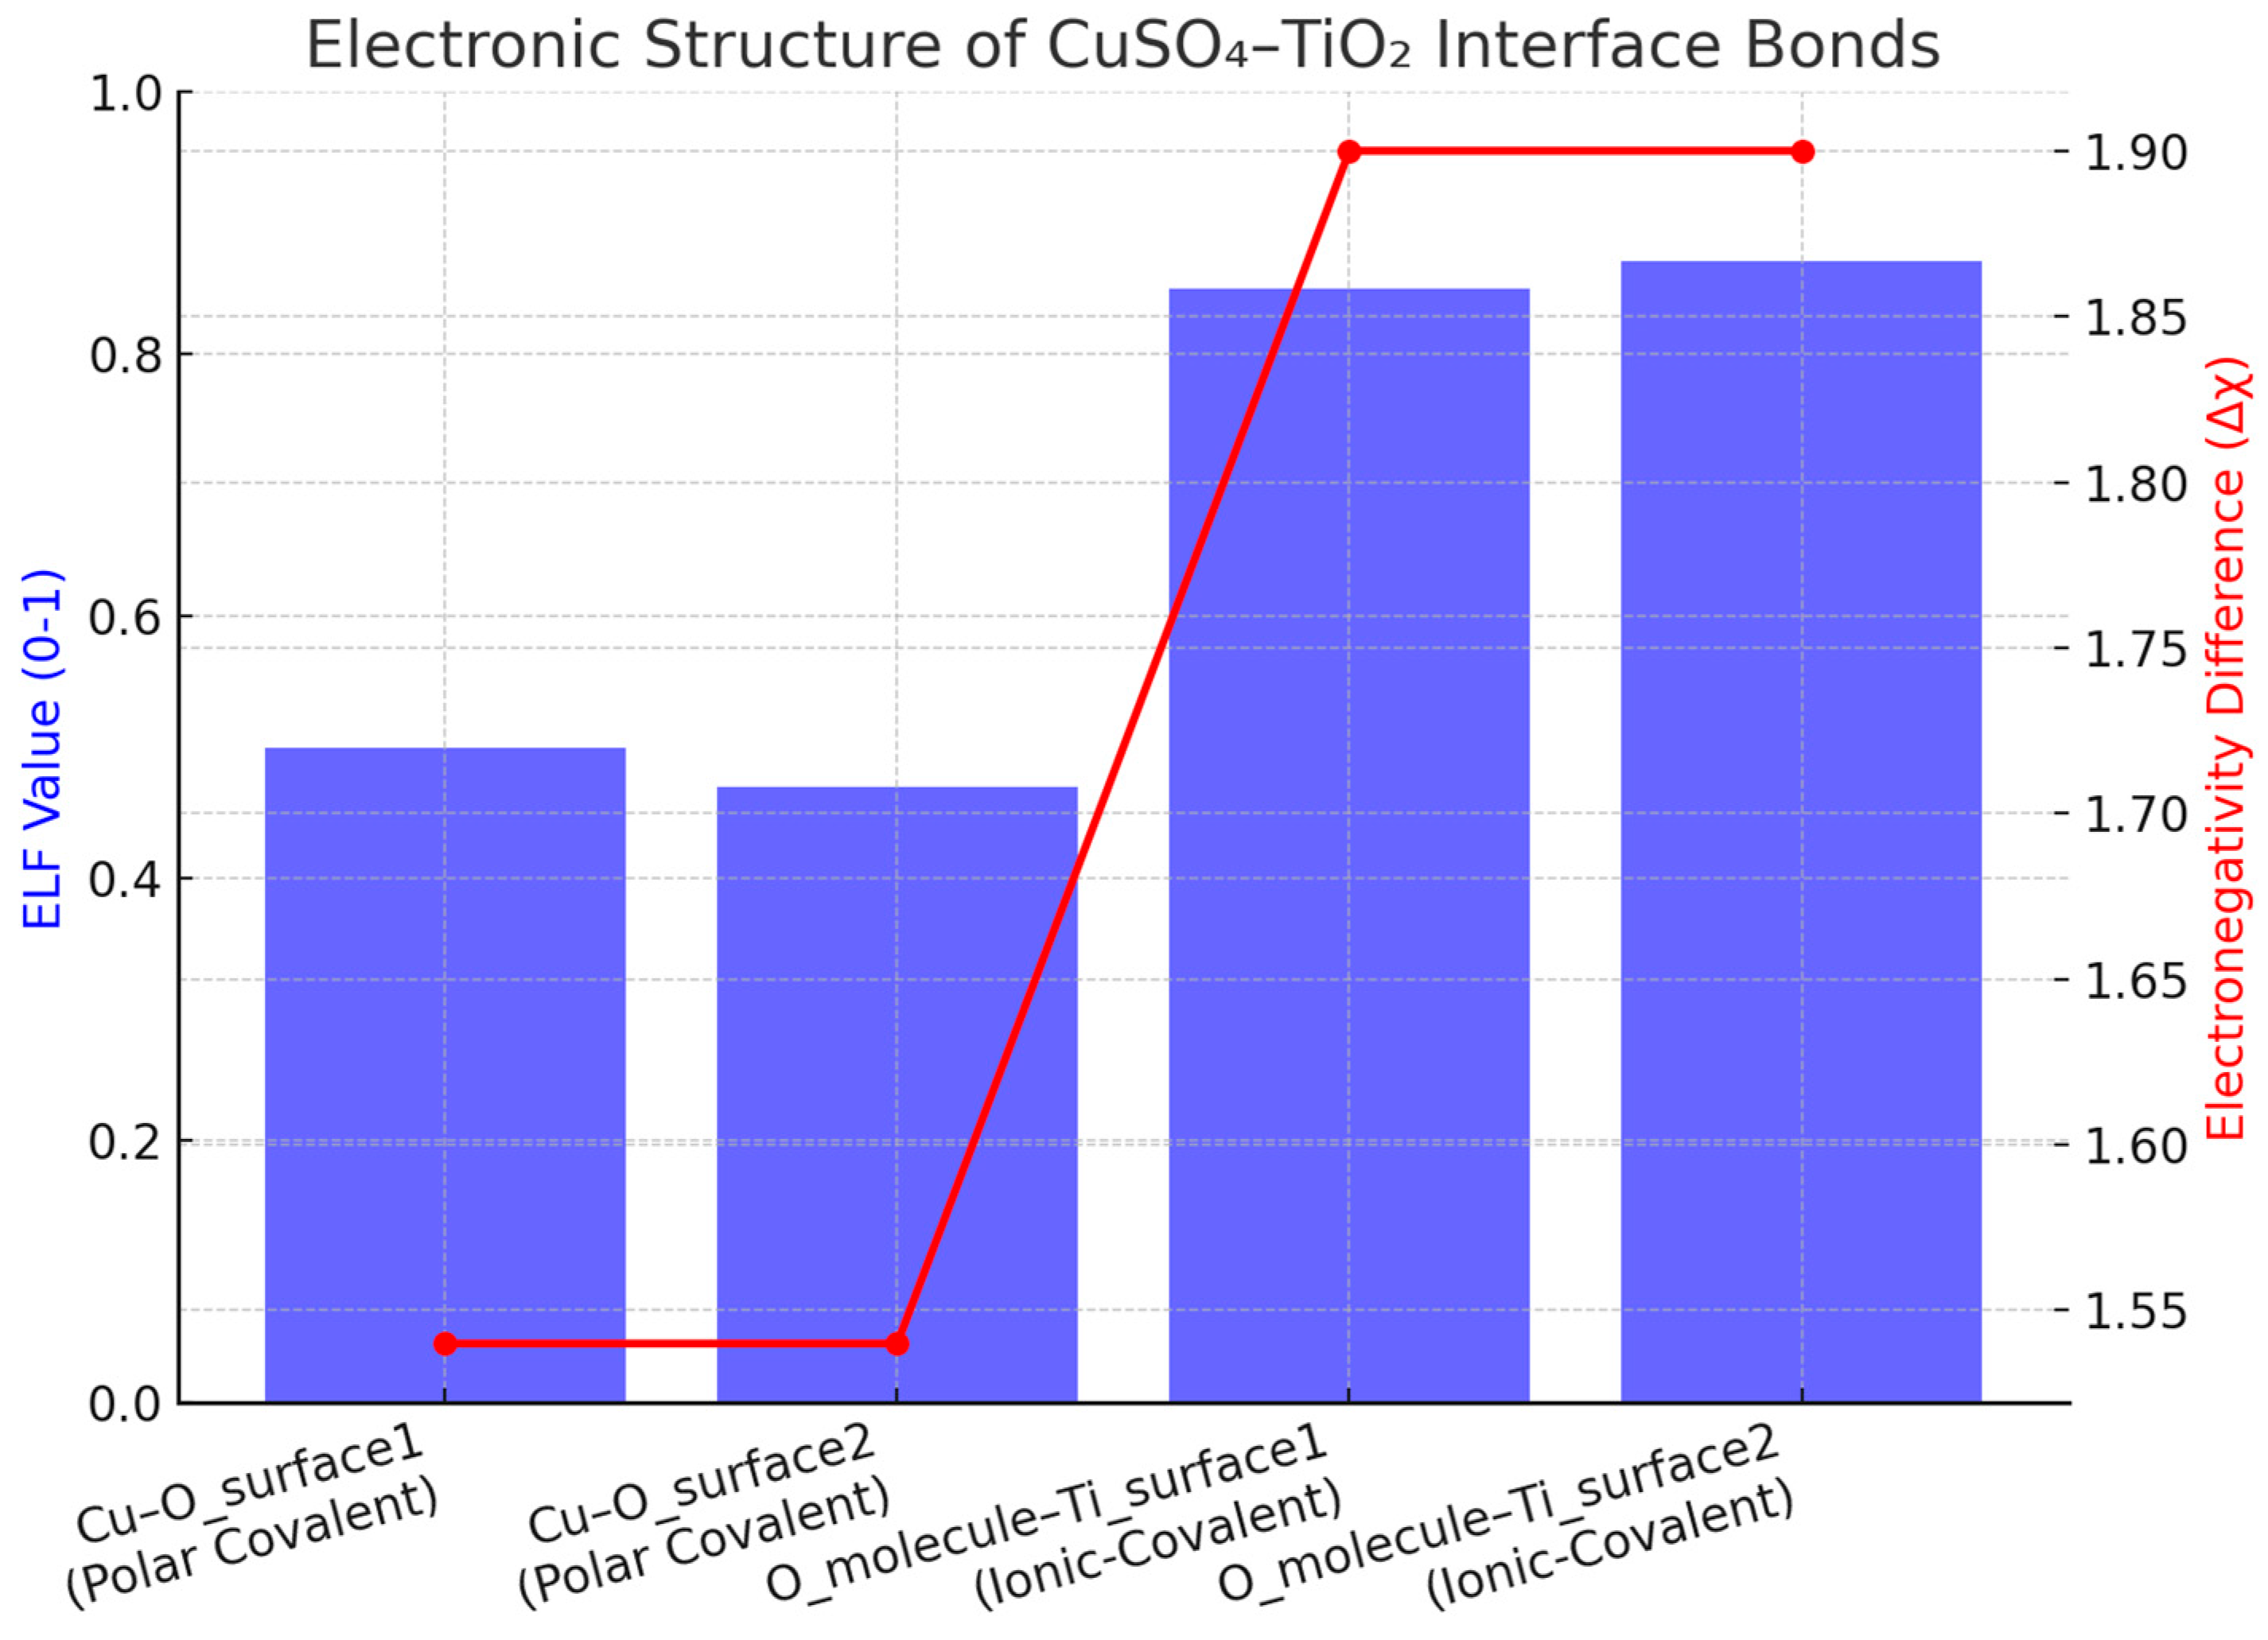
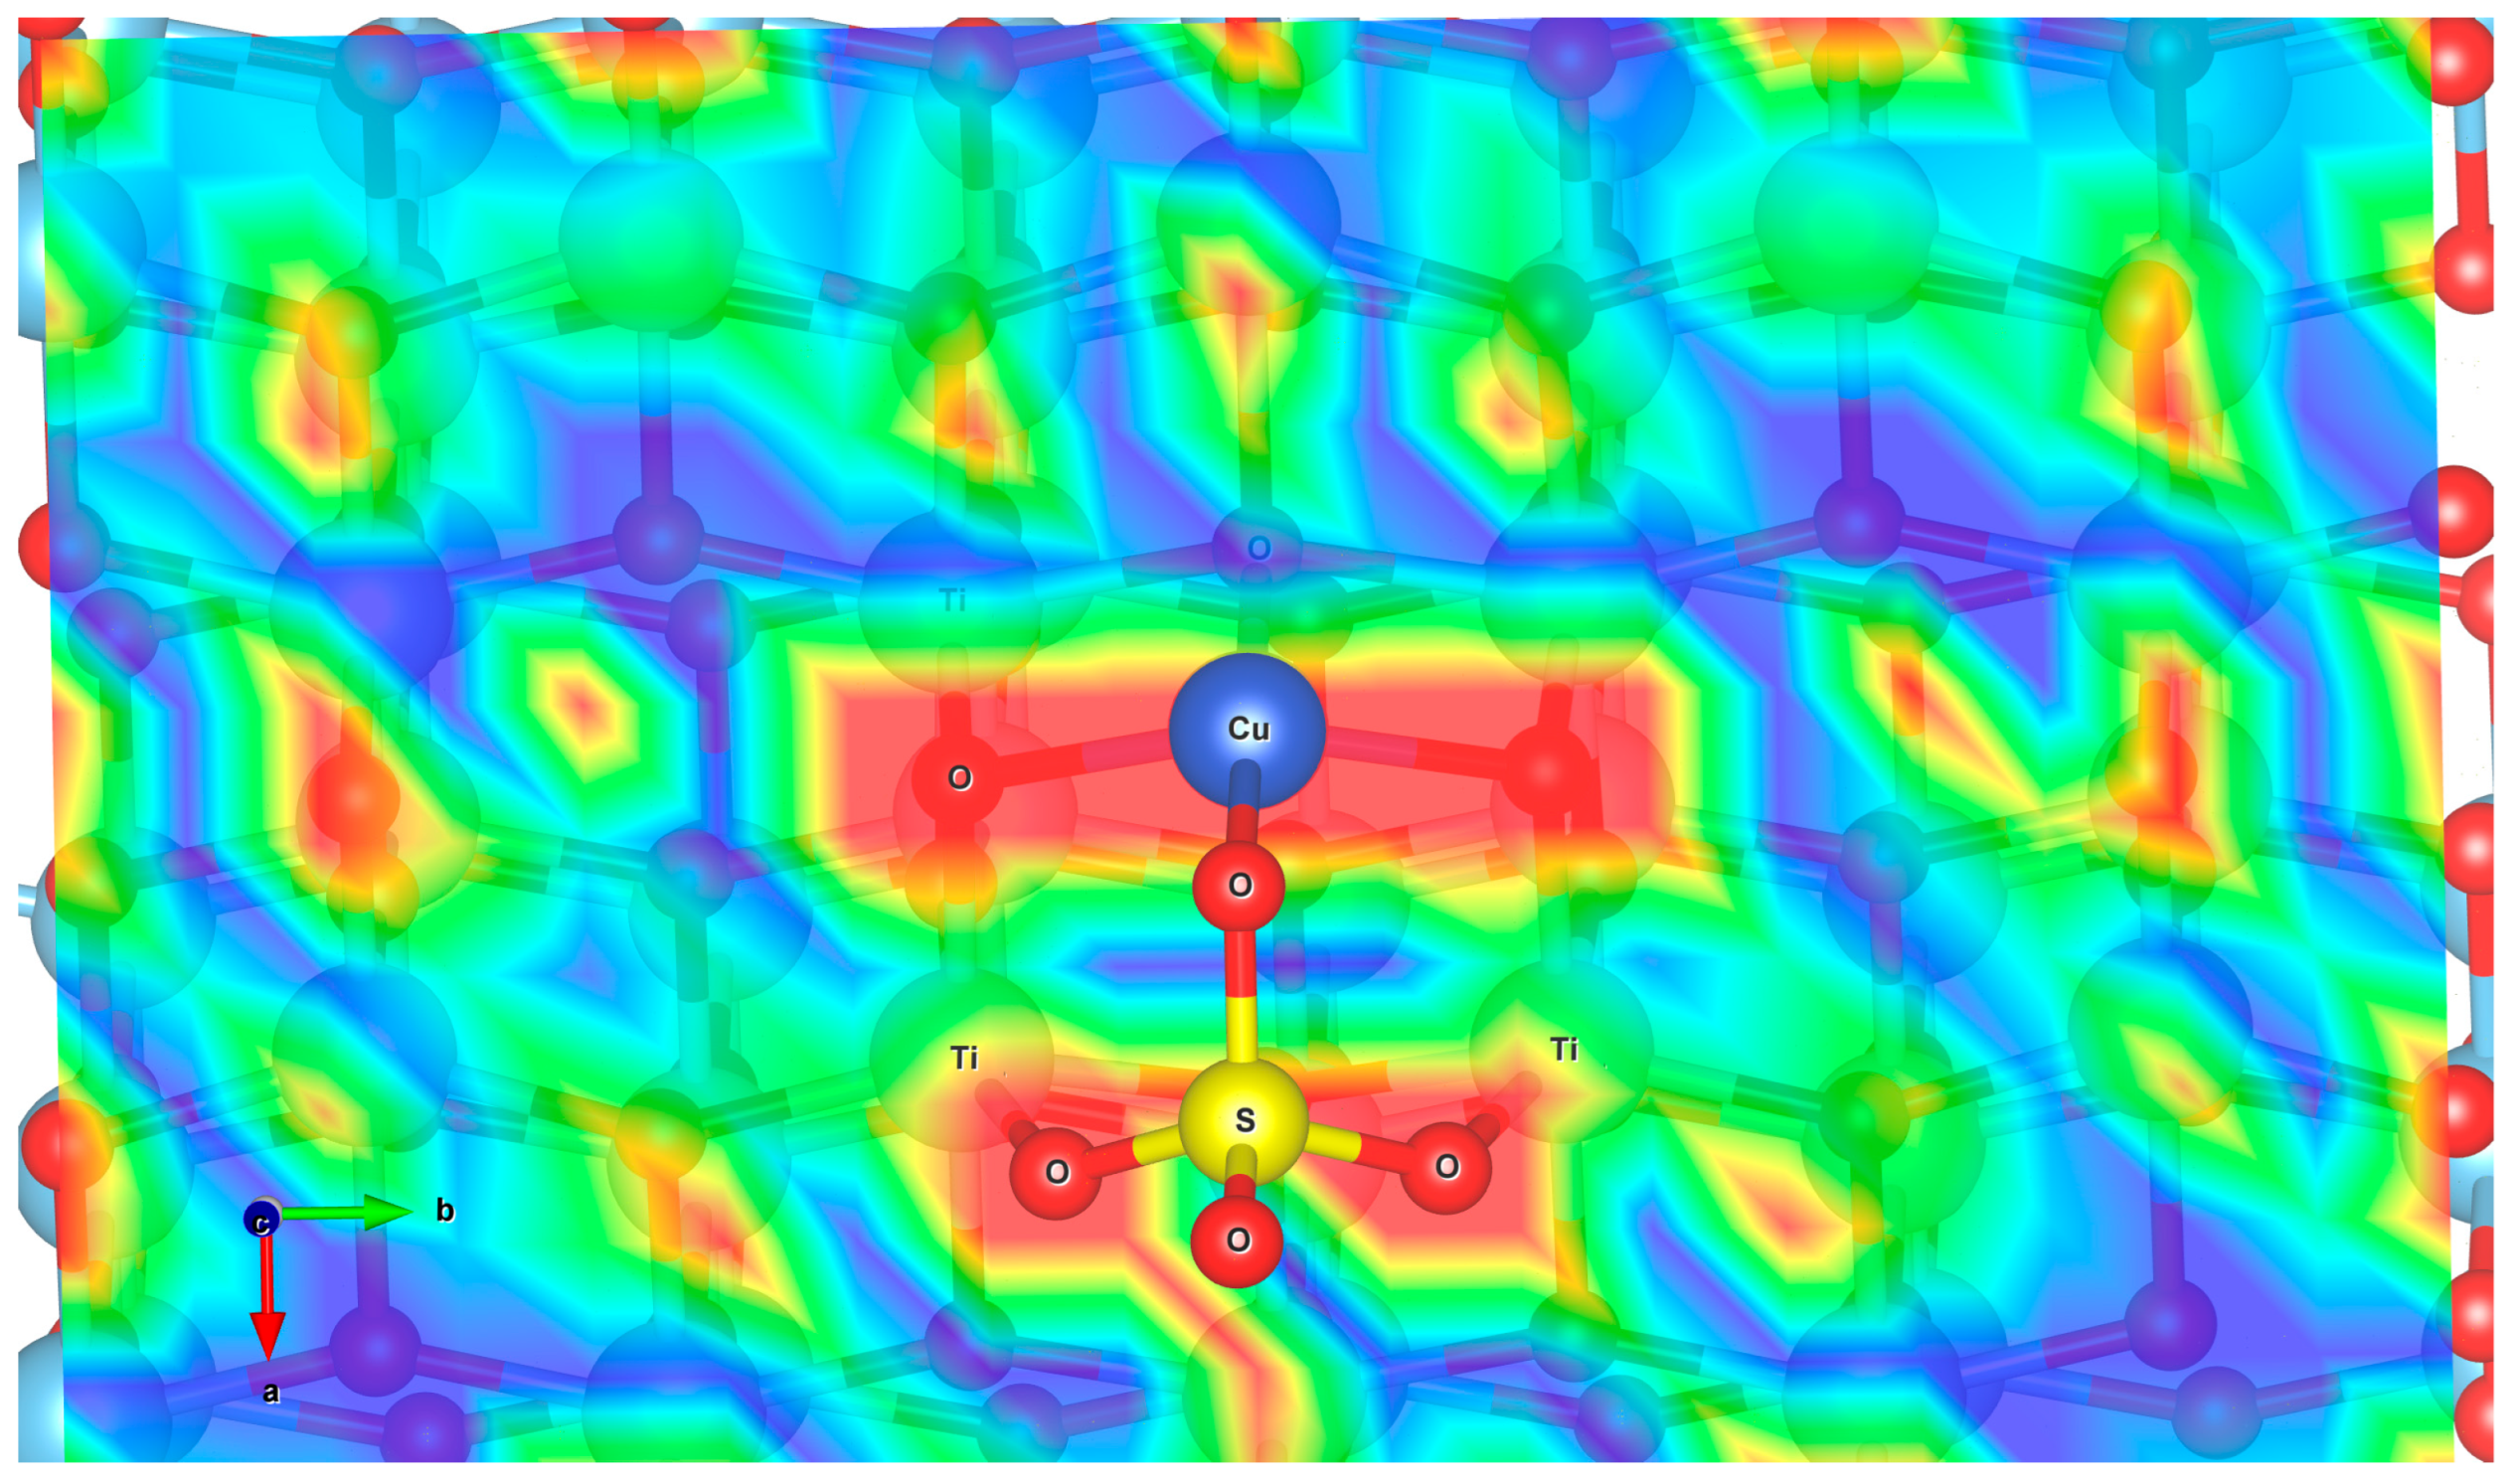
To further clarify the bonding nature, the Electron Localization Function (ELF) (Figure 7) reveals that the Cu–O interactions exhibit a predominantly polar covalent nature, while the O–Ti interactions demonstrate a mixed ionic–covalent character. The ELF values (0.47–0.50 for Cu–O, 0.85–0.87 for O–Ti) confirm that these bonds cannot be classified as purely ionic.
Additionally, bond length data (Table 6) and electronegativity difference comparisons (Table 7) [40], alongside Figure 8, demonstrate significant electron density redistribution, reinforcing the presence of both covalent and ionic contributions. Additionally, S–O interactions within the CuSO4 molecule exhibit predominantly covalent character, as evidenced by ELF values (0.78–0.80) and an electronegativity difference of 0.86, consistent with the observed structural stability (Table 6). Therefore, the bonding nature at the interface is best described as a combination of polar covalent and ionic–covalent interactions.
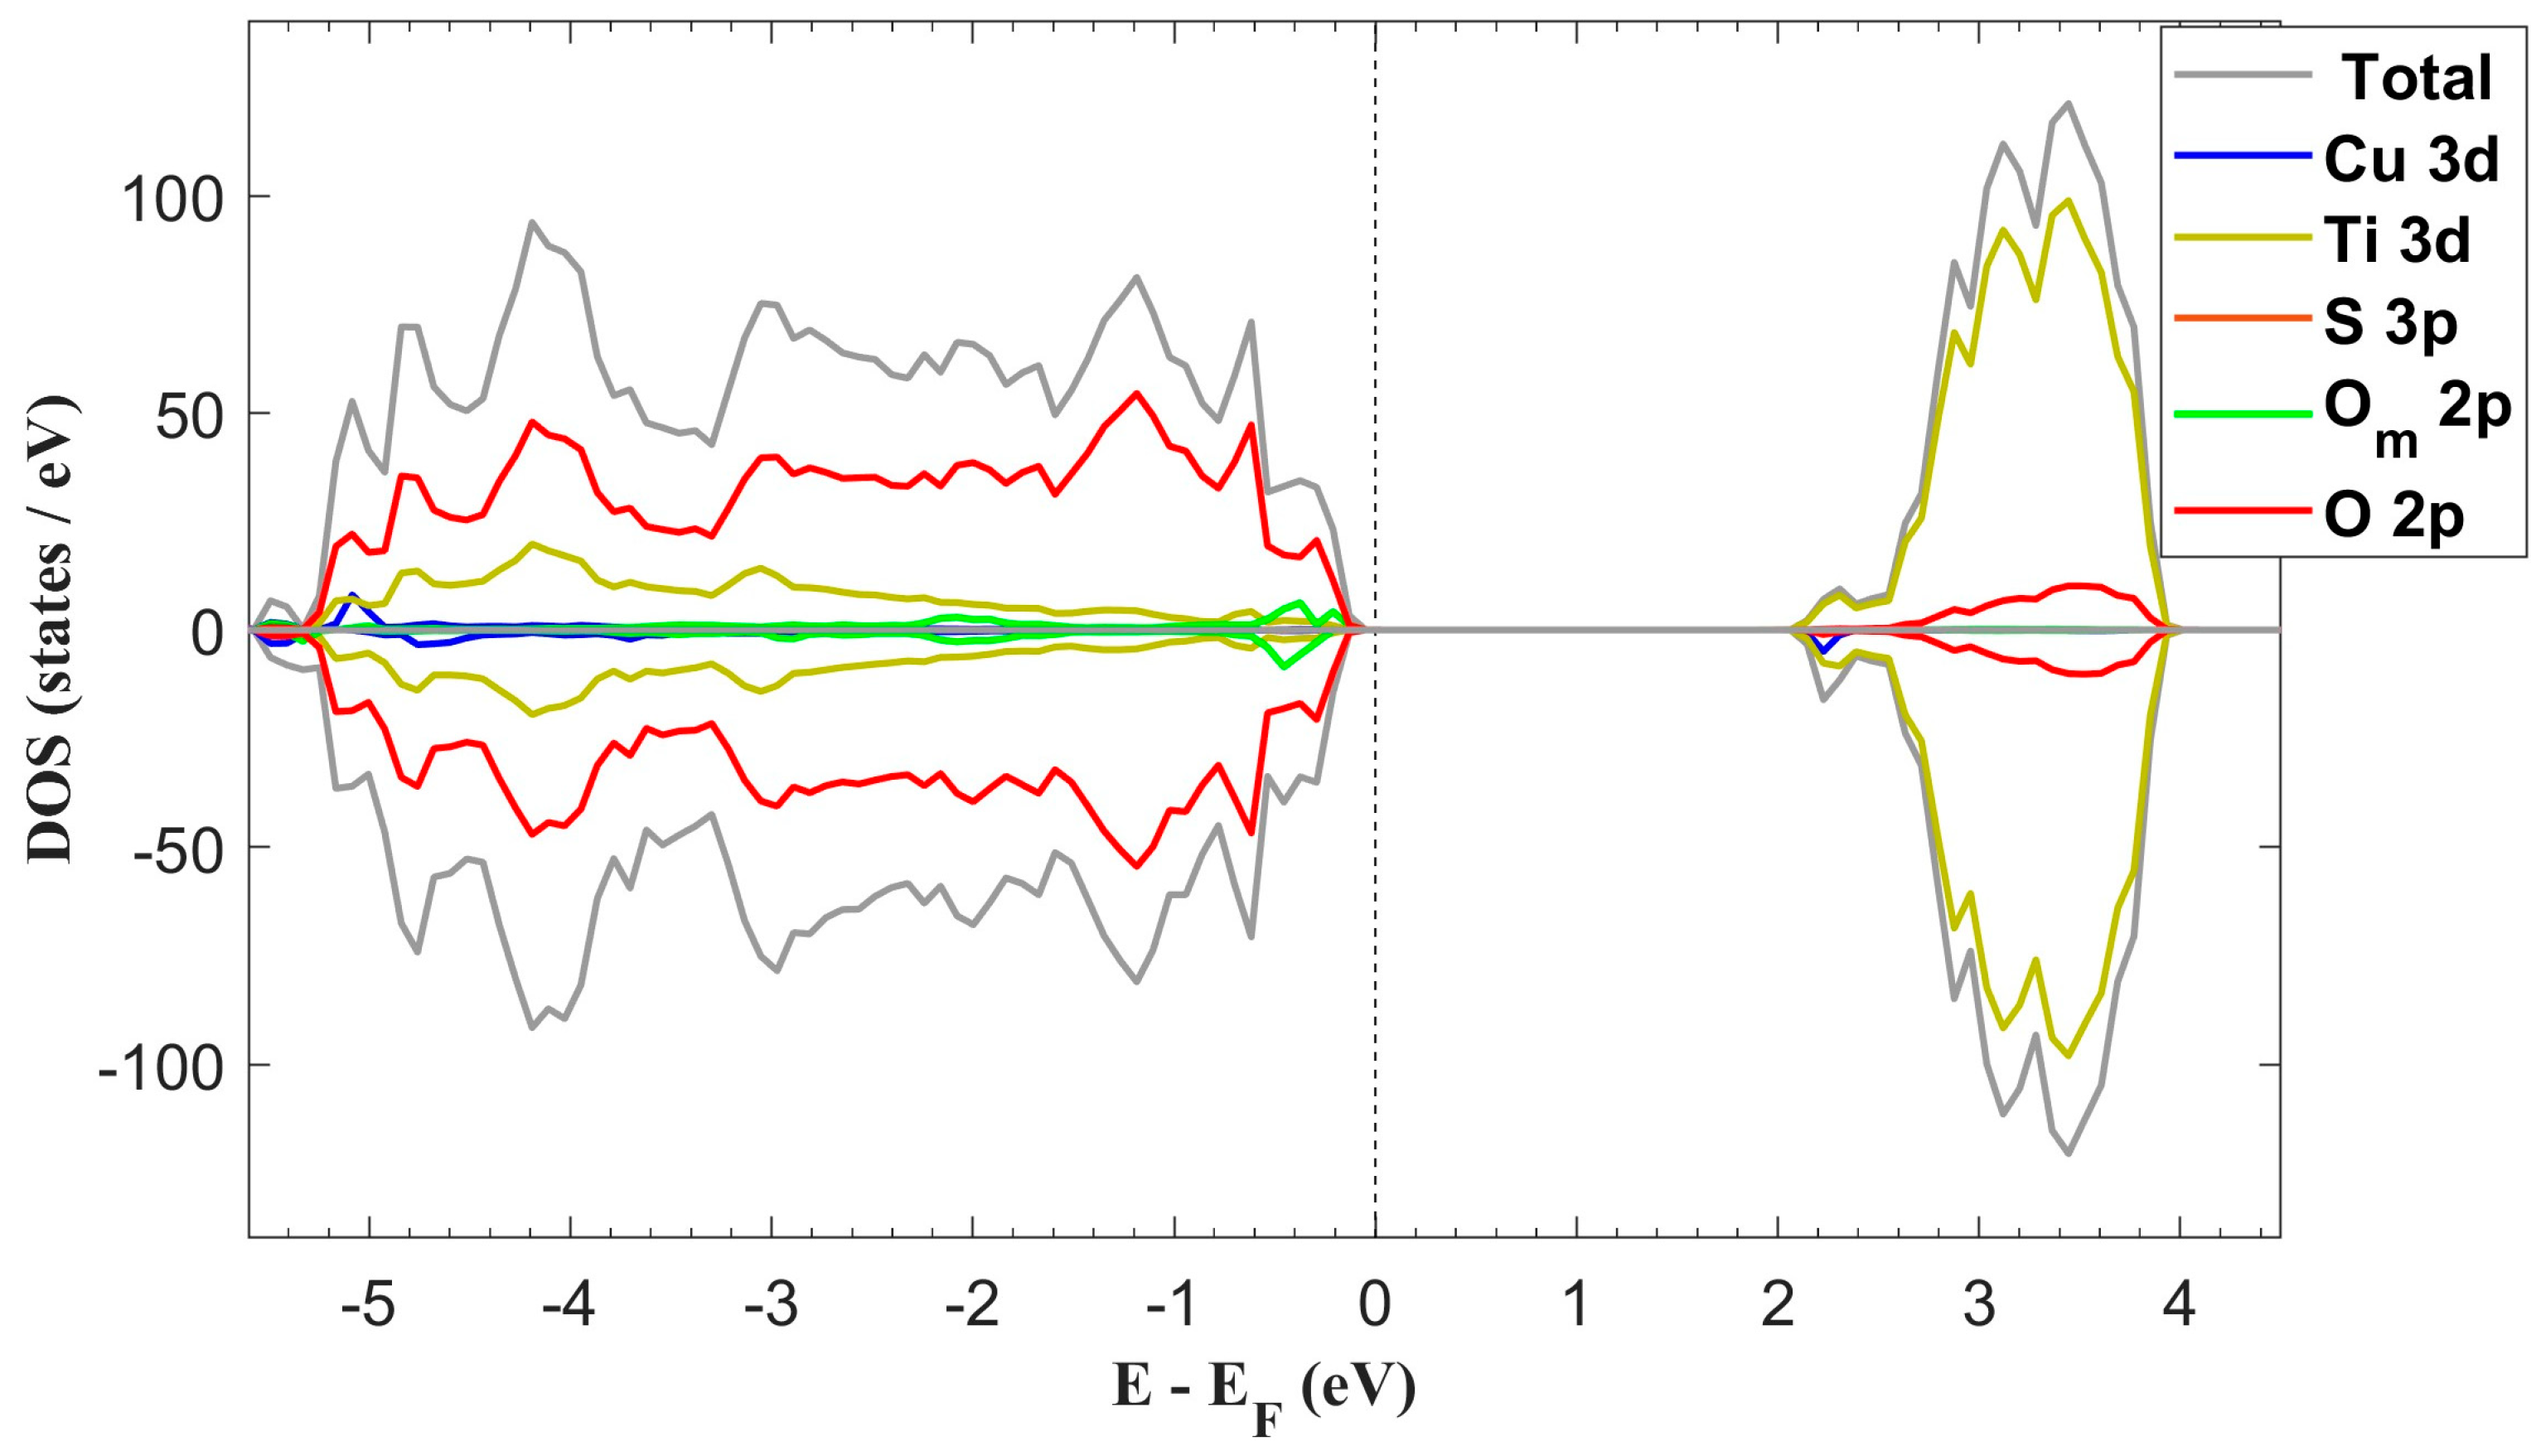
The computed DOS of the system with the adsorbed molecule is presented in Figure 9. Analysis of these data reveals a band gap width of 2.19 eV, which is narrower than the 2.27 eV observed for the pristine surface. Regarding the band’s composition, it can be noticed that the VB exhibits some minor presence of O 2p and Cu 3d states from the molecule. Sulfur states are also present at deep energy levels within the VB, but their intensity is very small and thus not distinguishable in the graph.
The DOS exhibits asymmetrical contributions from the molecular atomic states, indicating the presence of a magnetic moment within the system. The isolated CuSO4 molecule exhibits a total magnetic moment of 0.90 μB prior to adsorption, consistent with the Cu2+ d9 electronic configuration. This moment is primarily distributed among the Cu atom (0.42 μB, predominantly from 3d states) and two oxygen atoms (Om2 and Om4, each contributing 0.23 μB, mainly from 2p states). Following adsorption, the total magnetic moment of the combined system (molecule and surface) increases to 0.97 μB. An analysis of the spin density distribution reveals that the Cu 3d states contribute 0.72 μB to this moment, while the Ti 3d and O 2p states contribute 0.02 μB and 0.23 μB, respectively, indicating electronic redistribution at the molecule–surface interface.
The induced magnetic moment coupled with band gap narrowing, could alter the optical absorption properties of the material and potentially enhance the catalytic performance. This phenomenon aligns with previous experimental observations, including the favorable influence of CuSO4 on the catalytic activity observed in [27] and the reported photoexcitation under blue light irradiation [28]. While these studies attribute enhanced activity to the formation of intermediate energy levels within the band gap, our computational analysis suggests that the effect primarily originates from band gap narrowing.

3. Computational Details

The present work was conducted using the Vienna ab initio Simulation Package (VASP) version 6.1.2, a computational framework that implements first-principles methods including DFT, Density Functional Perturbation Theory (DFPT), and various many-body approaches [41,42]. While VASP supports multiple theoretical frameworks such as Hartree–Fock (HF), hybrid functionals, and Green’s function-based methods (GW, BSE), our calculations specifically employed the Generalized Gradient Approximation (GGA) [43]. This choice of functional balances computational efficiency with sufficient accuracy for describing the electron exchange–correlation interactions in our system, though VASP also accommodates more computationally intensive approaches such as hybrid functionals and meta-GGA methods. In this approach, the valence electronic states are represented using a set of periodic plane waves, and the interaction between core and valence electrons is implemented through the projector augmented wave (PAW) method [44]. The Perdew–Burke–Ernzerhof (PBE) [45] parameterized GGA functionals are used to describe the exchange–correlation interaction. The valence configuration employed in our calculations for each atom is as follows: 3p63d24s2 for Ti, 3d104s14p6 for Cu, 2s22p4 for O, and 3s23p4 for S. Additionally, to account for the strong correlation between d electrons, an intra-site Coulomb repulsion U-term was included in the calculations, specifically, the rotationally invariant (Dudarev) approach to the GGA + U, [46] resulting in the so-called DFT + U method [47]. The utilized U parameters values chosen based on prior optimizations in the literature were 3.5 eV for the Ti atom [48] and 7 eV for the Cu atom [49]. For Ti, U = 3.5 eV was adopted from studies of bulk TiO2 (anatase and rutile) [48] and molecular adsorption on anatase (101) [6] and rutile (110) [7] surfaces, where it was shown to effectively balance electronic properties, such as the band gap, with structural accuracy using the same PAW-PBE pseudopotentials. The U value of 7 eV for Cu, sourced from ref. [49] for CuO, was adopted based on the similar Cu2+ (d9) electronic configuration and oxygen coordination environment in both systems. This approach is justified as the Hubbard correction primarily addresses intra-atomic correlation effects of the Cu 3d electrons, which are comparable between these compounds despite their structural differences. Furthermore, spin-polarized calculations within the DFT + U framework were applied throughout the study.
GGA and hybrid functionals have limitations in accurately capturing long-range electron correlations necessary for modeling van der Waals (dispersive) forces. This shortcoming arises because these functionals approximate the exchange–correlation energy based on local or semi-local density gradients and, in the case of hybrid functionals, include a portion of non-local Hartree–Fock exchange [50]. However, they do not inherently account for long-range dispersive interactions, which are essential for accurately modeling adsorption processes. To address this, we have employed the DFT-D3 dispersion correction method developed by Grimme, which includes a Becke–Johnson damping function [51,52]. This method enhances the accuracy of our adsorption studies by incorporating van der Waals interactions.
This study employed precision settings of VASP (PREC = Accurate) and a cut-off kinetic energy of 550 eV (ENCUT = 550) which was determined by converging the total energy to less than 1 meV/atom. The Brillouin zone sampling was performed using a Γ-centered Monkhorst–Pack (MP) scheme [53]. A 3 × 2 × 1 k-point mesh was used for structural optimization of the 144-atom periodic slab, while a higher-resolution 7 × 5 × 1 mesh was implemented for subsequent static calculation to compute properties. To prevent artificial interactions between periodic slabs, a vacuum space of 20 Å and dipole correction were applied [54,55].
Atomic charges were evaluated using the Bader charge partitioning scheme [39], which decomposes the total electronic charge density into contributions associated with individual atoms based on zero-flux surfaces. This method was applied consistently to the free CuSO4 molecule, the pristine TiO2 (101) surface, and the adsorbed system, enabling a robust analysis of charge transfer as presented in Table 4.
To accurately model the isolated CuSO4 molecule within the context of periodic calculations, it was placed in a cubic supercell with dimensions of 15 × 15 × 15 Å3. The molecule was then geometrically optimized without constraints, using the same kinetic energy cut-off as employed for the slab calculations. This approach ensures consistency in the representation of both the adsorbed and free molecular states.

4. Conclusions

This study presents a first-principles analysis of CuSO4 adsorption on the anatase TiO2 (101) surface, employing density functional theory (DFT) calculations. The key findings are as follows:
(1)
Adsorption Geometry: A preferential adsorption pattern was identified, characterized by the lowest adsorption energy of −4.31 eV. This configuration was consistently obtained regardless of the initial approach of the molecule to the surface, suggesting its prevalence in real samples.
(2)
Adsorption Mechanism: The substantial adsorption energy and the formation of new chemical bonds between CuSO4 and the TiO2 surface provide strong evidence for a chemisorption process.
(3)
Charge Transfer: Atomic charge analysis reveals a net charge transfer from the TiO2 surface to the CuSO4 molecule. Atoms directly involved in forming new chemical bonds exhibit increased net atomic charges, indicating the ionic nature of these bonds.
(4)
Electronic Structure Modification: The adsorption process induces a magnetic moment and a slight reduction in the bandwidth. These electronic structure alterations are expected to impact on the electronic and catalytic properties of the material.
Future research could focus on analyzing the photocatalytic implications of CuSO4-modified TiO2 surfaces under various environmental conditions, such as changes in pH and light irradiation spectra. Additionally, the experimental validation of computational findings through spectroscopic techniques and surface characterization would contribute to a deeper understanding of the material’s behavior. Furthermore, exploring the incorporation of other transition metal salts or co-adsorbates could be relevant to optimizing its electronic and catalytic properties, with a view toward applications in photocatalysis and environmental remediation.

Author Contributions

Conceptualization, F.M., D.C., A.S., S.A. and J.C.; methodology, F.M., D.C. and S.A.; software, F.M.; resources, S.A., J.C. and A.S.; formal analysis, D.C., F.M. and S.A.; investigation, F.M., D.C., A.S., S.A. and J.C.; writing—original draft preparation, F.M., D.C., A.S., S.A. and J.C.; writing—review and editing, F.M., D.C., A.S., S.A. and J.C.; funding acquisition, D.C. All authors have read and agreed to the published version of the manuscript.

Funding

This research received no external funding.

Institutional Review Board Statement

Not applicable.

Informed Consent Statement

Not applicable.

Data Availability Statement

The original contributions presented in this study are included in the article.

Acknowledgments

We extend our sincere gratitude to Richard Rivera for his invaluable collaboration in performing additional computations to generate the missing data files and for offering fresh, insightful perspectives during the revision of the manuscript.

Conflicts of Interest

The authors declare no conflicts of interest.

References

  1. Pastorino, P.; Prearo, M. High-mountain lakes, indicators of global change: Ecological characterization and environmental pressures. Diversity 2020, 12, 260. [Google Scholar] [CrossRef]
  2. Wang, X.; Wang, C.; Zhu, T.; Gong, P.; Fu, J.; Cong, Z. Persistent organic pollutants in the polar regions and the Tibetan Plateau: A review of current knowledge and future prospects. Environ. Pollut. 2019, 248, 191–208. [Google Scholar] [CrossRef]
  3. Vergragt, P.; Akenji, L.; Dewick, P. Sustainable production, consumption, and livelihoods: Global and regional research perspectives. J. Clean. Prod. 2014, 63, 1–12. [Google Scholar] [CrossRef]
  4. Ren, G.; Han, H.; Wang, Y.; Liu, S.; Zhao, J.; Meng, X.; Li, Z. Recent advances of photocatalytic application in water treatment: A review. Nanomaterials 2021, 11, 1804. [Google Scholar] [CrossRef] [PubMed]
  5. López, M.C.; Fernández, M.I.; Martínez, C.; Santaballa, J.A. Photochemistry for pollution abatement. Pure Appl. Chem. 2013, 85, 1437–1449. [Google Scholar] [CrossRef]
  6. Stashans, A.; Marcillo, F.; Castillo, D. Dopamine adsorption configurations on anatase (101) surface. Surf. Rev. Lett. 2015, 22, 1550052. [Google Scholar] [CrossRef]
  7. Castillo, D.; Ontaneda, J.; Stashans, A. Geometry of dopamine adsorption on rutile (110) surface. Int. J. Mod. Phys. B 2014, 28, 1450071. [Google Scholar] [CrossRef]
  8. Grätzel, M. Dye-sensitized solar cells. J. Photochem. Photobiol. C Photochem. Rev. 2003, 4, 145–153. [Google Scholar] [CrossRef]
  9. Yan, L.; Du, J.; Jing, C. How TiO2 facets determine arsenic adsorption and photooxidation: Spectroscopic and DFT studies. Catal. Sci. Technol. 2016, 6, 1526–1538. [Google Scholar] [CrossRef]
  10. Eddy, D.R.; Permana, M.D.; Sakti, L.K.; Sheha, G.A.N.; Solihudin; Hidayat, S.; Takei, T.; Kumada, N.; Rahayu, I. Heterophase polymorph of TiO2 (Anatase, Rutile, Brookite, TiO2 (B)) for efficient photocatalyst: Fabrication and activity. Nanomaterials 2023, 13, 704. [Google Scholar] [CrossRef]
  11. Gao, J.; Jia, S.; Liu, J.; Yang, X.; Chen, Z.; Wang, X. Enhanced effect of adsorption and photocatalytics by TiO2 nanoparticles embedded porous PVDF nanofiber scaffolds. J. Mater. Res. 2021, 36, 1538–1548. [Google Scholar]
  12. Li, Y.; Gao, Y. Interplay between water and TiO2 anatase (101) surface with subsurface oxygen vacancy. Phys. Rev. Lett. 2014, 112, 206101. [Google Scholar] [CrossRef]
  13. Liu, L.; Li, K.; Chen, X.; Liang, X.; Zheng, Y.; Li, L. Amino acid adsorption on anatase (101) surface at vacuum and aqueous solution: A density functional study. J. Mol. Model. 2018, 24, 107. [Google Scholar]
  14. Hengerer, R.; Bolliger, B.; Erbudak, M.; Grätzel, M. Structure and stability of the anatase TiO2 (101) and (001) surfaces. Surf. Sci. 2000, 460, 162–169. [Google Scholar] [CrossRef]
  15. Diebold, U. Structure and properties of TiO2 surfaces: A brief review. Appl. Phys. A 2003, 76, 681–687. [Google Scholar]
  16. Sakar, M.; Prakash, R.M.; Do, T.-O. Insights into the TiO2-based photocatalytic systems and their mechanisms. Catalysts 2019, 9, 680. [Google Scholar] [CrossRef]
  17. Irfan, F.; Tanveer, M.U.; Moiz, M.A.; Husain, S.W.; Ramzan, M. TiO2 as an effective photocatalyst mechanisms, applications, and dopants: A review. Eur. Phys. J. B 2022, 95, 184. [Google Scholar]
  18. Degefu, D.M.; Liao, Z. Photocatalytic degradation of volatile organic compounds using nanocomposite of P-type and N-type transition metal semiconductors. J. Sol-Gel Sci. Technol. 2021, 98, 605–614. [Google Scholar]
  19. Xing, M.; Wu, Y.; Zhang, J.; Chen, F. Effect of synergy on the visible light activity of B, N and Fe co-doped TiO2 for the degradation of MO. Nanoscale 2010, 2, 1233–1239. [Google Scholar] [CrossRef]
  20. Liu, M.; Piao, L.; Lu, W.; Ju, S.; Zhao, L.; Zhou, C.; Li, H.; Wang, W. Flower-like TiO2 nanostructures with exposed {001} facets: Facile synthesis and enhanced photocatalysis. Nanoscale 2010, 2, 1115–1117. [Google Scholar]
  21. Zhang, P.; Shao, C.; Zhang, Z.; Zhang, M.; Mu, J.; Guo, Z.; Liu, Y. TiO2@carbon core/shell nanofibers: Controllable preparation and enhanced visible photocatalytic properties. Nanoscale 2011, 3, 2943–2949. [Google Scholar] [PubMed]
  22. Luan, Y.; Jing, L.; Xie, Y.; Sun, X.; Feng, Y.; Fu, H. Exceptional photocatalytic activity of 001-facet-exposed TiO2 mainly depending on enhanced adsorbed oxygen by residual hydrogen fluoride. ACS Catal. 2013, 3, 1378–1385. [Google Scholar]
  23. Jagminas, A.; Ramanavičius, S.; Jasulaitiene, V.; Šimėnas, M. Hydrothermal synthesis and characterization of nanostructured titanium monoxide films. RSC Adv. 2019, 9, 40727–40735. [Google Scholar]
  24. Domaschke, M.; Zhou, X.; Wergen, L.; Romeis, S.; Miehlich, M.E.; Meyer, K.; Peukert, W.; Schmuki, P. Magnéli-phases in anatase strongly promote cocatalyst free photocatalytic hydrogen evolution. ACS Catal. 2019, 9, 3627–3632. [Google Scholar]
  25. Yang, F.; Zhang, H.; Wu, Z.H.; Xiang, L.; Yu, Y.X. Formation of Monodispersed Anatase TiO2 Spheres from TiOSO4 for Enhanced Hydrogen Evolution of TiO2/g-C3N4 Photocatalysts. J. Environ. Chem. Eng. 2024, 12, 114888. [Google Scholar]
  26. Patra, S.G.; Meyerstein, D. On the Mechanism of Heterogeneous Water Oxidation Catalysis: A Theoretical Perspective. Inorganics 2022, 10, 182. [Google Scholar] [CrossRef]
  27. Yu, Y.; Miao, J.; Wang, J.; He, C.; Chen, J. Facile synthesis of CuSO4/TiO2 catalysts with superior activity and SO2 tolerance for NH3-SCR: Physicochemical properties and reaction mechanism. Catal. Sci. Technol. 2017, 7, 1590–1601. [Google Scholar]
  28. Luna, M.D.G.; Garcia-Segura, S.; Mercado, C.H.; Lin, Y.-T.; Lu, M.-C. Doping TiO2 with CuSO4 enhances visible light photocatalytic activity for organic pollutant degradation. Environ. Sci. Pollut. Res. 2020, 27, 24604–24613. [Google Scholar]
  29. Yadav, S.; Arif, T.; Wang, G.; Sodhi, R.N.S.; Cheng, Y.H.; Filleter, T.; Singh, C.V. Interfacial Interactions and Tribological Behavior of Metal-Oxide/2D-Material Contacts. Tribol. Lett. 2021, 69, 91. [Google Scholar]
  30. Martsinovich, N.; Jones, D.R.; Troisi, A. Electronic Structure of TiO2 Surfaces and Effect of Molecular Adsorbates Using Different DFT Implementations. J. Phys. Chem. C 2010, 114, 22659–22670. [Google Scholar] [CrossRef]
  31. Treacy, J.P.W.; Hussain, H.; Torrelles, X.; Grinter, D.C.; Cabailh, G.; Bikondoa, O.; Nicklin, C.; Selcuk, S.; Selloni, A.; Lindsay, R.; et al. Geometric Structure of Anatase Ti O2(101). Phys. Rev. B 2017, 95, 075416. [Google Scholar]
  32. Rafique, M.; Shuai, Y.; Hassan, M. Structural, electronic and optical properties of CO adsorbed on the defective anatase TiO2 (101) surface; A DFT study. J. Mol. Struct. 2017, 1142, 11–17. [Google Scholar]
  33. Liu, Q.-L.; Zhao, Z.-Y. DFT study on microstructures and electronic structures of Pt mono-/bi-doped anatase TiO2 (101) surface. RSC Adv. 2015, 5, 17984–17992. [Google Scholar] [CrossRef]
  34. Wildner, M.; Giester, G. Crystal structure refinements of synthetic chalcocyanite (CuSO4) and zincosite (ZnSO4). Miner. Petrol. 1988, 39, 201–209. [Google Scholar]
  35. Diebold, U. The surface science of titanium dioxide. Surf. Sci. Rep. 2003, 48, 53–229. [Google Scholar]
  36. Lazzeri, M.; Vittadini, A.; Selloni, A. Structure and energetics of stoichiometric TiO2 anatase surfaces. Phys. Rev. B 2001, 63, 155409. [Google Scholar]
  37. Marabelli, F.; Parravicini, G.B.; Salghetti-Drioli, F. Optical gap of CuO. Phys. Rev. B 1995, 52, 1433–1436. [Google Scholar]
  38. Burdett, J.K.; Hughbanks, T.; Miller, G.J.; Richardson, J.W.; Smith, J.V. Structural electronic relationships in inorganic solids: Powder neutron diffraction studies of the rutile and anatase polymorphs of titanium dioxide at 15 and 295 K. J. Am. Chem. Soc. 1987, 109, 3639–3646. [Google Scholar]
  39. Henkelman, G.; Arnaldsson, A.; Jonsson, H. A Fast and Robust Algorithm for Bader Decomposition of Charge Density. Comput. Mater. Sci. 2006, 36, 354–360. [Google Scholar] [CrossRef]
  40. Haynes, W.M. (Ed.) CRC Handbook of Chemistry and Physics, 97th ed.; CRC Press: Boca Raton, FL, USA, 2016; ISBN 978-1-4987-5429-3. [Google Scholar]
  41. Kresse, G.; Furthmüller, J. Efficiency of ab-initio total energy calculations for metals and semiconductors using a plane-wave basis set. Comput. Mater. Sci. 1996, 6, 15–50. [Google Scholar]
  42. Kresse, G.; Furthmüller, J. Efficient iterative schemes for ab initio total-energy calculations using a plane-wave basis set. Phys. Rev. B 1996, 54, 11169. [Google Scholar] [CrossRef]
  43. Perdew, J.P.; Chevary, J.A.; Vosko, S.H.; Jackson, K.A.; Pederson, M.R.; Singh, D.J.; Fiolhais, C. Atoms, molecules, solids, and surfaces: Applications of the generalized gradient approximation for exchange and correlation. Phys. Rev. B 1992, 46, 6671. [Google Scholar] [CrossRef] [PubMed]
  44. Kresse, G.; Joubert, D. From ultrasoft pseudopotentials to the projector augmented wave method. Phys. Rev. B 1999, 59, 1758. [Google Scholar] [CrossRef]
  45. Perdew, J.P.; Burke, K.; Ernzerhof, M. Generalized gradient approximation made simple. Phys. Rev. Lett. 1996, 77, 3865. [Google Scholar] [CrossRef]
  46. Dudarev, S.; Botton, G.; Savrasov, S.; Humphreys, C.; Sutton, A. Electron-energy-loss spectra and the structural stability of nickel oxide: An LSDA+U study. Phys. Rev. B 1998, 57, 1505. [Google Scholar] [CrossRef]
  47. Liechtenstein, A.; Anisimov, V.; Zaanen, J. Density-functional theory and strong interactions: Orbital ordering in Mott-Hubbard insulators. Phys. Rev. B 1995, 52, R5467. [Google Scholar] [CrossRef] [PubMed]
  48. Stashans, A.; Bravo, Y. Large hole polarons in Sc-doped TiO2 crystals. Mod. Phys. Lett. B 2013, 27, 1350113. [Google Scholar] [CrossRef]
  49. Mishra, A.K.; Roldan, A.; de Leeuw, N.H. CuO Surfaces and CO2 Activation: A Dispersion-Corrected DFT+U Study. J. Phys. Chem. C 2016, 120, 2198–2214. [Google Scholar] [CrossRef]
  50. Grimme, S. Semiempirical GGA-type density functional constructed with a long-range dispersion correction. J. Comput. Chem. 2006, 27, 1787–1799. [Google Scholar] [CrossRef]
  51. Grimme, S.; Antony, J.; Ehrlich, S.; Krieg, H. A consistent and accurate ab initio parametrization of density functional dispersion correction (DFT-D) for the 94 elements H-Pu. J. Chem. Phys. 2010, 132, 154104. [Google Scholar] [CrossRef]
  52. Grimme, S.; Ehrlich, S.; Goerigk, L. Effect of the damping function in dispersion corrected density functional theory. J. Comput. Chem. 2011, 32, 1456–1465. [Google Scholar] [CrossRef] [PubMed]
  53. Monkhorst, H.J.; Pack, J.D. Special points for Brillouin-zone integrations. Phys. Rev. B 1976, 13, 5188. [Google Scholar] [CrossRef]
  54. Neugebauer, J.; Scheffler, M. Adsorbate-substrate and adsorbate-adsorbate interactions of Na and K adlayers on Al (111). Phys. Rev. B 1992, 46, 16067. [Google Scholar] [CrossRef] [PubMed]
  55. Makov, G.; Payne, M. Periodic boundary conditions in ab initio calculations. Phys. Rev. B 1995, 51, 4014. [Google Scholar] [CrossRef]
Figure 1. TiO2 anatase (101) surface structure. Red and gray spheres represent O and Ti atoms.
Inorganics 13 00114 g001
Figure 2. DFT + U total DOS and partial DOS (PDOS) of anatase TiO2 (101) surface. The band−gap is 2.27 eV.
Inorganics 13 00114 g002
Figure 3. CuSO4 molecule structure. (a) Experimental and (b) modeled.
Inorganics 13 00114 g003
Figure 4. Illustrations (ag) show the initial adsorption structures of the CuSO4 on the anatase TiO2 (101) surface, prior geometry optimization. Atoms are represented by colored spheres: Cu (blue), S (yellow), O (red), and Ti (gray). For clarity, only the uppermost atoms of the TiO2 surface are displayed.
Inorganics 13 00114 g004aInorganics 13 00114 g004b
Figure 5. Adsorption geometry of configuration e: (a) side and (b) top views. The blue, yellow, red, and gray spheres represent atoms of Cu, S, O, and Ti, respectively.
Inorganics 13 00114 g005
Figure 6. Most favorable adsorption geometry of CuSO4 on the anatase TiO2 (101) surface: (a) side and (b) top views. The blue, yellow, red, and white spheres represent atoms of Cu, S, O, and Ti, respectively.
Inorganics 13 00114 g006aInorganics 13 00114 g006b
Figure 7. The bar chart represents the ELF values for different bonding interactions at the CuSO4–TiO2 interface. The blue bars indicate ELF values, where Cu–O bonds exhibit moderate electron localization (polar covalent nature), while O–Ti bonds display higher ELF values, supporting an ionic–covalent character. The red line represents the trend of ELF variations across different bonding types.
Inorganics 13 00114 g007
Figure 8. ELF map across the CuSO4–TiO2 interface. Red and yellow regions indicate high ELF values (≥0.78), confirming strong covalent bonding, as seen in the S–O interactions (ELF~0.78–0.80). Green regions around the Cu–O bonds suggest moderate electron localization (ELF~0.47–0.50), characteristic of polar covalent interactions. The blue regions surrounding the O–Ti bonds indicate a mixed ionic–covalent interaction.
Inorganics 13 00114 g008
Figure 9. Total DOS and partial DOS (PDOS) of anatase TiO2 (101) surface with one adsorbed molecule. The corresponding band gap width is 2.19 eV.
Inorganics 13 00114 g009
Table 1. Atomic displacements in the first trilayer of anatase TiO2 (101): comparison between our computational results, SXRD measurements, and DFT calculations reported by Treacy et al. [31].
AtomAtomic Displacements (Å)
SXRDDFTPresent Work
O10.07 ± 0.010.140.08
O20.15 ± 0.010.330.39
O30.08 ± 0.010.160.03
O40.01 ± 0.010.070.04
Ti10.03 ± 0.010.010.03
Ti20.15 ± 0.010.280.15
Table 2. Interatomic distances and relevant angles of the CuSO4 molecule comparing the experimental [34] and the modeled structures.
Distance (Å)Angle (°)
AtomsExp.ModeledAtomsExp.Modeled
S–Om11.461.44S–Om4–Cu123.4494.04
S–Om21.461.60Om1–S–Om3110.52119.39
S–Om31.461.44
S–Om41.521.60
Cu–Om42.041.85
Cu–Om33.713.46
Cu–Om23.251.85
Cu–Om14.333.51
Table 3. Computed adsorption energies.
ConfigurationEads (eV)
a–2.06
b–4.31
c–1.25
d–4.31
e–4.00
f–4.31
g–2.67
Table 4. Interatomic distances and relevant angles for the pristine surface and the surface with the adsorbate. Atoms labels adhere to the notation established in Figure 6b.
Bond Length (Å)Angle (°)
AtomsFree
Molecule
Adsorbed MoleculeAtomsFree
Molecule
Adsorbed Molecule
S–Om11.451.53Ti1–Om1–S-132.57
S–Om21.571.42S–Om3–Ti2-132.62
S–Om31.451.53S–Om4–Cu93.82112.29
S–Om41.571.51Om1–S–Om3116.04107.58
Cu–Om41.911.92
AtomsPristine SurfaceAdsorbed MoleculeAtomsPristine SurfaceAdsorbed Molecule
Om1–Ti1-2.02Oa–Ti1–Om1-102.16
Om3–Ti2-2.02Om3–Ti2–Ob-102.24
Ti1–Oa1.981.97Ti1–O1–Tia100.96101.53
Ti2–Ob1.981.97Ti2–O3–Tic100.96101.52
Cu–O1-1.94Tia–O2–Tic155.23152.98
Cu–O2-2.02Cu–O2–Tib-108.19
Cu–O3-1.94
O1–Tia1.941.96
O2–Tib2.062.16
O3–Tic1.941.96
Table 5. Atomic charges of the atoms labeled in Figure 6b.
Atomic Charge (e)
AtomFree MoleculeAdsorbed Molecule
Cu1.001.14
S3.583.77
Om1–1.27–1.26
Om2–1.00–1.27
Om3–1.27–1.26
Om4–1.04–1.23
AtomPristine SurfaceAdsorbed Molecule
Ti12.262.32
Ti22.262.32
Tia2.302.30
Tib2.262.24
Tic2.302.30
O1–1.03–1.09
O2–1.18–1.23
O3–1.03–1.09
Oa–1.20–1.19
Ob–1.20–1.19
Table 6. Bond length analysis: structural stability and bonding nature.
BondCovalent Radius (Å) Atom 1Covalent Radius (Å) Atom 2Expected Covalent Length (Å)Observed Distance (Å)Interpretation
Cu–Osurface1.22 (Cu)0.64 (O)1.861.94Covalent, slightly elongated
Om–Ti0.64 (O)1.48 (Ti)2.122.34Partial ionic character
S–Om1.04 (S)0.64 (O)1.681.72Very close to covalent
Table 7. Electronegativity differences support hybrid bonding model.
BondElectronegativity Atom 1Electronegativity Atom 2ΔχPredicted Bond Type
Cu–Osurface1.90 (Cu)3.44 (O)1.54Polar Covalent
Om–Ti3.44 (O)1.54 (Ti)1.90Ionic-Covalent
S–Om2.58 (S)3.44 (O)0.86Predominantly Covalent
Disclaimer/Publisher’s Note: The statements, opinions and data contained in all publications are solely those of the individual author(s) and contributor(s) and not of MDPI and/or the editor(s). MDPI and/or the editor(s) disclaim responsibility for any injury to people or property resulting from any ideas, methods, instructions or products referred to in the content.