Article

Facile Synthesis and Characterization of Novel CoFe2O4@MgO@(Mg0.23Co0.77)(Mg0.35Co1.65)O4@C and CoFe2O4@MgO@C Nanocomposites for Efficient Removal of Zn(II) Ions from Aqueous Media

1
Department of Chemistry, College of Science, Imam Mohammad Ibn Saud Islamic University (IMSIU), Riyadh 11623, Saudi Arabia
2
Department of Chemistry, Faculty of Science, Umm Al-Qura University, Makkah 21955, Saudi Arabia
3
Chemistry Department, Faculty of Science, Tanta University, Tanta 31111, Egypt
*
Author to whom correspondence should be addressed.
Inorganics 2025, 13(4), 101; https://doi.org/10.3390/inorganics13040101
Submission received: 19 February 2025 / Revised: 20 March 2025 / Accepted: 21 March 2025 / Published: 23 March 2025
(This article belongs to the Special Issue Organic–Inorganic Nanocomposites for Water Treatment)

Abstract

:
Excessive levels of Zn(II) ions in aquatic environments pose significant risks to both ecosystems and human health. In aquatic systems, Zn(II) ions disrupt metabolic functions in organisms, leading to toxicity and bioaccumulation. For humans, prolonged exposure can result in gastrointestinal distress, immune system dysfunction, and neurological complications, necessitating effective removal strategies. This study reports the synthesis and characterization of CoFe-MgO-C-M600 (CoFe2O4@MgO@(Mg0.23Co0.77)(Mg0.35Co1.65)O4@C) and CoFe-MgO-C-M800 (CoFe2O4@MgO@C) nanocomposites for the efficient removal of Zn(II) ions from aqueous media. The nanocomposites were synthesized using the Pechini sol-gel method and characterized through X-ray diffraction (XRD), energy-dispersive X-ray spectroscopy (EDX), field emission scanning electron microscopy (FE-SEM), and high-resolution transmission electron microscopy (HR-TEM). XRD analysis confirmed the crystalline structure of both nanocomposites, with CoFe-MgO-C-M600 exhibiting a smaller average crystallite size (38.67 nm) than CoFe-MgO-C-M800 (75.48 nm). EDX results verified the elemental composition of the nanocomposites, ensuring the successful incorporation of key elements. FE-SEM analysis revealed significant morphological differences, with CoFe-MgO-C-M600 displaying smaller and more uniform grains compared to CoFe-MgO-C-M800. The results show that CoFe-MgO-C-M600 possesses a highly porous and interconnected structure, enhancing its surface area and adsorption potential. In contrast, CoFe-MgO-C-M800 demonstrates larger and more compact grains, which may affect its adsorption performance. HR-TEM further confirmed these findings, demonstrating that CoFe-MgO-C-M600 had a smaller average particle diameter (35.45 nm) than CoFe-MgO-C-M800 (321.14 nm). Adsorption studies indicated that CoFe-MgO-C-M600 and CoFe-MgO-C-M800 achieved maximum adsorption capacities of 276.24 and 200.00 mg/g, respectively. The adsorption process was determined to be exothermic, spontaneous, and physical in nature, following the pseudo-second-order kinetic model and the Langmuir isotherm.

1. Introduction

Water contamination with heavy metals has become a critical environmental issue due to the rapid expansion of industrial activities, urbanization, and agricultural practices [1,2,3,4]. Heavy metals such as lead, cadmium, mercury, arsenic, and zinc enter water bodies through mining operations, industrial effluents, improper waste disposal, and agricultural runoff. Unlike organic pollutants, these metals are non-biodegradable and persist in the environment. Over time, they accumulate in sediments and aquatic organisms, posing long-term ecological and health risks [5,6,7]. Their presence in water resources poses serious environmental and human health risks, necessitating the development of effective remediation strategies. Heavy metals pose serious threats to both the environment and human health due to their toxicity, persistence, and bioaccumulative nature. In aquatic ecosystems, heavy metals disrupt microbial communities, alter water chemistry, and affect the reproductive and physiological functions of aquatic organisms. Many heavy metals exhibit high affinity for biological tissues, leading to bioaccumulation in fish and other aquatic species, which can then be transferred through the food chain. This contamination threatens biodiversity and compromises ecosystem stability [8,9]. For humans, exposure to heavy metals occurs through contaminated drinking water, food, and air. Chronic exposure to heavy metals can result in severe health complications, including neurological disorders, kidney damage, liver dysfunction, and immune system suppression. Some heavy metals, such as arsenic and cadmium, are known carcinogens that can lead to cancer and other long-term health effects [10,11]. The irreversible nature of heavy metal toxicity underscores the importance of effective water treatment technologies. Zinc is an essential trace element required for various biological functions; however, excessive Zn(II) ion concentrations in water can be hazardous. High levels of Zn(II) ions in aquatic systems lead to toxicity in fish and other organisms, disrupting metabolic processes and enzyme activities. Elevated zinc levels can also interfere with the bioavailability of other essential elements such as calcium and iron, leading to nutrient imbalances in aquatic environments [12,13]. For humans, excessive exposure to Zn(II) ions through drinking water or food can result in gastrointestinal distress, nausea, and immune dysfunction. Long-term exposure may also impact neurological and reproductive health [14]. Therefore, controlling Zn(II) ion contamination in water bodies is critical to safeguarding both environmental and human health. Several techniques have been developed to remove heavy metals from contaminated water, including adsorption, chemical precipitation, membrane filtration, electrochemical methods, and bioremediation. Chemical precipitation involves the addition of coagulants to convert dissolved heavy metals into insoluble precipitates, which can then be removed through filtration [15]. Membrane filtration technologies, such as reverse osmosis and nanofiltration, offer high removal efficiency but are often costly and require significant energy input [16,17]. Electrochemical methods, including electrocoagulation and electrodialysis, utilize electric fields to separate heavy metals from water [18,19]. Bioremediation, which involves the use of microorganisms or plants to sequester heavy metals, presents an eco-friendly alternative but requires extensive optimization for large-scale applications [20]. Among these techniques, adsorption has emerged as a highly efficient and cost-effective approach for heavy metal removal. Adsorption offers several advantages, including high selectivity, low operational costs, minimal energy consumption, and ease of application. Unlike chemical precipitation, adsorption does not generate excessive sludge, reducing secondary pollution concerns [21]. Metal oxide nanoparticles have gained significant attention in water purification due to their high surface area, strong affinity for metal ions, and tunable physicochemical properties. Nanomaterials such as iron oxide, manganese oxide, silicon dioxide, and magnesium oxide exhibit excellent adsorption capacities due to their unique surface characteristics and ability to interact with heavy metals [22,23,24,25]. This study introduces an innovative approach by synthesizing novel CoFe2O4@MgO@(Mg0.23Co0.77)(Mg0.35Co1.65)O₄@C and CoFe2O4@MgO@C nanocomposites for the efficient removal of Zn(II) ions from aqueous media. These advanced materials are designed to optimize adsorption performance by combining the high stability of cobalt ferrite with the superior adsorption capabilities of magnesium oxide and carbonaceous components. The structural and surface properties of these nanocomposites enhance Zn(II) ion capture through synergistic interactions, improving adsorption kinetics and overall removal efficiency.

2. Results and Discussion

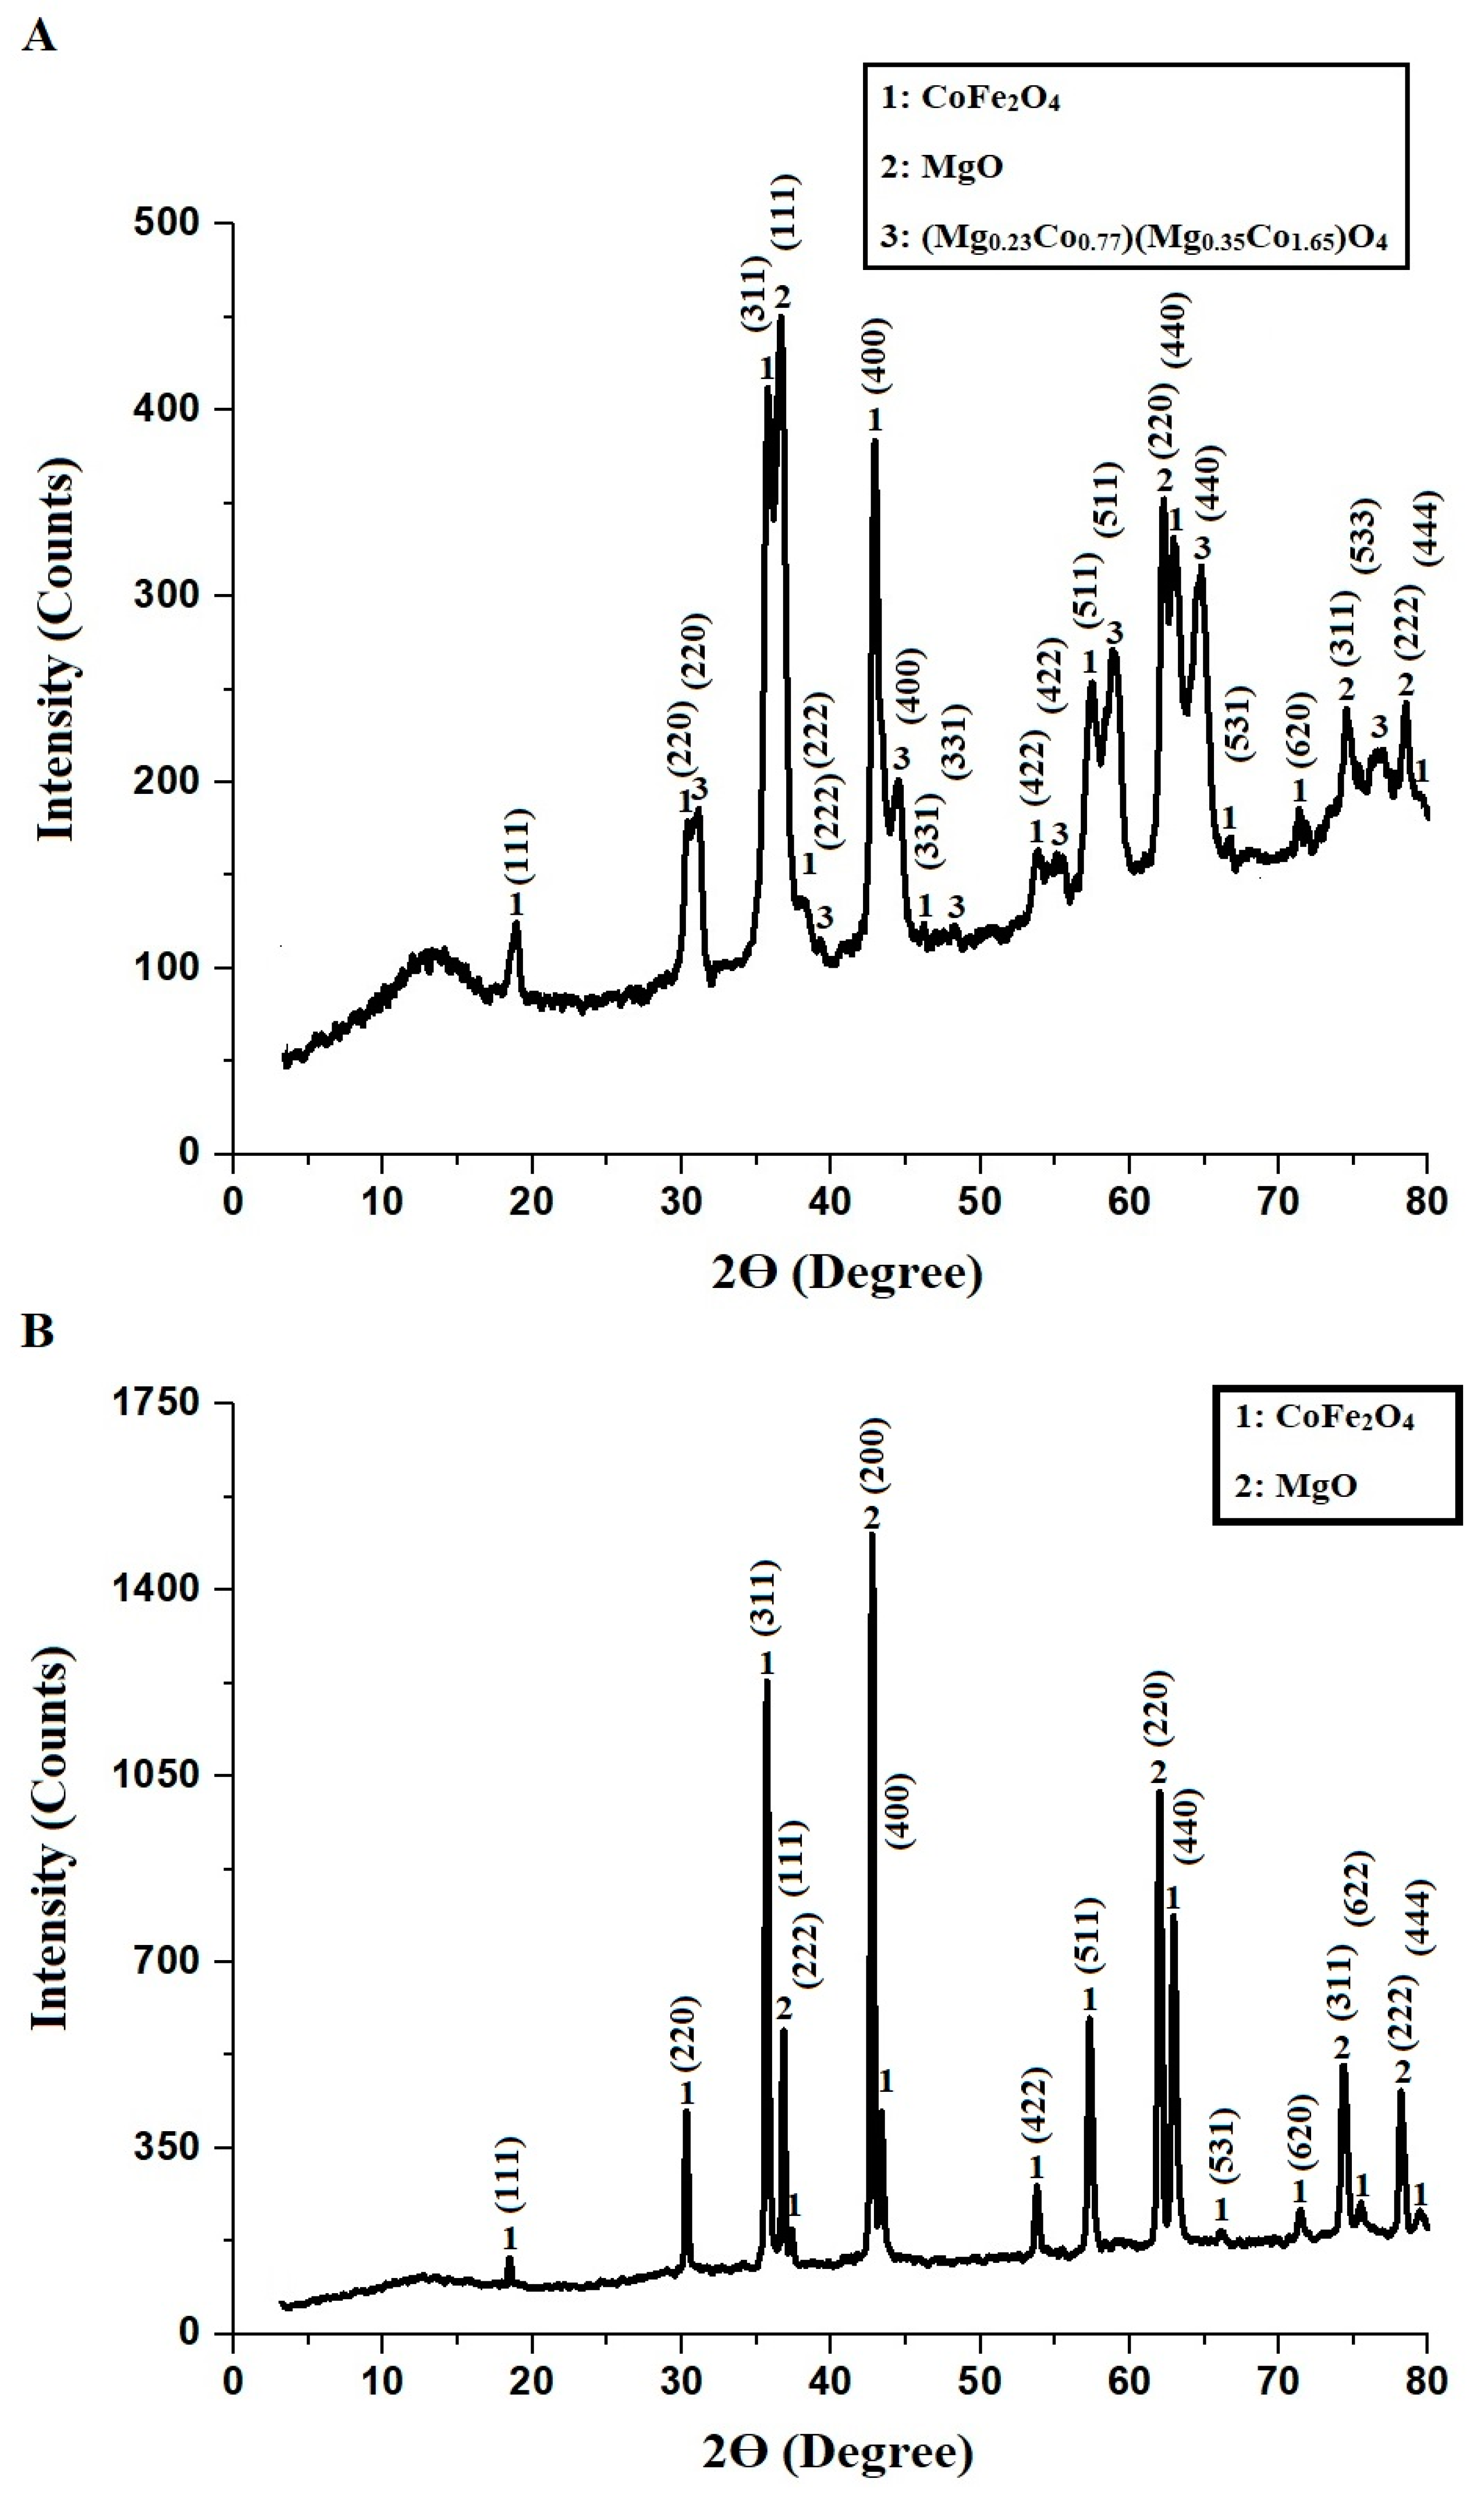
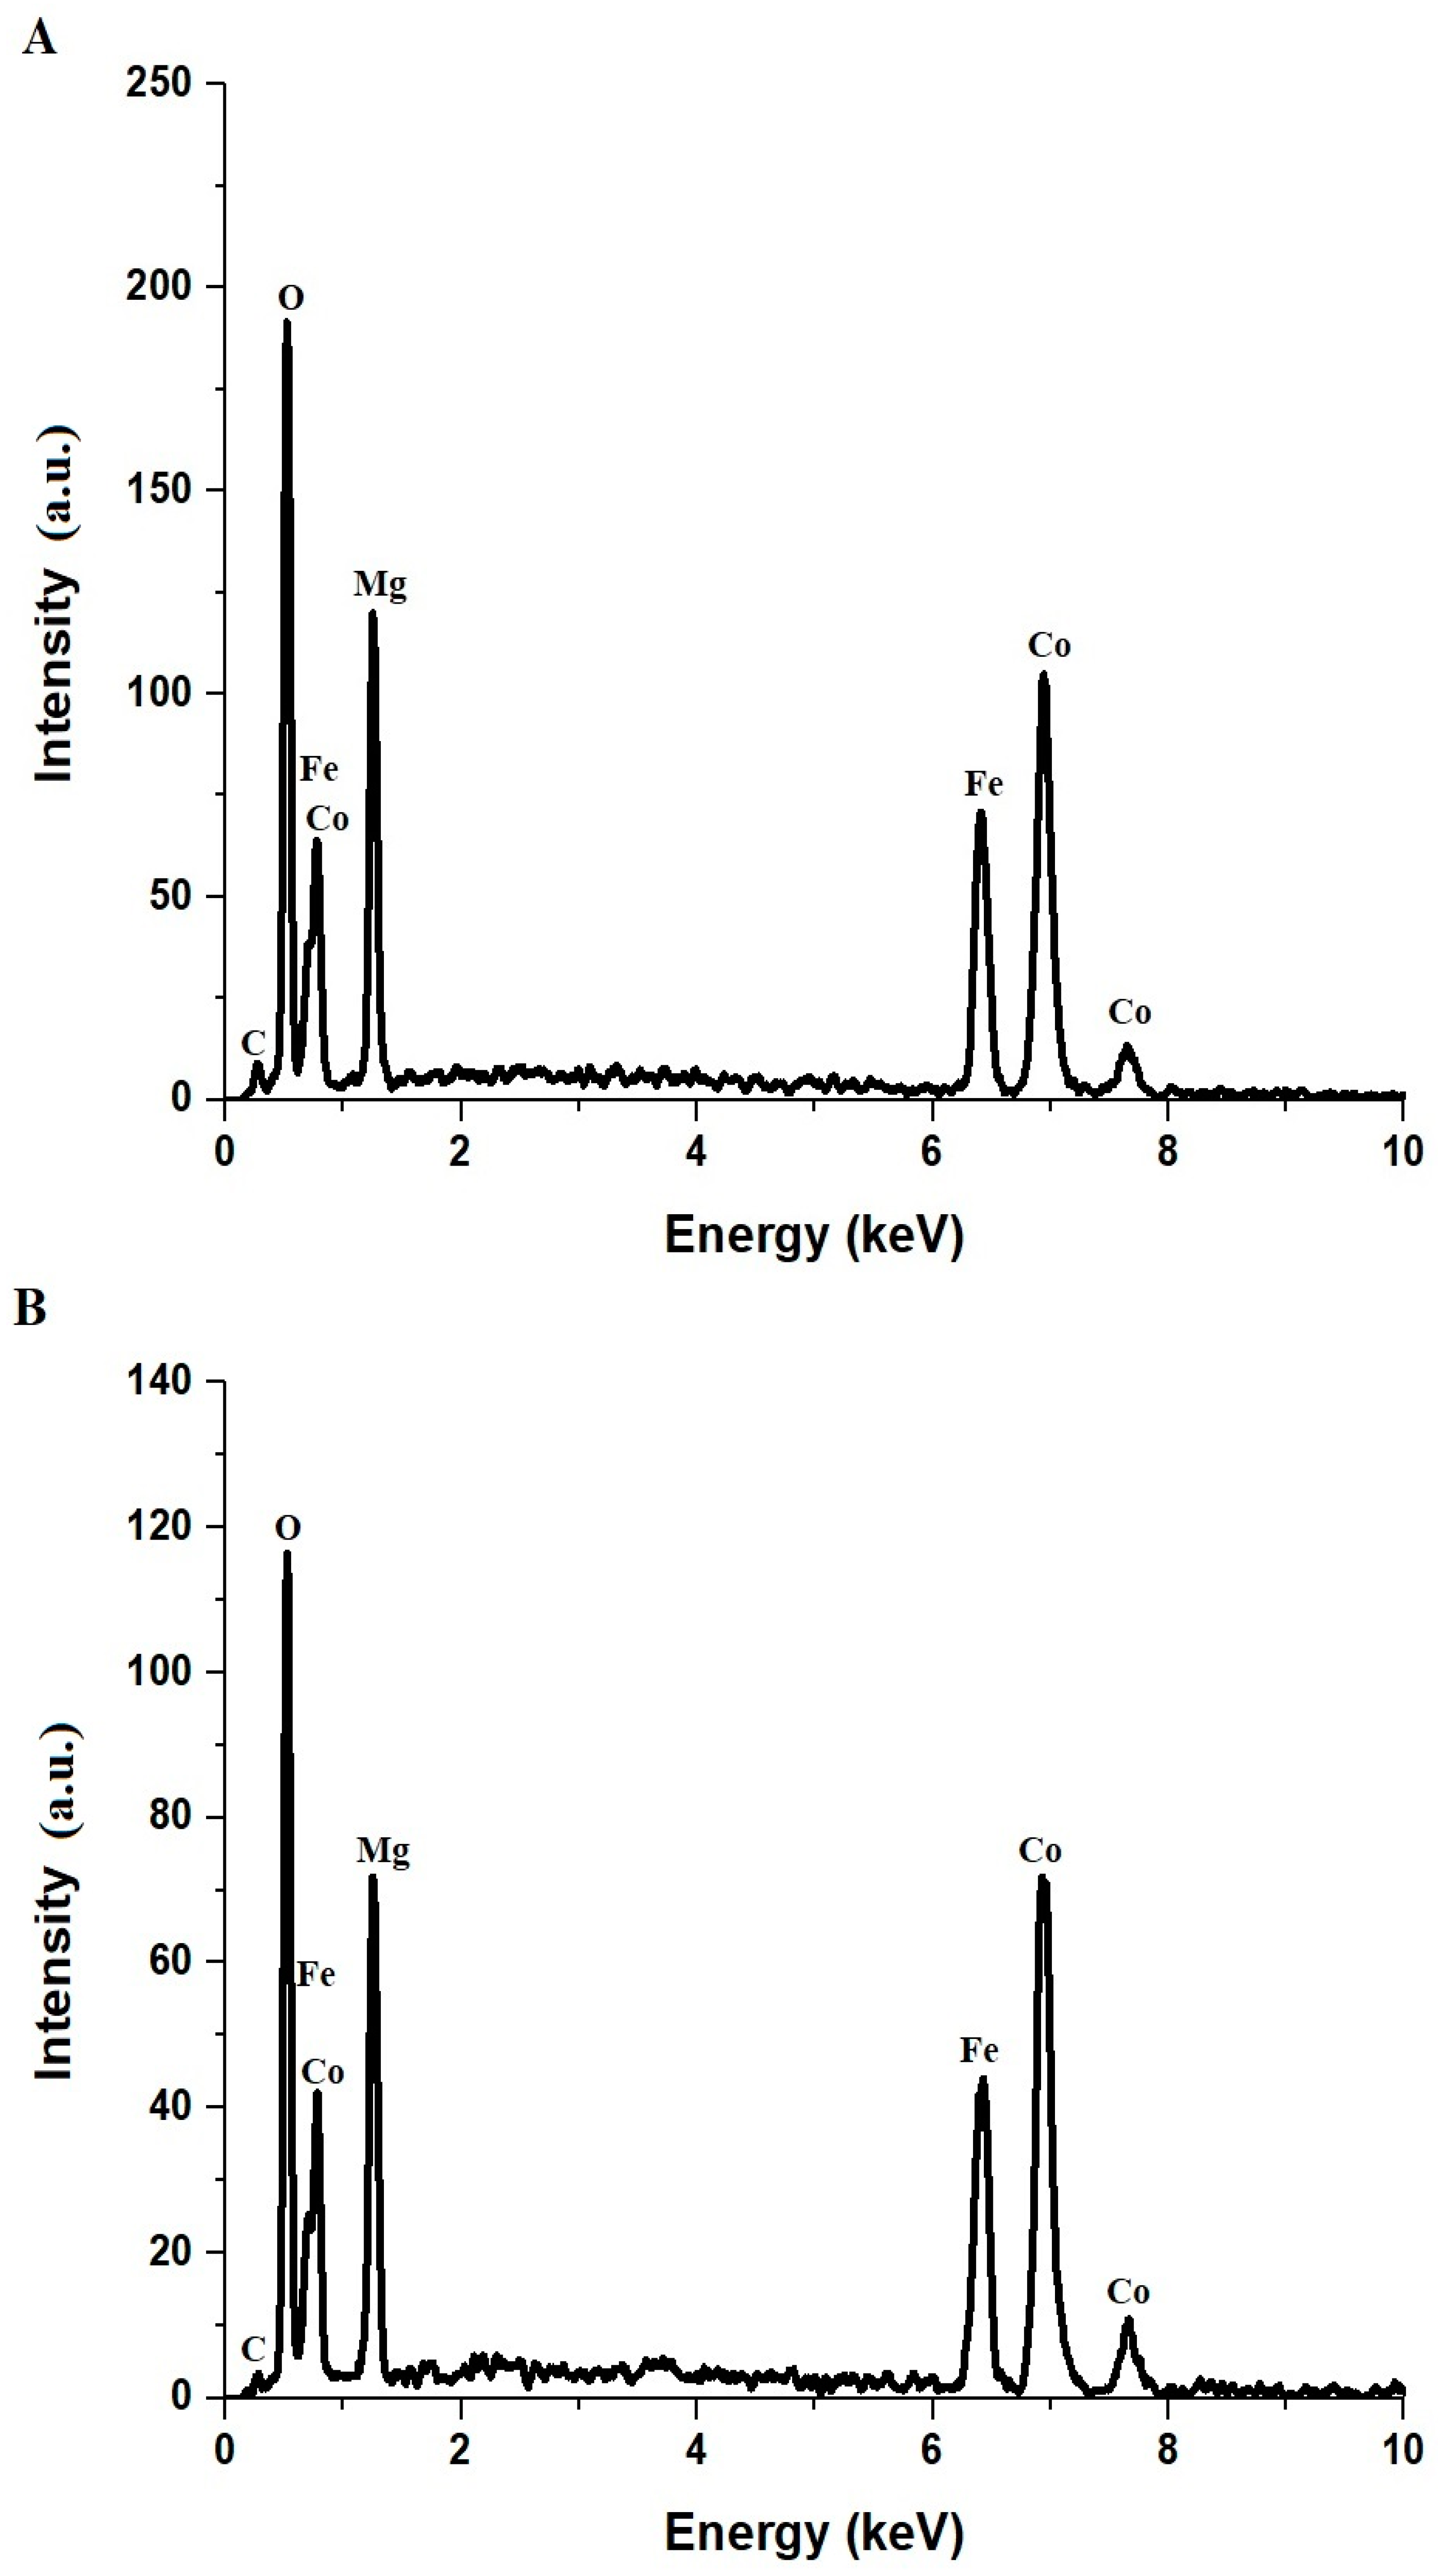
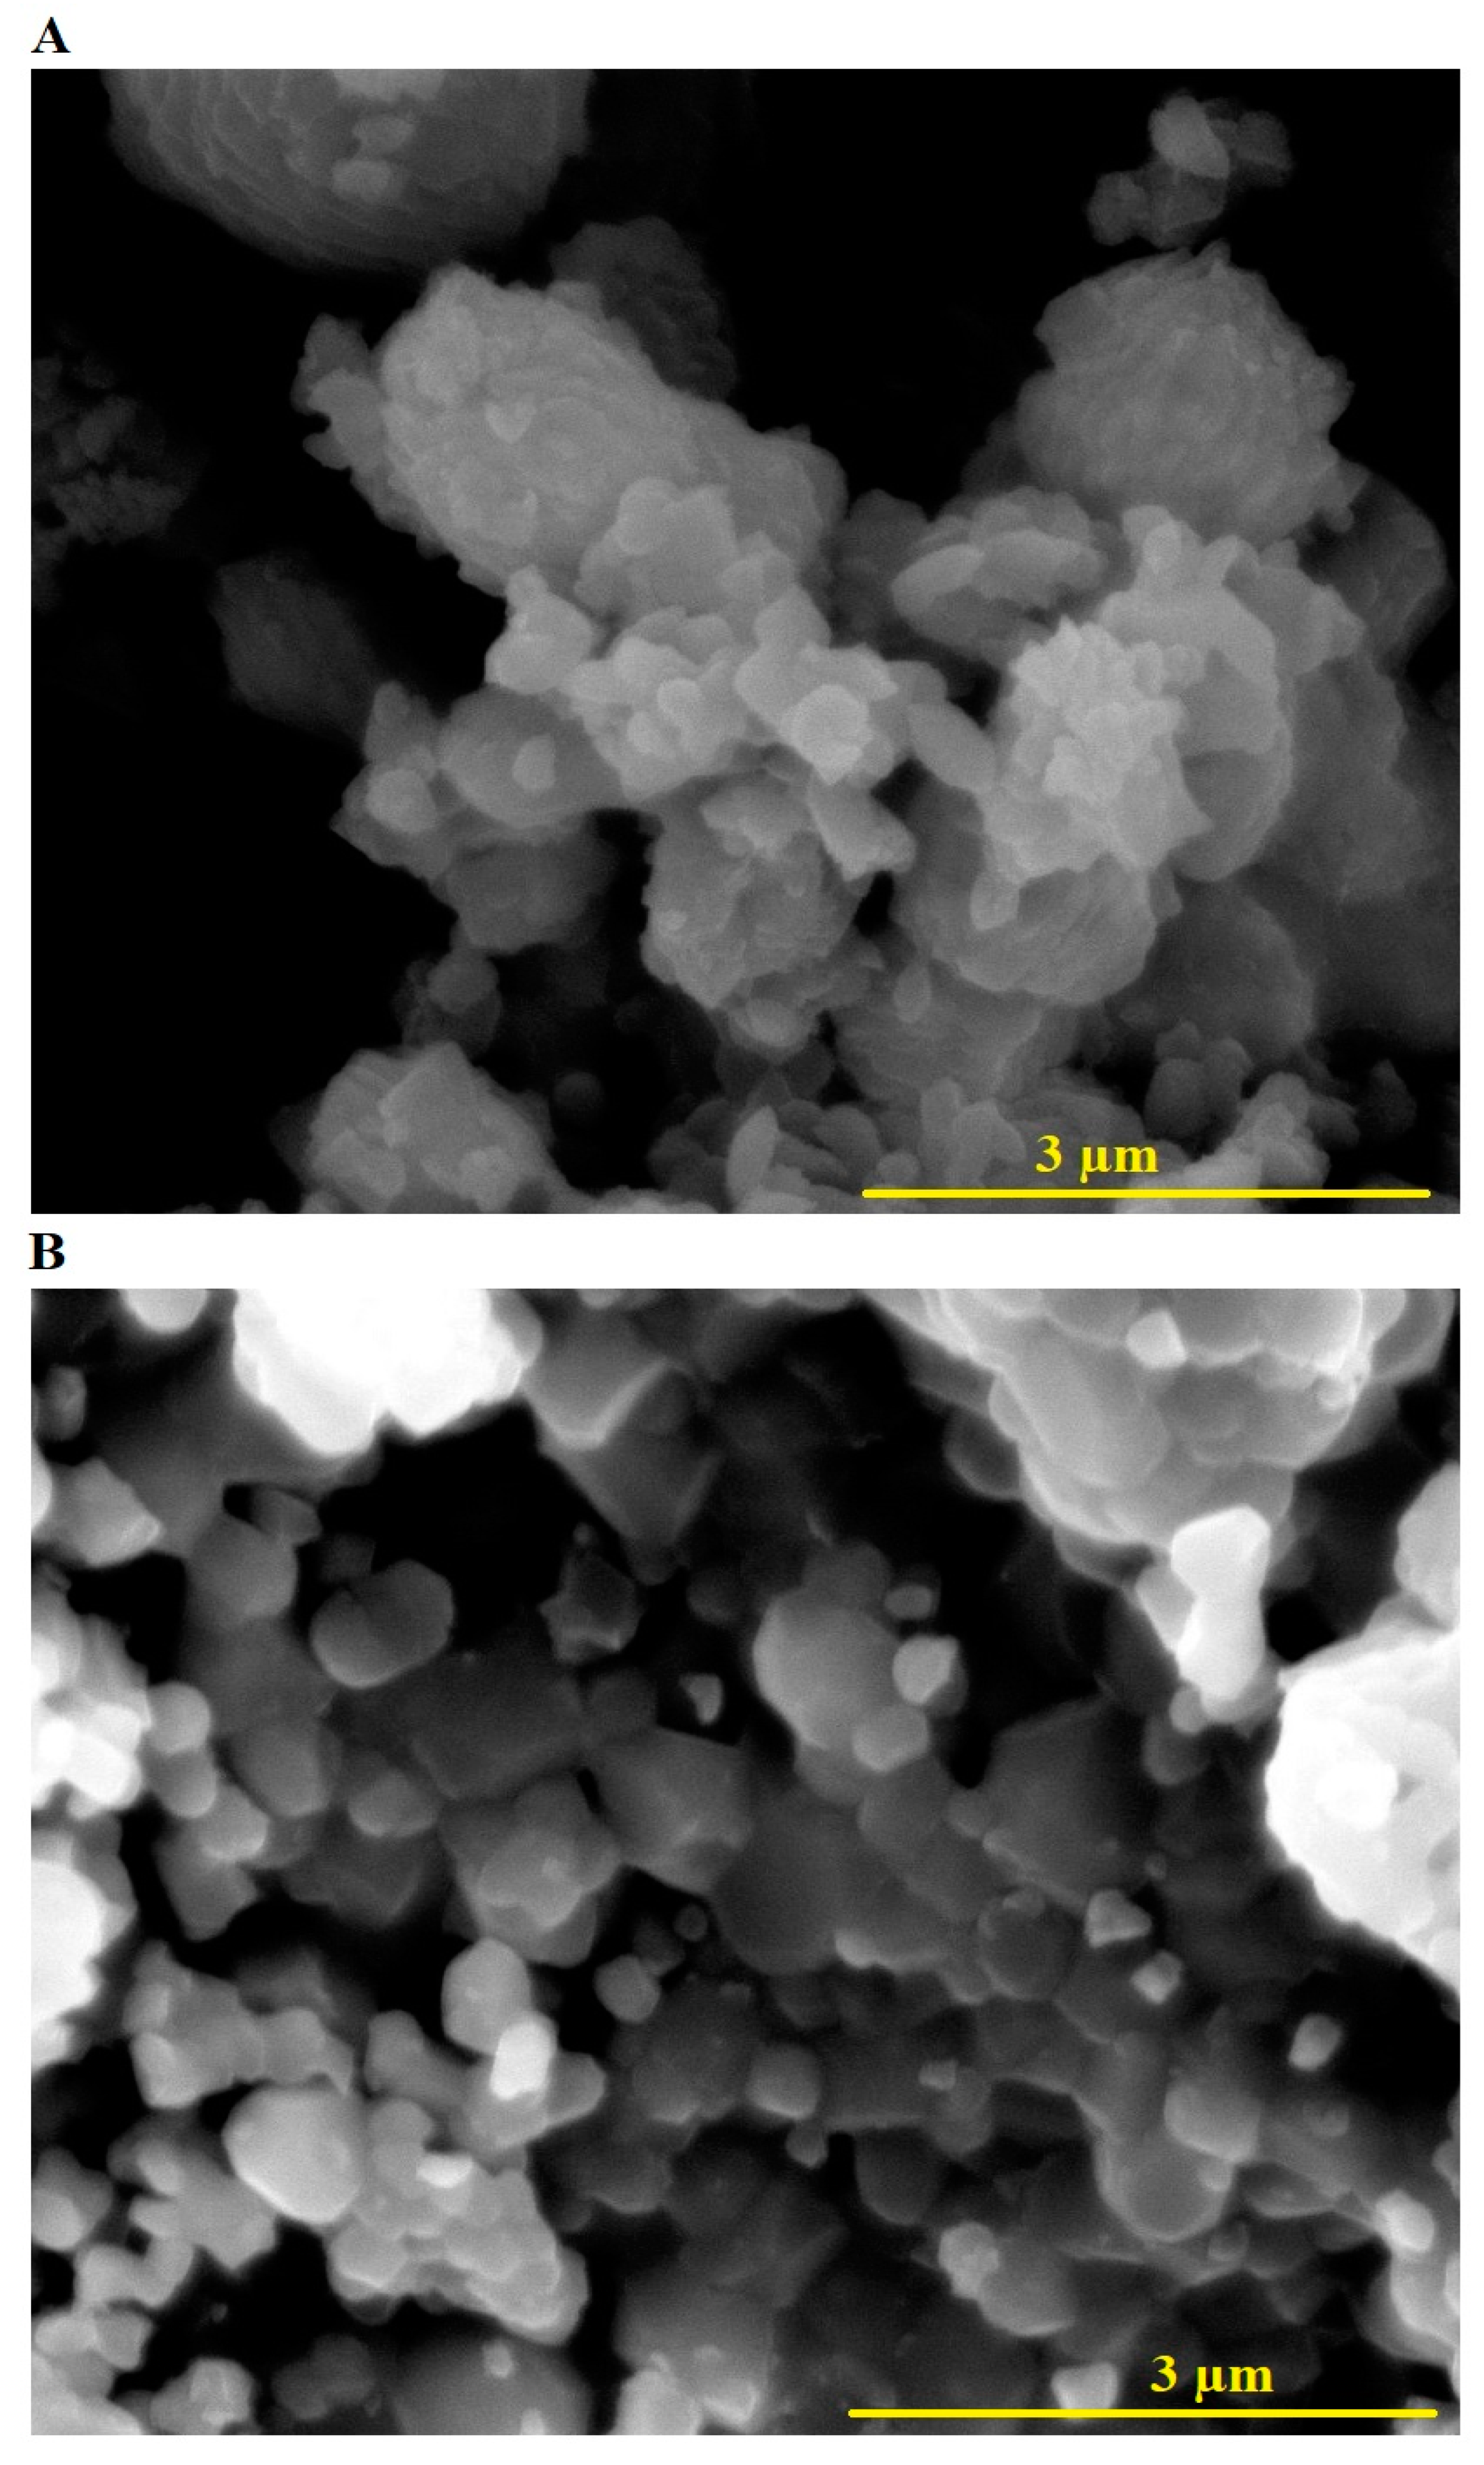
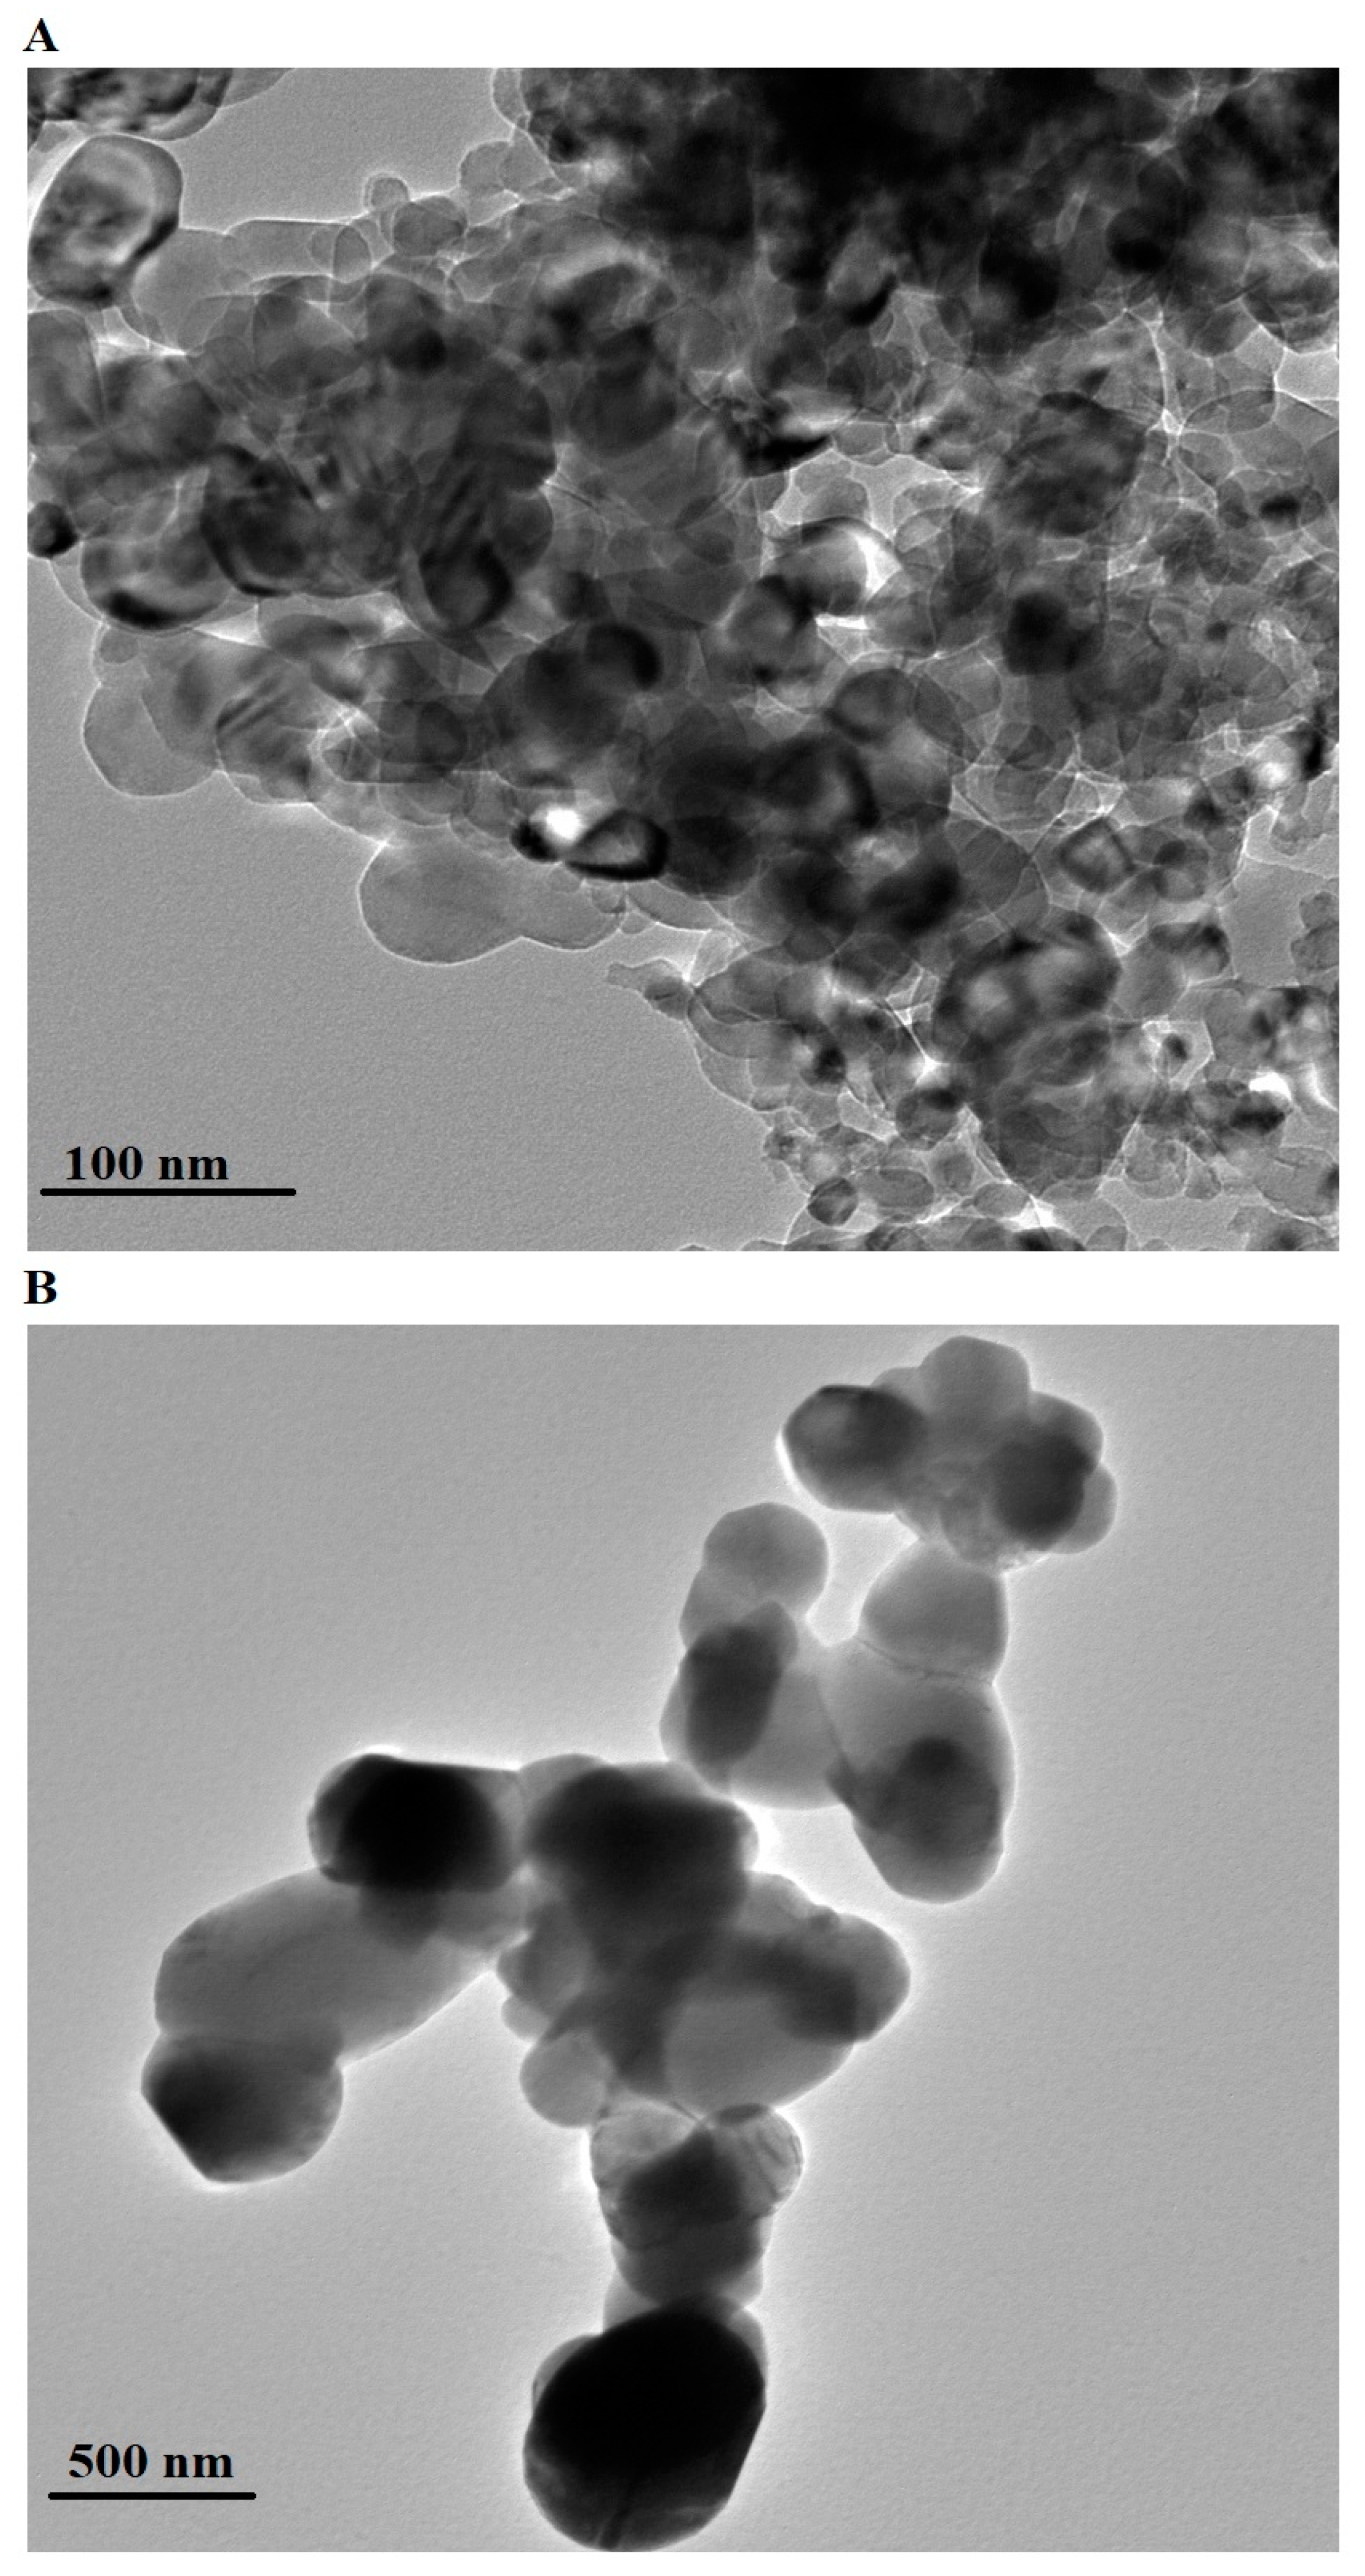
2.1. Characterization

Figure 1 illustrates the XRD patterns of CoFe-MgO-C-M600 (Figure 1A) and CoFe-MgO-C-M800 (Figure 1B) nanocomposites, highlighting the structural and crystallographic details of their components. The CoFe-MgO-C-M600 sample predominantly features cobalt iron oxide (CoFe2O4), magnesium oxide (MgO), and magnesium cobalt oxide ((Mg0.23Co0.77)(Mg0.35Co1.65)O4), with all phases exhibiting a cubic crystal system and corresponding to JCPDS cards 01-086-4412, 01-087-0653, and 01-081-0668, respectively. In contrast, the CoFe-MgO-C-M800 nanocomposite retains CoFe2O4 and MgO phases with the same crystal structure and JCPDS references. The diffraction peaks for CoFe2O4 are observed at 2Ɵ angles of 18.76, 30.31, 35.77, 37.98, 43.01, 46.17, 53.83, 57.49, 62.85, 66.63, 71.46, 75.55, and 79.43, corresponding to the Miller indices (111), (220), (311), (222), (400), (331), (422), (511), (440), (531), (620), (622), and (444), respectively. For MgO, the diffraction peaks appear at 2Ɵ angles of 36.61, 42.81, 62.22, 74.49, and 78.49, with Miller indices (111), (200), (220), (311), and (222), respectively. The magnesium cobalt oxide ((Mg0.23Co0.77)(Mg0.35Co1.65)O4) phase shows diffraction peaks at 2Ɵ angles of 31.06, 39.23, 44.49, 48.26, 55.30, 58.97, 64.73, and 76.69°, corresponding to the Miller indices (220), (222), (400), (331), (422), (511), (440), and (533), respectively.
The average crystallite size (D) of the synthesized nanocomposites was estimated using the Scherrer Equation (1).
D = K λ β c o s Ɵ
where K is the shape factor (0.9), λ is the X-ray wavelength (1.5406 Å for Cu-Kα radiation), β is the full width at half maximum (FWHM) (in radians), and θ is the Bragg angle of the corresponding peak.
The average crystallite size of the nanocomposite synthesized at 600 °C (CoFe-MgO-C-M600) is 38.67 nm, while the nanocomposite synthesized at 800 °C (CoFe-MgO-C-M800) exhibits a larger average crystallite size of 75.48 nm. These values reflect the influence of the synthesis temperature on the structural properties of the materials. The carbon phase in the synthesized nanocomposites originates from residual organic components introduced during the Pechini sol-gel synthesis, including tartaric acid and polyethylene glycol. The absence of distinct diffraction peaks for carbon in the XRD patterns can be attributed to its predominantly amorphous nature, which lacks long-range crystalline order. Moreover, the carbon phase is present in a dispersed form within the nanocomposite, further reducing the likelihood of observable diffraction peaks. Similar observations have been reported in previous studies where amorphous carbon structures remain undetectable in XRD but are confirmed through complementary techniques such as EDX [26].
Figure 2 displays the EDX spectra of the CoFe-MgO-C-M600 (Figure 2A) and CoFe-MgO-C-M800 (Figure 2B) nanocomposites, synthesized via the Pechini sol-gel method using tartaric acid and polyethylene glycol 400 as key precursors. The spectra confirm the presence of carbon (C), oxygen (O), magnesium (Mg), iron (Fe), and cobalt (Co), all of which are integral to the nanocomposites’ structure. The corresponding atomic compositions are summarized in Table 1, with CoFe-MgO-C-M600 containing 4.3% C, 44.5% O, 18.3% Mg, 11.6% Fe, and 21.3% Co, while CoFe-MgO-C-M800 comprises 1.6% C, 42.6% O, 19.9% Mg, 13.9% Fe, and 22.0% Co. The detected carbon originates from residual organic compounds, primarily due to the presence of tartaric acid and polyethylene glycol, which serve as chelating and polymerizing agents during the sol-gel process. The notably higher carbon content in CoFe-MgO-C-M600 compared to CoFe-MgO-C-M800 is attributed to the lower calcination temperature of 600 °C, which leaves behind more residual organics. In contrast, the thermal treatment at 800 °C facilitates further decomposition of organic matter, resulting in a significant reduction in carbon content. The increase in Mg, Fe, and Co atomic percentages in CoFe-MgO-C-M800 indicates enhanced crystallinity and compositional optimization with higher calcination temperatures.
Figure 3 presents the FE-SEM images of CoFe-MgO-C-M600 (Figure 3A) and CoFe-MgO-C-M800 (Figure 3B) nanocomposites, offering detailed insights into the morphological evolution influenced by different calcination temperatures. In the CoFe-MgO-C-M600 sample, the nanocomposite displays an aggregated network of irregularly shaped particles with a mixture of spherical and flake-like morphologies. The particles are loosely packed, reflecting incomplete crystallization at the lower calcination temperature of 600 °C. In contrast, the CoFe-MgO-C-M800 sample reveals a denser and more uniform structure, consisting primarily of well-defined polyhedral and spherical particles. The enhanced compactness and particle definition in CoFe-MgO-C-M800 indicate improved crystallization and particle growth due to the higher calcination temperature of 800 °C. These morphological distinctions, particularly the transformation from loosely packed irregular particles in CoFe-MgO-C-M600 to more structured polyhedral and spherical particles in CoFe-MgO-C-M800, underscore the critical role of calcination temperature in tailoring nanocomposite morphology. The improved particle organization and crystallinity in CoFe-MgO-C-M800 further validate the thermal optimization achieved through the Pechini sol-gel synthesis process.
Figure 4 presents the HR-TEM images of the CoFe-MgO-C-M600 (Figure 4A) and CoFe-MgO-C-M800 (Figure 4B) nanocomposites, highlighting the morphological transformations induced by varying calcination temperatures. The HR-TEM image of CoFe-MgO-C-M600 shows clusters of smaller particles exhibiting irregular spherical and slightly aggregated shapes with an average particle diameter of 35.45 nm. This nanoscale structure indicates a more porous and loosely packed morphology, which is typical of materials synthesized at lower calcination temperatures due to incomplete crystal growth and residual organic content. In contrast, the CoFe-MgO-C-M800 nanocomposite displays larger particles with distinct polyhedral and quasi-spherical shapes, forming compact and agglomerated clusters. The average particle diameter of 321.14 nm suggests significant particle growth and densification, driven by the elevated calcination temperature of 800 °C. The higher temperature promotes enhanced crystallinity, particle coalescence, and the decomposition of residual organic components, which contribute to the formation of larger and more compact structures. The observed differences between the CoFe-MgO-C-M600 and CoFe-MgO-C-M800 nanocomposites underscore the crucial role of calcination temperature in governing particle size, morphology, and crystallinity, all of which are critical for tailoring the nanocomposites’ properties for specific applications.

2.2. Removal of Zn(II) Ions from Aqueous Media
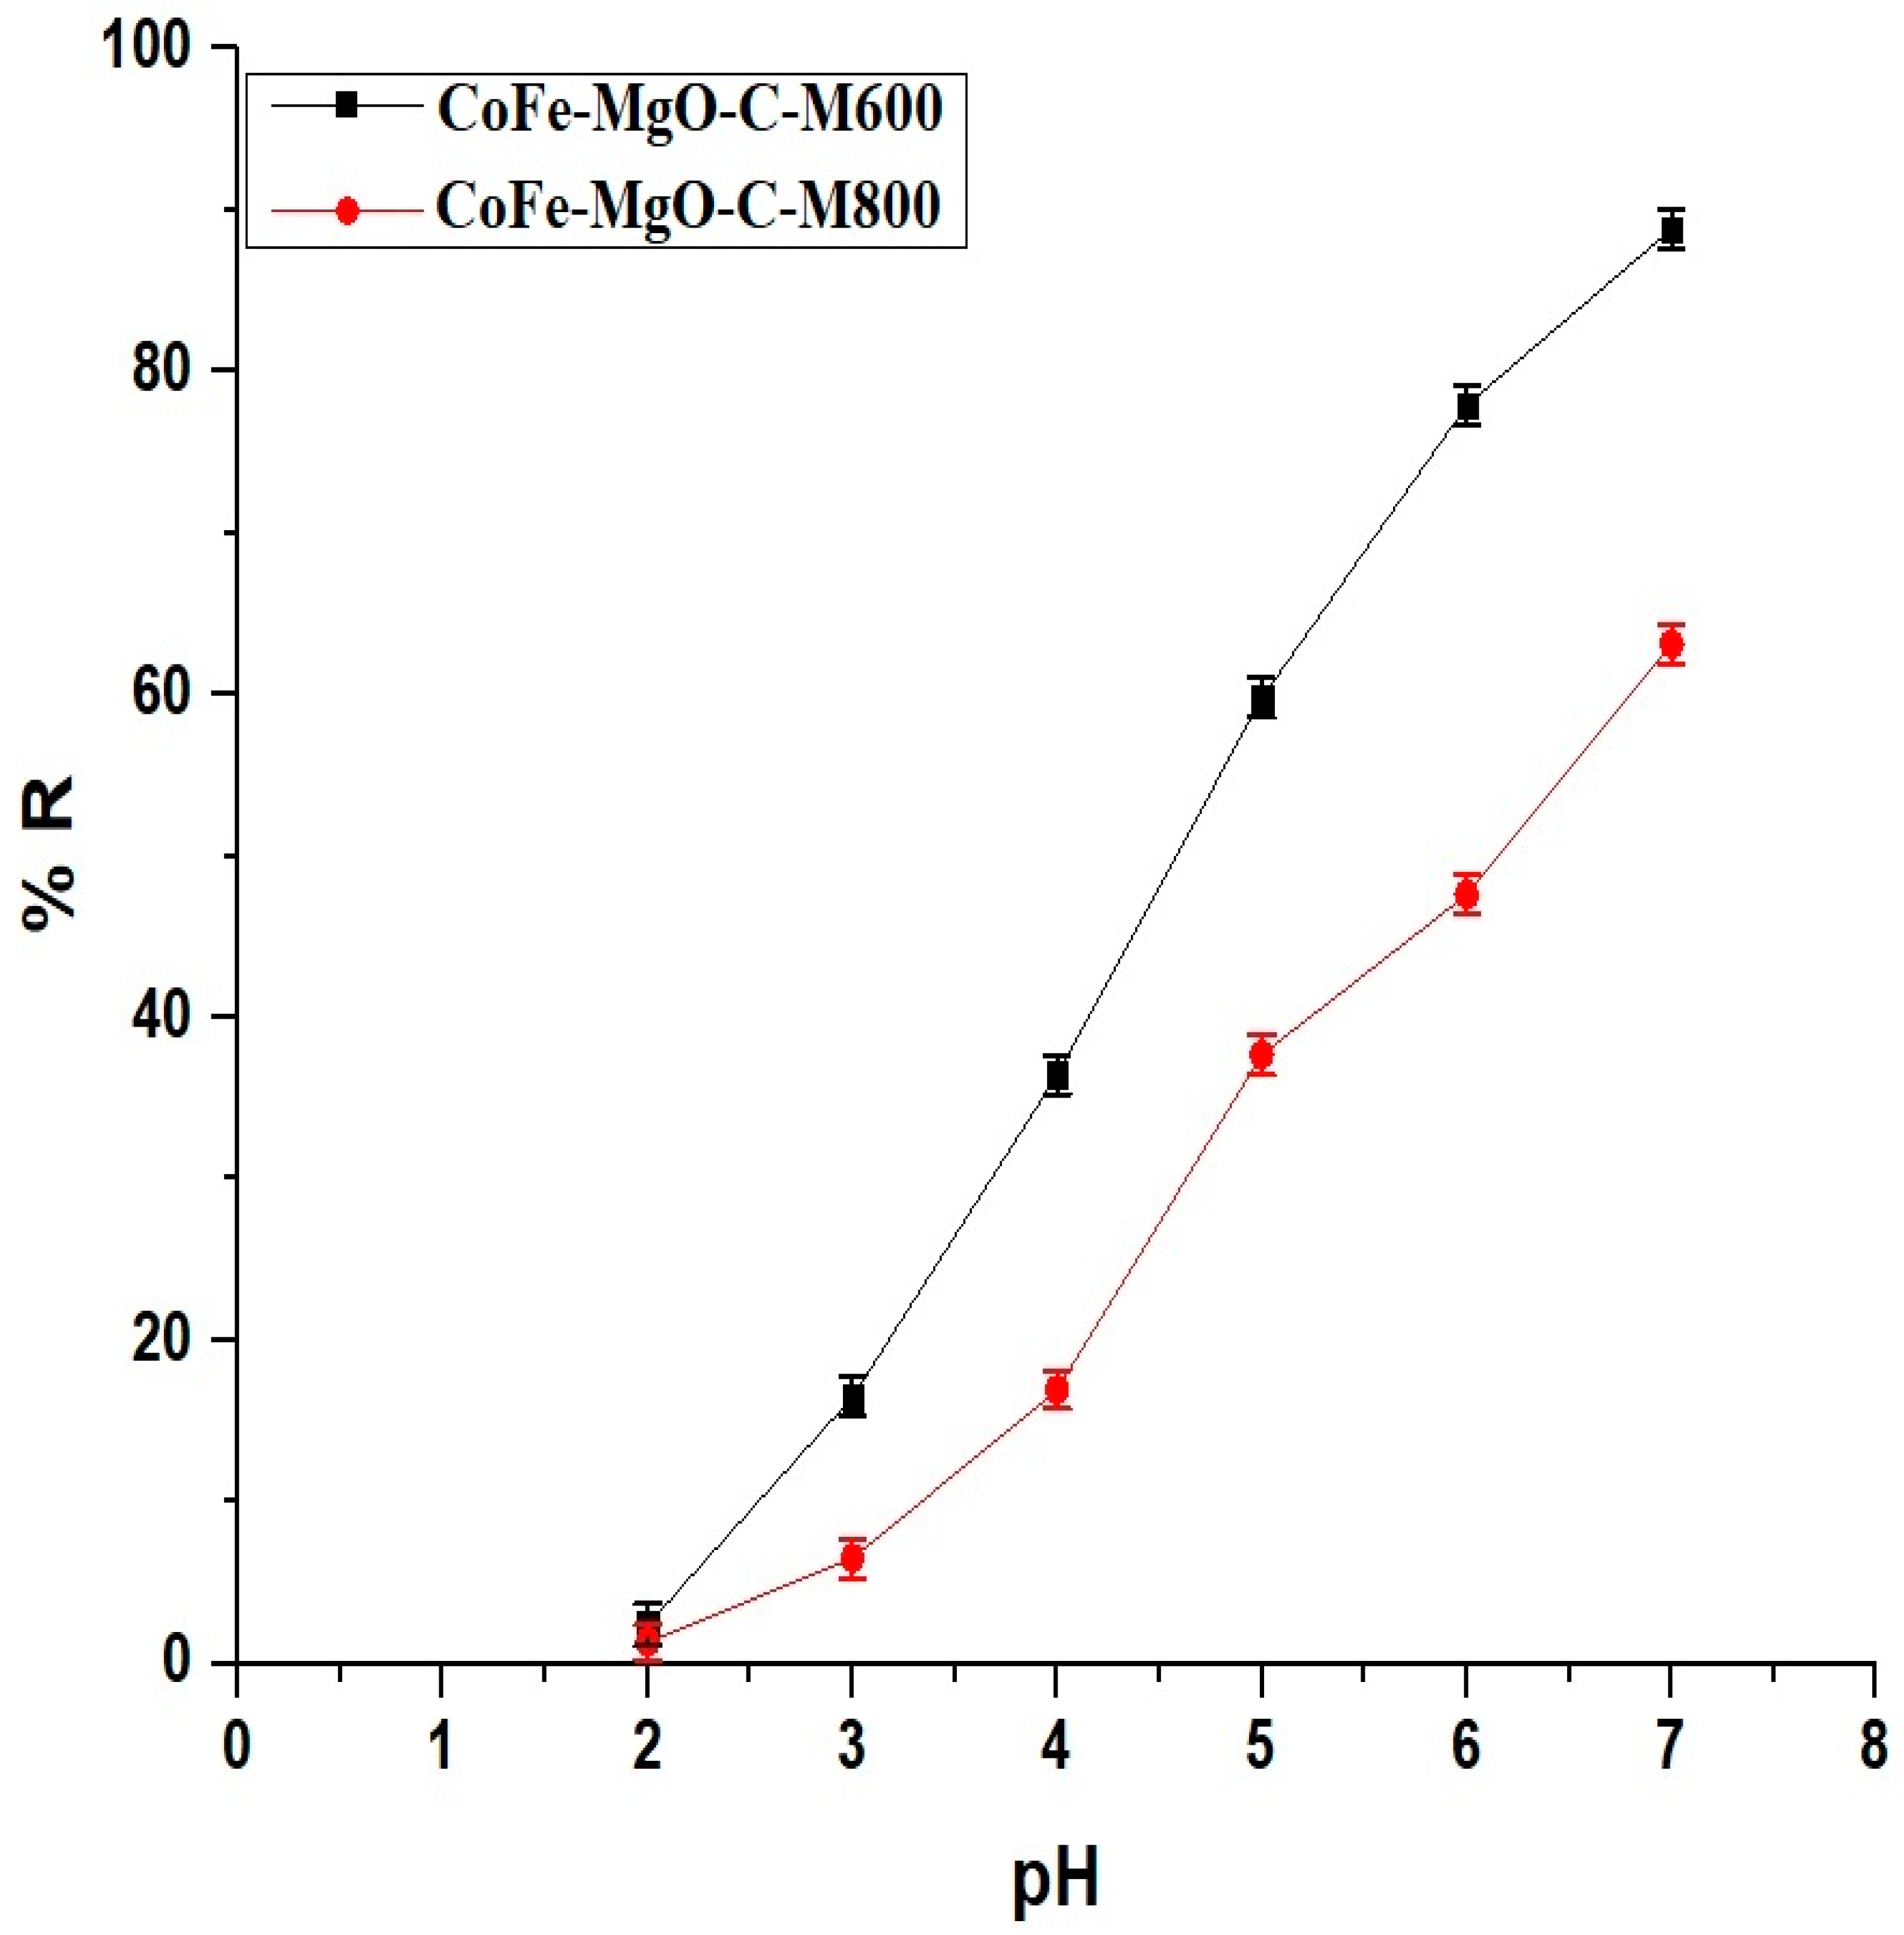
The removal efficiency of Zn(II) ions (% R) and the adsorption capacity of the adsorbent (Q) were calculated using Equations (2) and (3), respectively [27].
% R = C I C e C I × 100
Q = C I C e × V M
In these equations, CI represents the initial Zn(II) ion concentration in mg/L, Ce is the final concentration of Zn(II) ions in the solution in mg/L, V is the volume of the solution in liters, and M is the mass of the adsorbent in mg.

2.2.1. Effect of pH

The removal efficiency of Zn(II) ions, as illustrated in Figure 5, was significantly influenced by the solution pH for both CoFe-MgO-C-M600 and CoFe-MgO-C-M800 nanocomposites. At an acidic pH of 2, the removal efficiency was minimal, with CoFe-MgO-C-M600 achieving 2.44% and CoFe-MgO-C-M800 reaching only 1.35%. As the pH increased to 3, the removal efficiency showed a marked improvement, with CoFe-MgO-C-M600 reaching 16.49% and CoFe-MgO-C-M800 6.50%. This trend continued at pH 4, where CoFe-MgO-C-M600 demonstrated 36.45% removal, significantly outperforming CoFe-MgO-C-M800, which achieved 16.96%. A more pronounced increase was observed at pH 5, where CoFe-MgO-C-M600 attained 59.79% removal compared to CoFe-MgO-C-M800’s 37.68%, highlighting the superior adsorption capacity of CoFe-MgO-C-M600 under moderately acidic conditions. At pH 6, CoFe-MgO-C-M600 achieved 77.93%, while CoFe-MgO-C-M800 showed 47.62%, indicating the increasing impact of pH on the adsorption performance. The maximum removal efficiency occurred at pH 7, with CoFe-MgO-C-M600 reaching 88.81% and CoFe-MgO-C-M800 achieving 63.11%, demonstrating the optimal performance of both samples under near-neutral conditions.

Removal Mechanism of Zn(II) Ions Using CoFe-MgO-C-M600 and CoFe-MgO-C-M800 Nanocomposites

Figure 6 shows the determination of the point of zero charge (pHPZC) for the CoFe-MgO-C-M600 and CoFe-MgO-C-M800 nanocomposites based on the variation of △pH as a function of initial pH (pHI). The pHPZC values were determined to be 5.63 for CoFe-MgO-C-M600 and 6.46 for CoFe-MgO-C-M800, indicating a higher charge neutralization point for CoFe-MgO-C-M800 compared to CoFe-MgO-C-M600. The pHPZC correlates directly with the adsorption performance trends observed in Figure 6, as the removal efficiency of Zn(II) ions increased significantly at pH levels above the respective pHPZC values for both materials. Below the pHPZC, the surface of the adsorbent is positively charged, leading to electrostatic repulsion between the Zn(II) ions and the adsorbent, thereby reducing adsorption efficiency, as shown in Figure 7. As the pH increased beyond the pHPZC, the surface charge of the nanocomposites became more negative, enhancing the electrostatic attraction between the adsorbent and Zn(II) ions and leading to the observed increase in removal efficiency, as shown in Figure 7. Besides, the adsorption efficiency of CoFe-MgO-C-M600 increases almost linearly in the pH range of 3–6 due to the gradual decrease in protonation of functional groups on the adsorbent surface, enhancing the electrostatic attraction between Zn(II) ions and the negatively charged sites. However, beyond pH 6, the rate of increase in adsorption slows down as the system approaches saturation, where most of the active adsorption sites are already occupied by Zn(II) ions.

2.2.2. Effect of Contact Time

The adsorption performance of Zn(II) ions onto the synthesized adsorbents, CoFe-MgO-C-M600 and CoFe-MgO-C-M800, reveals distinct equilibrium behaviors as shown in Figure 8. For CoFe-MgO-C-M600, the percentage removal increased rapidly within the first 10 min, reaching 70.45%, and continued to rise steadily until the equilibrium time of 50 min, where a maximum removal of 88.81% was achieved. Beyond this time, no significant increase was observed, indicating that the adsorbent had reached saturation. In contrast, CoFe-MgO-C-M800 exhibited a lower initial removal percentage of 33.93% at 10 min, progressively improving to 63.77% at the equilibrium time of 70 min. Similar to CoFe-MgO-C-M600, no notable change occurred after the equilibrium point, confirming saturation of the adsorbent. The comparative analysis highlights the superior adsorption efficiency and faster equilibrium attainment of CoFe-MgO-C-M600, which not only reached a higher removal percentage but also achieved equilibrium in a shorter time compared to CoFe-MgO-C-M800. The performance disparity between the two samples can be attributed to differences in surface area, active sites, or structural properties, making CoFe-MgO-C-M600 a more efficient and time-effective adsorbent for Zn(II) ion removal under the tested conditions.
The kinetic behavior of Zn(II) ion adsorption onto CoFe-MgO-C-M600 and CoFe-MgO-C-M800 samples was evaluated through the application of both the pseudo-first-order and pseudo-second-order kinetic models, as depicted in Figure 9A,B, respectively. The pseudo-first-order model is mathematically defined by Equation (4) [28].
log Q e Q t = l o g Q e K 1 2.303 t
In this context, Qe (mg/g) denotes the adsorption capacity at equilibrium, while Qt (mg/g) refers to the adsorption capacity at a given time t (min). The parameter K1 (1/min) represents the rate constant associated with the pseudo-first-order kinetic model.
The pseudo-second-order kinetic model is mathematically defined by Equation (5) [28].
t Q t = 1 K 2 Q e 2 + 1 Q e t
where, K2 (g/mg·min) represents the rate constant associated with the pseudo-second-order kinetic model.
Figure 9 presents the fitting curves corresponding to both kinetic models. The kinetic parameters obtained from these models are summarized in Table 2. The experimental adsorption capacities (QExp) were determined to be 266.44 mg/g for CoFe-MgO-C-M600 and 191.32 mg/g for CoFe-MgO-C-M800. The pseudo-first-order model provided moderate fits, with R2 values of 0.9986 for CoFe-MgO-C-M600 and 0.9720 for CoFe-MgO-C-M800. However, the calculated Qe values of 85.63 mg/g for CoFe-MgO-C-M600 and 106.53 mg/g for CoFe-MgO-C-M800 showed significant deviations from the experimental results. On the other hand, the pseudo-second-order model demonstrated superior fitting accuracy, yielding R2 values of 0.9994 for both samples. Figure 9 illustrates the kinetic modeling of Zn(II) ion adsorption onto CoFe-MgO-C-M600 and CoFe-MgO-C-M800 nanocomposites. The experimentally obtained adsorption capacities (Qexp) were 266.44 mg/g for CoFe-MgO-C-M600 and 191.32 mg/g for CoFe-MgO-C-M800, as determined from batch adsorption experiments. These values closely align with the adsorption capacities calculated using the pseudo-second-order model, which yielded Qe values of 269.54 mg/g for CoFe-MgO-C-M600 and 196.46 mg/g for CoFe-MgO-C-M800. In contrast, the pseudo-first-order model significantly underestimated these values, predicting Qe values of 85.63 mg/g for CoFe-MgO-C-M600 and 106.53 mg/g for CoFe-MgO-C-M800. This strong agreement between the experimental and calculated values further confirms that the adsorption process follows the pseudo-second-order kinetic model.
The pseudo-second-order model is often associated with chemisorption, but it can also describe adsorption processes involving electrostatic interactions or ion-exchange mechanisms, depending on the system studied. In this study, Zn(II) adsorption onto CoFe-MgO-C-M600 and CoFe-MgO-C-M800 occurs primarily via electrostatic attraction between the positively charged Zn²⁺ ions and the negatively charged surface functional groups (e.g., hydroxyl groups on MgO and CoFe2O4) at pH values above the pHPZC. This electrostatic interaction ensures strong Zn(II) binding to the nanocomposite surface. The pseudo-second-order kinetic model effectively describes this adsorption behavior, suggesting that the adsorption rate is controlled by surface interactions and the availability of active sites.

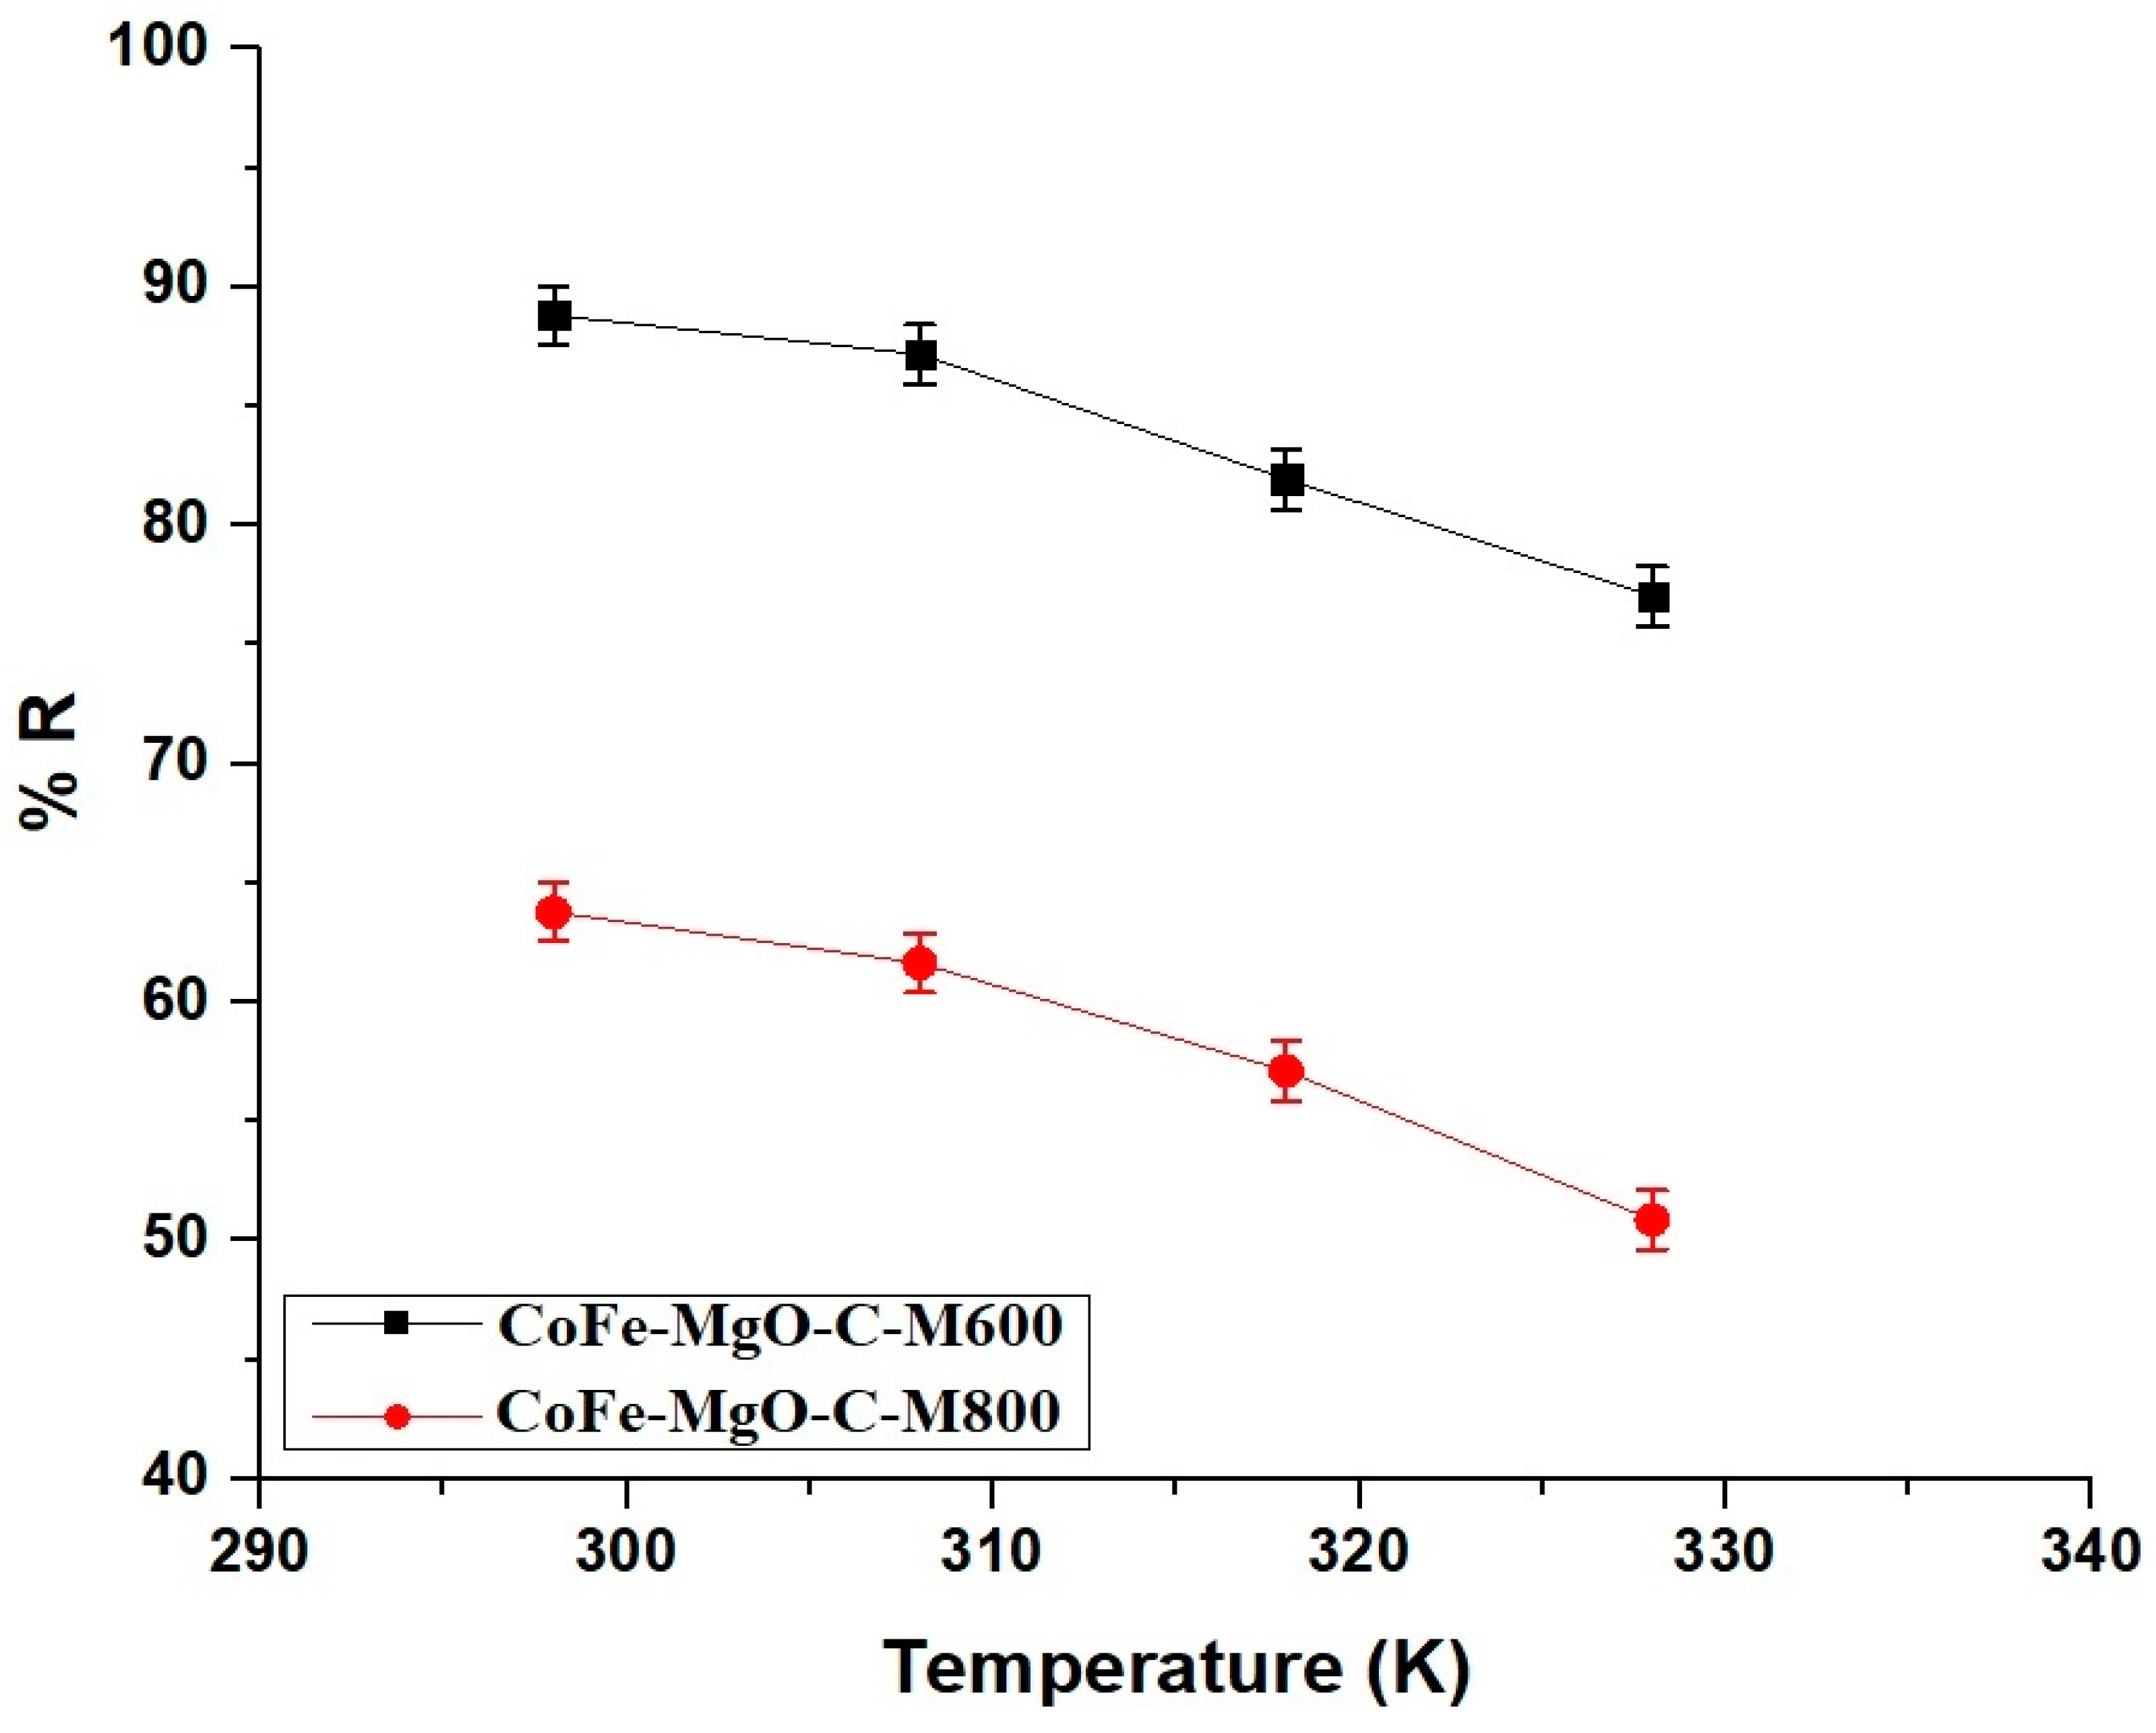
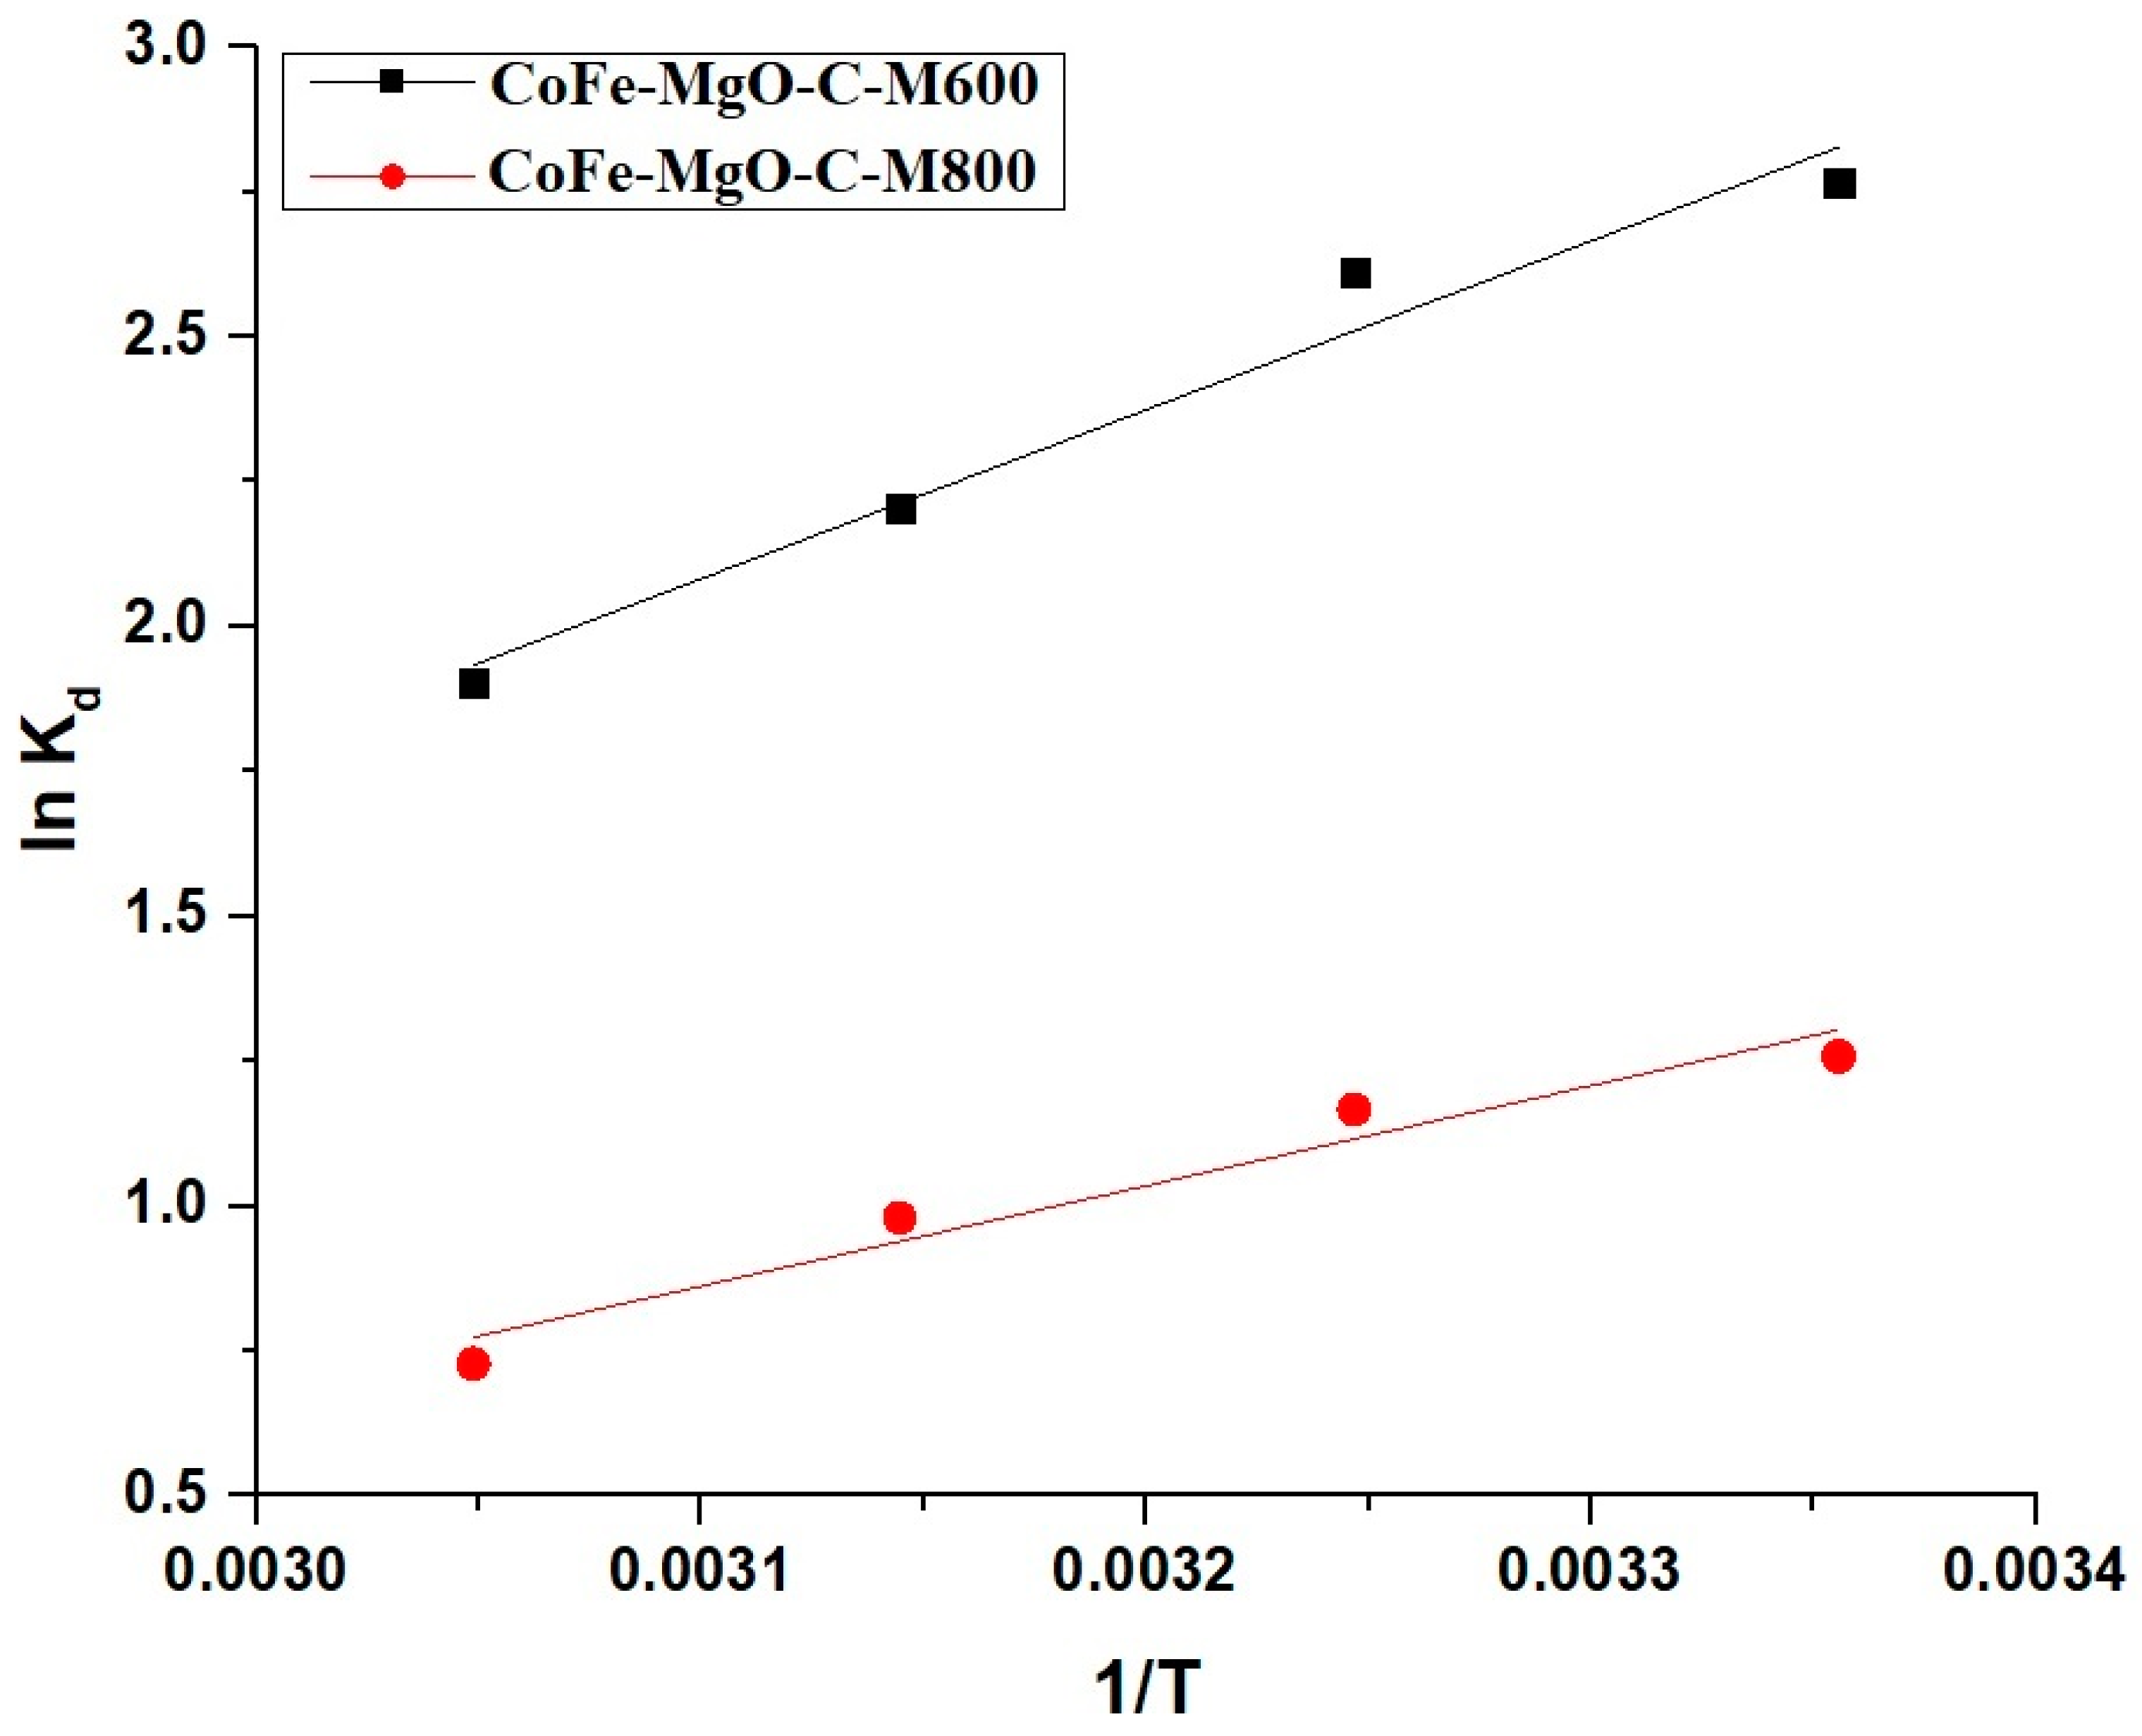
2.2.3. Effect of Temperature

At 298 K, the removal efficiency of Zn(II) ions was 88.81% for CoFe-MgO-C-M600 and 63.77% for CoFe-MgO-C-M800, indicating a higher adsorption capacity for CoFe-MgO-C-M600 compared to CoFe-MgO-C-M800 at this temperature. As the temperature increased to 328 K the removal efficiency decreased for both samples, with CoFe-MgO-C-M600 achieving 77.03% and CoFe-MgO-C-M800 reaching 50.87%, which suggests a reduction in adsorption performance at elevated temperatures. The decline in efficiency for both materials with increasing temperature implies a potential exothermic nature of the adsorption process. The consistently higher removal efficiency of CoFe-MgO-C-M600 compared to CoFe-MgO-C-M800 across both temperatures highlights the superior adsorption capacity of CoFe-MgO-C-M600, which may be attributed to differences in surface properties or structural characteristics. Figure 10 visually represents these trends demonstrating the temperature-dependent behavior of both materials in Zn(II) ion removal.
The thermodynamic behavior of Zn(II) ion adsorption onto CoFe-MgO-C-M600 and CoFe-MgO-C-M800 nanocomposites was analyzed through the Van’t Hoff equation along with relevant thermodynamic formulations. Equation (6) describes how the equilibrium distribution coefficient varies with temperature, providing insight into the adsorption process [29].
l n K d = S o R H o R T
In this context, Kd (L/g) represents the distribution coefficient, while △S° (kJ/mol·K) and △H° (kJ/mol) correspond to the standard entropy and enthalpy changes, respectively. The universal gas constant is denoted as R (8.314 × 10⁻³ kJ/mol·K), while T (K) signifies the absolute temperature.
The Gibbs free energy change (△G°, kJ/mol) is mathematically defined by Equation (7) [29].
G o = H o T S o
The distribution coefficient is mathematically defined by Equation (8) [29].
K d = Q e C e
The adsorption of Zn(II) ions onto CoFe-MgO-C-M600 and CoFe-MgO-C-M800 follows a physical mechanism since the enthalpy change (△H) for both materials is below 40 kJ/mol. The negative values of △H indicate that the adsorption process is exothermic, meaning that higher temperatures reduce adsorption efficiency. The spontaneity of the process is confirmed by the negative Gibbs free energy (△G) values across all studied temperatures, signifying a thermodynamically favorable reaction. Furthermore, the positive entropy change (△S) suggests increased randomness at the solid–liquid interface, contributing to the feasibility of adsorption. The positive entropy change suggests an increase in disorder at the solid–liquid interface during adsorption, which appears unusual given that adsorption is typically associated with decreased randomness. However, this increase in entropy can be attributed to the release of solvated water molecules from the hydrated Zn(II) ion coordination sphere upon adsorption. In aqueous solution, Zn(II) ions exist as hydrated complexes, and when they bind to the negatively charged surface functional groups of the nanocomposites, the coordinated water molecules are displaced into the bulk solution, leading to increased entropy. This effect counterbalances the ordering typically associated with adsorption, resulting in an overall positive △S°.
Figure 11 illustrates the Van’t Hoff plots for CoFe-MgO-C-M600 and CoFe-MgO-C-M800, showing a linear relationship between lnKd and 1/T, which supports the thermodynamic analysis. The values in Table 3 further confirm these findings, demonstrating higher adsorption efficiency for CoFe-MgO-C-M600, which can be attributed to its greater △S and more negative △G compared to CoFe-MgO-C-M800.

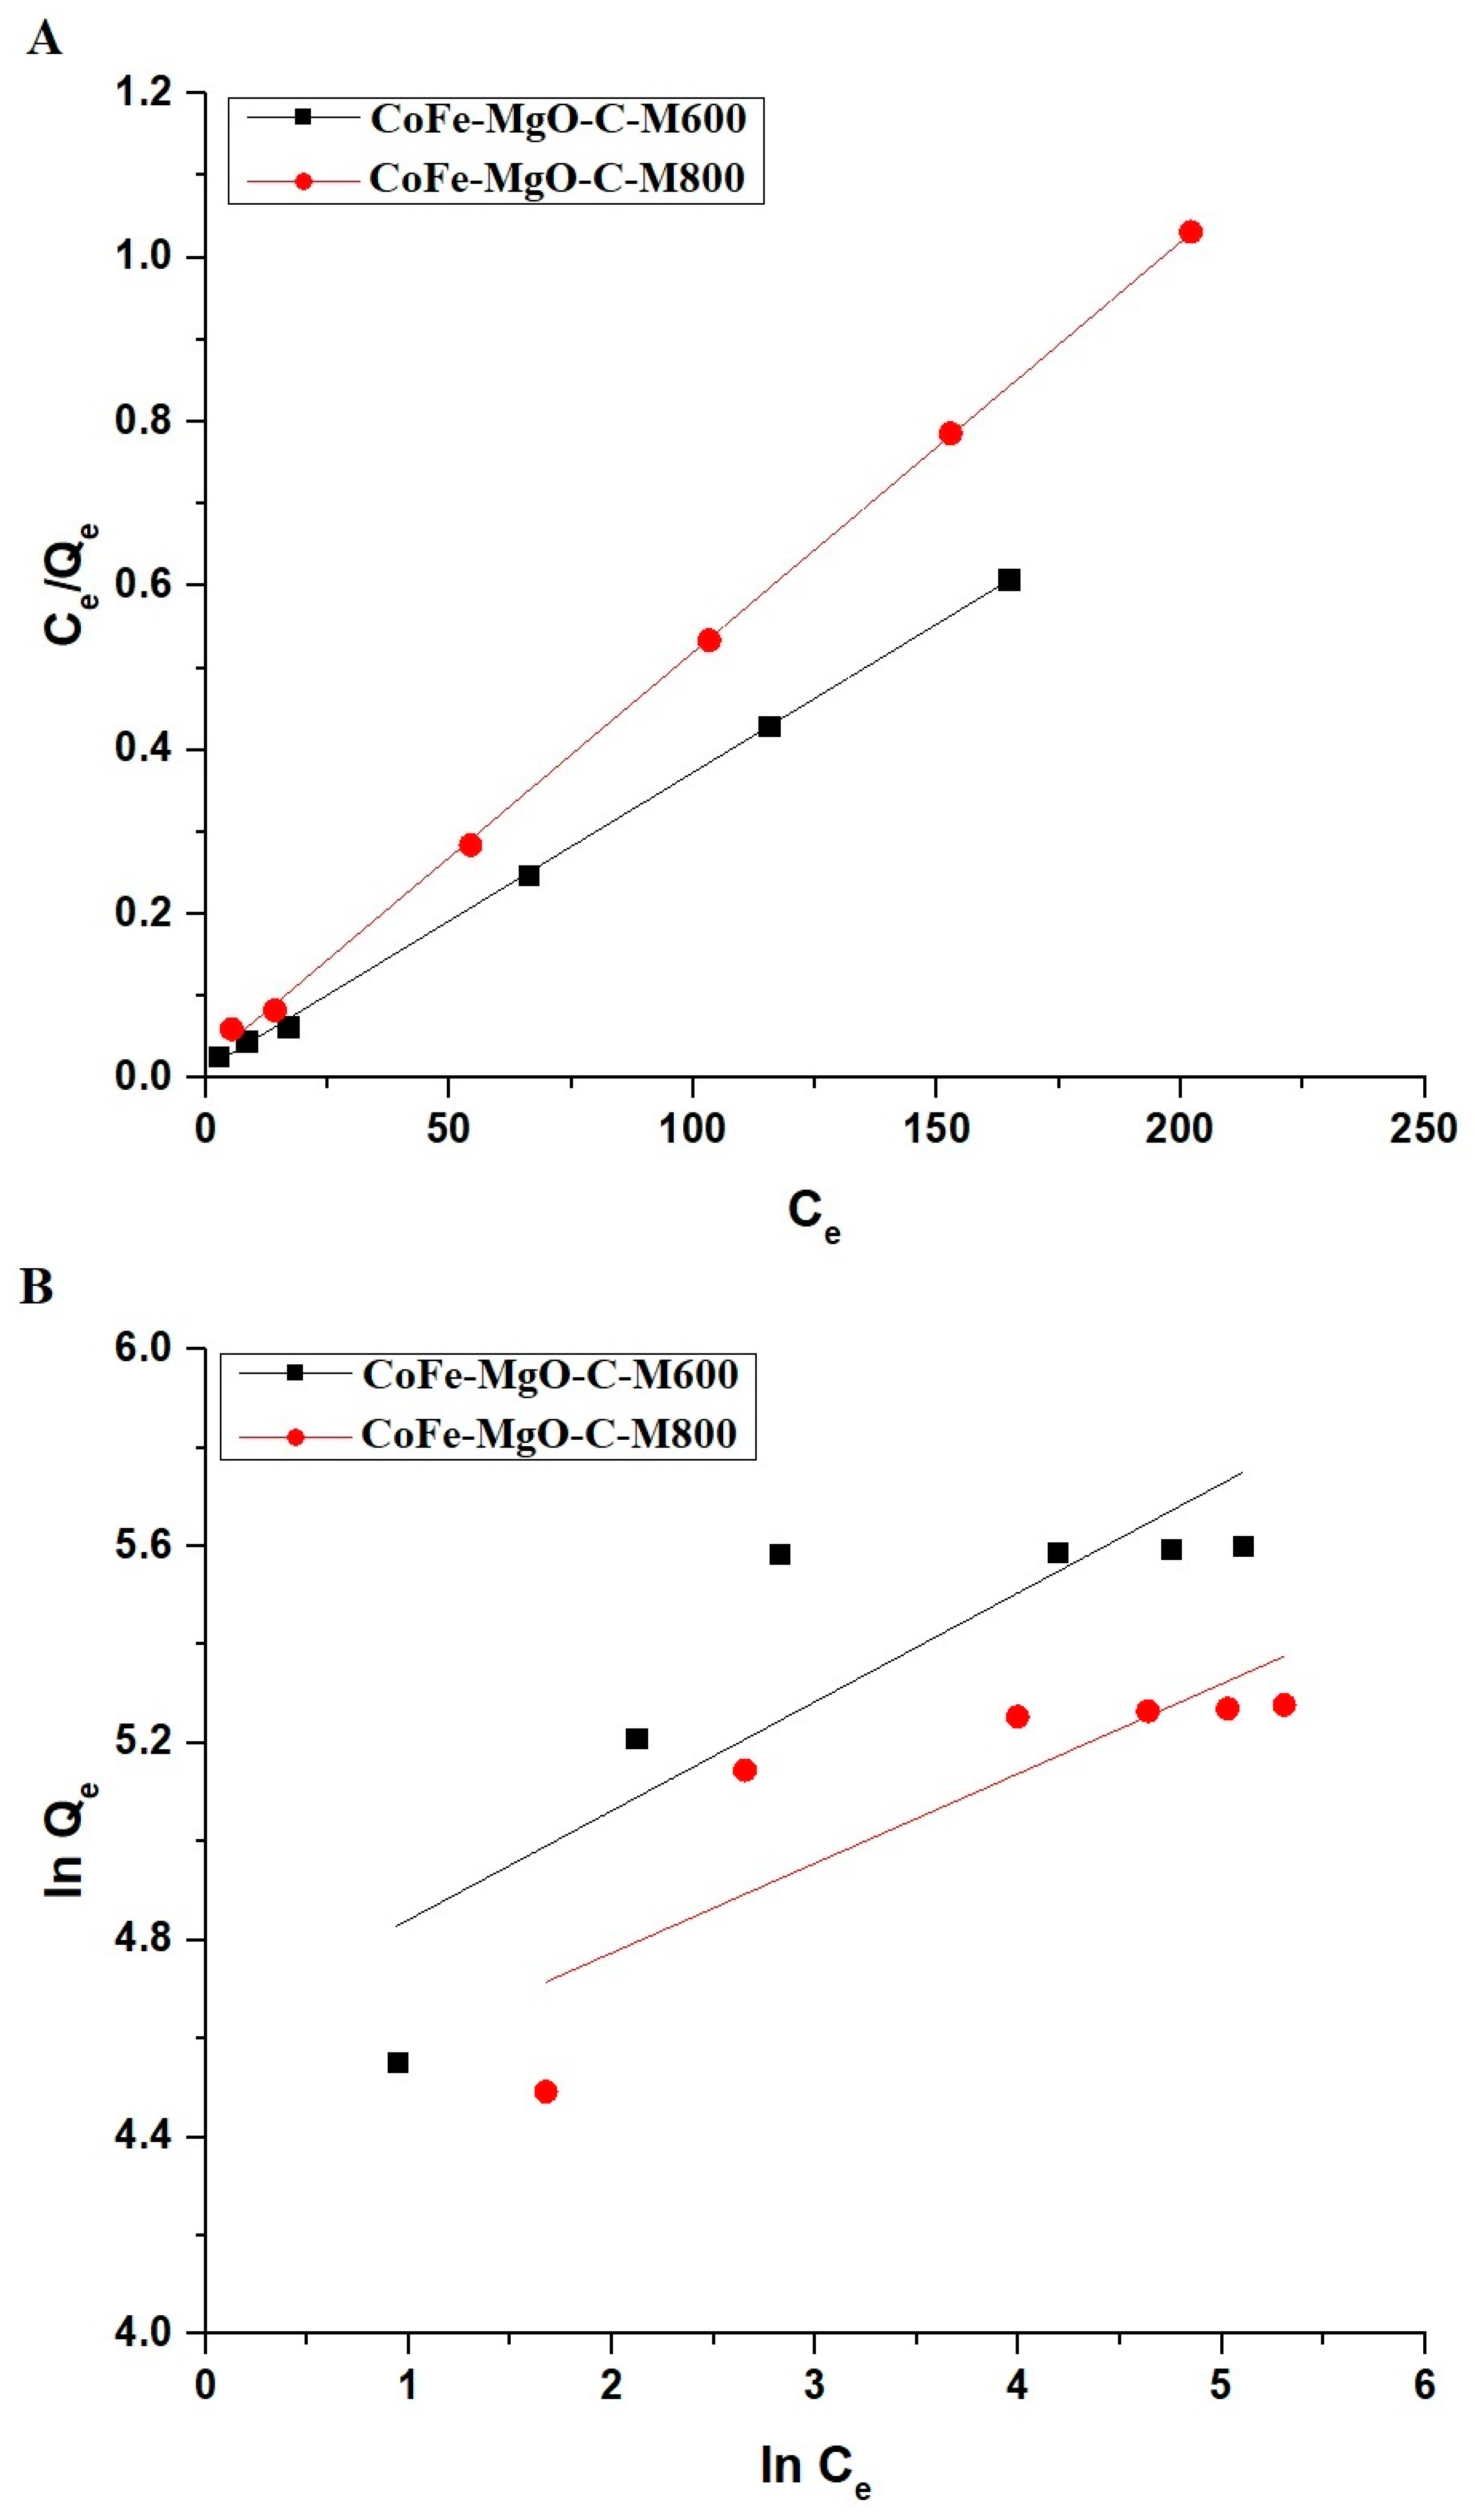
2.2.4. Effect of Concentration

The removal efficiency of Zn(II) ions decreases as the initial concentration increases for both CoFe-MgO-C-M600 and CoFe-MgO-C-M800 nanocomposites, indicating a decline in adsorption capacity at higher solute concentrations. At 50 mg/L, CoFe-MgO-C-M600 exhibits a higher removal efficiency compared to CoFe-MgO-C-M800, demonstrating its superior adsorption performance. As the concentration rises to 150 mg/L, the removal efficiency of both materials declines significantly, with CoFe-MgO-C-M600 maintaining better performance than CoFe-MgO-C-M800. Beyond 200 mg/L, the reduction in adsorption becomes more pronounced, suggesting saturation of active sites on both materials. CoFe-MgO-C-M600 consistently shows higher Zn(II) ion removal across all concentrations, which may be attributed to its enhanced surface characteristics. Figure 12 illustrates this trend, confirming that adsorption efficiency is inversely related to initial Zn(II) concentration.
The adsorption behavior of Zn(II) ions on CoFe-MgO-C-M600 and CoFe-MgO-C-M800 was evaluated using the Langmuir and Freundlich isotherm models, as illustrated in Figure 13A,B, respectively. The Langmuir model, which characterizes monolayer adsorption on a homogeneous surface, is mathematically represented by Equation (9) [30].
C e Q e = 1 K 3 Q m a x + C e Q m a x
In this context, Qmax (mg/g) represents the highest adsorption capacity, while K3 (L/mg) denotes the Langmuir equilibrium constant, which reflects the affinity between the adsorbent and the Zn(II) ions.
The Freundlich isotherm is mathematically represented by Equation (10) [30].
l n Q e = l n K 4 + 1 n l n C e
In this context, 1/n is a parameter indicating the intensity of adsorption, while K4 ((mg/g)(L/mg)1/n) is the Freundlich constant.
Moreover, the highest adsorption capacity is associated with the Freundlich parameters and can be expressed through Equation (11) [30].
Q m a x = K 4 C o 1 / n
The adsorption of Zn(II) ions onto CoFe-MgO-C-M600 and CoFe-MgO-C-M800 is best described by the Langmuir isotherm model, as indicated by the high correlation coefficients (R2) in Table 4. The maximum adsorption capacity (Qmax) is higher for CoFe-MgO-C-M600 than for CoFe-MgO-C-M800, suggesting a greater affinity and adsorption capability of CoFe-MgO-C-M600. Figure 13A illustrates the linear fitting of the Langmuir model, confirming monolayer adsorption on a homogenous surface. The Freundlich model, represented in Figure 13B, exhibits lower R2 values, indicating that multilayer adsorption is less applicable in this system. The higher Langmuir constants for CoFe-MgO-C-M600 suggest stronger binding interactions compared to CoFe-MgO-C-M800, further supporting its superior performance in Zn(II) ion removal.
The adsorption capacities of various materials for Zn(II) ion removal vary significantly, as presented in Table 5 [31,32,33,34,35,36]. Compared to these adsorbents, CoFe-MgO-C-M600 and CoFe-MgO-C-M800 nanocomposites display significantly superior adsorption capacities of 276.24 mg/g and 200.00 mg/g, respectively, confirming their exceptional efficiency in Zn(II) ion removal. The remarkable performance of CoFe-MgO-C-M600 and CoFe-MgO-C-M800 can be attributed to their optimized surface properties, enhanced active sites, and favorable interactions with Zn(II) ions, which facilitate higher adsorption efficiency. The high adsorption capacity of CoFe-MgO-C-M600, in particular, suggests an even greater affinity for Zn(II) ions, potentially due to its well-structured surface morphology and higher binding site availability.
The significantly higher adsorption capacities of CoFe-MgO-C-M600 (276.24 mg/g) and CoFe-MgO-C-M800 (200.00 mg/g) compared to other materials listed in Table 5 can be attributed to their unique structural and compositional features. Unlike conventional adsorbents such as polyethyleneimine (24.39 mg/g) and γ-MnO2/chitosan/Fe3O4/EDTA (103.40 mg/g), the CoFe-MgO-C nanocomposites exhibit a highly porous network with abundant active sites, enhancing their interaction with Zn(II) ions. The superior performance of CoFe-MgO-C-M600 over MgO-C-M800 is primarily due to its smaller crystallite size (38.67 nm vs. 75.48 nm), which results in a higher surface area and increased availability of adsorption sites. Furthermore, the synergistic effect between CoFe2O4 and MgO enhances the electrostatic attraction between the negatively charged adsorbent surface and Zn(II) ions, facilitating efficient adsorption. Another crucial factor contributing to the enhanced adsorption efficiency is the residual carbon phase. While not a primary structural component, the presence of amorphous carbon improves the dispersion of active sites and may contribute to higher surface interactions. The combination of these features results in the exceptional adsorption capacities observed in this study, reinforcing the practical advantages of these nanocomposites over conventional adsorbents for Zn(II) ion removal.

3. Experimental

3.1. Materials

The chemicals utilized in this research were of analytical grade and sourced from Sigma-Aldrich (St. Louis, MO, USA). Iron(III) nitrate nonahydrate (Fe(NO3)3.9H2O), magnesium nitrate hexahydrate (Mg(NO3)2.6H2O), and cobalt acetate tetrahydrate (Co(CH3COO)2.4H2O) served as the primary precursors for iron, magnesium, and cobalt, respectively. Tartaric acid (C4H6O6) acted as a chelating agent to coordinate metal ions, while polyethylene glycol 400 (H(OCH2CH2)nOH) functioned as a polymerizing agent, enhancing the formation of a uniform gel network. Sodium hydroxide (NaOH) and hydrochloric acid (HCl) were employed for precise pH adjustments during the synthesis process. Potassium chloride (KCl) was used as a supporting electrolyte to maintain stability during pH control experiments. Zinc nitrate hexahydrate (Zn(NO3)2.6H2O) was applied in adsorption tests. All reagents were utilized without additional purification to ensure uniformity and reproducibility across all experimental stages.

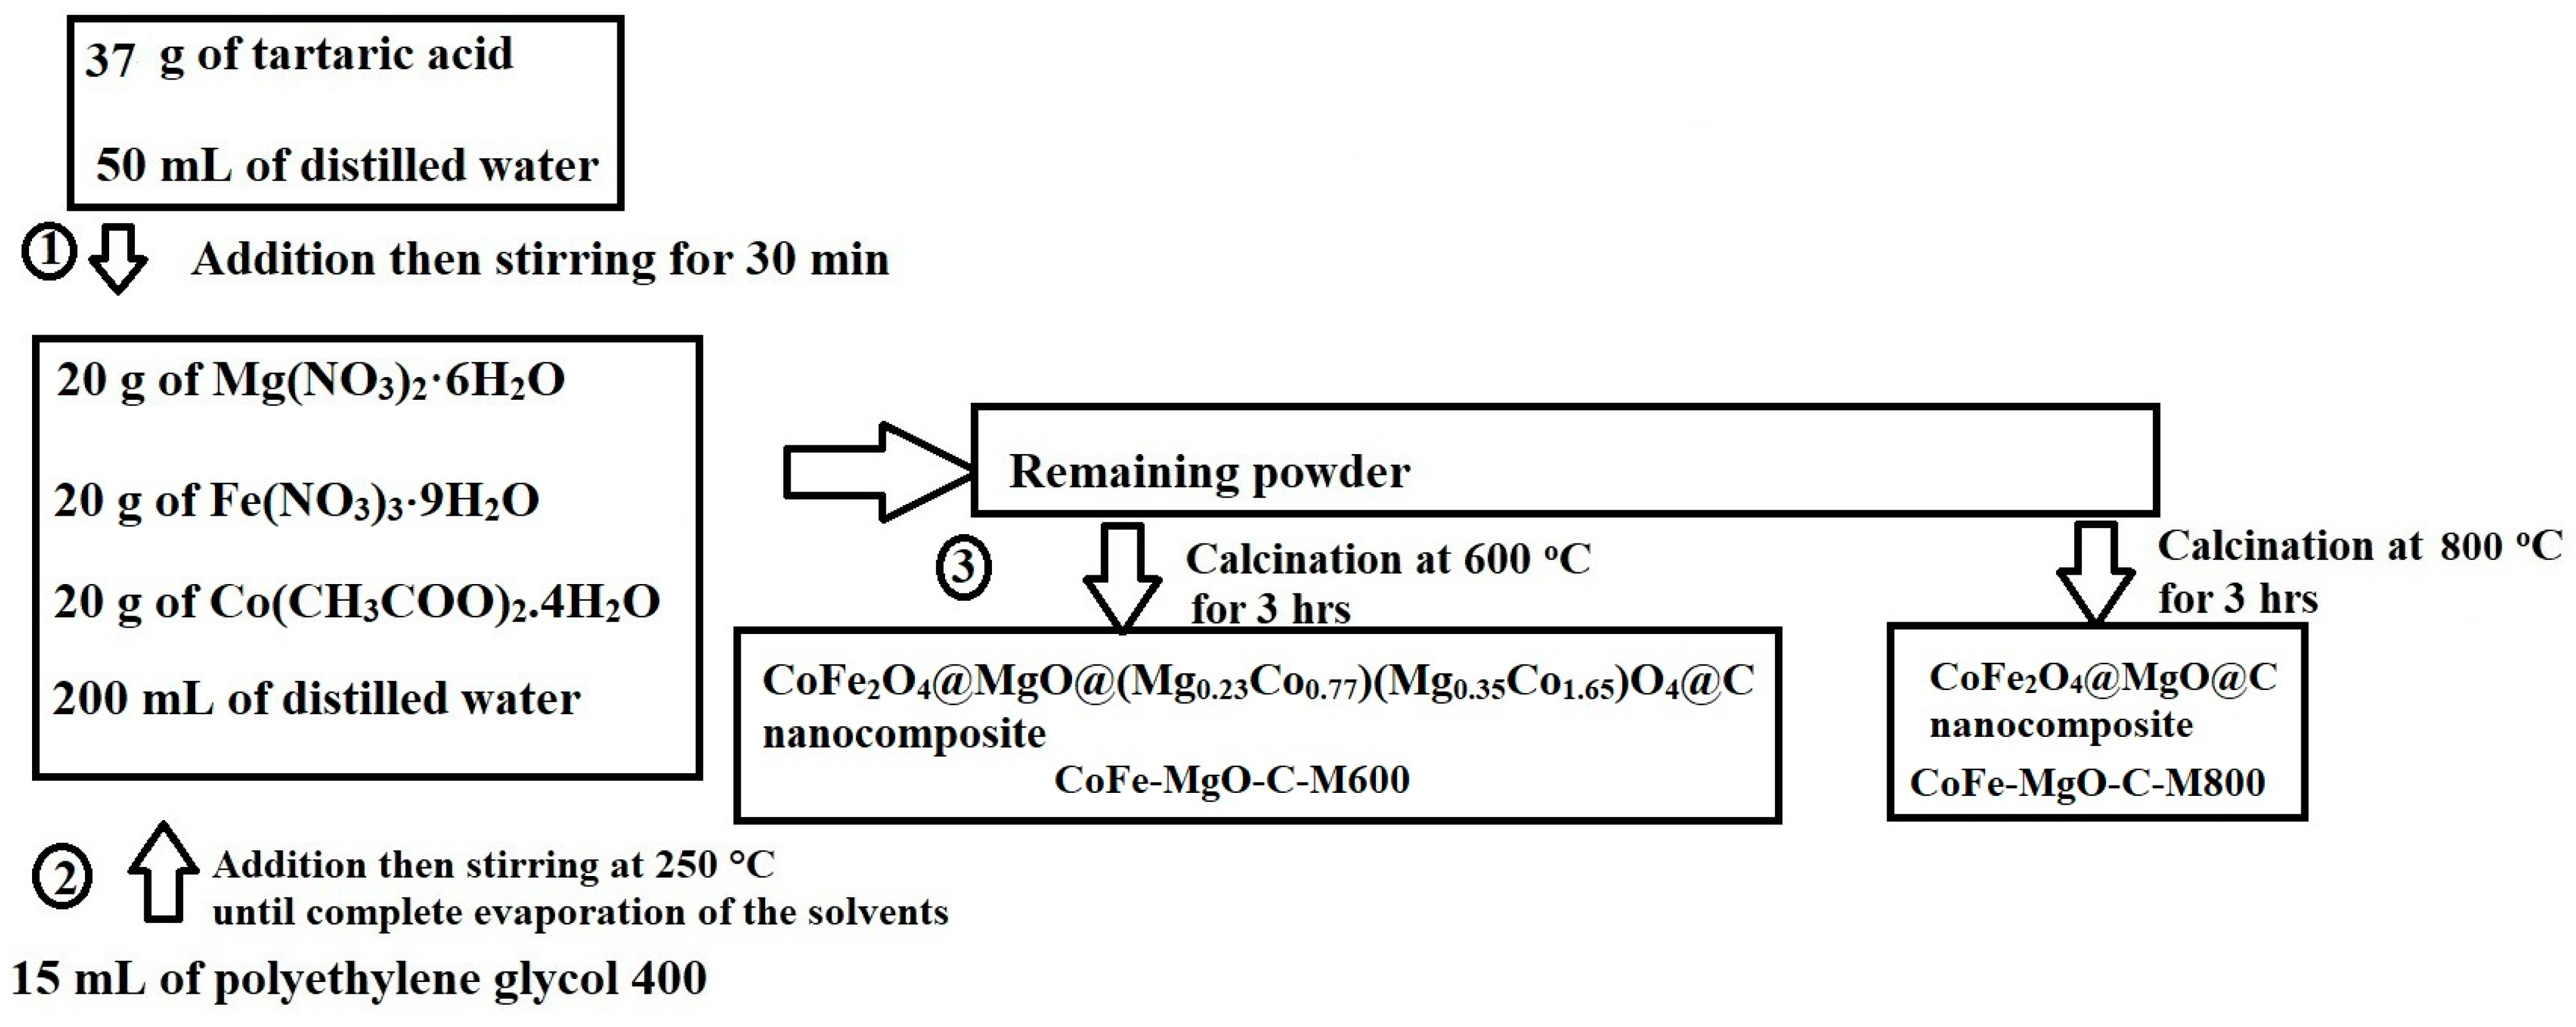
3.2. Synthesis of Nanocomposites

The CoFe2O4@MgO@(Mg0.23Co0.77)(Mg0.35Co1.65)O4@C and CoFe2O4@MgO@C nanocomposites were prepared through the Pechini sol-gel approach, as depicted in Figure 14. The process began by dissolving 37 g of tartaric acid in 100 mL of distilled water. Separately, 20 g of Mg(NO3)2·6H2O, 20 g of Fe(NO3)3·9H2O, and 20 g of Co(CH3COO)2·4H2O were dissolved in 200 mL of distilled water. The tartaric acid solution was then gradually introduced into the metal nitrate solution while maintaining continuous stirring for 30 min. Following this, 15 mL of polyethylene glycol 400 was added to the mixture, resulting in a total solution volume of 315 mL, which was heated with stirring at 250 °C until complete solvent evaporation was achieved within approximately 4 hrs. The resulting solid was collected and subjected to calcination in an air atmosphere at 600 and 800 °C for 3 hrs, with a controlled heating rate of 5 °C/min, yielding the CoFe2O4@MgO@(Mg0.23Co0.77)(Mg0.35Co1.65)O4@C and CoFe2O4@MgO@C nanocomposites, respectively. The nanocomposites synthesized at 600 and 800 °C were designated as CoFe-MgO-C-M600 and CoFe-MgO-C-M800, respectively.
The nomenclature of the synthesized nanocomposites follows a systematic approach to represent their structural components and formation sequence. The formula CoFe2O4@MgO@(Mg0.23Co0.77)(Mg0.35Co1.65)O4@C reflects the hierarchical integration of distinct phases. The ‘@’ symbol denotes the sequential deposition of materials, indicating a composite integration rather than a strict core–shell structure. The final ‘@C’ notation highlights the presence of an amorphous carbon phase, which arises from residual organic precursors used in the Pechini sol-gel method. Also, the ‘@C’ notation is retained to indicate the presence of residual carbon; however, it should be noted that this carbon phase is predominantly amorphous and dispersed within the composite rather than forming a well-defined structural layer.

3.3. Instrumentation

The synthesized nanocomposites were thoroughly characterized using advanced analytical techniques to ensure a comprehensive evaluation of their properties. The crystal structure of each nanocomposite was investigated through X-ray diffraction (XRD) analysis using a D8 Discover diffractometer (Bruker, Billerica, MA, USA) with Cu-Kα radiation (λ = 1.5406 Å). The surface morphology and elemental composition were examined via a field emission scanning electron microscopy (FE-SEM) coupled with energy dispersive X-ray spectroscopy (EDX) on a Quanta 250 FEG system (Thermo Fisher Scientific, Waltham, MA, USA). High-resolution transmission electron microscopy (HR-TEM), performed with a JEM-2100Plus microscope (JEOL Ltd., Tokyo, Japan), provided detailed insights into the nanostructure and particle morphology. Additionally, the concentration of Zn(II) ions in the solution was measured using an atomic absorption spectrophotometer (ZEEnit 700 p, Analytik Jena AG, Jena, Germany), enabling the assessment of the adsorption capabilities of the synthesized nanocomposites.

3.4. Removal Procedure of Zn(II) Ions from Aqueous Media

The removal of Zn(II) ions from aqueous solutions was conducted through batch adsorption experiments, as summarized in Table 6, using a magnetic stirrer to achieve consistent mixing. To examine the impact of pH, 100 mL of Zn(II) solution with an initial concentration (CI) of 150 mg/L and an adsorbent mass (M) of 50 mg was prepared. The solution was maintained at a temperature of 298 K and stirred for 360 min, with the pH adjusted between 2 and 7. For the investigation of contact time, 100 mL of Zn(II) solution with CI of 150 mg/L and M of 50 mg was stirred at 298 K and pH 7 for time intervals ranging from 10 to 100 min. To evaluate the influence of temperature, 100 mL of Zn(II) solution with CI of 150 mg/L and M of 50 mg was stirred at pH 7 for 70 min using the CoFe-MgO-C-M800 sample and for 50 min using the CoFe-MgO-C-M600 sample, while the temperature was varied between 298 and 328 K. The effect of the initial Zn(II) concentration was studied by preparing 100 mL solutions with concentrations ranging from 50 to 300 mg/L, which were stirred at 298 K and pH 7 for 70 min using 50 mg of the CoFe-MgO-C-M800 sample and for 50 min using 50 mg of the CoFe-MgO-C-M600 sample.
Following the adsorption process, the adsorbent was separated by centrifugation, and the Zn(II) concentration in the filtrate was determined using an atomic absorption spectrophotometer.

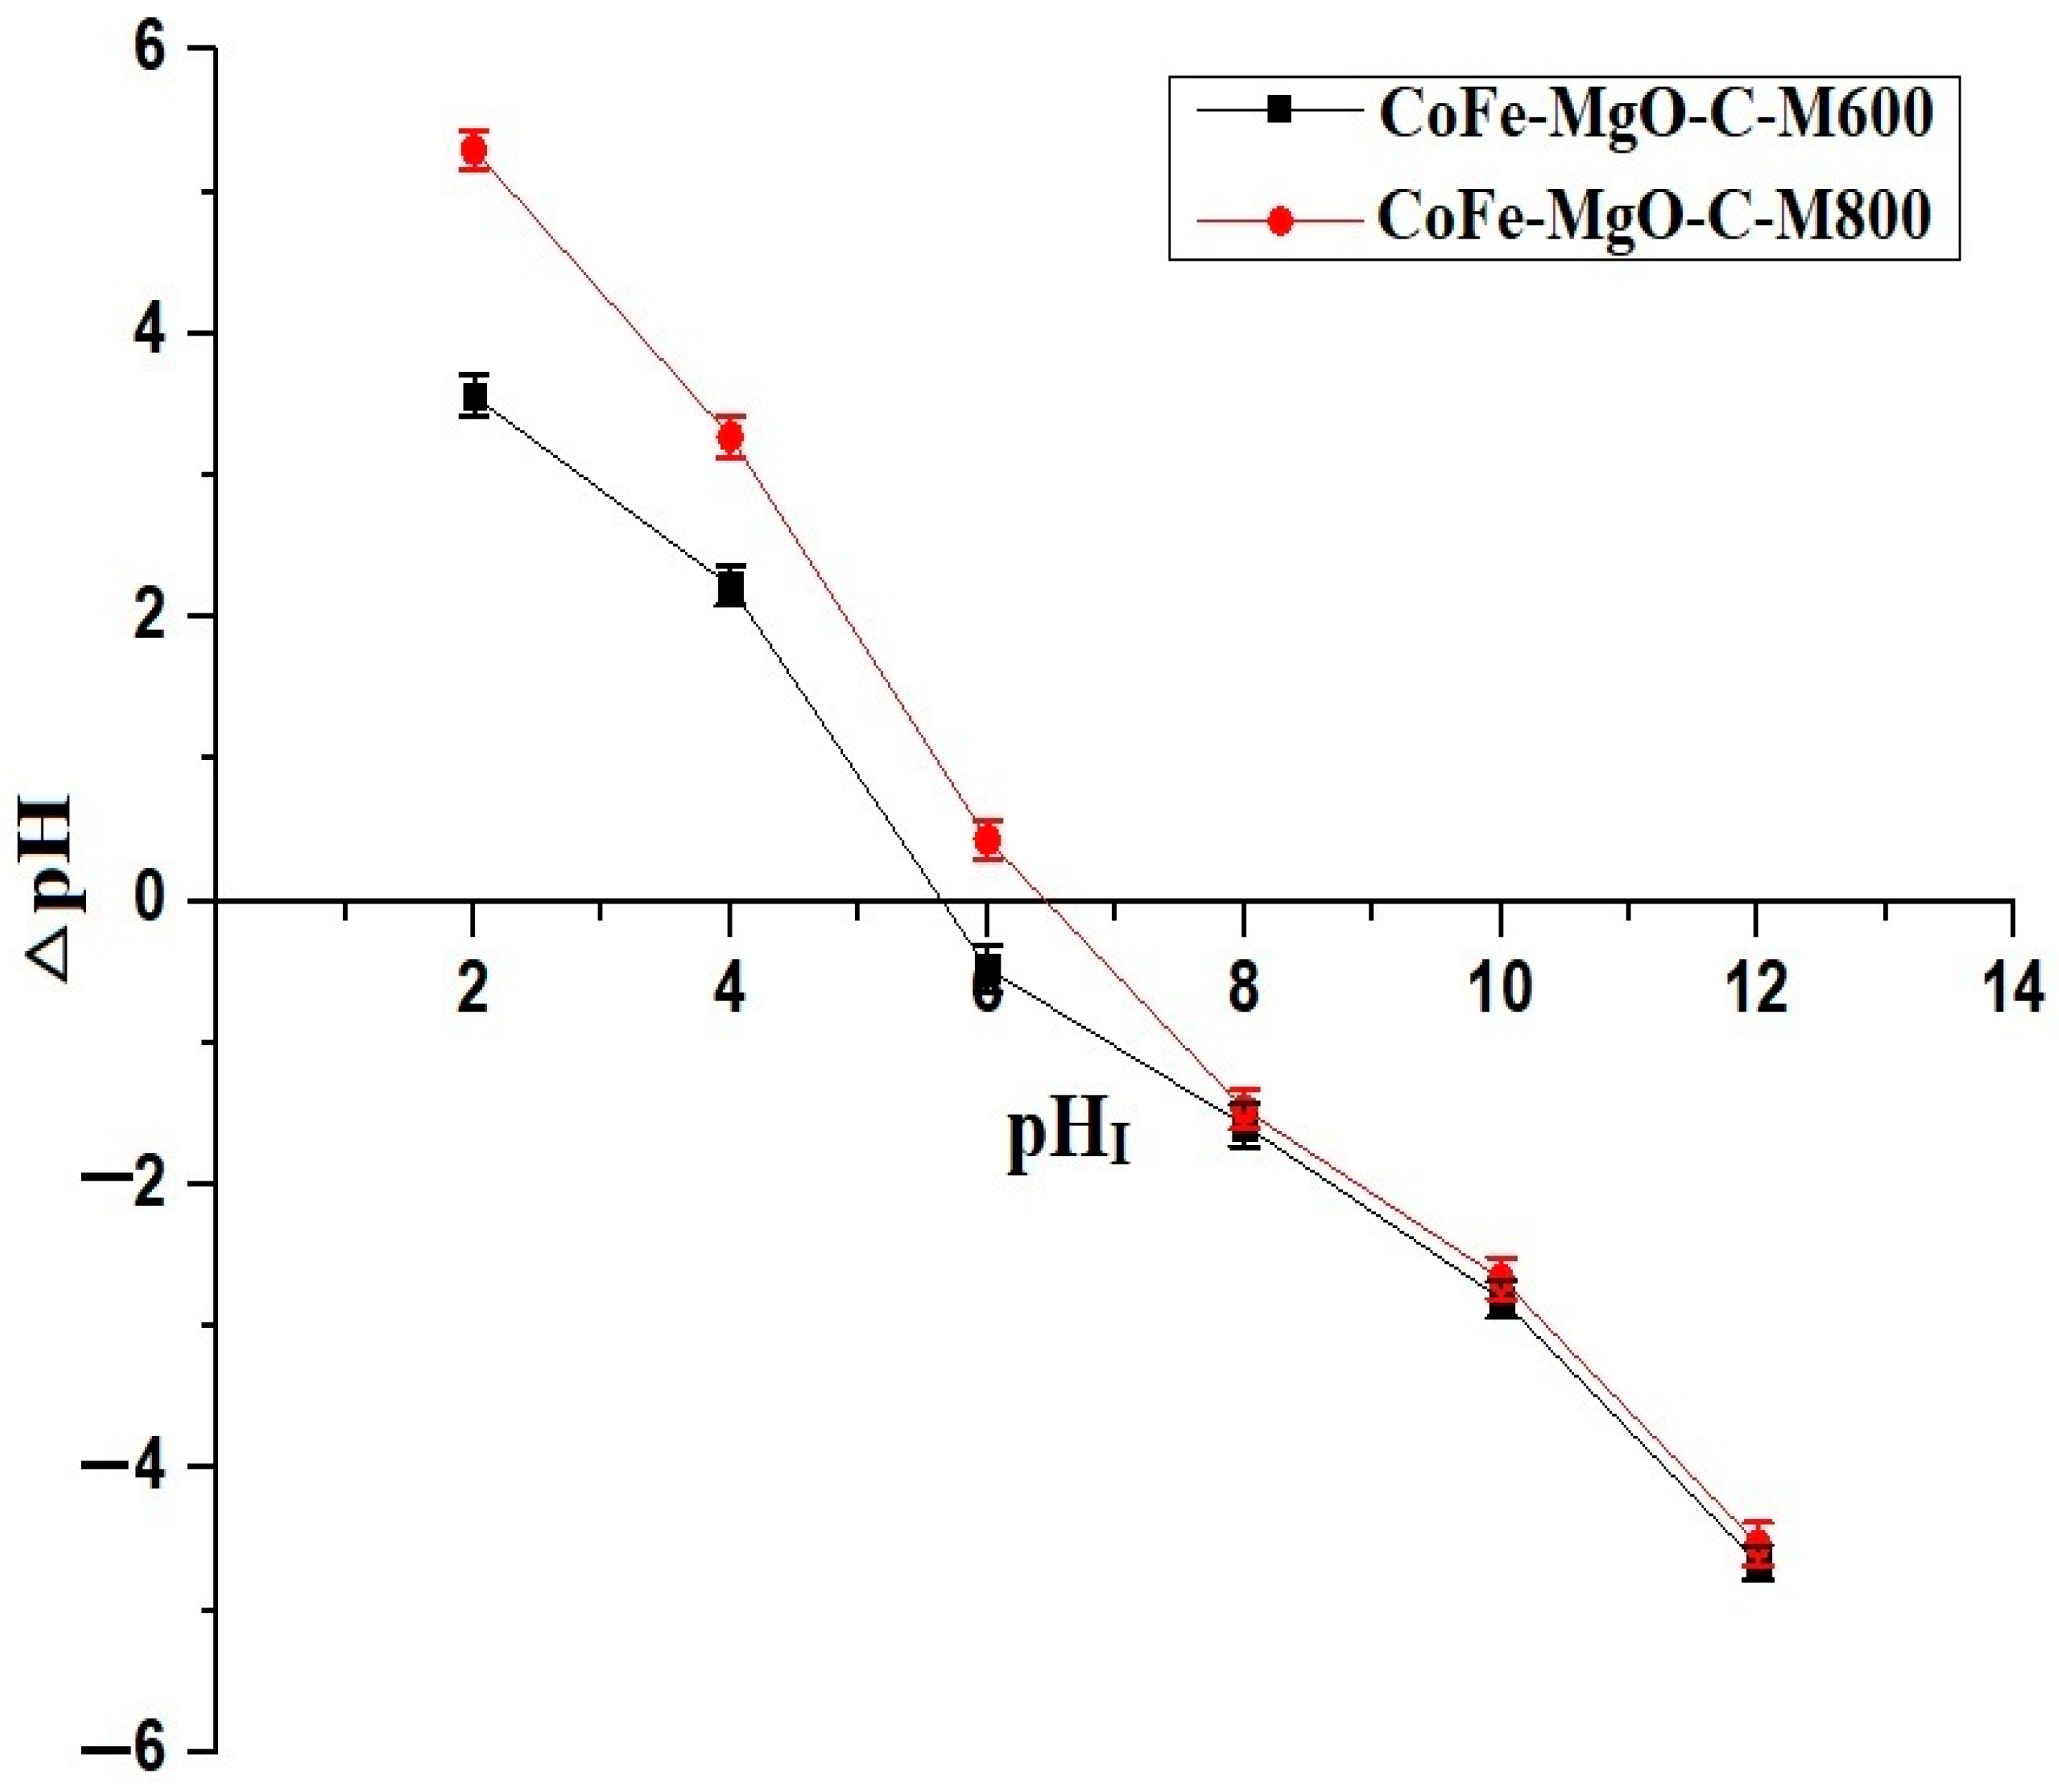
3.5. Point of Zero Charge (pHPZC) of Nanocomposites

The point of zero charge (pHPZC) for the CoFe-MgO-C-M600 and CoFe-MgO-C-M800 nanocomposites was measured using the batch adsorption technique with potassium chloride (KCl) serving as the supporting electrolyte. In this method, 0.1 g of the adsorbent was introduced into 50 mL of a 0.01 M KCl solution within a series of flasks. The initial pH (pHI) of the solutions was adjusted across a range from 2 to 12 by adding either 0.1 M hydrochloric acid (HCl) or 0.1 M sodium hydroxide (NaOH). The flasks were securely sealed and stirred for 24 hrs at room temperature to achieve equilibrium. Afterward, the final pH (pHF) of each solution was recorded, and the change in pH (△pH) was calculated using Equation (12) [37].
pH = pH F     pH I
To determine the pHPZC, a plot of △pH against pHI was constructed, and the point where △pH equals zero was identified, representing the pH at which the surface of the adsorbent carries no net charge.

4. Conclusions

This study successfully synthesized and characterized CoFe-MgO-C-M600 and CoFe-MgO-C-M800 nanocomposites using the Pechini sol-gel method for the efficient removal of Zn(II) ions from aqueous media. Structural and morphological analyses confirmed that CoFe-MgO-C-M600 exhibited a smaller crystallite size, higher porosity, and a more uniform grain distribution compared to CoFe-MgO-C-M800, contributing to its enhanced adsorption performance. The elemental composition analysis validated the successful incorporation of key components, ensuring the stability and efficacy of the synthesized materials. Adsorption studies demonstrated that CoFe-MgO-C-M600 and CoFe-MgO-C-M800 achieved maximum adsorption capacities of 276.24 and 200.00 mg/g, respectively. The adsorption process was found to be exothermic, spontaneous, and primarily physical in nature, following the pseudo-second-order kinetic model and the Langmuir isotherm. The superior performance of CoFe-MgO-C-M600 was attributed to its greater surface area, higher active site availability, and enhanced interactions with Zn(II) ions. The findings of this study highlight the potential of CoFe-MgO-C-M600 and CoFe-MgO-C-M800 nanocomposites as highly efficient adsorbents for Zn(II) ion removal from aqueous media. Given their high adsorption capacities and stability, these nanocomposites could be applied in real-world water treatment processes, particularly in industrial wastewater treatment where heavy metal contamination is a major concern. Their effectiveness suggests suitability for large-scale applications, including wastewater treatment plants, mining effluent management, and metal recovery processes. Future research should focus on expanding the applicability of these nanocomposites by testing their adsorption performance for other heavy metals, such as Pb(II), Cd(II), and Cr(VI), to evaluate their broader environmental remediation potential. Additionally, optimizing the synthesis process to fine-tune the carbon content and porosity could further enhance adsorption efficiency. Investigating the regeneration and reusability of these nanocomposites under different conditions would provide valuable insights into their long-term operational feasibility. Furthermore, incorporating these materials into filtration membranes or hybrid adsorption systems could offer innovative solutions for high-efficiency heavy metal removal.

Author Contributions

E.A.A.: Methodology, Funding acquisition, Writing—Review and Editing, Conceptualization; R.K.S.: Writing—Review and Editing; M.M.A.-K.: Writing—Review and Editing; F.A.S.: Writing—Review and Editing, Visualization; A.M.K.: Methodology, Visualization, Writing—Review and Editing. All authors have read and agreed to the published version of the manuscript.

Funding

This work was supported and funded by the Deanship of Scientific Research at Imam Mohammad Ibn Saud Islamic University (IMSIU) (grant number IMSIU-DDRSP2502).

Institutional Review Board Statement

Not applicable.

Informed Consent Statement

Not applicable.

Data Availability Statement

All data generated or analyzed during this study are included in this published article.

Acknowledgments

This work was supported and funded by the Deanship of Scientific Research at Imam Mohammad Ibn Saud Islamic University (IMSIU) (grant number IMSIU-DDRSP2502).

Conflicts of Interest

The authors declare no conflicts of interest.

References

  1. Feng, J.; Yu, Y.; Huang, S.; Zhu, N.; Mojiri, A.; Ge, D. Tannic Acid as a Green Chemical for the Removal of Various Heavy Metals: A Critical Review of Recent Developments. J. Environ. Manag. 2025, 375, 124390. [Google Scholar] [CrossRef] [PubMed]
  2. Aziz, K.H.H.; Mustafa, F.S.; Hamarawf, R.F.; Omer, K.M. Adsorptive Removal of Toxic Heavy Metals from Aquatic Environment by Metal Organic Framework (MOF): A Review. J. Water Process Eng. 2025, 70, 106867. [Google Scholar] [CrossRef]
  3. Baldev; Kumar, G.; Sharma, V.; Nemiwal, M. Biomass-Derived Zirconium Composite: An Adsorbent for Preferential Removal of Heavy Metals and Contaminants in Wastewater. J. Water Process Eng. 2025, 69, 106778. [Google Scholar] [CrossRef]
  4. Yu, K.; Yang, L.; Zhang, S.; Zhang, N. Nanocellulose-Based Aerogels for the Adsorption and Removal of Heavy-Metal Ions from Wastewater: A Review. Mater. Today Commun. 2025, 43, 111744. [Google Scholar] [CrossRef]
  5. Ávila, F.G.; Cabrera-Sumba, J.; Valdez-Pilataxi, S.; Villalta-Chungata, J.; Valdiviezo-Gonzales, L.; Alegria-Arnedo, C. Removal of Heavy Metals in Industrial Wastewater Using Adsorption Technology: Efficiency and Influencing Factors. Clean. Eng. Technol. 2025, 24, 100879. [Google Scholar] [CrossRef]
  6. Rana, P.; Kaur, B.; Poonia, K.; Soni, V.; Singh, P.; Thakur, S.; Huang, C.W.; Nguyen, V.H.; Raizada, P. Recent Advancements in Polythiophene-Based Adsorbents for Heavy Metal Ion Removal: Modification, Kinetics and Mechanistic Insights. Inorg. Chem. Commun. 2025, 172, 113657. [Google Scholar] [CrossRef]
  7. Yang, T.; Gao, H.; Chen, H.; Xiao, X.; Zhao, C.; Gong, H.; Li, X.; Liu, L.; Liu, Y. Insights and Perspectives of Chitosan-Based Hydrogels for the Removal of Heavy Metals and Dyes from Wastewater. Int. J. Biol. Macromol. 2025, 292, 139280. [Google Scholar] [CrossRef]
  8. Oladimeji, T.E.; Oyedemi, M.; Emetere, M.E.; Agboola, O.; Adeoye, J.B.; Odunlami, O.A. Review on the Impact of Heavy Metals from Industrial Wastewater Effluent and Removal Technologies. Heliyon 2024, 10, e40370. [Google Scholar] [CrossRef]
  9. Faruque, M.O.; Uddin, S.; Hossain, M.M.; Hossain, S.M.Z.; Shafiquzzaman, M.; Razzak, S.A. A Comprehensive Review on Microalgae-Driven Heavy Metals Removal from Industrial Wastewater Using Living and Nonliving Microalgae. J. Hazard. Mater. Adv. 2024, 16, 100492. [Google Scholar] [CrossRef]
  10. Jaffar, F.H.; Othman, M.H.D.; Ismail, N.J.; Puteh, M.H.; Kurniawan, T.A.; Abu Bakar, S.; Abdullah, H. Hydroxyapatite-Based Materials for Adsorption, and Adsorptive Membrane Process for Heavy Metal Removal from Wastewater: Recent Progress, Bottleneck and Opportunities. J. Taiwan Inst. Chem. Eng. 2024, 164, 105668. [Google Scholar] [CrossRef]
  11. Miyah, Y.; El Messaoudi, N.; Benjelloun, M.; Georgin, J.; Franco, D.S.P.; El-habacha, M.; Ali, O.A.; Acikbas, Y. A Comprehensive Review of β-Cyclodextrin Polymer Nanocomposites Exploration for Heavy Metal Removal from Wastewater. Carbohydr. Polym. 2025, 350, 122981. [Google Scholar] [CrossRef] [PubMed]
  12. Zheng, X.; Alam, O.; Zhou, Y.; Du, D.; Li, G.; Zhu, W. Heavy Metals Detection and Removal from Contaminated Water: A Critical Review of Adsorption Methods. J. Environ. Chem. Eng. 2024, 12, 114366. [Google Scholar] [CrossRef]
  13. Alnasra, O.A.; Khalili, F.I.; Alhnafat, F.A. Enhanced Removal of Pb(II), Zn(II) and Cd(II) Ions by Insolubilized Humic Acid: Characterization and Sorption Behaviors. Desalin. Water Treat. 2024, 320, 100604. [Google Scholar] [CrossRef]
  14. Nizam, T.; Krishnan, K.A.; Joseph, A.; Krishnan, R.R. Isotherm, Kinetic and Thermodynamic Modelling of Liquid Phase Adsorption of the Heavy Metal Ions Zn(II), Pb(II) and Cr(VI) onto MgFe2O4 Nanoparticles. Groundw. Sustain. Dev. 2024, 25, 101120. [Google Scholar] [CrossRef]
  15. Chen, Q.; Yao, Y.; Li, X.; Lu, J.; Zhou, J.; Huang, Z. Comparison of Heavy Metal Removals from Aqueous Solutions by Chemical Precipitation and Characteristics of Precipitates. J. Water Process Eng. 2018, 26, 289–300. [Google Scholar] [CrossRef]
  16. Li, Y.; Xu, Z.; Liu, S.; Zhang, J.; Yang, X. Molecular Simulation of Reverse Osmosis for Heavy Metal Ions Using Functionalized Nanoporous Graphenes. Comput. Mater. Sci. 2017, 139, 65–74. [Google Scholar] [CrossRef]
  17. Hou, R.; Bao, S.; Dai, J.; Yan, W.; Yao, Y.; Zhou, Y.; Gao, C. Development of Novel Nanofiltration Membrane via Cross-Linking a Natural Polymer and Its Application in Heavy Metals Removal from Groundwater. J. Memb. Sci. 2025, 719, 123768. [Google Scholar] [CrossRef]
  18. Vairamuthu, M.; Nidheesh, P.V.; Anantha Singh, T.S. Treatment of Unregulated Open Dumping Site Soil by Combined Aloe Vera Gel Washing and Electrocoagulation for the Removal of Microplastics and Heavy Metals. J. Environ. Chem. Eng. 2025, 13, 115555. [Google Scholar] [CrossRef]
  19. Nemati, M.; Hosseini, S.M.; Shabanian, M. Novel Electrodialysis Cation Exchange Membrane Prepared by 2-Acrylamido-2-Methylpropane Sulfonic Acid; Heavy Metal Ions Removal. J. Hazard. Mater. 2017, 337, 90–104. [Google Scholar] [CrossRef]
  20. Zhang, L.; Su, J.; Liu, S.; Huang, T.; Wang, Z.; Liu, Y.; Hou, C.; Wang, X. Calcium Self-Release Bioremediation System Combined with Microbially Induced Calcium Precipitation for the Removal of Ammonium Nitrogen, Phosphorus and Heavy Metals. J. Environ. Chem. Eng. 2024, 12, 114190. [Google Scholar] [CrossRef]
  21. Yuan, F.; Yan, D.; Song, S.; Zhang, J.; Yang, Y.; Chen, Z.; Lu, J.; Wang, S.; Sun, Y. Removal of Heavy Metals from Water by Adsorption on Metal Organic Frameworks: Research Progress and Mechanistic Analysis in the Last Decade. Chem. Eng. J. 2025, 506, 160063. [Google Scholar] [CrossRef]
  22. Lingamdinne, L.P.; Chang, Y.Y.; Yang, J.K.; Singh, J.; Choi, E.H.; Shiratani, M.; Koduru, J.R.; Attri, P. Biogenic Reductive Preparation of Magnetic Inverse Spinel Iron Oxide Nanoparticles for the Adsorption Removal of Heavy Metals. Chem. Eng. J. 2017, 307, 74–84. [Google Scholar] [CrossRef]
  23. Precious, N.; Patience, T.; Kweinor, E.; Rathilal, S. Review on Advancing Heavy Metals Removal: The Use of Iron Oxide Nanoparticles and Microalgae-Based Adsorbents. Clean. Chem. Eng. 2025, 11, 100137. [Google Scholar] [CrossRef]
  24. Li, M.; Kuang, S.; Kang, Y.; Ma, H.; Dong, J.; Guo, Z. Recent Advances in Application of Iron-Manganese Oxide Nanomaterials for Removal of Heavy Metals in the Aquatic Environment. Sci. Total Environ. 2022, 819, 153157. [Google Scholar] [CrossRef]
  25. Xu, C.; Shi, S.; Wang, X.; Zhou, H.; Wang, L.; Zhu, L.; Zhang, G.; Xu, D. Electrospun SiO2-MgO Hybrid Fibers for Heavy Metal Removal: Characterization and Adsorption Study of Pb(II) and Cu(II). J. Hazard. Mater. 2020, 381, 120974. [Google Scholar] [CrossRef]
  26. Abdelrahman, E.A.; Shah, R.K.; Abou-krisha, M.M.; Saad, F.A.; Munshi, A.M. Facile Synthesis and Characterization of Novel Fe0.65Mg0.35Cr2O4@C Nanocomposite for Efficient Removal of Cd(II) Ions from Aqueous Media. Inorganics 2025, 13, 82. [Google Scholar] [CrossRef]
  27. Afriyie, E.; Arthur, E.K.; Gikunoo, E.; Boateng, A. Bentonite-Assisted Carbonisation of Waste Polyethylene Terephthalate Bottles for the Removal of Heavy Metals from Polluted Water. Results Surf. Interfaces 2025, 18, 100406. [Google Scholar] [CrossRef]
  28. Zhao, X.; Fang, Y.; Xue, L.; Lu, Y.; Hu, R.; Yu, J.; Jiang, X.; Sun, J. International Journal of Biological Macromolecules Phosphorylated Chitosan-Lignin Composites for Efficient Removal of Pb ( II ) and Cu ( II ) from Aqueous Environments and Sustainable Upcycling of Spent Adsorbents. Int. J. Biol. Macromol. 2025, 304, 140840. [Google Scholar] [CrossRef]
  29. Ehab, N.S.A.; Fowzia, A.A.; Fawaz, S.A.; Doaa, A.S. Facile Synthesis of MnCO3/ZrO2/MgCO3 Nanocomposite for High-Efficiency Malachite Green Dye Removal. J. Inorg. Organomet. Polym. Mater. 2025, in press. [Google Scholar] [CrossRef]
  30. Saberi-Zare, M.; Bodaghifard, M.A. A Schiff Base-Functionalized Chitosan Magnetic Bio-Nanocomposite for Efficient Removal of Pb (II) and Cd (II) Ions from Aqueous Solutions. Int. J. Biol. Macromol. 2025, 296, 139794. [Google Scholar] [CrossRef]
  31. Bagdat, S.; Tokay, F.; Demirci, S.; Yilmaz, S.; Sahiner, N. Removal of Cd(II), Co(II), Cr(III), Ni(II), Pb(II) and Zn(II) Ions from Wastewater Using Polyethyleneimine (PEI) Cryogels. J. Environ. Manag. 2023, 329, 117002. [Google Scholar] [CrossRef] [PubMed]
  32. Mohamad Yusop, M.F.; Mohd Johan Jaya, E.; Ahmad, M.A. Single-Stage Microwave Assisted Coconut Shell Based Activated Carbon for Removal of Zn(II) Ions from Aqueous Solution—Optimization and Batch Studies. Arab. J. Chem. 2022, 15, 104011. [Google Scholar] [CrossRef]
  33. Al-Wasidi, A.S.; Naglah, A.M.; Saad, F.A.; Abdelrahman, E.A. Modification of Silica Nanoparticles with 1-Hydroxy-2-Acetonaphthone as a Novel Composite for the Efficient Removal of Ni(II), Cu(II), Zn(II), and Hg(II) Ions from Aqueous Media. Arab. J. Chem. 2022, 15, 104010. [Google Scholar] [CrossRef]
  34. Joseph, I.V.; Tosheva, L.; Doyle, A.M. Simultaneous Removal of Cd(II), Co(II), Cu(II), Pb(II), and Zn(II) Ions from Aqueous Solutions via Adsorption on FAU-Type Zeolites Prepared from Coal Fly Ash. J. Environ. Chem. Eng. 2020, 8, 103895. [Google Scholar] [CrossRef]
  35. Fadhel, S.R. Chitosan-NiFe2O4 Nanocomposite Synthesis for Effective Removal of Pb(II) and Zn(II) from Aqueous Solution. Results Eng. 2024, 24, 103293. [Google Scholar] [CrossRef]
  36. Panahandeh, A.; Parvareh, A.; Moraveji, M.K. Synthesis and Characterization of γ-MnO2/Chitosan/Fe3O4 Cross-Linked with EDTA and the Study of Its Efficiency for the Elimination of Zinc(II) and Lead(II) from Wastewater. Environ. Sci. Pollut. Res. 2021, 28, 9235–9254. [Google Scholar] [CrossRef]
  37. Al-kadhi, N.S.; Abdelrahman, E.A.; Alamro, F.S.; Shah, R.K. Synthesis of Novel Magnesium Ferrite Schiff Base Chitosan Nanocomposite for Efficient Removal of Pb (II) Ions from Aqueous Media. Sci. Rep. 2025, 15, 4153. [Google Scholar] [CrossRef]
Figure 1. XRD of CoFe-MgO-C-M600 (A) and CoFe-MgO-C-M800 (B) nanocomposites.
Inorganics 13 00101 g001
Figure 2. EDX patterns of CoFe-MgO-C-M600 (A) and CoFe-MgO-C-M800 (B) nanocomposites.
Inorganics 13 00101 g002
Figure 3. FE-SEM images of CoFe-MgO-C-M600 (A) and CoFe-MgO-C-M800 (B) nanocomposites.
Inorganics 13 00101 g003
Figure 4. HR-TEM images of CoFe-MgO-C-M600 (A) and CoFe-MgO-C-M800 (B) nanocomposites.
Inorganics 13 00101 g004
Figure 5. Effect of pH on the removal efficiency (% R) of Zn(II) ions using CoFe-MgO-C-M600 and CoFe-MgO-C-M800 nanocomposites. Operating Conditions: Initial Zn(II) concentration = 150 mg/L, adsorbent dosage = 50 mg, temperature = 298 K, contact time = 360 min.
Inorganics 13 00101 g005
Figure 6. Determination of the point of zero charge (pHPZC) based on △pH variation as a function of initial pH (pHI) for CoFe-MgO-C-M600 and CoFe-MgO-C-M800 nanocomposites.
Inorganics 13 00101 g006
Figure 7. Mechanism of Zn(II) ions adsorption onto CoFe-MgO-C-M600 and CoFe-MgO-C-M800 nanocomposites.
Inorganics 13 00101 g007
Figure 8. Comparative removal efficiency (% R) of Zn(II) ions using CoFe-MgO-C-M600 and CoFe-MgO-C-M800 nanocomposites over time. Operating Conditions: Initial Zn(II) concentration = 150 mg/L, adsorbent dosage = 50 mg, temperature = 298 K, pH = 7.
Inorganics 13 00101 g008
Figure 9. Kinetic modeling of Zn(II) ions adsorption onto CoFe-MgO-C-M600 and CoFe-MgO-C-M800 nanocomposites. (A) Pseudo-first-order kinetic model and (B) pseudo-second-order kinetic model fitting curves.
Inorganics 13 00101 g009
Figure 10. Effect of temperature on the removal efficiency (% R) of Zn(II) ions using CoFe-MgO-C-M600 and CoFe-MgO-C-M800 nanocomposites. Operating Conditions: Initial Zn(II) concentration = 150 mg/L, adsorbent dosage = 50 mg, pH = 7, contact time = 50 min for CoFe-MgO-C-M600 and 70 min for CoFe-MgO-C-M800.
Inorganics 13 00101 g010
Figure 11. Van’t Hoff plots for the adsorption of Zn(II) ions onto CoFe-MgO-C-M600 and CoFe-MgO-C-M800 nanocomposites.
Inorganics 13 00101 g011
Figure 12. Effect of initial concentration on the removal efficiency of Zn(II) ions using CoFe-MgO-C-M600 and CoFe-MgO-C-M800 nanocomposites. Operating Conditions: Adsorbent dosage = 50 mg, pH = 7, temperature = 298 K, contact time = 50 min for CoFe-MgO-C-M600 and 70 min for CoFe-MgO-C-M800.
Inorganics 13 00101 g012
Figure 13. Linear fitting of adsorption isotherms for Zn(II) ions onto CoFe-MgO-C-M600 and CoFe-MgO-C-M800 nanocomposites: (A) Langmuir isotherm and (B) Freundlich isotherm.
Inorganics 13 00101 g013
Figure 14. Synthesis process of CoFe2O4@MgO@(Mg0.23Co0.77)(Mg0.35Co1.65)O4@C and CoFe2O4@MgO@C nanocomposites.
Inorganics 13 00101 g014
Table 1. Weight and atomic percentages of elements in CoFe-MgO-C-M600 and CoFe-MgO-C-M800 nanocomposites.
SampleAtomic PercentagesWeight Percentages
%C%O%Mg%Fe%Co%C%O%Mg%Fe%Co
CoFe-MgO-C-M6004.344.518.311.621.31.622.914.320.840.4
CoFe-MgO-C-M8001.642.619.913.922.00.621.014.923.839.7
Table 2. Experimental and kinetic model parameters for Zn(II) ions adsorption onto CoFe-MgO-C-M600 and CoFe-MgO-C-M800 nanocomposites, including pseudo-first-order and pseudo-second-order model fitting.
SampleQExp
(mg/g)
Pseudo-First-OrderPseudo-Second-Order
K1
(1/min)
R2Qe
(mg/g)
K2
(g/mg.min)
R2Qe
(mg/g)
CoFe-MgO-C-M600266.440.04440.998685.630.0012320.9994269.54
CoFe-MgO-C-M800191.320.028350.9720106.530.0005420.9994196.46
Table 3. Thermodynamic parameters for the adsorption of Zn(II) ions onto CoFe-MgO-C-M600 and CoFe-MgO-C-M800 nanocomposites.
Sample△S° (KJ/molK)△H° (KJ/mol)△G° (KJ/mol)
298308318328
CoFe-MgO-C-M6000.05804−24.34−41.63−42.22−42.79−43.38
CoFe-MgO-C-M8000.03758−14.45−25.65−26.02−26.40−26.78
Table 4. Langmuir and Freundlich isotherm parameters for the adsorption of Zn(II) ions onto CoFe-MgO-C-M600 and CoFe-MgO-C-M800 nanocomposites.
SampleLangmuirFreundlich
Qmax
(mg/g)
R2K3
(L/mg)
K4
(mg/g)(L/mg)1/n
Qmax
(mg/g)
1/nR2
CoFe-MgO-C-M600276.240.99930.3181101.59328.020.22120.6674
CoFe-MgO-C-M800200.000.99950.254882.32215.940.18200.6374
Table 5. Maximum adsorption capacities (Qmax) of various adsorbents for removal of Zn(II) ions.
AdsorbentQmax (mg/g)Ref.
Polyethyleneimine24.39[31]
Activated carbon7.87[32]
Silica/1-hydroxy-2-acetonaphthone composite45.13[33]
FAU Zeolite36.77[34]
NiFe2O4/Chitosan composite90.70[35]
γ-MnO2/chitosan/Fe3O4/EDTA composite103.40[36]
CoFe-MgO-C-M600276.24This study
CoFe-MgO-C-M800200.00This study
Table 6. Experimental parameters for studying the effects of pH, time, temperature, and initial Zn(II) concentration on adsorption.
EffectV (L)CI (mg/L)M (mg)T (K)t (min)pH
pH 100150502983602–7
Time 1001505029810–1007
Temperature10015050298–32850 (CoFe-MgO-C-M600)
70 (CoFe-MgO-C-M800)
7
Concentration 10050–3005029850 (CoFe-MgO-C-M600)
70 (CoFe-MgO-C-M800)
7
Disclaimer/Publisher’s Note: The statements, opinions and data contained in all publications are solely those of the individual author(s) and contributor(s) and not of MDPI and/or the editor(s). MDPI and/or the editor(s) disclaim responsibility for any injury to people or property resulting from any ideas, methods, instructions or products referred to in the content.

