Abstract
The present study investigates the luminescent behaviour of sol–gel derived Y2SiO5 powders doped with Eu3+ ions, subjected to spark plasma sintering. The sintering process induces the partial reduction of Eu3+ to Eu2+, and the phenomenon is strongly dependent on the holding time within the SPS chamber. The luminescent properties are tunable via the initial Eu concentration, holding time and excitation wavelength, resulting in a wide range of emission colours from red (Eu3+) at 220 nm excitation to blue (Eu2+) at 365 nm, and mixed colours at 257 nm. Moreover, the Eu3+/Eu2+ redox process is reversible. Overall, the results demonstrate that SPS conditions can be exploited to modulate the valence state of luminescent centres, which is reversible by oxidation under ambient conditions, enabling controlled modulation of the optical properties.
1. Introduction
The search for advanced luminescent materials has intensified owing to their critical role in high-technology applications, including solid-state lighting, lasers, medical imaging and sensors [1,2]. The precise tuning of emission properties by chemical composition or excitation wavelength control is essential for optimising phosphors in lighting devices, displays, optical sensing, and biomedical markers [3,4]. One strategy involves co-doping, where distinct emission bands from separate luminescent centres enable colour-tunable output [5,6]. Europium (Eu) stands out in this context, offering two functional luminescent oxidation states: Eu2+, showing a broad blue-green emission from 4f65d1 ⟶ 4f7 transitions; and Eu3+, showing a sharp reddish emission via 5D0 ⟶ 7Fⱼ transitions [7]. Consequently, numerous studies have focused on engineering Eu2+/Eu3+ co-doped systems for the development of multi-colour phosphors [8,9,10,11,12,13].
However, Eu2+ lacks stable natural compounds and must be synthesised through the reduction of Eu3+ precursors, and producing a sufficient amount of Eu2+ remains challenging [14]. Conventional annealing in a reducing atmosphere composed of H2/N2 often degrades the host matrix or requires multi-step processing [15,16,17], while electrochemical reduction faces scalability limitations [18]. Recently developed methods include photochemical reactions [19,20] and reduction in aqueous systems via radicals [21]. An alternative approach exploits oxygen vacancy formation during materials processing, which facilitates in situ reduction even under oxidising conditions [22,23,24].
In general, phosphor synthesis results in the production of ceramic powders which are subsequently sintered to enhance the luminescent properties by eliminating structural defects and porosity; these defects act as non-radiative centres [25] that diminish the optical properties. Additionally, the thermal effects generated during consolidation improve crystallinity and promote dissolution of the luminescent centres, thereby increasing emission intensity [26,27]. Sintering also reduces light dispersion and scattering, which must be mitigated for applications such as displays, lasers, and LEDs [28,29]. Finally, sintering enhances the material’s thermal and chemical stability, preventing degradation of the optical properties under subsequent exposure to high temperatures or UV radiation.
Among the various sintering techniques, spark plasma sintering (SPS) offers unique advantages, namely rapid densification at lower temperatures, coupled with intrinsic reducing conditions afforded by carbon dies and localised Joule heating [30,31,32]. Crucially rapid heating promotes oxygen vacancy formation, enabling Eu3+ ⟶ Eu2+ reduction, as observed in some aluminosilicates [14,33,34].
Finally, regarding the ceramic frameworks that are responsible for transferring energy to the luminescent centres, the general research focus has moved from simple binary oxides to more complex ceramic systems, such as silicates, which present strong chemical stability, low thermal expansion, high conductivity, and an optimal optical damage threshold [35]. Of these silicates, yttrium oxyorthosilicate (Y2SiO5) has garnered significant attention for developing novel rare-earth activators. The Y2SiO5 compound exhibits two primary monoclinic polymorphs, X1 and X2, which significantly differ in their atomic arrangement. The low-temperature X1 phase, with the P21/c space group, features isolated SiO4 tetrahedra and two distinct yttrium sites: one where the yttrium ion is 7-coordinated in a distorted mono-capped trigonal prism geometry and another where it is 6-coordinated in a distorted octahedron, creating a layered structure interconnected by these polyhedra. In contrast, the high-temperature X2 phase, belonging to the C2/c space group, also contains isolated SiO4 tetrahedra but possesses a higher symmetry where both crystallographically unique yttrium sites are 6-coordinated, forming distorted octahedra that create sheets linked together by the silicate groups, resulting in a centrosymmetric framework distinct from the non-centrosymmetric X1 structure [36,37,38]. For luminescence properties, the rare-earth ions substitute for Y3+ ions at both crystallographic sites.
Herein, we demonstrate facile, reversible Eu3+⇔Eu2+ redox control in doped Y2SiO5 via SPS, which consolidates the phosphor while tuning the valence of Eu. Y2SiO5: Eu3+ (X1 phase) was synthesised by sol–gel processing and then sintered under varied holding times (HTs; 6, 15, and 30 min). SPS simultaneously induced a phase transition (X1 ⟶ X2) and progressively reduced Eu3+ to Eu2+, with longer HTs enhancing the reduction efficiency. Furthermore, we demonstrated that the process can be fully reversed by air annealing. This work establishes SPS as a single-step route for consolidating phosphors while controllably modulating activator valence, eliminating external reductants.
2. Results and Discussion
2.1. Structural Evolution
Figure 1a shows the X-ray diffraction spectra of the sol–gel powder samples annealed at 1000 °C, for undoped samples and those doped with 1.0 and 2.5 at.% of Eu3+. All sol–gel powders predominantly exhibit the Y2SiO5-X1 structure, which is a monoclinic structure with the P21/c space group, comprising chains of SiO4 tetrahedra connected with Y3+ ions in 7 and 9 coordination (JCPDS 036-1476). This is the low-temperature phase, which has been commonly reported for sol–gel powders with luminescent properties, mainly because it can be obtained below 1100 °C [39,40,41,42,43]. Figure 1b,c show the structural evolution of the sintered coupons as a function of HT for the samples with 1.0 and 2.5 at.%, processed at 1200 °C. The spectra for the sol–gel synthesised powders are also included for ease of comparison. Above 1200 °C, a phase transformation typically occurs from X1 to X2 [44,45] the latter being a monoclinic structure belonging to the C2/c space group with 6 and 7 coordination (JCPDS 052-1810). This transformation is observed in the samples sintered via SPS, as shown in Figure 1. In all SPS-sintered cases, the dominant phase is X2, with minor reflections corresponding to the X1 phase, as well as the hexagonal Y4.67(SiO4)3O phase (JCPDS 030-1457). These phases are expected according to the equilibrium diagram and result from the incomplete X1 to X2 transition [46]. Additionally, for both Eu concentrations, an increase in HT enhances the crystallinity of the system. This is attributed to the greater thermal input, promoting a more complete phase transformation, given that it is a first-order reconstructive (non-diffusive) phase transition. There is an abrupt change in the crystal structure (symmetry P21/c ⟶ C2/c) and in the coordination of Y3+, indicating a non-gradual atomic rearrangement that is therefore favoured by thermal input (supplied by an increase in HT). In the proposed system, the Eu content does not appear to cause a significant change in the transformation because no major differences in the diffraction patterns are observed between the two samples (Figure 1b,c).
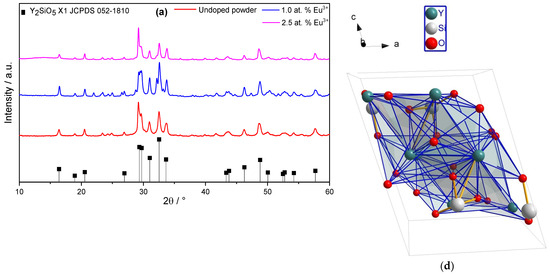
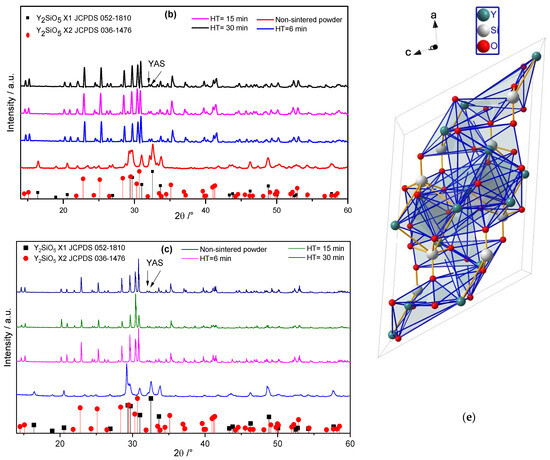
Figure 1.
Structural evolution of Y2SiO5: Eu3+. (a) Sol–gel derived powders, T = 1000 °C, (b) SPS coupons with 1.0 at.% Eu, as a function of HT, T = 1200 °C. (c) SPS coupons with 2.5 at.% Eu, as a function of HT, T = 1200 °C. (d) Y2SiO5-X1 structure. (e) Y2SiO5-X2 structure.
2.2. SPS
To verify the consolidation of the Eu-doped Y2SiO5 powders during the SPS process, the shrinkage of the samples was analysed during the process. Figure 2a shows a plot of the sintering rate (shrinkage for undoped and doped yttrium silicate powders as a function of the temperature), depicting the behaviour during SPS. The sintering rate is not affected by the Eu content; nevertheless, the sintering temperature can be varied in the range of 1100 to 1400 K for each powder. Moreover, after 1000 s of sintering at 1673 K, both undoped and doped Eu sintered compacts showed constant sintering rates, regardless of the Eu content, as observed in Figure 2b. The resulting sintered microstructure is expected to be similar in all coupons, and the Eu content did not alter the first sintering stage. Therefore, the sintering rate was merely due to volume diffusion, as is observed in Figure 2a, where the shrinkage rate as a function of the temperature is similar for all sintered coupons. However, a longer HT allowed for the complete reaction of Eu; in other words, a second sintering stage allowed for Eu reduction by enhancing vacancy diffusion during the SPS process, as suggested in Figure 2b, where the shrinkage rate did not change as a function of time.
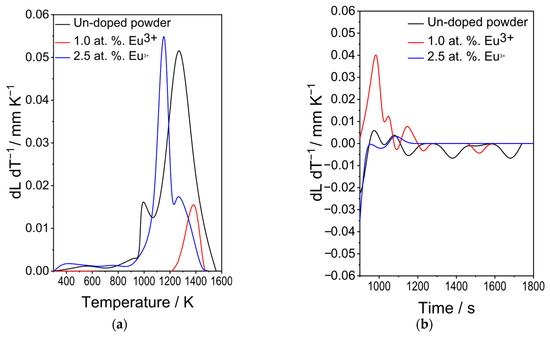
Figure 2.
Plot of the sintering rate (shrinkage) for the undoped and doped yttrium silicate powder: (a) as a function of temperature, (b) as a function of time.
2.3. Luminescent Properties
2.3.1. Sol–Gel Derived Y2SiO5: Eu3+ Powders
Figure 3a shows the excitation spectrum (λem = 616 nm) of Y2SiO5 powders doped with 2.5 at.% Eu3+, displaying the two characteristic zones: the charge transfer (CT) band between 200 and 320 nm, and the f-f transition region between 350 and 450 nm. The first, centred at 257 nm, corresponds to the charge transfer O2− ⟶ Eu3+, whereas the second corresponds to the intramolecular 7F ⟶ 5D transitions of the Eu3+ 4f electrons, specifically 7F0 ⟶ 5D4 at 365 nm, 7F0 ⟶ 5G2 at 381 nm, and 7F0 ⟶ 5L6 at 393 nm [47].
Figure 3.
Luminescent properties of sol–gel derived Y2SiO5: Eu3+ powders. (a) Excitation spectrum (λem = 616 nm). (b) Emission spectra (λexc = 257 and 393 nm).
Figure 3b shows the emission spectra obtained using with λexc = 257 and 393 nm. For both excitation wavelengths, the same emissions are observed, and all bands associated with the intramolecular 4f ⟶ 4f transitions of Eu3+ are located in the red region of the electromagnetic spectrum, corresponding to the 5D0 ⟶ 7Fj (j = 0, 1, 2, 3, 4) transitions: 5D0 ⟶ 7F0 (578 nm), 5D0 ⟶ 7F1 (594 nm), 5D0 ⟶ 7F2 (616 nm), 5D0 ⟶ 7F3 (651 nm), and 5D0 ⟶ 7F4 (706 nm) [48]. Meanwhile, the small emission at 533 nm corresponds to the 5D1 ⟶ 7F0 transition. These results are consistent with the luminescent properties of Eu3+ [49,50].
2.3.2. SPS-Sintered Y2SiO5: Eu3+—Excitation Spectra
Considering that there may be a reduction of Eu3+ to Eu2+ during SPS, the excitation spectra were recorded for both Eu3+ emission (λem= 616 nm) and Eu2+ emission (λem= 433 nm). The results are shown in Figure 4a,b for 1.0 and 2.5 at.% Eu, for samples subjected to an SPS HT of 6 min of heat treatment in the SPS. The results are similar for both concentrations. In the case of Eu3+, the same bands observed in the powders (Figure 3a) are present; that is, the charge transfer (CT) band from the Y2SiO5 host lattice to Eu3+ appears between 220 and 320 nm, while the intense bands located around 390–391 nm are attributed to f-f transitions. Conversely, in the spectrum monitoring the blue emission at 433 nm, a broad excitation band from 240 to 400 nm is observed, which is attributed to the 4f7(8S7/2) ⟶ 4f65d1 transition of the Eu2+ ion [51], confirming the reduction process from Eu3+ to Eu2+. The only observable difference regarding the change in concentration is that, for Eu3+ ions, there is a lower intensity ratio of the f-f bands relative to the CT band at the higher Eu concentration (2.5 at.%). This suggests that increasing the Eu concentration enhances the probability of Eu3+-O2− charge transfer and increases the likelihood of reduction to Eu2+, which implies a lower number of intra-ionic f-f transitions due to the decreased content of Eu3+.
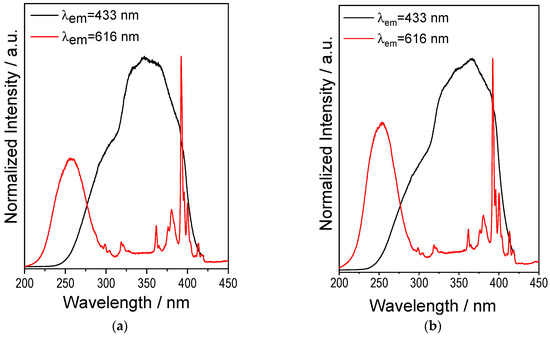
Figure 4.
Excitation spectra of SPS-sintered Y2SiO5: Eu3+ systems with λem = 433 and 616 nm, HT = 6 min. (a) 1 at.% Eu3+. (b) 2.5 at.% Eu3+.
2.3.3. Eu3+ ⟶ Eu2+ Reduction Process
The reduction of Eu is primarily attributed to the formation of carbon monoxide (CO), which is generated during the SPS when the graphite die reacts with residual oxygen at high temperatures, resulting in a low oxygen partial pressure [52,53]:
C+O2 ⟶ CO
This CO acts as a reducing agent, first donating electrons to the system:
CO ⟶ CO2++2e−
These electrons then react with Eu3+ as follows:
2Eu3++2e− ⟶ 2Eu2+
Additionally, the rapid heating due to the Joule effect and the electric fields formed during SPS promote the formation of oxygen vacancies
[54,55], which can form through the reaction of CO with lattice oxygen (
) in the crystal structure:
The overall reduction reaction can be expressed as:
In summary, because of the low oxygen partial pressure, CO is first formed, which donates a pair of electrons that reduce Eu3+ to Eu2+, followed by the formation of oxygen vacancies to maintain charge balance. Structurally, in Kröger–Vink notation, this can be expressed as:
where
= Eu3+ at the Y3+ site,
= Eu2+ at the Y3+ site,
= O2− at a regular lattice site, and,
= an oxygen vacancy.
2.3.4. SPS-Sintered Y2SiO5: Eu3+—Emission Spectra
To analyse the luminescent properties as a function of Eu content and HT in the SPS process, samples were excited at three different wavelengths: 220, 257 and 365 nm. The selection of these wavelengths was based on the following criteria. The first excitation (220 nm) lies in a region where although a low luminescent response is obtained, only Eu3+ emission is expected because there is no Eu2+ response in this region, as shown in Figure 4.
The second excitation (257 nm) corresponds to the region where emissions from both cationic states overlap, and thus, both emissions should be observed. The third excitation (365 nm) preferentially corresponds to the emissive processes of Eu2+. The results are shown in Figure 5.
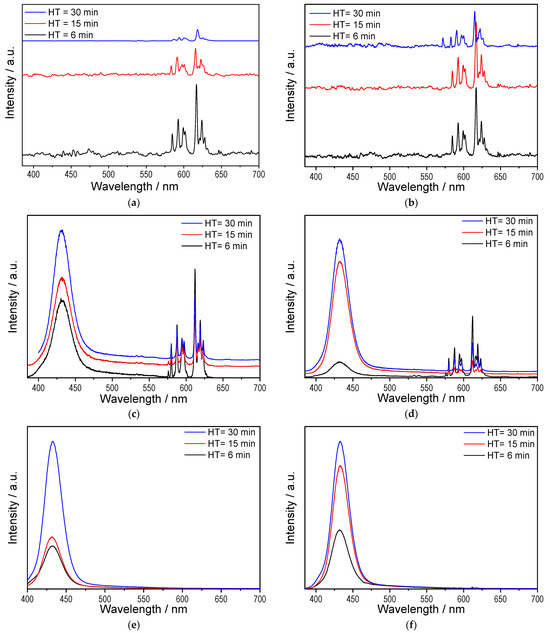
Figure 5.
Emission spectra of SPS-sintered Y2SiO5: Eu3+ samples: (a) 1.0 at.% Eu, λexc = 220 nm; (b) 2.5 at.% Eu, λexc = 220 nm; (c) 1.0 at.% Eu, λexc = 257 nm; (d) 2.5 at.% Eu, λexc = 257 nm; (e) 1.0 at.% Eu, λexc = 365 nm; (f) 2.5 at.% Eu, λexc = 365 nm.
For λexc = 220 nm (Figure 5a,b for 1.0 and 2.5 at.% Eu3+), only the emission bands associated with the intramolecular 4f ⟶ 4f transitions of Eu3+ located in the red region of the electromagnetic spectrum are observed, corresponding to the intramolecular 5D0 ⟶ 7F_j (j = 0, 1, 2, 3, 4) transitions: 5D0 ⟶ 7F0 (578 nm), 5D0 ⟶ 7F1 (594 nm), 5D0 ⟶ 7F2 (616 nm), 5D0 ⟶ 7F3 (651 nm), and 5D0 ⟶ 7F4 (706 nm).
Additionally, it is possible to determine whether the HT modifies the local crystal field environment around the Eu3+ ions in the host lattice by analysing the intensity ratio R of the 5D0 ⟶ 7F2 to 5D0 ⟶ 7F1 transitions, given that the 5D0 ⟶ 7F2 and 5D0 ⟶ 7F1 emissions correspond to electric dipole and magnetic dipole transitions, respectively. The former is a hypersensitive transition and thus highly sensitive to site symmetry, whereas the latter is unaffected by the symmetry of the crystal environment [56].
The results demonstrate that increasing the HT in the SPS chamber (from 6 to 15 to 30 min) leads to a decrease in the R value, from 1.98 to 1.08 to 1.06 for 1.0 at.% Eu, and from 2.06 to 1.32 to 1.15 for 2.5 at.% Eu, recall that X2-Y2SiO5 presents two sites with different coordination numbers (CN), namely 6 and 7, with the latter being more asymmetric. At 6 min, the R value indicates that Eu3+ ions preferentially occupy the more asymmetric sites (CN = 7). By 30 min, the remaining Eu3+ ions are preferentially located at the more symmetric sites (CN = 6).
This implies that the CN = 7 sites are reduced first, likely because the bonds are slightly longer (average values of 2.367 and 2.329 Å for CN = 7 and 6, respectively; see Table 1), making them weaker and easier to break. Additionally, the CN = 7 sites exhibit lower packing density (owing to their distorted pentagonal bipyramidal geometry) compared with the CN = 6 sites (which have an almost regular octahedral geometry), allowing CO molecules to approach the Eu ions more easily, facilitating their reduction.
Regarding the samples excited at λexc = 257 nm thus exciting both Eu3+ and Eu2+, the emission from both cations is indeed observed: those previously described for Eu3+ (between 550 and 650 nm) and a band centred at 423 nm corresponding to the 4f65d1 ⟶ 4f7 electronic transitions resulting from parity-allowed transitions of Eu2+ [57,58]. The results demonstrate that Eu reduction has indeed been achieved.
Moreover, as the HT increases, the emission band of Eu2+ also increases, while the emission bands of Eu3+ decrease, demonstrating that a longer HT leads to greater Eu reduction for both 1.0 and 2.5 at.% Eu.
Finally, when λexc = 365 nm (Figure 5e,f for 1.0 and 2.5 at.% Eu), only the emission from Eu2+ is observed, which increases as HT increases. This emission band can be attributed to the 5D3 ⟶ 7F1 transition of Eu3+ [59], and thus, the emission centred at 423 nm in Figure 5 corresponds to the reduced Eu2+. Comparing Figure 5c,d, as well as Figure 5e,f, the reduction kinetics differ for the samples with different Eu contents. The Eu reduction rate is greater in the sample with 2.5 at.% because the Eu content is higher, kinetically increasing the probability that the reduction reaction will occur.
To analyse the nature of the emission originating from Eu2+, only the blue region of the spectrum was examined for the sample with 2.5 at.% Eu as a function of HT (Figure 6a). The emission intensity increases with the HT, demonstrating greater reduction of the cation.
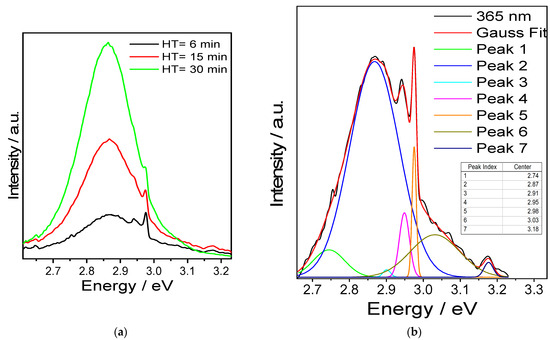
Figure 6.
(a) Emission spectrum for SPS-sintered Y2SiO5 samples doped with 2.5 at.% Eu, blue region, λexc = 365 nm. (b) Gaussian deconvolution, HT = 6 min.
Nevertheless, when HT = 6 min, the observed emission consists of multiple bands. To analyse them, a Gaussian deconvolution of the corresponding spectrum was carried out (Figure 6b). For the deconvolution of PL spectra into individual components and to avoid misinterpretation [60], the spectra were plotted as a function of energy using Planck’s conversion, transposing the y-axis by a factor of λ2/hc (the Jacobian transformation) [61].
In this manner, the band can be decomposed into seven components, ranging from 2.75 to 3.17 eV. For 4f65d1 ⟶ 4f7 electronic transitions, the band position is characteristic of specific materials, because the position of the 5d levels strongly depends on the crystal environment surrounding Eu2+. Variations in the energy levels between the excited and ground states can differ by tens of thousands of cm−1 for the Eu2+ ion [62], meaning that the emission band position strongly depends on the surroundings of the luminescent centre within the crystal structure.
For example, in YSiO2N doped with Eu2+, the emission ranges from 550 to 1100 nm [63], whereas in (La-Al)2O3: Eu2+, the band is centred at 440 nm [64], and in Sr2Si5N8: Eu2+, at 620 nm [65]. Thus, emission may be observed across a wide range, from 330 to 1100 nm.
To predict the emission position of Eu2+ based on the crystal structure, Van Uitert et al. [66] analysed various crystal structures and determined the following empirical relationship (Equation (7)):
In the present study, it is assumed that r corresponds to the average bond length between yttrium ions and oxygen atoms because the Eu2+ cation is considered to substitute yttrium at these sites. For this purpose, the bond distances calculated by Mirzai et al. [67] for the X2-Y2SiO5 structure are used.
For the two sites, Y1 and Y2, (with CN = 7 and 6, respectively), there are two different types of bonds: in Y1, there are 5 bonds directly to SiO44− oxy-anions and 2 to O2−, while in Y2, there are 4 of the first type and 2 of the second type. Therefore, for the electron affinity, two possible paths for energy transfer exists: one from the Y–SiO4 bond, with ea = 4.08 eV [68], and another for the Y–O bond with ea = 1.89 eV [69,70].
The results are shown in Table 1. As observed, the predicted band positions exhibit a high correlation with experimental values. The first observation is that the blue emission apparently corresponds to energy transfer through the SiO44− oxy-anions for both crystalline sites, demonstrating the importance of the local environment surrounding Eu2+, since emissions from the Eu–O bond are not observed.

Table 1.
Eu2+ emission bands predicted using the Van Uitert Equation.
Table 1.
Eu2+ emission bands predicted using the Van Uitert Equation.
| Site | Coordination Number | Bond | Bond Length/Å [67] | λ/nm | Energy/eV |
|---|---|---|---|---|---|
| Y1 | 7 | Y-O | 0.2239 | 598.66 | 2.07 |
| Y-O | 0.2367 | 587.32 | 2.11 | ||
| Y-SiO4 | 0.2379 | 400.34 | 3.10 | ||
| Y-SiO4 | 0.2589 | 388.71 | 3.19 | ||
| Y-SiO4 | 0.3290 | 359.69 | 3.45 | ||
| Y-SiO4 | 0.2329 | 403.37 | 3.07 | ||
| Y-SiO4 | 0.2337 | 402.88 | 3.08 | ||
| Y2 | 6 | Y-O | 0.2209 | 632.83 | 1.96 |
| Y-O | 0.2325 | 622.42 | 1.99 | ||
| Y-SiO4 | 0.2392 | 422.47 | 2.94 | ||
| Y-SiO4 | 0.2296 | 428.93 | 2.89 | ||
| Y-SiO4 | 0.2358 | 424.71 | 2.92 | ||
| Y-SiO4 | 0.2394 | 422.34 | 2.94 |
Regarding the position of the luminescent centres, the results indicate that the higher-energy emissions correspond to the CN = 7 site, and the lower-energy emissions correspond to the CN = 6 site. Notably at an initial HT = 6 min, the most intense emission originates from the CN = 7 sites, demonstrating that these are the first to be reduced, confirming the results observed with λexc = 220 nm. Furthermore, as the HT increases, the emission from the CN = 6 sites increases, so that ultimately these sites become predominant.
2.3.5. SPS-Sintered Y2SiO5: Eu3+—Lifetime Studies
Regarding the lifetime (τ) analysis, all samples were monitored in two experiments: with λexc = 257 nm and λem = 616 nm for Eu3+ emission; and with λexc = 365 nm and λem = 433 nm for Eu2+ emission. For Eu3+, the results were adjusted using the first-order kinetics or monomolecular reaction mechanism (Equation (8)):
where I(t) is the intensity at a given time t, A is the intensity at t = 0, and τ is the lifetime. The fit is shown in Figure 7a,b for 1.0 and 2.5 at.%, and the lifetime values are presented in Table 2. For Eu2+, the best fitting of the experimental data was obtained using the double exponential equation (Equation (9)) [67]:
where I(t) is the luminescence intensity at time t, A1 and A2 are constants, and τ1 and τ2 are rapid and slow times for the exponential components, respectively. From Equation (4), the average lifetime τav can be calculated (Equation (10)):
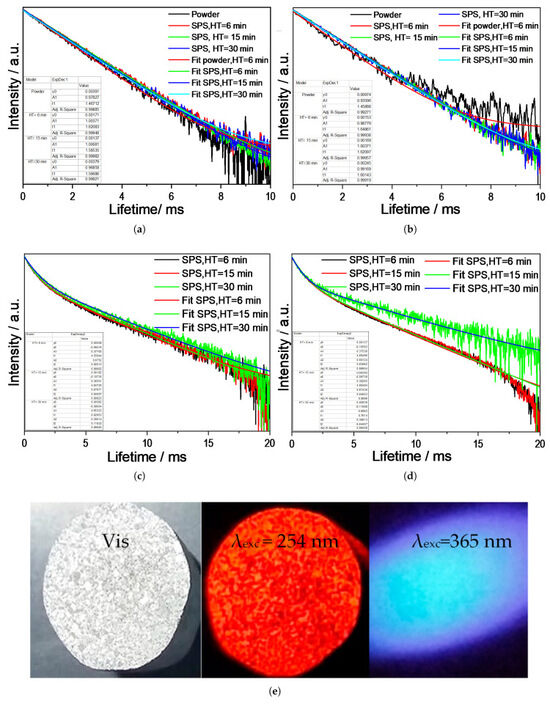
Figure 7.
Average lifetime for sintered Y2SiO5 as a function of holding time (HT). (a) 1.0 at.% Eu, λexc = 257 nm, λem = 616 nm. (b) 2.5 at.% Eu, λexc = 257 nm, λem = 616 nm. (c) 1.0 at.% Eu, λexc = 365 nm, λem = 433 nm. (d) 2.5 at.% Eu, λexc = 254 nm and λem = 365 nm, HT = 6 min. (e) 2.5 at.% Eu, under natural light, λexc = 254 nm and λexc = 365 nm.
Table 2.
Lifetime for Eu3+.
The fitting is shown in Figure 7c,d for 1.0 and 2.5 at.% Eu, and the obtained values are presented in Table 3. The decay of the Eu3+ emission follows a first-order model because its 5D level is relatively isolated, considering that the f-f transitions limit non-radiative de-excitation pathways. Additionally, there is a large energy gap with the ground state, which minimises multiphonon quenching mechanisms; hence, the de-excitation mechanisms are essentially radiative.
Table 3.
Lifetime for Eu2+.
The situation for Eu2+ is more complex because its 4f65d ⟶ 4f7 transition is allowed and very fast, but the 5d state is coupled to the crystal lattice. This creates two effects: (1) the parabolic potential well allows vibrational relaxation towards the minimum, and (2) the thermal barrier produces repopulation of the excited state. This thermal equilibrium between excited states requires the modelling of two coupled decay pathways. Moreover, the 5d state is more spatially extended than the 4f orbitals of Eu3+, making ion–ion interactions more likely, which explains the observed biexponential decay behaviour.
From the calculated data the decay time of Eu3+ decreases as the HT increases, which is consistent with the fact that a higher HT leads to a lower concentration of Eu3+ cations in the system, and that Eu2+ cations may act as quenching centres. Additionally, increasing sintering promotes the formation of oxygen vacancies, which serve as charge trapping centres. Furthermore, the increase in decay time from the unsintered powder to the sintered samples is primarily due to the structural change from X1 to X2, as well as the reduction in surface defects and increased crystallinity, which diminishes non-radiative pathways. A slight increase in τ is also expected from 1.0 to 2.5 at.% Eu owing to the higher cation content.
Regarding Eu2+, the average lifetime (τavg) increases with HT, suggesting an increase in luminescent efficiency, probably because Eu2+ ions migrate to more favourable crystallographic sites in the Y2SiO5 lattice (i.e., sites with lower local symmetry that reduce vibrational coupling) and thereby decrease the probability of non-radiative de-excitation.
Notably, the fast component τ1 significantly decreases for both Eu concentrations, whereas the slow component τ2 increases, suggesting a change in mechanism, the fast component (τ1) may involve stronger quenching by defects, whereas the slow component (τ2) may reflect the formation of protective environments. This also suggests that Eu2+ migrates to environments with lower local symmetry, which correspond to the Y2 sites in this case. This is consistent with the luminescence results, which demonstrated that after 30 min, the predominant emission originates from these sites.
2.3.6. SPS-Sintered Y2SiO5: Eu3+—CIE Coordinates
Table 4 and Figure 8 show the CIE coordinates for the sintered systems; different colours are obtained depending on the excitation wavelength and the HT. Excitation at λexc = 220 nm produces colours in the red region (originating from Eu3+), excitation at λexc = 365 nm produces colours in the blue region (originating from Eu2+), and excitation at λexc = 257 nm results in a mixture of both colours. Therefore, it is possible to obtain colours along the lines between points D and G for 1.0 at.%, and between points O and R for 2.5 at.%, depending on the HT used during SPS.
Table 4.
CIE chromaticity coordinates for the Y2SiO5: Eu system before and after SPS as a function of HT.
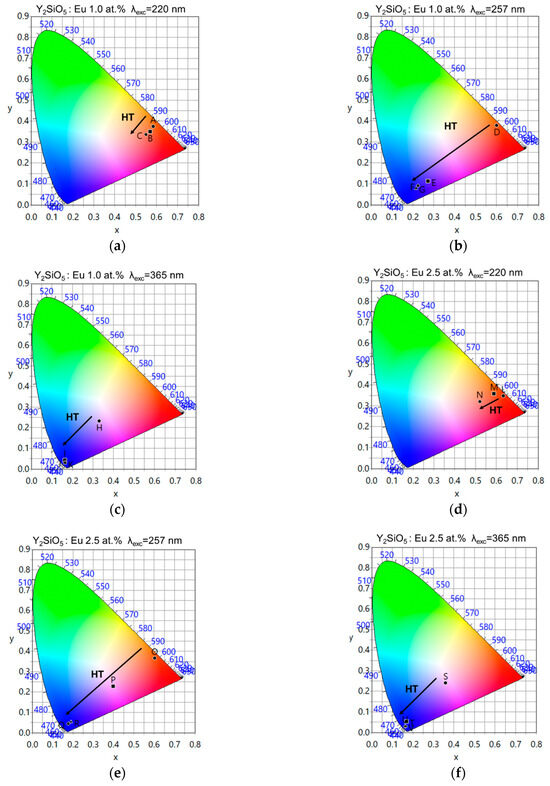
Figure 8.
CIE coordinates for sintered Y2SiO5, as function of HT. (a) 1.0 at.% Eu, λexc = 220 nm. (b) 1.0 at.% Eu, λexc = 257 nm. (c) 1.0 at.% Eu, λexc = 365 nm. (d) 2.5 at.% Eu, λexc = 220 nm, (e) 2.5 at.% Eu, λexc = 257 nm. (f) 2.5 at.% Eu, λexc = 365 nm.
Moreover, the longer the HT, the more the colours shift toward blue. At the same time, for λexc = 220 nm, it is observed that prolonged sintering enhances the reduction of Eu3+ ⟶ Eu2+, increasing the Eu2+ concentration and broadening its emission band. This reduces colour purity and shifts the emission toward longer wavelengths.
Comparing Figure 8b,e (as well as the corresponding CIE coordinates), the sample with lower Eu content (1.0 at.%) shows a relatively rapid shift towards the blue region of the spectrum, meaning that there is greater efficiency in the reduction mechanisms. Conversely, the sample with the higher Eu content (2.5 at.%) shows lower efficiency because of the mixture between Eu3+ and Eu2+, allowing light to be obtained in the white region of the spectrum after HT = 15 min.
2.3.7. Oxidation Process of SPS-Sintered Y2SiO5: Eu3—Luminiscent Properties
The Y2SiO5: Eu samples sintered for HT = 30 min with 1.0 and 2.5 at.% Eu were placed in a furnace for 1 h at 1000 °C in an uncontrolled (ambient) atmosphere, aiming to re-oxidise Eu2+ back to Eu3+. The luminescence results for the oxidised samples are shown in Figure 9.
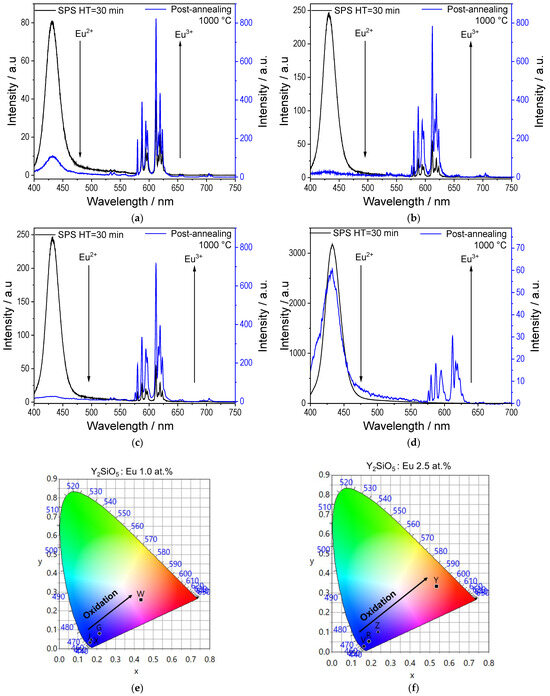
Figure 9.
Luminescent properties of sintered Y2SiO5: Eu samples after oxidation process at 1000 °C. (a) λexc = 257 nm, 1.0 at.%. Eu. (b) λexc = 257 nm, 2.5 at.% Eu. (c) λexc = 365 nm, 1.0 at.%. Eu. (d) λexc = 365 nm, 2.5 at.% Eu. (e) CIE coordinates for 1.0 at.% Eu. (f) CIE coordinates for 2.5 at.% Eu.
For both Eu concentrations, the emission corresponding to Eu2+ at 433 nm significantly decreases after oxidation at 1000 °C (the emission spectra of the samples after sintering are included for ease of comparison). This demonstrates that the Eu2+ ⟶ Eu3+ process has occurred. This result is evident in points W and Y of the CIE diagrams (Figure 9e,f, and Table 5); at λexc = 257 nm, the colours shift from blue back towards red, demonstrating that the process is reversible. Finally, at λ exc = 365 nm, a decrease in the Eu2+ emission band is also observed; however, from the emission spectra, a certain amount of Eu2+ remains.
Table 5.
CIE chromaticity coordinates for the Y2SiO5: Eu system before and after the oxidation at 1000 °C process.
3. Materials and Methods
3.1. Y2SiO5 Powders Preparation
Eu3+-doped Y2SiO5 powders were synthesised via sol–gel method. The process involved two precursor solutions: (I) Rare-earth sol and (II) Silicon sol. Solution (I) was prepared by dissolving yttrium chloride (YCl3·6H2O, Sigma-Aldrich, St. Louis, MO, USA, 99.99%) in a 2:1 ethanol-ethylene glycol mixture (C2H6O, Fermont, Monterrey, Mexico, 98%; C2H6O2, Sigma-Aldrich, 98%) to achieve a 0.23 M Y3+ concentration. Acetic acid (CH3COOH, Fermont, Monterrey, Mexico, 98%) was added as a catalyst at a concentration of 1.74 M. Europium (III) chloride (EuCl3·6H2O, Sigma-Aldrich, St. Louis, MO, USA, 98%) was then introduced to obtain Eu3+ doping concentrations of 1.0 and 2.5 at.%. The choice of the Eu content analysed was made considering that the maximum emission efficiency concentration of Eu3+ is usually between 1 and 2.5 at.% for different ceramic systems [71,72] and for Y2SiO5 [73]. The solution was stirred for 4 h. Solution (II) was prepared with a 0.12 M Si concentration using tetraethyl orthosilicate (TEOS, SiC8H20O4, Sigma-Aldrich, St. Louis, MO, USA, 99%) in an 8:1 ethanol-water mixture. Acetic acid (0.26 M) was added as a catalyst, and the solution was stirred for 4 h. After stirring, both sols were mixed and agitated for 24 h. The resulting sol was dried at 100 °C for 48 h to form a xerogel. Subsequently, thermal treatments were performed at 300 °C and 500 °C for 2 h each to remove organic residues. Finally, the powder was calcined at 1000 °C for 4 h to achieve complete crystallisation into Y2SiO5: Eu3+.
3.2. Y2SiO5: Eu3+ Sintering and Later Annealing
Y2SiO5: Eu3+ sol–gel powders were sintered using a Dr Sinter Sumitomo 1050 apparatus (Sumitomo Coal Ming Co., Tokyo, Japan), 2 g was weighed and placed in a 5 mm diameter graphite die with a graphite foil lining. The sintering was carried out at temperature of 1300 °C with uniaxial pressure of 4.5 kN (28.645 MPa). The pressure was applied at the beginning of the heating cycle at a rate of 100 °C/min. For both two Eu contents (1.0 and 2.5 at.%), samples were prepared with three different holding times: 6, 15 and 30 min. After holding this time, the ram pressure was released, and the solid mixture was allowed to cool inside the chamber. In this way, coupons of 5 mm diameter and 10 mm thick were obtained. Once the samples were characterised, they were subjected to a heat treatment at 1000 °C for 1 h in air, in order to oxidise the Eu again. On the other hand, to ensure the correct compaction process, shrinkage is monitored as a function of both temperature and time. Shrinkage can be defined as: dL/L0, where L0 is the initial thickness of the specimen, and is therefore considered to be the instantaneous displacement rate.
3.3. Characterisation
Crystal structure was determined by a D2 Phase-Bruker diffractometer (Karlsruhe, Germany) using a copper anticathode at 40 kV and 20 mA. Luminescent properties were analysed with an Acton Pro 3500i monochromator (Acton Research Corporation, Acton, MA, USA) and a R955 Hamamatsu photomultiplier tube (Shizuoka, Japan) for visible emission with a fluorescence spectrophotometer Hitachi F-7000 (Ibaraki, Japan), equipped with a 150 W xenon lamp.
4. Conclusions
We demonstrated that sol–gel-derived Y2SiO5 powders doped with Eu3+, when processed by SPS, exhibit changes in the luminescent properties owing to the reduction of Eu3+ ⟶ Eu2+. This phenomenon depends on the HT during SPS, showing that the longer the sintering time, the greater the amount of reduced Eu.
Cation reduction occurs because of the synergistic action between CO inside the chamber and the creation of oxygen vacancies, facilitating the formation of Eu2+. Therefore, the luminescent properties of the systems can be tuned depending on the initial Eu content and the SPS HT, as well as the excitation wavelength.
Ultimately, excitation at 220 nm always produces the typical red colours of Eu3+, whereas excitation at 365 nm produces the blue colours of Eu2+, and a mixture of both colours is observed at 257 nm, specifically blues, pinks, purples, whites, oranges, and reds. Finally, we demonstrated that the reduction process is reversible (Eu2+ ⟶ Eu3+), so the luminescent properties can be tuned by controlling the chemical composition, the sintering time in the SPS and the oxidation process.
Author Contributions
Conceptualization, F.J.-L. and A.d.J.M.-R.; methodology, M.A.N.-V.; validation, M.A.N.-V., R.C.-M. and M.J.S.-M.; formal analysis, A.d.J.M.-R. and M.G.-H.; investigation, F.J.-L.; writing—original draft preparation, M.A.N.-V. and M.J.S.-M.; writing—review and editing, A.d.J.M.-R. and M.G.-H.; visualisation, R.C.-M. All authors have read and agreed to the published version of the manuscript.
Funding
This research received no external funding.
Institutional Review Board Statement
Not applicable.
Informed Consent Statement
Not applicable.
Data Availability Statement
The original contributions presented in this study are included in the article. Further inquiries can be directed to the corresponding author.
Acknowledgments
The authors acknowledge to: Comisión de Fomento a las Actividades Académicas, Estimulo al desempeño de los Investigadores; Sistema Nacional de Investigadores, Secretaria de Ciencia, Humanidades, Tecnología e Innovación (SECIHTI) México; and the Instituto Politécnico Nacional—SIP for 2389 multidisciplinary project (20251162, 20253472 and 20250704).
Conflicts of Interest
The authors declare no conflicts of interest.
References
- Farooq, M.; Rafiq, H.; Shah, A.U.I.; Rasool, M.H. Review—On the Development of Phosphors for Luminescent Materials: Synthesis, Characterization, Applications and Evolution of Phosphors as White-Light-Emitting Diodes. ECS J. Solid. State Sci. Technol. 2023, 12, 126002. [Google Scholar] [CrossRef]
- Singh, S.; Singh, D.; Siwach, P.; Gupta, I.; Kumar, P. Synthesis Strategies for Rare Earth Activated Inorganic Phosphors: A Mini Review. Appl. Res. 2025, 4, e202400190. [Google Scholar] [CrossRef]
- Bai, G.; Tsang, M.K.; Hao, J. Tuning the luminescence of phosphors: Beyond conventional chemical method. Adv. Opt. Mater. 2015, 3, 431–462. [Google Scholar] [CrossRef]
- Liang, L.; Yang, H.; Mao, Q.; Zhao, F.; Ding, Y.; Li, X.; Liu, M.; Zhong, J. Eu3+ doping induces asynchronous tuning of luminescence and afterglow in self-activated LiZnSbO4 host for multiple applications. Chem. Eng. J. 2025, 508, 161129. [Google Scholar] [CrossRef]
- Otsuka, T.; Oka, R.; Cicconi, M.R.; de Ligny, D.; Hayakawa, T. Tuning the luminescence color of Eu3+- and alkali-ion-codoped Sr2CaWO6 orange-red phosphors: Eu3+ site distribution and site-selective photoluminescence studies. APL Mater. 2024, 12, 031129. [Google Scholar] [CrossRef]
- Lohe, P.P.; Nandanwar, D.V.; Belsare, P.D.; Moharil, S.V. Colour tuning of garnet phosphor through codoping. J. Lumin. 2021, 235, 118017. [Google Scholar] [CrossRef]
- Chen, W.; Yi, J.; Yuan, H.; Li, L.; Sun, F. Synthesis and tunable luminescence of Eu3+ and Eu2+ codoped LaSr2AlO5:Eu phosphors for LED application. Mater. Today Commun. 2017, 13, 290–294. [Google Scholar] [CrossRef]
- Le, F.; Wang, L.; Jia, W.; Jia, D.; Bao, S. Synthesis and photoluminescence of Eu2+ by co-doping Eu3+ and Cl- in Sr2P2O7 under air atmosphere. J. Alloys Compd. 2012, 512, 323–327. [Google Scholar] [CrossRef]
- Peng, M.; Hong, G. Reduction from Eu3+ to Eu2+ in BaAl2O4:Eu phosphor prepared in an oxidizing atmosphere and luminescent properties of BaAl2O4:Eu. J. Lumin. 2007, 127, 735–740. [Google Scholar] [CrossRef]
- Gonçalves, R.R.; Messaddeq, Y.; Atik, M.; Ribeiro, S.J.L. Optical properties of ZrO2, SiO2 and TiO2-SiO2 xerogels and coatings doped with Eu3+ and Eu2+. Mater. Res. 1999, 2, 11–15. [Google Scholar] [CrossRef]
- Wu, H.; Xu, M.; Chang, C. Modulating the valence of Eu2+/Eu3+ in Sr2MgSi2O7 for white luminescence. J. Alloys Compd. 2024, 1002, 175430. [Google Scholar] [CrossRef]
- Khan, S.; Zheng, H.-W.; Jiao, H.; Saleem, S.; Gul, Z.; Al-Humaidi, J.Y.; Al Bahir, A.; Althomali, R.H.; Ali, A.; Rahman, M.M. Reduction mechanism and energy transfer between Eu3+ and Eu2+ in Eu-doped materials synthesized in air atmosphere. Rev. Inorg. Chem. 2024, 44, 547–567. [Google Scholar] [CrossRef]
- Barbosa, W.T.; Álvarez-Docio, C.M.; Garcia-Carrodeguas, R.; Fook, M.V.L.; Rodríguez, M.A.; Rojas-Hernandez, R.E. Impact of fuel quantity on luminescence properties of Sr3Al2O6:Eu by combustion synthesis. Ceramica 2023, 69, 17–22. [Google Scholar] [CrossRef]
- Dereń, P.J.; Stefańska, D.; Ptak, M.; Wiśniewski, P. Method to Measure the Degree of Reduction of Eu3+to Eu2+: How Anion and Cation Vacancies Influence the Degree of Reduction. J. Phys. Chem. C 2021, 125, 24505–24514. [Google Scholar] [CrossRef]
- Dai, W.B. Mechanism of the reduction and energy transfer between Eu2+ and Eu3+ in Eu-doped CaAl2Si2O8 materials prepared in air. J. Mater. Chem. C Mater. 2014, 2, 3951–3959. [Google Scholar] [CrossRef]
- Lee, J.H.; Singh, S.P.; Kim, M.; Pyo, M.; Park, W.B.; Sohn, K.-S. A rate equation model for the energy transfer mechanism of a novel multi-color-emissive phosphor, Ca1.624Sr0.376Si5O3N6:Eu2+. Inorg. Chem. Front. 2019, 6, 3493–3500. [Google Scholar] [CrossRef]
- Yao, H.; Qiu, Z.; Xiong, X. Preparation and luminescence properties of Ba2Mg(BO3)2:Eu2+/3+phosphor. IOP Conf. Ser. Earth Environ. Sci. 2021, 714, 022019. [Google Scholar] [CrossRef]
- Arman, M.Ö.; Geboes, B.; Van Hecke, K.; Binnemans, K.; Cardinaels, T. Kinetics of electrochemical Eu3+ to Eu2+ reduction in aqueous media. Electrochim Acta 2024, 484, 144055. [Google Scholar] [CrossRef]
- Kusaba, M.; Nakashima, N.; Kawamura, W.; Izawa, Y.; Yamanaka, C. Higher yield of photoreduction from Eu3+ to Eu2+ with shorter wavelength irradiation. Chem. Phys. Lett. 1992, 197, 136–140. [Google Scholar] [CrossRef]
- Ishida, A.; Takamuku, S. One-electron reduction of Eu3+ ions induced by the irradiation of γ-ray or UV-light. The fluorescence properties of Eu2+ ions in an ethanol matrix. Chem. Lett. 1988, 17, 1497–1500. [Google Scholar] [CrossRef]
- Muralidharan, J.H.E.S. Kinetics and mechanism of the oxidation of europium (II) ions and of the reduction of europium (III) ions by 2-hydroxy-2-propyl radicals. Inorg. Chem. 1984, 23, 636–639. [Google Scholar] [CrossRef]
- Zhang, J.C.; Long, Y.Z.; Di Zhang, H.; Sun, B.; Han, W.P.; Sun, X.Y. Eu2+/Eu3+-emission-ratio-tunable CaZr(PO4)2:Eu phosphors synthesized in air atmosphere for potential white light-emitting deep UV LEDs. J. Mater. Chem. C Mater. 2014, 2, 312–318. [Google Scholar] [CrossRef]
- Cui, J.; Wen, Y.; Chen, R.; Cheng, X.; Yu, M.; Liu, J.; Hu, Z.; He, J.; Xiao, Z.; Sun, X.-Y. Bright cyan emission from Eu-Doped borosilicate glasses by optimizing reduction of Eu3+ to Eu2+ in ambient atmosphere. Chem. Eng. J. 2024, 489, 151416. [Google Scholar] [CrossRef]
- Palaspagar, R.S.; Gawande, A.B.; Sonekar, R.P.; Omanwar, S.K. Eu3+→Eu2+ reduction in BaAl2B2O7 phosphor in oxidizing environment. Optik 2015, 126, 5030–5032. [Google Scholar] [CrossRef]
- Singh, D.K.; Iyer, P.K.; Giri, P.K. Role of molecular interactions and structural defects in the efficient fluorescence quenching by carbon nanotubes. Carbon. N. Y 2012, 50, 4495–4505. [Google Scholar] [CrossRef]
- Boukerika, A.; Guerbous, L. Annealing effects on structural and luminescence properties of red Eu3+-doped Y2O3 nanophosphors prepared by sol-gel method. J. Lumin. 2014, 145, 148–153. [Google Scholar] [CrossRef]
- Liu, F.W.; Hsu, C.H.; Chen, F.S.; Lu, C.H. Microwave-assisted solvothermal preparation and photoluminescence properties of Y2O3:Eu3+ phosphors. Ceram. Int. 2012, 38, 1577–1584. [Google Scholar] [CrossRef]
- He, M.; Jia, J.; Zhao, J.; Qiao, X.; Du, J.; Fan, X. Glass-ceramic phosphors for solid state lighting: A review. Ceram. Int. 2021, 47, 2963–2980. [Google Scholar] [CrossRef]
- Lin, Y.C.; Karlsson, M.; Bettinelli, M. Inorganic phosphor materials for lighting. Top. Curr. Chem. 2016, 374, 374–421. [Google Scholar] [CrossRef]
- Sinha, K.; Pearson, B.; Casolco, S.R.; Garay, J.E.; Graeve, O.A. Synthesis and consolidation of BaAl2Si2O8:Eu: Development of an integrated process for luminescent smart ceramic materials. J. Am. Ceram. Soc. 2009, 92, 2504–2511. [Google Scholar] [CrossRef]
- Casolco, S.R.; Xu, J.; Garay, J.E. Transparent/translucent polycrystalline nanostructured yttria stabilized zirconia with varying colors. Scr. Mater. 2008, 58, 516–519. [Google Scholar] [CrossRef]
- Li, J.; Li, S.; Alim, M.A. The effect of reducing atmosphere on the SrTiO3 based varistor-capacitor materials. J. Mater. Sci. Mater. Electron. 2006, 17, 503–508. [Google Scholar] [CrossRef]
- Peng, M.; Pei, Z.; Hong, G.; Su, Q. The reduction of Eu3+ to Eu2+ in BaMgSiO4:Eu prepared in air and the luminescence of BaMgSiO4:Eu2+ phosphor. J. Mater. Chem. 2003, 13, 1202–1205. [Google Scholar] [CrossRef]
- Wang, H.; Su, K.; Mei, L.; Guo, Q.; Liao, L. Vacancy-Enhanced Self-Reduction of Eu in Pyrophosphate Phosphor. Inorg. Chem. 2023, 62, 12468–12479. [Google Scholar] [CrossRef] [PubMed]
- Carreón, J.A.F.; Ocaña, M.; García-Sevillano, J.; Cantelar, E.; Becerro, A.I. New single-phase, white-light-emitting phosphors based on δ-Gd2Si2O7 for solid state lighting. J. Phys. Chem. C 2014, 118, 18035–18043. [Google Scholar] [CrossRef]
- Gonzalez-Ortega, J.A.; Perea, N.; Hirata, G.A. White light emission from Y2SiO5:Ce, Tb films excited by electroluminescence. Opt. Mater. 2006, 29, 47–50. [Google Scholar] [CrossRef]
- Flores, D.L.; Gutierrez, E.; Cervantes, D.; Chacon, M.; Hirata, G. White-light emission from Y2SiO5:Ce3+, Tb3+ and Sr2Si5N8:Eu2+ phosphor blends: A predictive model. Micro Nano Lett. 2017, 12, 500–504. [Google Scholar] [CrossRef]
- Al-Hunaishi, S.; Blin, A.; Harada, N.; Perrin, P.; Goldner, P.; Serrano, D.; Tallaire, A. Rare-earth doped yttrium silicate (Y2SiO5) thin films grown by chemical vapour deposition for quantum technologies. J. Lumin. 2024, 271, 120595. [Google Scholar] [CrossRef]
- Aitasalo, T.; Hölsä, J.; Lastusaari, M.; Niittykoski, J.; Pellé, F. Delayed luminescence of Ce3+ doped X1 form of Y2SiO5. Opt. Mater. 2005, 27, 1511–1515. [Google Scholar] [CrossRef]
- Hamroun, M.S.E.; Guerbous, L.; Bensafi, A. Luminescent spectroscopy and structural properties of Ce3+-doped low-temperature X1–Y2SiO5 material prepared by polymer-assisted sol–gel method. Appl. Phys. A Mater. Sci. Process 2016, 122, 321. [Google Scholar] [CrossRef]
- Martínez, A.A.; Arroyo-Murillo, R.; Korthout, K.; Poelman, D. Reduction of Eu3+ to Eu2+ in α-Y2Si2O7 and X1-Y2SiO5 and their luminescent properties. J. Alloys Compd. 2018, 765, 747–752. [Google Scholar] [CrossRef]
- Hamroun, M.S.E.; Guenanou, A.; Guerbous, L.; Chebout, R.; Bachari, K. Annealing Temperature Effect on Structural and Luminescence Spectroscopy of Y2SiO5:Ce3+ Nanomaterial Synthesized by Sol–Gel Method. J. Res. Updates Polym. Sci. 2022, 11, 54–60. [Google Scholar] [CrossRef]
- Rafiaei, S.M.; Shokouhimehr, M. Structural and optical characterizations of Ce3+-doped YSO phosphors via the addition of TEOS. Luminescence 2021, 36, 1117–1123. [Google Scholar] [CrossRef]
- Sun, Z.; Li, M.; Zhou, Y. Thermal properties of single-phase Y2SiO5. J. Eur. Ceram. Soc. 2009, 29, 551–557. [Google Scholar] [CrossRef]
- Khan, Z.S.; Ali, A.; Nazir, Z.; Cao, X. Effect of calcination temperature on the degree of polymorphic transformation in Y2SiO5 nanopowders synthesized by sol–gel method. J. Non-Cryst. Solids 2016, 432, 540–544. [Google Scholar] [CrossRef]
- Parker, C.G.; Opila, E.J. Stability of the Y2O3–SiO2 system in high-temperature, high-velocity water vapor. J. Am. Ceram. Soc. 2020, 103, 2715–2726. [Google Scholar] [CrossRef]
- Sekulić, M.; Dramićanin, T.; Ćirić, A.; Far, L.Ð.; Dramićanin, M.D.; Ðordević, V. Photoluminescence of the Eu3+-Activated Yx Lu1−x NbO4 (x = 0, 0.25, 0.5, 0.75, 1) Solid-Solution Phosphors. Crystals 2022, 12, 427. [Google Scholar] [CrossRef]
- Manasa, P.; Jayasankar, C.K. Luminescence and phonon side band analysis of Eu3+-doped lead fluorosilicate glasses. Opt. Mater. 2016, 62, 139–145. [Google Scholar] [CrossRef]
- Ramírez, A.d.J.M.; Murillo, A.G.; Romo, F.d.J.C.; Hernández, M.G.; Vigueras, D.J.; Chaderyron, G.; Boyer, D. Properties of Gd2O3:Eu3+, Tb3+nanopowders obtained by sol-gel process. Mater. Res. Bull. 2010, 45, 40–45. [Google Scholar] [CrossRef]
- Gruzintsev, A.N.; Emel’chenko, G.A.; Yermolayeva, Y.V.; Masalov, V.M.; Tolmachev, A.V.; Barthou, C. Effect of the geometric shape of Lu2O3: Eu spherical nanocrystals on their spontaneous luminescence. Phys. Solid State 2011, 53, 1895–1901. [Google Scholar] [CrossRef]
- Derbel, M.; Mbarek, A.; Chadeyron, G.; Fourati, M.; Zambon, D.; Mahiou, R. Novel bluish white-emitting CdBaP2O7:Eu2+ phosphor for near-UV white-emitting diodes. J. Lumin. 2016, 176, 356–362. [Google Scholar] [CrossRef]
- Wang, P.; Huang, Z.; Morita, K.; Li, Q.; Yang, M.; Zhang, S.; Goto, T.; Tu, R. Influence of spark plasma sintering conditions on microstructure, carbon contamination, and transmittance of CaF2 ceramics. J. Eur. Ceram. Soc. 2022, 42, 245–257. [Google Scholar] [CrossRef]
- Smetanina, K.E.; Andreev, P.V.; Nokhrin, A.V.; Lantsev, E.A.; Chuvildeev, V.N. Carbon contamination during spark plasma sintering of powder materials: A brief overview. J. Alloys Compd. 2024, 973, 172823. [Google Scholar] [CrossRef]
- Hajihashemi, M.; Shamanian, M.; Ashrafizadeh, F. Band gap tuning of oxygen vacancy-induced Al2O3-TiO2 ceramics processed by spark plasma sintering. J. Electroceram. 2022, 48, 35–50. [Google Scholar] [CrossRef]
- Wang, J.; Zeng, L.; Xia, M.; Zhang, Z.; Liang, J.; Bao, W.; Hong, T.; Xie, G.; Li, J. Tuning phase transition properties of bulk VO2/Al composites through the pressure control of SPS. Ceram. Int. 2025, 51, 40325–40334. [Google Scholar] [CrossRef]
- Sakthivel, T.; Sun, L.; Devakumar, B.; Li, B.; Huang, X. Novel high-efficiency Eu3+-activated Na2Gd2B2O7 red-emitting phosphors with high color purity. RSC Adv. 2018, 8, 32948–32955. [Google Scholar] [CrossRef] [PubMed]
- Zhang, B.; Yu, X.; Wang, T.; Cheng, S.; Qiu, J.; Xu, X. Photostimulated and long persistent luminescence properties from different crystallographic sites of β-Sr2SiO4: Eu2+, R3+ (R = Tm, Gd). J. Am. Ceram. Soc. 2015, 98, 171–177. [Google Scholar] [CrossRef]
- Som, S.; Sharma, S.K. Eu3+/Tb3+-codoped Y2O3 nanophosphors: Rietveld refinement, bandgap and photoluminescence optimization. J. Phys. D Appl. Phys. 2012, 45, 415102. [Google Scholar] [CrossRef]
- Dejneka, M.; Snitzer, E.; Riman, R.E. Blue, green and red fluorescence and energy transfer of Eu3+ in fluoride glasses. J. Lumin. 1995, 65, 227–245. [Google Scholar] [CrossRef]
- Wang, Y.; Townsend, P.D. Common mistakes in luminescence analysis. J. Phys. Conf. Ser. 2012, 398, 012003. [Google Scholar] [CrossRef]
- Gaft, M.; Reisfeld, R.; Panczer, G. Modern Luminescence Spectroscopy of Minerals and Materials, 2nd ed.; Springer: Heidelberg, Germany, 2015. [Google Scholar] [CrossRef]
- Xie, F.; Zhang, T.A.; Dreisinger, D.; Doyle, F. A critical review on solvent extraction of rare earths from aqueous solutions. Min. Eng. 2014, 56, 10–28. [Google Scholar] [CrossRef]
- Kitagawa, Y.; Ueda, J.; Xu, J.; Nakanishi, T.; Takeda, T.; Hirosaki, N.; Tanabe, S. Deep-red to near-infrared luminescence from Eu2+ -trapped exciton states in YSiO2 N. Phys. Chem. Chem. Phys. 2022, 24, 4348–4357. [Google Scholar] [CrossRef]
- Arreguín, R.V. Luminescent characteristics of Eu2+/Li+ doped (La-Al)2O3 phosphors and PMMA films activated with them. Rev. Mex. De. Fis. 2018, 64, 447–455. [Google Scholar] [CrossRef]
- Kang, T.; Lee, S.; Kim, T.; Kim, J. Efficient Luminescence of Sr2Si5N8:Eu2+ nanophosphor and its film applications to LED and Solar cell as a downconverter. Sci. Rep. 2020, 10, 1475. [Google Scholar] [CrossRef]
- Van Uitert, L.G. An empirical relation fitting the position in energy of the lower d-band edge fir Eu2+ or Ce3+ in various compounds. J. Lumin. 1984, 29, 1–9. [Google Scholar] [CrossRef]
- Mirzai, A.; Ahadi, A.; Melin, S.; Olsson, P.A.T. First-principle investigation of doping effects on mechanical and thermodynamic properties of Y2SiO5. Mech. Mater. 2020, 154, 103739. [Google Scholar] [CrossRef]
- Fujimura, N.; Ohta, A.; Makihara, K.; Miyazaki, S. Evaluation of valence band top and electron affinity of SiO2 and Si-based semiconductors using X-ray photoelectron spectroscopy. Jpn. J. Appl. Phys. 2016, 55, 08PC06. [Google Scholar] [CrossRef]
- James, M.C.; May, P.W.; Allan, N.L. Ab initio study of negative electron affinity from light metals on the oxygen-terminated diamond (1 1 1) surface. J. Phys. Condens. Matter 2019, 31, 295002. [Google Scholar] [CrossRef]
- Kristiansson, M.K.; Chartkunchand, K.; Eklund, G.; Hole, O.M.; Anderson, E.K.; de Ruette, N.; Kamińska, M.; Punnakayathil, N.; Navarro-Navarrete, J.E.; Sigurdsson, S.; et al. High-precision electron affinity of oxygen. Nat. Commun. 2022, 13, 5906. [Google Scholar] [CrossRef]
- Han, Y.; Wang, X.; Dai, H.; Li, S. Synthesis and luminescence of Eu3+ doped hydroxyapatite nanocrystallines: Effects of calcinations and Eu3+ content. J. Lumin. 2013, 135, 281–287. [Google Scholar] [CrossRef]
- Dubey, V.; Kaur, J.; Agrawal, S.; Suryanarayana, N.S.; Murthy, K.V.R. Effect of Eu3+ concentration on photoluminescence and thermoluminescence behavior of YBO3:Eu3+ phosphor. Superlattices Microstruct. 2014, 67, 156–171. [Google Scholar] [CrossRef]
- Parganiha, Y.; Kaur, J.; Dubey, V.; Chandrakar, D. Synthesis, characterization, thermoluminescence and optical studies of Eu3+ doped Y2SiO5 phosphor. Superlattices Microstruct. 2015, 77, 152–161. [Google Scholar] [CrossRef]
Disclaimer/Publisher’s Note: The statements, opinions and data contained in all publications are solely those of the individual author(s) and contributor(s) and not of MDPI and/or the editor(s). MDPI and/or the editor(s) disclaim responsibility for any injury to people or property resulting from any ideas, methods, instructions or products referred to in the content. |
© 2025 by the authors. Licensee MDPI, Basel, Switzerland. This article is an open access article distributed under the terms and conditions of the Creative Commons Attribution (CC BY) license (https://creativecommons.org/licenses/by/4.0/).