
Allosteric Fluorescent Detection of Saccharides and Biomolecules in Water from a Boronic Acid Functionalized Arene Ruthenium Assembly Hosting Fluorescent Dyes †


Abstract
:
1. Introduction
2. Results
3. Materials and Methods
4. Conclusions
Supplementary Materials
Author Contributions
Funding
Data Availability Statement
Acknowledgments
Conflicts of Interest
References
- A Castle, S.D.; Stock, M.; Gorochowski, T.E. Engineering is evolution: A perspective on design processes to engineer biology. Nat. Commun. 2024, 15, 3640. [Google Scholar] [CrossRef] [PubMed]
- Monod, J.; Wyman, J.; Changeux, J.-P. On the nature of allosteric transitions: A plausible model. J. Mol. Biol. 1965, 12, 88–118. [Google Scholar] [CrossRef] [PubMed]
- Ebrahim, S.; Samanta, D. Engineering protein-based therapeutics through structural and chemical design. Nat. Commun. 2023, 14, 2411. [Google Scholar] [CrossRef]
- Fisher, G.; Corbella, M.; Alphey, M.S. Allosteric rescue of catalytically impaired ATP phosphoribosyltransferase variants links protein dynamics to active-site electrostatic preorganisation. Nat. Commun. 2022, 13, 7607. [Google Scholar] [CrossRef]
- Ke, C.; Destecroix, H.; Crump, M.; Davis, A.P. A simple and accessible synthetic lectin for glucose recognition and sensing. Nat. Chem. 2012, 4, 718–723. [Google Scholar] [CrossRef]
- Kremer, C.; Lützen, A. Artificial Allosteric Receptors. Chem. Eur. J. 2013, 19, 6162–6196. [Google Scholar] [CrossRef]
- Tsai, C.-J.; Del Sol, A.; Nussinov, R. Protein allostery, signal transmission and dynamics: A classification scheme of allosteric mechanisms. Mol. BioSyst. 2009, 5, 207–216. [Google Scholar] [CrossRef]
- Kimura, Y.; Matsumura, K.; Ono, K.; Tsuchido, Y.; Ka-wai, H. Recognition of Amino Acid Salts by Temperature-Dependent Allosteric Binding with Stereodynamic Urea Receptors. Chem. Eur. J. 2024, 30, e202400154. [Google Scholar] [CrossRef]
- Musikavanhu, B.; Liang, Y.; Xue, Z.; Feng, L.; Zhao, L. Strategies for Improving Selectivity and Sensitivity of Schiff Base Fluorescent Chemosensors for Toxic and Heavy Metals. Molecules 2023, 28, 6960. [Google Scholar] [CrossRef]
- Thangadurai, T.D.; Manjubaashini, N. Progressions in chemical and biological analytes sensing technology based on nanostructured materials: A comprehensive review. Mater. Sci. Eng. 2021, 271, 115307. [Google Scholar] [CrossRef]
- Sun, X.; James, T.D. Glucose Sensing in Supramolecular Chemistry. Chem. Rev. 2015, 115, 8001–8037. [Google Scholar] [CrossRef] [PubMed]
- Yu, L.; Wang, S.; Huang, K.; Liu, Z.; Gao, F.; Zeng, W. Fluorescent probes for dual and multi analyte detection. Tetrahedron 2015, 71, 4679–4706. [Google Scholar] [CrossRef]
- Krämer, J.; Kang, R.; Grimm, L.M.; Cola, L.D.; Picchetti, P.; Biedermann, F. Molecular Probes, Chemosensors, and Nanosensors for Optical Detection of Biorelevant Molecules and Ions in Aqueous Media and Biofluids. Chem. Rev. 2022, 122, 3459–3636. [Google Scholar] [CrossRef] [PubMed]
- Wu, X.; Li, Z.; Chen, X.-X.; Fossey, J.S.; James, T.D.; Jiang, Y.-B. Selective sensing of saccharides using simple boronic acids and their aggregates. Chem. Soc. Rev. 2013, 42, 8032. [Google Scholar] [CrossRef]
- Fang, G.; Wang, H.; Bian, Z.; Sun, J.; Liu, H.; Fang, H.; Liu, B.; Yao, Q.; Wu, Z. Recent development of boronic acid-based fluorescent sensors. RSC Adv. 2018, 8, 29400–29427. [Google Scholar] [CrossRef]
- Gordon, E.M.; Barrett, R.W.; Dower, W.J.; Fodor, S.P.A.; Gallop, M.A. Applications of Combinatorial Technologies to Drug Discovery. 2. Combinatorial Organic Synthesis, Library Screening Strategies, and Future Directions. J. Med. Chem. 1994, 37, 1385–1401. [Google Scholar] [CrossRef]
- Potyrailo, R.; Rajan, K.; Stoewe, K.; Takeuchi, I.; Chisholm, B.; Lam, H. Combinatorial and High-Throughput Screening of Materials Libraries: Review of State of the Art. ACS Comb. Sci. 2011, 13, 579–633. [Google Scholar] [CrossRef]
- Jin, X.; Liu, C.; Xu, T.; Su, L.; Zhang, X. Artificial intelligence biosensors: Challenges and prospects. Biosens. Bioelectron. 2020, 165, 112412. [Google Scholar] [CrossRef]
- Lu, S.; Shen, Q.; Zhang, J. Allosteric Methods and Their Applications: Facilitating the Discovery of Allosteric Drugs and the Investigation of Allosteric Mechanisms. Acc. Chem. Res. 2019, 52, 492–500. [Google Scholar] [CrossRef]
- Takeuchi, M.; Ikeda, M.; Sugasaki, A.; Shinkai, S. Molecular Design of Artificial Molecular and Ion Recognition Systems with Allosteric Guest Responses. Acc. Chem. Res. 2001, 34, 865–873. [Google Scholar] [CrossRef]
- Sepehrpour, H.; Fu, W.; Sun, Y.; Stang, P.J. Biomedically Relevant Self-Assembled Metallacycles and Metallacages. J. Am. Chem. Soc. 2019, 141, 14005–14020. [Google Scholar] [CrossRef] [PubMed]
- Mishra, A.; Lee, S.; Kim, H.; Cook, T.R.; Stang, P.J.; Chi, K.-W. Self-assembled metalla-bowls for selective sensing of multi-carboxylate anions. Dalton Trans. 2012, 41, 1195–1201. [Google Scholar] [CrossRef] [PubMed]
- Paul, A.; Roy, S. Chirality Sensing in Coordination-driven Supramolecular Assemblies. ChemRxiv 2024, 28, 26434. [Google Scholar] [CrossRef]
- Chang, X.; Zhou, Z.; Shang, C.; Wang, G.; Wang, Z.; Qi, Y.; Li, Z.-Y.; Wang, H.; Cao, L.; Li, X.; et al. Coordination-Driven Self-Assembled Metallacycles Incorporating Pyrene: Fluorescence Mutability, Tunability, and Aromatic Amine Sensing. J. Am. Chem. Soc. 2019, 141, 1757–1765. [Google Scholar] [CrossRef]
- Shanmugaraju, S.; Bar, A.K.; Chi, K.-Y.; Mukherjee, P. Coordination-Driven Self-Assembly of Metallamacrocycles via a New PtII2 Organometallic Building Block with 90° Geometry and Optical Sensing of Anions. Organometallics 2010, 29, 2971–2980. [Google Scholar] [CrossRef]
- Imai, Y.; Nakano, Y.; Kawai, T.; Yuasa, J. A Smart Sensing Method for Object Identification Using Circularly Polarized Luminescence from Coordination-Driven Self-Assembly. Angew. Chem. Int. Ed. 2018, 130, 9111–9116. [Google Scholar] [CrossRef]
- Inokuma, Y.; Kawano, M.; Fujita, M. Crystalline molecular flasks. Nat. Chem. 2011, 3, 349–358. [Google Scholar] [CrossRef]
- Benchimol, E.; Tessarolo, J.; Zhang, B.; Clever, G.H. Photoswitchable coordination cages. Nat. Chem. 2024, 146, 6905–6911. [Google Scholar] [CrossRef]
- Ludden, M.D.; Taylor, C.G.D.; Ward, M.D. Orthogonal binding and displacement of different guest types using a coordination cage host with cavity-based and surface-based binding sites. Chem. Sci. 2021, 12, 12640–12650. [Google Scholar] [CrossRef]
- Luddena, M.D.; Ward, M.D. Outside the box: Quantifying interactions of anions with the exterior surface of a cationic coordination cage. Dalton Trans. 2021, 50, 2782–2791. [Google Scholar] [CrossRef]
- Lee, S.G.; Lin, W. A Chiral Molecular Square with Metallo-Corners for Enantioselective Sensing. J. Am. Chem. Soc. 2002, 124, 4554–4555. [Google Scholar] [CrossRef] [PubMed]
- Chen, L.-J.; Yang, H.-B. Construction of Stimuli-Responsive Functional Materials via Hierarchical Self-Assembly Involving Coordination Interactions. Acc. Chem. Res. 2018, 51, 2699–2710. [Google Scholar] [CrossRef] [PubMed]
- Hu, Y.-X.; Zhang, X.; Xu, L.; Yang, H.-B. Coordination-Driven Self-Assembly of Functionalized Supramolecular Metallacycles: Highlighted Research during 2010–2018. Isr. J. Chem. 2018, 59, 209–219. [Google Scholar] [CrossRef]
- Gao, Z.; Jia, J.; Fan, W.; Liao, T.; Zhang, Z. Zirconium metal organic cages: From phosphate selective sensing to derivate forming. Chin. Chem. Lett. 2022, 33, 4415–4420. [Google Scholar] [CrossRef]
- Custelcean, R.; Bonnesen, P.V.; Duncan, N.C.; Zhang, X.; Watson, L.A.; Berkel, G.B.; Parson, W.B.; Hay, B.J. Urea-Functionalized M4L6 Cage Receptors: Anion-Templated Self-Assembly and Selective Guest Exchange in Aqueous Solutions. J. Am. Chem. Soc. 2012, 134, 8525–8534. [Google Scholar] [CrossRef]
- Northrop, B.H.; Zheng, Y.-R.; Chi, K.-W.; Stang, P.J. Self-Organization in Coordination-Driven Self-Assembly. Acc. Chem. Res. 2009, 42, 1554–1563. [Google Scholar] [CrossRef]
- Cook, T.R.; Stang, P.J. Recent Developments in the Preparation and Chemistry of Metallacycles and Metallacages via Coordination. Chem. Rev. 2015, 115, 7001–7045. [Google Scholar] [CrossRef]
- Therrien, B. Unmasking Arene Ruthenium Building Blocks. Chem. Rec. 2021, 21, 460. [Google Scholar] [CrossRef]
- Alvariño, C.; Heinrich, B.; Donnio, B.; Deschenaux, R.; Therrien, B. Supramolecular Arene-Ruthenium Metallacycle with Thermotropic Liquid-Crystalline Properties. Inorg. Chem. 2019, 58, 9505–9512. [Google Scholar] [CrossRef]
- Xu, Y.; Li, C.; Lu, S.; Wang, Z.; Liu, S.; Yu, X.; Li, X.; Sun, Y. Construction of emissive ruthenium(II) metallacycle over 1000 nm wavelength for in vivo biomedical applications. Nat. Commun. 2022, 13, 2009. [Google Scholar] [CrossRef]
- Yin, C.; Du, J.; Olenyuk, B.; Stang, P.J.; Sun, Y. The Applications of Metallacycles and Metallacages. Inorganics 2023, 11, 54. [Google Scholar] [CrossRef]
- van Enter, B.J.; von Hauff, E. Challenges and perspectives in continuous glucose monitoring. Chem. Commun. 2018, 54, 5032–5045. [Google Scholar] [CrossRef] [PubMed]
- Sakamoto, T.; Ojida, A.; Hamachi, I. Molecular recognition, fluorescence sensing, and biological assay of phosphate anion derivatives using artificial Zn(II)-Dpa complexes. Chem. Commun. 2009, 141–152. [Google Scholar] [CrossRef] [PubMed]
- Patrizi, B.; Siciliani de Cumis, M.; Viciani, S.; D’Amato, F. Dioxin and Related Compound Detection: Perspectives for Optical Monitoring. Int. J. Mol. Sci. 2019, 20, 2671. [Google Scholar] [CrossRef]
- Brooks, W.L.A.; Deng, C.C.; Sumerlin, B.S. Structure-Reactivity Relationships in Boronic Acid-Diol Complexation. ACS Omega 2018, 3, 17863–17870. [Google Scholar] [CrossRef]
- James, T.D.; Sandanayake, K.R.A.S.; Shinkai, S. Saccharide Sensing with Molecular Receptors Based on Boronic Acid. Angew. Chem. Int. Ed. 1996, 35, 1910–1922. [Google Scholar] [CrossRef]
- Bian, Z.; Liu, A.; Li, Y.; Fang, G.; Yao, Q.; Zhang, G.; Wu, Z. Boronic acid sensors with double recognition sites: A review. Analyst 2020, 145, 719–744. [Google Scholar] [CrossRef]
- Sun, X.; Chapin, B.P.; Metola, P.; Collins, B.; Wang, B.; James, T.D.; Anslyn, E.V. The mechanisms of boronate ester formation and fluorescent turn-on in ortho-aminomethylphenylboronic acids. Nat. Chem. 2019, 11, 768–778. [Google Scholar] [CrossRef]
- James, T.D.; Sandnayake, K.R.A.S.; Iguchi, R.; Shinkai, S. Novel Saccharide-Photoinduced Electron Transfer Sensors Based on the Interaction of Boronic Acid and Amine. J. Am. Chem. Soc. 1995, 117, 8982–8987. [Google Scholar] [CrossRef]
- Franzen, S.; Ni, W.; Wang, B. Study of the Mechanism of Electron-Transfer Quenching by Boron−Nitrogen Adducts in Fluorescent Sensors. J. Phys. Chem. B 2003, 107, 12942–12948. [Google Scholar] [CrossRef]
- Bruen, D.; Delaney, C.; Diamond, D.; Florea, L. Fluorescent Probes for Sugar Detection. ACS Appl. Mater. Interfaces 2018, 10, 38431–38437. [Google Scholar] [CrossRef] [PubMed]
- Xu, S.; Sedgwick, A.C.; Elfeky, S.A.; Fossey, J.S.; James, T.D. A boronic acid-based fluorescent hydrogel for monosaccharide detection. Front. Chem. Sci. Eng. 2020, 14, 112–116. [Google Scholar] [CrossRef]
- Ouyang, F.; Zhang, X.; Wang, T.; Shuai, Q. A fluorescent turn on/off probe for glucose detection based on a boronic acid-capped 1,1′-ferrocenedicarboxylic acid functional graphene oxide. Mater. Today Commun. 2022, 33, 104681. [Google Scholar] [CrossRef]
- Kashiwazaki, G.; Watanabe, R.; Nishikawa, A.; Kawamura, K.; Kitayama, T.; Hibi, T. A selective hybrid fluorescent sensor for fructose detection based on a phenylboronic acid and BODIPY-based hydrophobicity probe. RSC Adv. 2022, 12, 15083–15090. [Google Scholar] [CrossRef]
- Rather, I.; Ali, R. Indicator displacement assays: From concept to recent developments. Org. Biomol. Chem. 2021, 19, 5926. [Google Scholar] [CrossRef]
- Wikeley, S.M.; Przybylowski, J.; Lozano-Sanchez, P.; Caffio, M.; James, T.D.; Bull, S.D.; Fletcher, P.J.; Marken, F. Polymer indicator displacement assay: Electrochemical glucose monitoring based on boronic acid receptors and graphene form competitively binding with poly-nordihydroguaiaretic acid. Analyst 2022, 147, 661–670. [Google Scholar] [CrossRef]
- Sedgwick, A.C.; Brewster, J.T., II; Wu, T.; Feng, X.; Bull, S.D.; Qian, X.; Sessler, J.L.; James, T.D.; Anslyn, E.V.; Sun, X. Indicator displacement assays (IDAs): The past, present and future. Chem. Soc. Rev. 2021, 50, 9–38. [Google Scholar] [CrossRef]
- Egawa, Y.; Seki, T.; Takahashi, S.; Anzai, J. Electrochemical and optical sugar sensors based on phenylboronic acid and its derivatives. Mater. Sci. Eng. C 2011, 31, 1257–1264. [Google Scholar] [CrossRef]
- Han, J.H.; Kim, C.H.; Min, C.H.; Kim, M.J.; Kim, S.; Ji, H.B.; Yoon, S.B.; Lee, C.; Choy, Y.B. Microneedles coated with composites of phenylboronic acid-containing polymer and carbon nanotubes for glucose measurements in interstitial fluids. Biosens. Bioelectron. 2023, 238, 115571. [Google Scholar] [CrossRef]
- Lacina, K.; Skládal, P.; James, T.D. Boronic acids for sensing and other applications—A mini-review of papers published in 2013. Chem. Cent. J. 2014, 8, 60. [Google Scholar] [CrossRef]
- Marques, M.E.; Mansur, A.A.P.; Mansur, H.S. Chemical functionalization of surfaces for building three-dimensional engineered biosensors. Appl. Surf. Sci. 2013, 275, 347–360. [Google Scholar] [CrossRef]
- Li, M.; Xu, S.Y.; Gross, A.J.; Hammond, J.L.; Estrela, P.; Weber, J.; Lacina, K.; James, T.D.; Marken, F. Ferrocene-boronic acid-fructose binding based on dual-plate generator-collector voltammetry and square-wave voltammetry. ChemElectroChem 2015, 2, 867–871. [Google Scholar] [CrossRef] [PubMed]
- Liu, S.; Shi, F.; Zhao, X.; Chen, L.; Su, X. 3-Aminophenyl boronic acid-functionalized CuInS2 quantum dots as a near-infrared fluorescence probe for the determination of dopamine. Biosens. Bioelectron. 2013, 47, 379–384. [Google Scholar] [CrossRef]
- Basiruddin, S.K.; Swain, S.K. Phenylboronic acid functionalized reduced graphene oxide-based fluorescence nano sensor for glucose sensing. Mater. Sci. Eng. C 2016, 58, 103–109. [Google Scholar] [CrossRef]
- Li, D.; Zhang, Y.; Sun, F.; Felidj, N.; Gagey-Eilstein, N.; Lamouri, A.; Hémadi, M.; Nizard, P.; Luo, Y.; Mangeney, C. Dual-Probe SERS Nanosensor: A Promising Approach for Sensitive and Ratiometric Detection of Glucose in Clinical Settings. ACS Appl. Bio Mater. 2024, 7, 2254–2263. [Google Scholar] [CrossRef]
- Orhan, E.; Garci, A.; Therrien, B. Flexible arene ruthenium metalla-prisms. Inorg. Chim. Acta 2015, 438, 5–9. [Google Scholar] [CrossRef]
- Garci, A.; Dobrov, A.A.; Riedel, T.; Orhan, E.; Dyson, P.G.; Arion, V.B.; Therrien, B. Strategy to Optimize the Biological Activity of Arene Ruthenium Metalla-Assemblies. Organometallics 2014, 3, 3813–3822. [Google Scholar] [CrossRef]
- Swamy, K.M.K.; Lee, Y.J.; Lee, H.N.; Chun, J.; Kim, Y.; Kim, S.-J.; Yoon, J. A New Fluorescein Derivative Bearing a Boronic Acid Group as a Fluorescent Chemosensor for Fluoride Ion. J. Org. Chem. 2006, 71, 8626–8628. [Google Scholar] [CrossRef]
- Yan, J.; Springsteen, G.; Deeter, S.; Wang, B. The relationship among pKa, pH, and binding constants in the interactions between boronic acids and diols-it is not as simple as it appears. Tetrahedron 2004, 60, 11205–11209. [Google Scholar] [CrossRef]
- Bull, S.D.; Davidson, M.G.; van den Elsen, J.M.H.; Fossey, J.S.; Jenkins, A.T.A.; Jiang, Y.-B.; Kubo, Y.; Marken, F.; Sakurai, K.; Zhao, J.; et al. Exploiting the Reversible Covalent Bonding of Boronic Acids: Recognition, Sensing, and Assembly. Acc. Chem. Res. 2013, 46, 312–326. [Google Scholar] [CrossRef]
- Ortega-Valdovinos, L.R.; Valdes-García, J.; Bazany-Rodríguez, I.J.; Lugo-González, J.C.; Dorazco-González, A.; Yatsimirsky, A.K. Anion recognition by anthracene appended ortho-aminomethylphenylboronic acid: A new PET-based sensing mechanism. New J. Chem. 2021, 45, 15618–15628. [Google Scholar] [CrossRef]
- Wu, X.; Chen, X.-X.; Jiang, Y.-B. Recent advances in boronic acid-based optical chemosensors. Analyst 2017, 142, 1403–1414. [Google Scholar] [CrossRef] [PubMed]
- Cao, Z.; Cao, Y.; Kubota, R.; Sasaki, Y.; Asano, K.; Lyu, X.; Zhang, Z.; Zhou, Q.; Zhao, X.; Xu, X.; et al. Fluorescence Anion Chemosensor Array Based on Pyrenylboronic Acid. Front. Chem. 2020, 8, 414. [Google Scholar] [CrossRef]
- Hargrove, A.E.; Nieto, S.; Zhang, T.; Sessler, J.L.; Anslyn, E.V. Artificial Receptors for the Recognition of Phosphorylated Molecules. Chem. Rev. 2011, 111, 6603–6782. [Google Scholar] [CrossRef]
- Barry, N.P.E.; Furrer, J.; Freudenreich, J.; Süss-Fink, G.; Therrien, B. Designing the host-guest properties of tetranuclear arene ruthenium metalla-rectangles to accommodate a pyrene molecule. Eur. J. Inorg. Chem. 2010, 2010, 725–728. [Google Scholar] [CrossRef]
- OpenAI. ChatGPT.4o (GPT-4). 2024. Available online: https://chat.openai.com (accessed on 25 June 2024).
- Sasaki, Y.; Kubota, R.; Minami, T. Molecular self-assembled chemosensors and their arrays. Coord. Chem. Rev. 2021, 429, 213607. [Google Scholar] [CrossRef]
- Lovrić, M.; Đuričić, T.; Tran, H.T.N.; Hussain, H.; Lacić, E.; Rasmussen, M.A.; Kern, R. Should we embed in chemistry? A comparison of unsupervised transfer learning with PCA, UMAP, and VAE on molecular fingerprints. Pharmaceuticals 2021, 14, 758. [Google Scholar] [CrossRef]
- Sheini, A.; Khajehsharifi, H.; Shahbazy, M.; Kompany-Zareh, M. A chemosensor array for the colorimetric identification of some carboxylic acids in human urine samples. Sens. Actuators B Chem. 2017, 242, 288–298. [Google Scholar] [CrossRef]
- Pham, D.T.; Dimov, S.S.; Nguyen, C.D. Selection of K in K-means clustering. J. Mech. Eng. Sci. 2005, 219, 103–119. [Google Scholar] [CrossRef]
- Thordarson, P. Determining association constants from titration experiments in supramolecular chemistry. Chem. Soc. Rev. 2011, 40, 1305–1323. [Google Scholar] [CrossRef]
- Bennett, M.A.; Smith, A.K. Arene ruthenium(II) complexes formed by dehydrogenation of cyclohexadienes with ruthenium(III) trichloride. J. Chem. Soc. Dalton Trans. 1974, 233–241. [Google Scholar] [CrossRef]


| A | B | C | 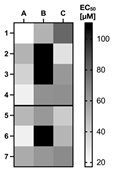 | ||
| analyte | fluorescein⸦MR1 | eosin Y⸦MR1 | erythrosin⸦MR1 | ||
| 1 | D-fructose | 17.2 ± 4.7 μM | 50.9 ± 4.4 μM | 79.7 ± 6.7 μM | |
| 2 | D-glucose | 50.6 ± 2.5 μM | n.d. | 30.6 ± 1.4 μM | |
| 3 | D-galactose | 37.0 ± 4.1 μM | n.d. | 61.4 ± 9.2 μM | |
| 4 | D-ribose | 24.3 ± 2.0 μM | 63.8 ± 4.8 μM | 64.6 ± 4.3 μM | |
| 5 | sodium triphosphate | 48.9 ± 3.8 μM | 61.4 ± 9.3 μM | 40.6 ± 2.2 μM | |
| 6 | D-ribose-5-phosphate | 24.3 ± 2.0 μM | 110.5 ± 7.8 μM | 50.1 ± 5.1 μM | |
| 7 | adenosine triphosphate | 53.9 ± 11.3 μM | 62.1 ± 3.7 μM | 66.4 ± 4.7 μM |
Disclaimer/Publisher’s Note: The statements, opinions and data contained in all publications are solely those of the individual author(s) and contributor(s) and not of MDPI and/or the editor(s). MDPI and/or the editor(s) disclaim responsibility for any injury to people or property resulting from any ideas, methods, instructions or products referred to in the content. |
© 2024 by the authors. Licensee MDPI, Basel, Switzerland. This article is an open access article distributed under the terms and conditions of the Creative Commons Attribution (CC BY) license (https://creativecommons.org/licenses/by/4.0/).
Share and Cite
Maatouk, A.; Rossel, T.; Therrien, B. Allosteric Fluorescent Detection of Saccharides and Biomolecules in Water from a Boronic Acid Functionalized Arene Ruthenium Assembly Hosting Fluorescent Dyes. Inorganics 2025, 13, 1. https://doi.org/10.3390/inorganics13010001
Maatouk A, Rossel T, Therrien B. Allosteric Fluorescent Detection of Saccharides and Biomolecules in Water from a Boronic Acid Functionalized Arene Ruthenium Assembly Hosting Fluorescent Dyes. Inorganics. 2025; 13(1):1. https://doi.org/10.3390/inorganics13010001
Chicago/Turabian StyleMaatouk, Alaa, Thibaud Rossel, and Bruno Therrien. 2025. "Allosteric Fluorescent Detection of Saccharides and Biomolecules in Water from a Boronic Acid Functionalized Arene Ruthenium Assembly Hosting Fluorescent Dyes" Inorganics 13, no. 1: 1. https://doi.org/10.3390/inorganics13010001
APA StyleMaatouk, A., Rossel, T., & Therrien, B. (2025). Allosteric Fluorescent Detection of Saccharides and Biomolecules in Water from a Boronic Acid Functionalized Arene Ruthenium Assembly Hosting Fluorescent Dyes. Inorganics, 13(1), 1. https://doi.org/10.3390/inorganics13010001