Article

Enhanced Removal of Rhodamine b Dye from Aqueous Media via Adsorption on Facilely Synthesized Zinc Ferrite Nanoparticles

by
Asma S. Al-Wasidi
1,* and
Salwa AlReshaidan
2
1
Department of Chemistry, College of Science, Princess Nourah bint Abdulrahman University, Riyadh 11671, Saudi Arabia
2
Department of Chemistry, Faculty of Science, King Saud University, Riyadh 11451, Saudi Arabia
*
Author to whom correspondence should be addressed.
Inorganics 2024, 12(7), 191; https://doi.org/10.3390/inorganics12070191
Submission received: 14 June 2024 / Revised: 9 July 2024 / Accepted: 9 July 2024 / Published: 12 July 2024

Abstract

:
This paper studies the synthesis, characterization, and application of ZnFe2O4 nanoparticles for the removal of rhodamine b dye from aqueous media. Utilizing the combustion procedure, ZnFe2O4 nanoparticles were synthesized using two different fuels: glutamine (SG) and L-arginine (SA). In addition, the synthesized ZnFe2O4 nanoparticles were characterized through various techniques, including Fourier transform infrared (FTIR), X-ray diffraction (XRD), field emission scanning electron microscope (FE-SEM), energy-dispersive X-ray (EDX), high resolution transmission electron microscope (HR-TEM), and Brunauer-Emmett-Teller (BET) surface area analysis. XRD analysis verified the creation of a ZnFe2O4 cubic spinel structure without any contaminants, revealing average crystallite sizes of 43.72 and 29.38 nm for the SG and SA samples, respectively. The FTIR spectra exhibited peaks indicative of metal-oxygen bond stretching, verifying the presence of a spinel formation. Elemental analysis via EDX confirmed the stoichiometric composition typical of zinc ferrite. In addition, FE-SEM imaging displayed that the SG and SA samples are composed of particles with irregular and spherical shapes, measuring average diameters of 135.11 and 59.89 nm, respectively. Furthermore, the BET surface area of the SG and SA samples is 60 and 85 m2/g, respectively. The maximum adsorption capacity of the SA sample (409.84 mg/g) towards rhodamine b dye was higher than that of the SG sample (279.33 mg/g), which was ascribed to its larger surface area and porosity. Kinetic and equilibrium studies revealed that the adsorption process of rhodamine b dye onto the SG and SA samples followed the Langmuir isotherm and pseudo-second-order model. Thermodynamic analysis indicated that the adsorption process was spontaneous, exothermic, and physical. The study concludes that ZnFe2O4 nanoparticles synthesized using L-arginine (SA) exhibit enhanced rhodamine b dye removal efficiency due to their smaller size, increased surface area, and higher porosity compared to those synthesized with glutamine (SG). The optimum conditions for the adsorption process of rhodamine b dye were found to be at pH 10, a contact time of 70 min, and a temperature of 298 K. These findings underscore the potential of L-arginine-synthesized ZnFe2O4 nanoparticles for effective and sustainable environmental cleanup applications.

Graphical Abstract

1. Introduction

Water pollution by organic dyes is a pressing global environmental issue. The discharge of colored wastewater from industries such as textiles, leather, paper, and plastics has been identified as a major source of visual pollution and ecological damage [1,2,3,4]. These organic dyes, characterized by their complex structures and synthetic origins, pose a significant threat not only due to their persistence in water bodies but also because of their toxic, carcinogenic, and mutagenic effects on aquatic life and human health. The introduction of these pollutants into the aquatic ecosystem disrupts the photosynthetic processes in aquatic plants and poses serious risks to aquatic organisms as well as, indirectly, to humans through the food chain [5,6,7]. Rhodamine b, a synthetic dye known for its vivid pink coloration, exemplifies the environmental and health hazards posed by organic dyes. Various industries extensively use it due to its bright color and staining properties. Also, rhodamine b dye is highly soluble in water and difficult to degrade, leading to its accumulation in aquatic environments. Its presence in water sources has been linked to severe environmental harm and health risks, including potential carcinogenic effects and harm to the reproductive system in humans, highlighting the urgent need for effective removal methods [8,9]. Addressing the contamination of water bodies with organic dyes is crucial for environmental conservation and public health protection. The persistence and toxicity of these dyes necessitate the development of efficient, cost-effective, and environmentally friendly treatment methods. The challenge is not only to remove these dyes from wastewater, but also to do so in a way that does not introduce additional pollutants or consume excessive resources. Various methods have been explored for the elimination of organic dyes from aqueous media, such as biological treatment, advanced oxidation, coagulation, electrochemical, and adsorption [10,11,12,13,14,15]. Advanced oxidation processes are highly effective, but they often require substantial energy input and can generate secondary pollutants. The effectiveness of biological treatments, such as the use of bacteria and fungi in the biodegradation of dyes, is sustainable but can be slow and less effective for the complete mineralization of complex dyes like rhodamine b. Coagulation processes typically generate a substantial amount of chemical sludge, which requires proper disposal. The handling and disposal of this sludge can be costly and pose environmental hazards if not managed correctly. Electrochemical methods often require a significant amount of electrical energy, which can make them costly to operate, particularly on a large scale. The electrodes used in electrochemical treatments can degrade over time due to the harsh operational conditions, including the presence of corrosive substances. Replacing electrodes can be expensive and may affect the overall sustainability of the process. Among these, adsorption has emerged as a superior method due to its effectiveness, efficiency, and the feasibility of using a wide range of adsorbents. The adsorption process, which involves the adhesion of dye molecules onto the adsorbent surface, offers advantages such as low operational costs, no secondary pollution, and the potential for adsorbent regeneration and reuse [16,17,18,19,20]. There are a lot of adsorbents for removing rhodamine b dye from aqueous media, such as biochar [21], zeolite [22], kaolinite [23], magnetic montmorillonite composite [24], duolite C-20 resin [25], and SnS2 [26]. These adsorbents have specific limitations, including reduced adsorption capacities, complex preparation methods, and high costs. Recent advancements in nanotechnology have introduced nanomaterials as highly efficient adsorbents for the removal of organic dyes. Their high surface area, tunable surface properties, and capacity for surface modification make nanomaterials ideal for targeting and removing specific dyes from wastewater. Recent studies have highlighted the success of various nanomaterials in adsorbing organic dyes, though challenges such as cost-effectiveness, scalability of production, and environmental impact of nanomaterial disposal remain areas of ongoing research [27,28,29,30]. The combustion method, a synthesis technique for producing nanomaterials, stands out for its efficiency, cost-effectiveness, and simplicity. It grants the rapid production of a wide range of nanomaterials with controlled sizes and morphologies, making it particularly advantageous for creating nanomaterials for environmental applications [31]. Dehghan et al. synthesized carbon nanotubes modified with ZnFe2O4 nanoparticles via the hydrothermal method for the adsorption of malachite green dye, where the maximum adsorption capacity was 116.2 mg/g [32]. Also, Nguyen et al. synthesized ZnFe2O4 nanoparticles using the solvent extraction method for the adsorption of malachite green dye, where the maximum adsorption capacity was 120 mg/g [33]. However, the high costs associated with manufacturing these nanomaterials and their limited adsorption capabilities have been barriers to the success of previous approaches. This research introduces, for the first time, zinc ferrite (ZnFe2O4) nanoparticles synthesized via the combustion method using L-arginine and glutamine as fuels. This novel synthesis approach not only simplifies the production process but also enhances the adsorption properties of the nanoparticles, making them exceptionally efficient for removing rhodamine b dye from aqueous solutions because of their small size and large surface area. The nanoparticles demonstrate superior performance in terms of adsorption efficiency, operational costs, and environmental impact compared to traditional adsorbents. Furthermore, the synthesized ZnFe2O4 nanoparticles exhibit excellent reusability and maintain high efficiency over multiple cycles, addressing a critical gap in sustainable dye removal technologies. This breakthrough is particularly crucial due to the persistent and toxic nature of organic dyes like rhodamine b. Our approach not only offers a robust solution to this environmental challenge but also contributes to the broader field of environmental conservation by providing a scalable, cost-effective, and environmentally friendly alternative to existing dye removal methods.

2. Results and Discussion

2.1. Synthesis and Characterization of ZnFe2O4 Nanoparticles

In Scheme 1, the synthesis of zinc ferrite (ZnFe2O4) nanoparticles is accomplished via a combustion method, showcasing two distinct stoichiometric reactions. Initially, iron(III) nitrate nonahydrate and zinc(II) nitrate hexahydrate act as oxidizers, while glutamine serves as a fuel in Scheme 1A, and L-arginine assumes the role of fuel in Scheme 1B. The combustion process facilitates the rapid formation of zinc ferrite nanoparticles, as indicated by the release of nitrogen gas, carbon dioxide, and water vapor as by-products. The ZnFe2O4 nanoparticles, which are synthesized using L-arginine and glutamine fuels, are abbreviated as SA and SG, respectively.
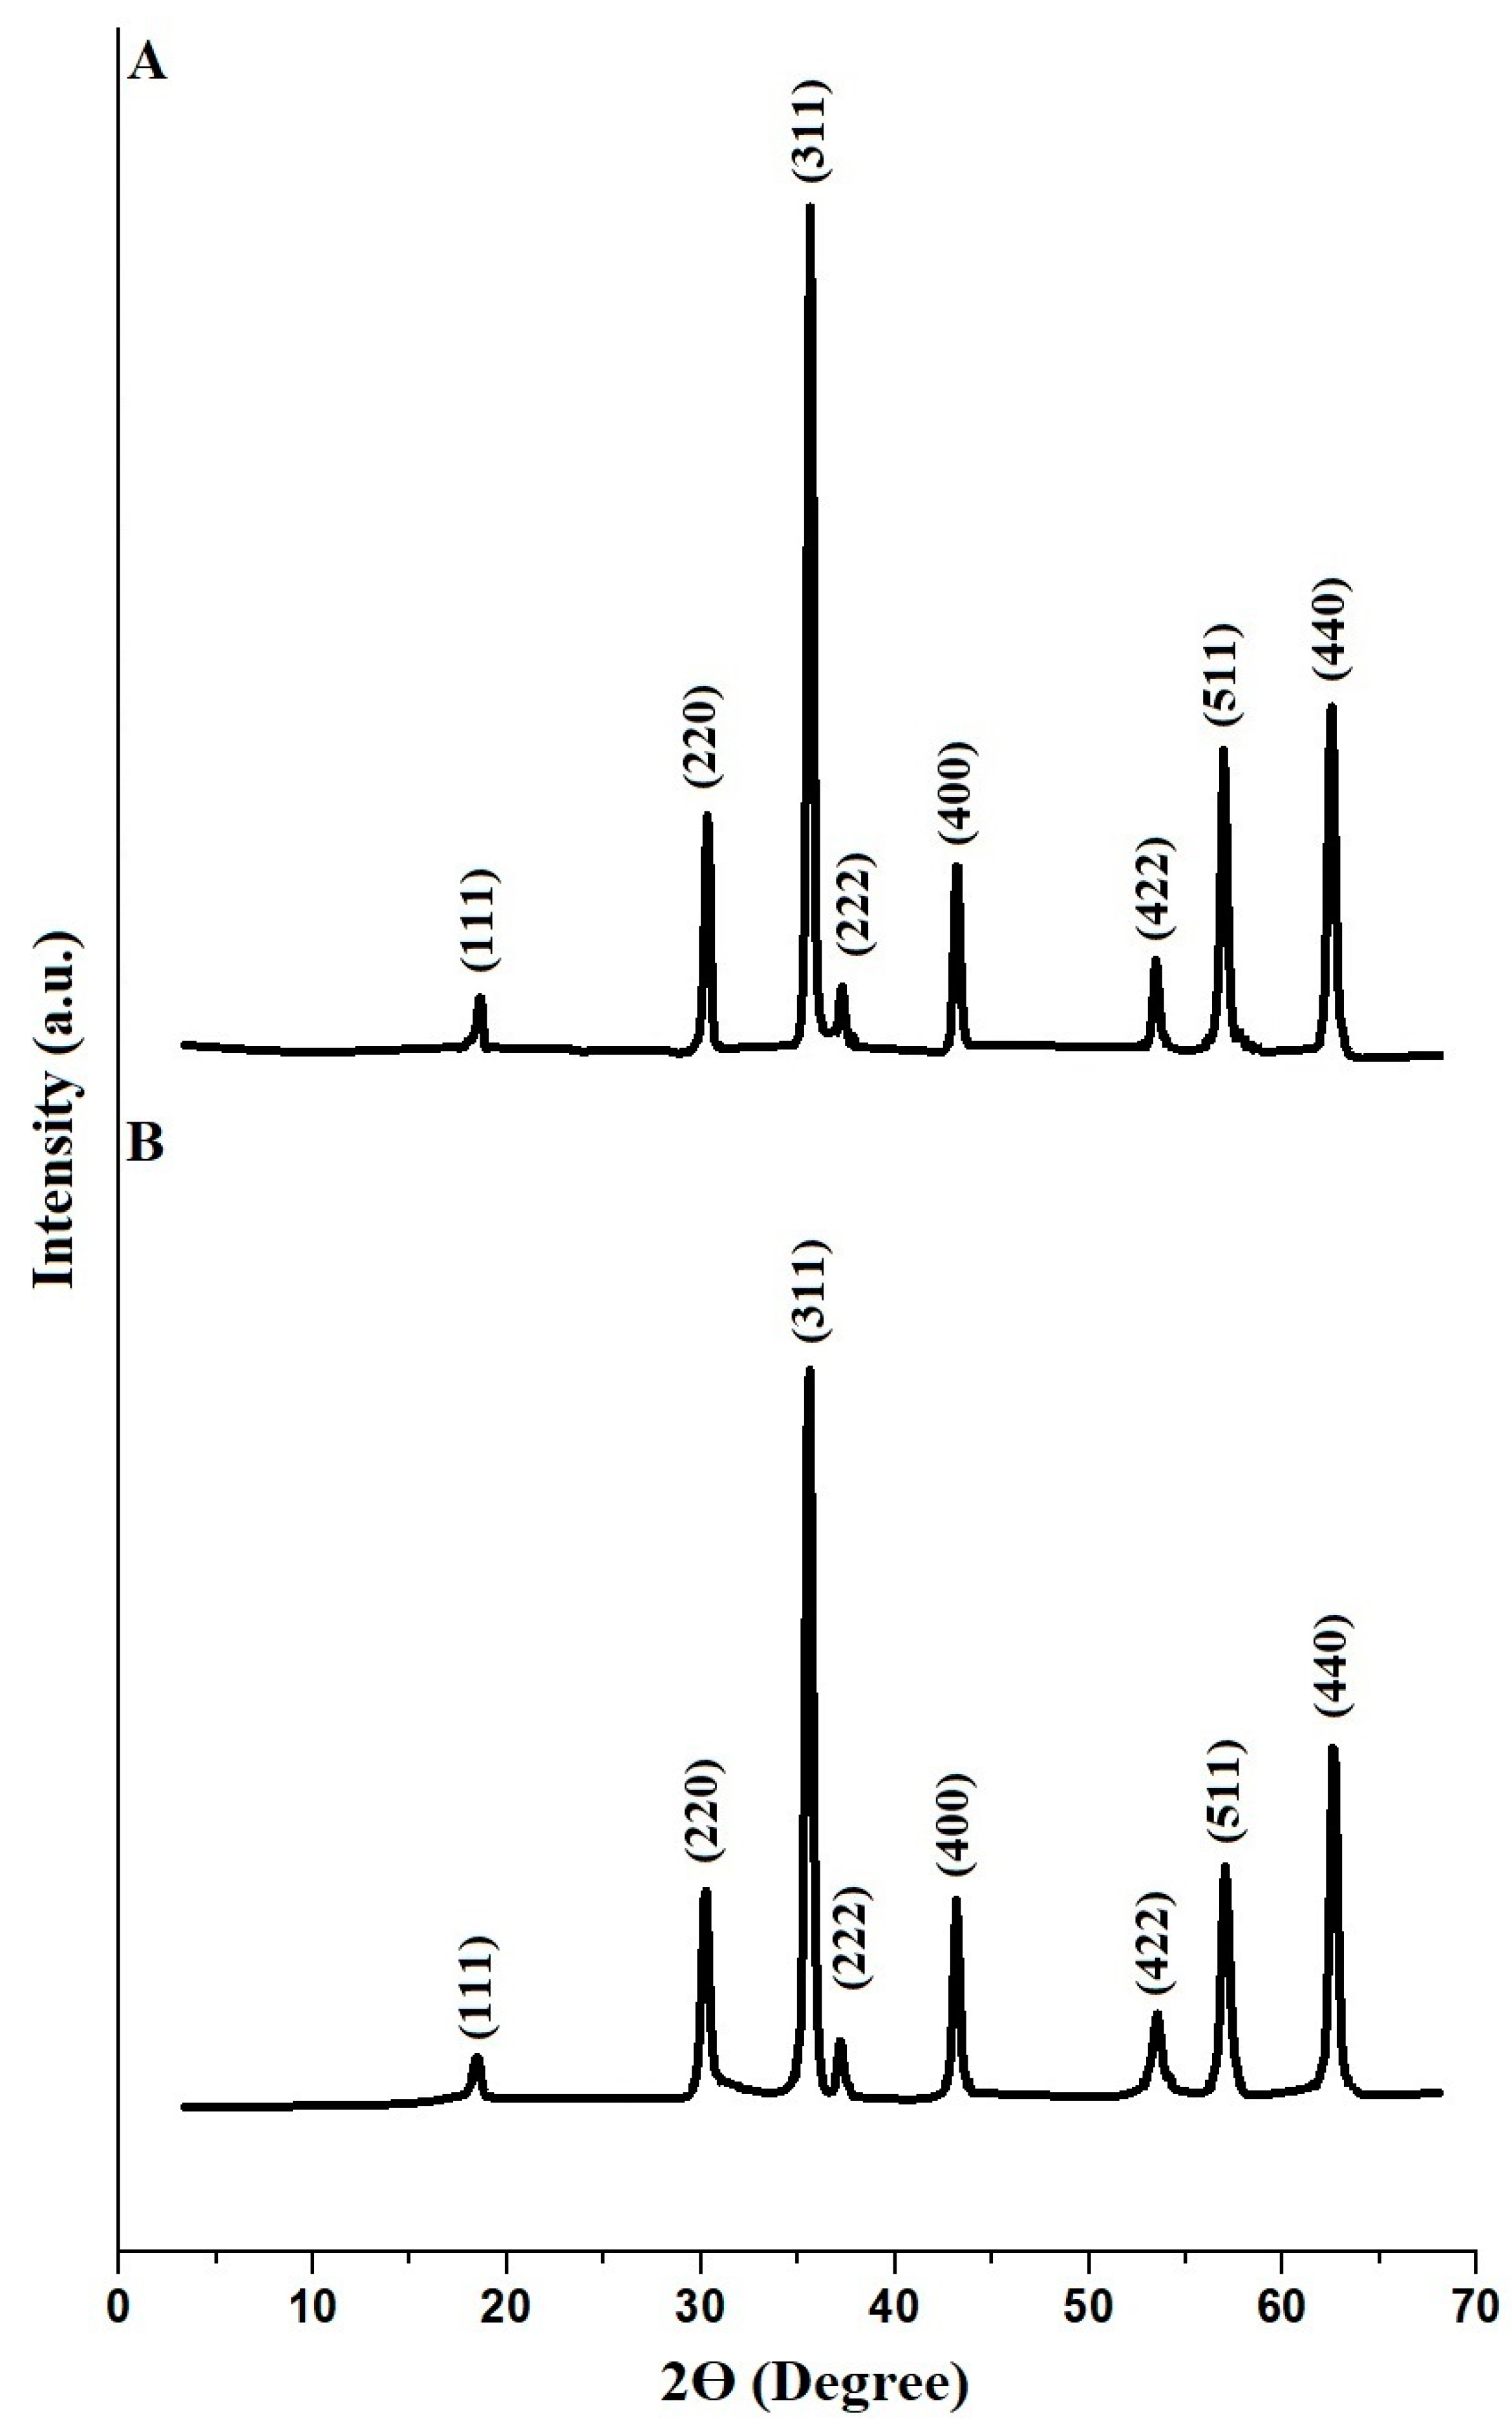
Figure 1A,B presents the XRD patterns for SG and SA products, displaying distinctive diffraction peaks that are in alignment with the spinel configuration of zinc ferrite (ZnFe2O4). These patterns have been identified with the cubic spinel structure and exhibit no discernible traces of secondary phases, confirming the synthesized materials’ high degree of purity. Diffraction peaks that are located at 2Ɵ of 62.53°, 56.93°, 53.53°, 43.16°, 37.19°, 35.62°, 30.29°, and 18.54° correspond to the lattice planes (440), (511), (422), (400), (222), (311), (220), and (111), respectively. This alignment is in agreement with the established JCPDS card no. 22-1012 for ZnFe2O4 [34]. The mean size of the SG and SA samples, as calculated using the Scherrer formula [35], equals 43.72 nm and 29.38 nm, respectively. The mean crystallite size of the SG product is greater than that of the SA product. The average crystallite size of ZnFe2O4 nanoparticles can be influenced by the type of fuel used in the combustion method. The combustion of glutamine releases more energy compared to L-arginine. This greater energy release during the synthesis of ZnFe2O4 nanoparticles using glutamine (the SG product) could result in higher temperatures, which in turn may lead to the formation of larger ZnFe2O4 nanoparticles.
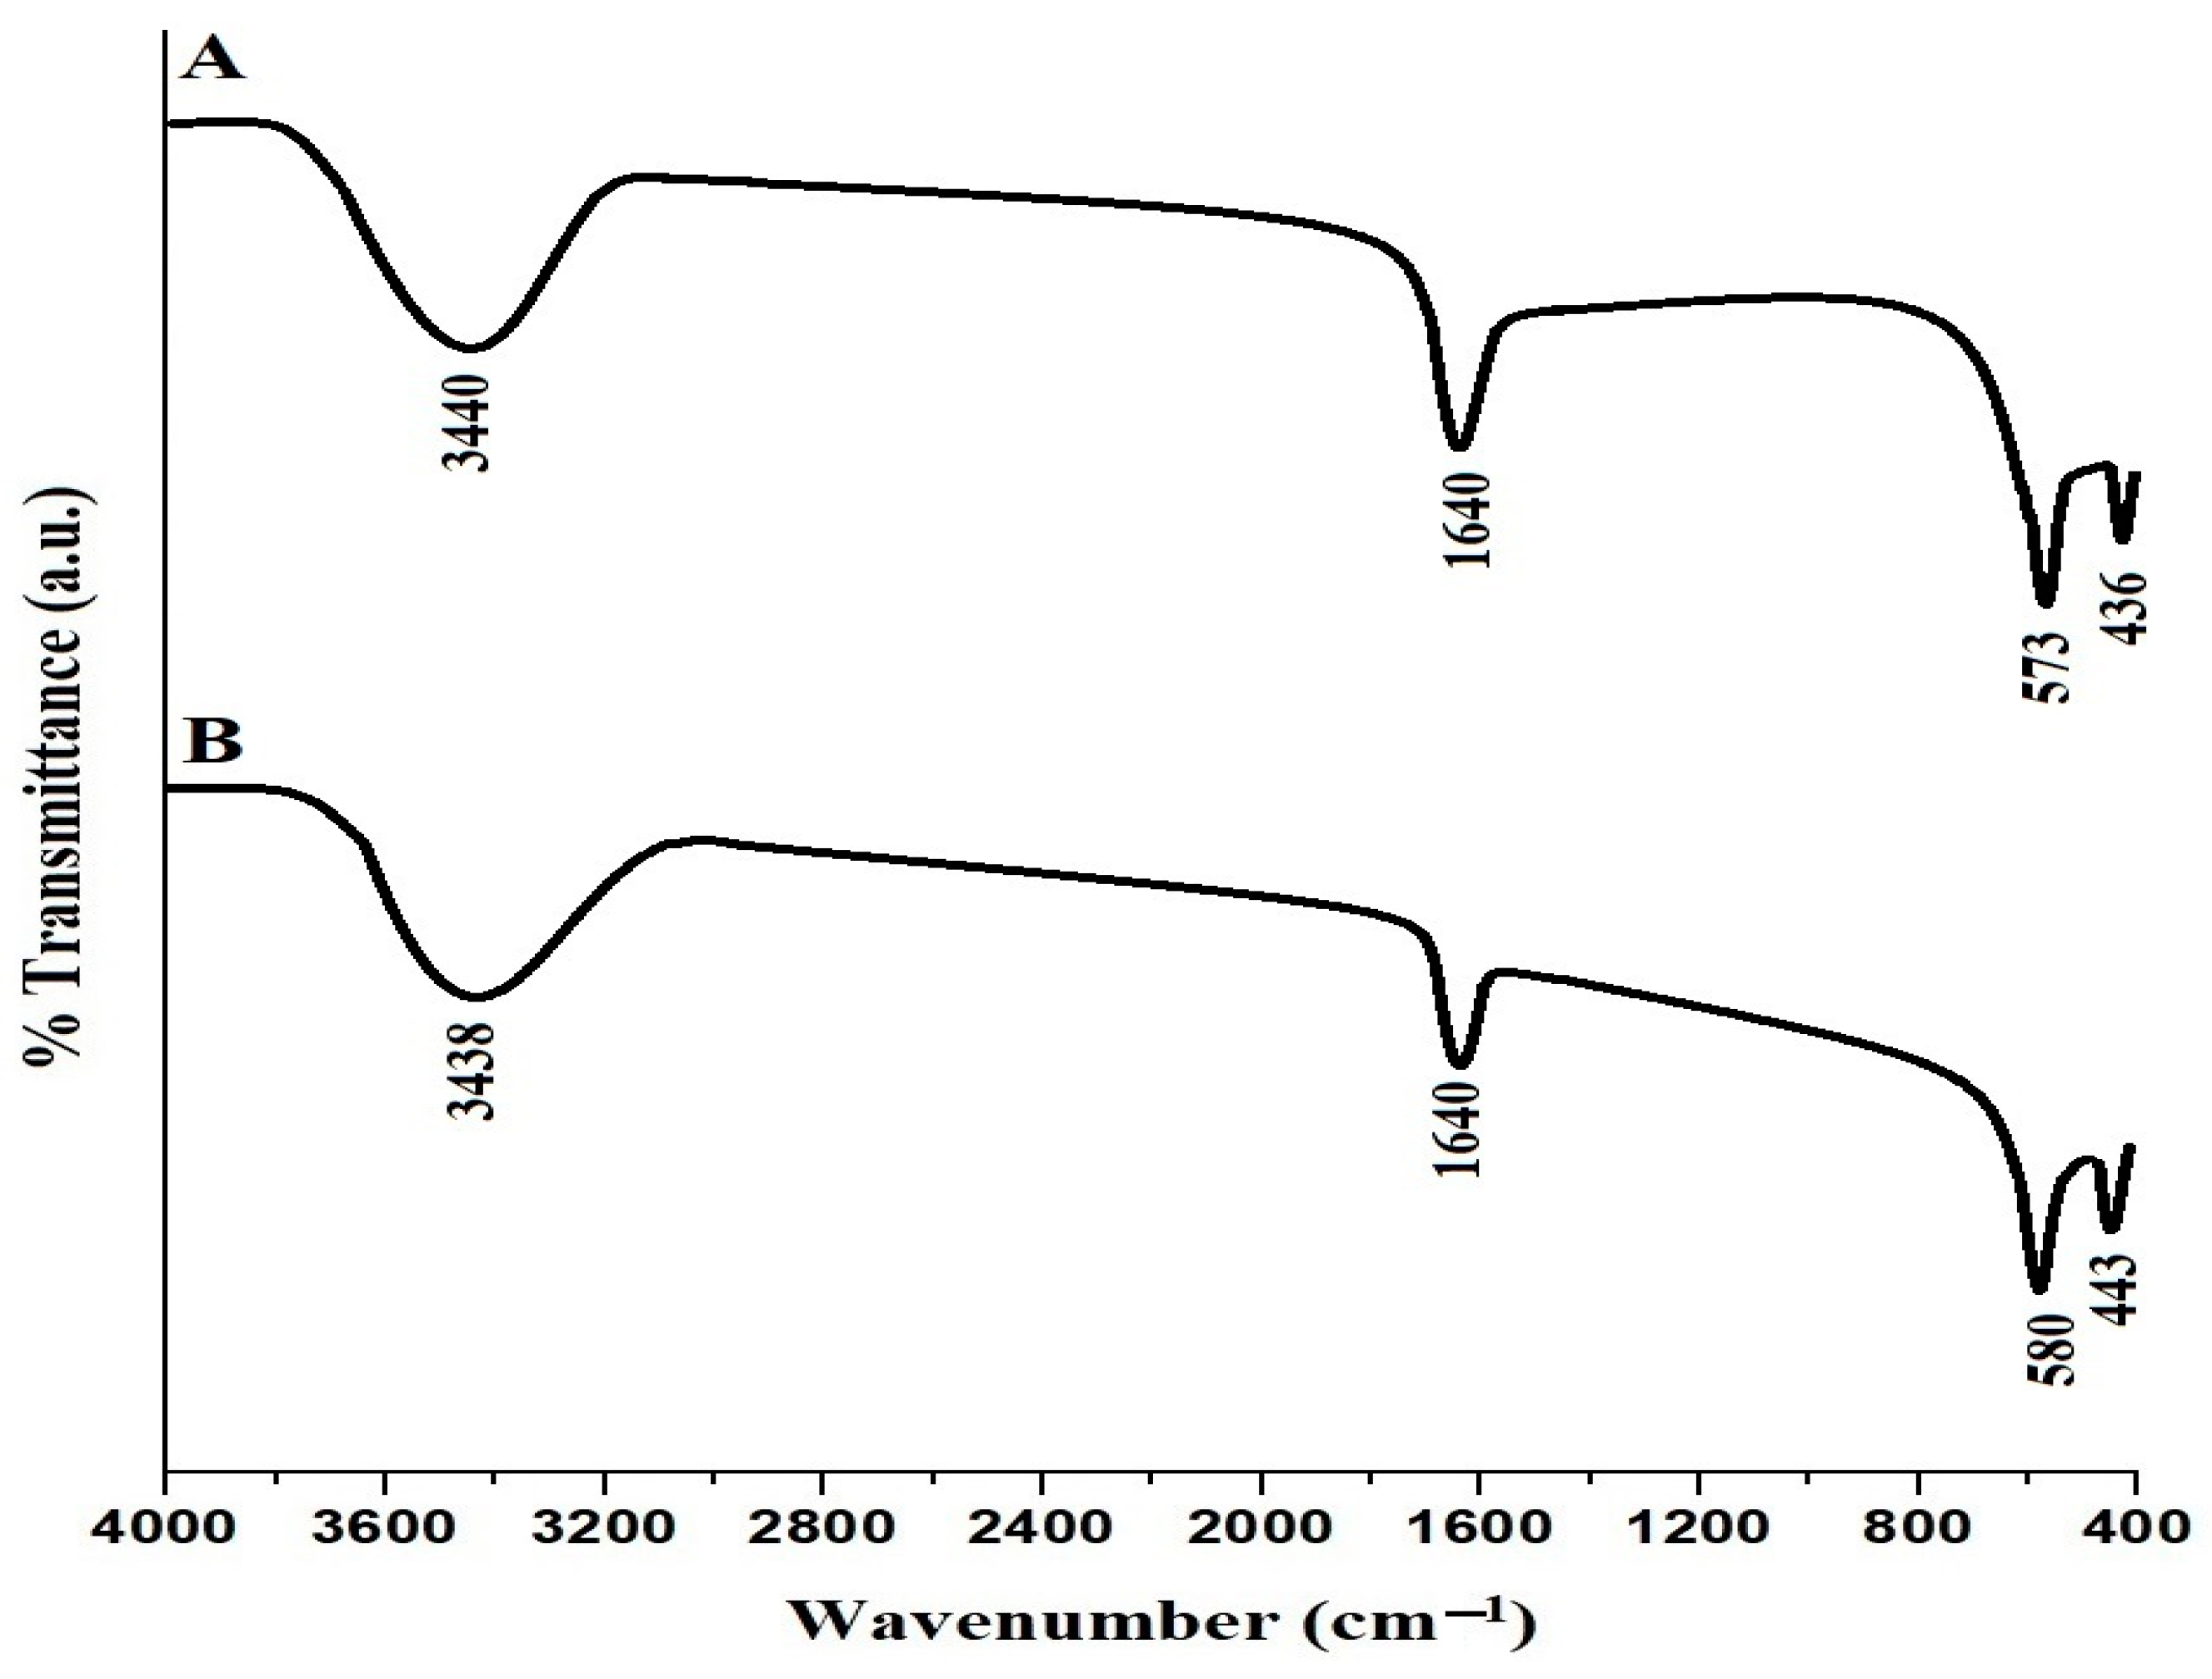
The FTIR analysis of the SG and SA ZnFe2O4 nanoparticles is clarified in Figure 2A,B, respectively. The presence of broad absorption peaks at 3440 cm−1 for SG and 3438 cm−1 for SA is generally linked to the stretching vibrations of O-H, suggesting hydroxyl groups on the nanoparticles’ surface or the adsorption of water molecules. Furthermore, the peaks at 1640 cm−1 in both SG and SA samples are commonly associated with O-H bending vibrations, which also point to hydroxyl groups on the nanoparticles’ surface or the adsorption of water molecules. Each set of samples displays two prominent peaks, located at 573 and 436 cm−1 for the SG, and 580 and 443 cm−1 for the SA, respectively. These bands are emblematic of the metal-oxygen stretch vibrations located within the tetrahedral (Zn-O) and octahedral (Fe-O) sites [36].
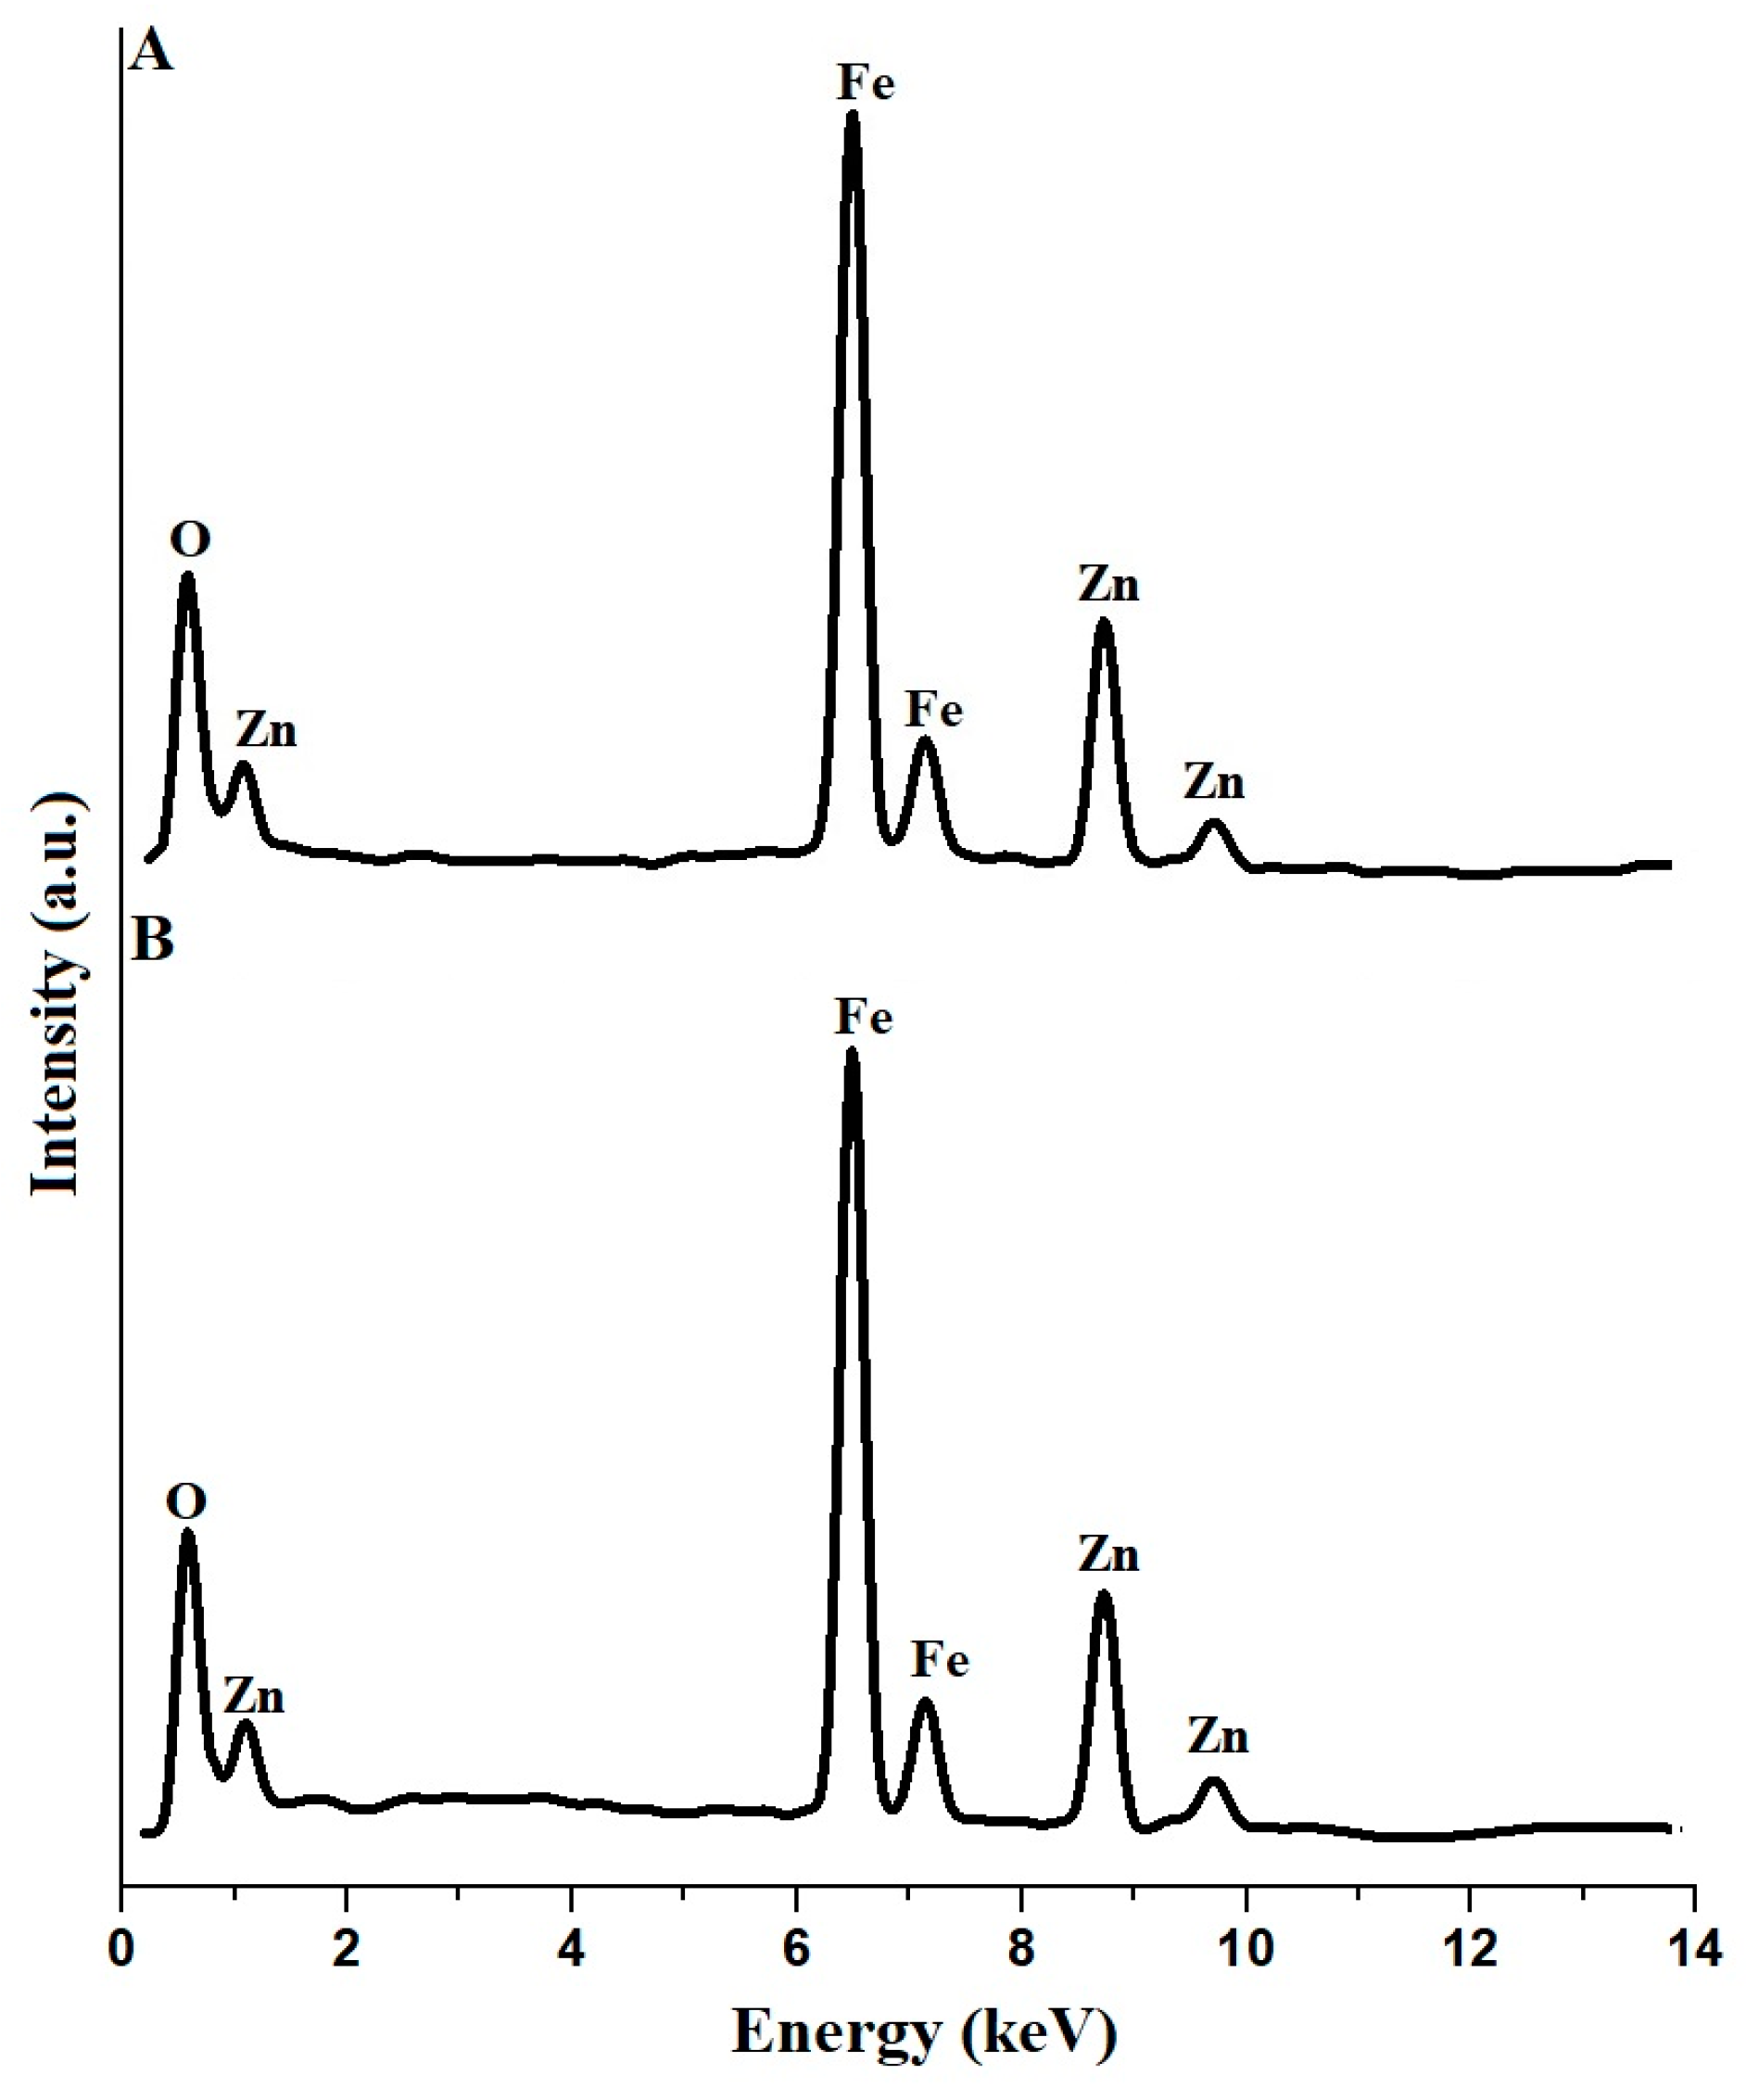
The EDX analyses of the SG and SA samples yield critical compositional insights into the ZnFe2O4 nanoparticles created with glutamine and L-arginine as fuels, as depicted in Figure 3A,B, respectively. The fundamental elements, oxygen (O), iron (Fe), and zinc (Zn) are present in both samples of ZnFe2O4. For the SG sample, the elemental composition by weight percentage is detailed as O: 25.34%, Fe: 46.23%, and Zn: 28.43%. In a parallel vein, the SA sample presents percentages of O: 25.54%, Fe: 46.48%, and Zn: 27.98%. These spectral data indicate that the proportions of O, Fe, and Zn align well with the chemical structure of zinc ferrite, nominally represented by the ratio Zn:Fe:O (1:2:4).
The FE-SEM images reveal the shape and size of the SG and SA samples, as shown in Figure 4A,B, respectively. Utilization of glutamine as a fuel yields irregular and spherical particles, boasting an average size of 135.11 nm, as observed in the SG sample. Conversely, employing L-arginine as a fuel generates particles that are also irregular and spherical but are notably smaller, with a mean size of 59.89 nm, as demonstrated in the SA sample. The discrepancy in particle size measurements obtained from SEM compared to XRD can arise due to several reasons, reflecting the fundamental differences in what these techniques measure and how they operate. SEM measures the physical size of particles, which can include aggregates or clusters of primary particles. XRD estimates the size of crystalline domains within the particles, often corresponding to individual or smaller groups of crystalline structures. Thus, SEM might show larger sizes due to particle aggregation that XRD does not detect.
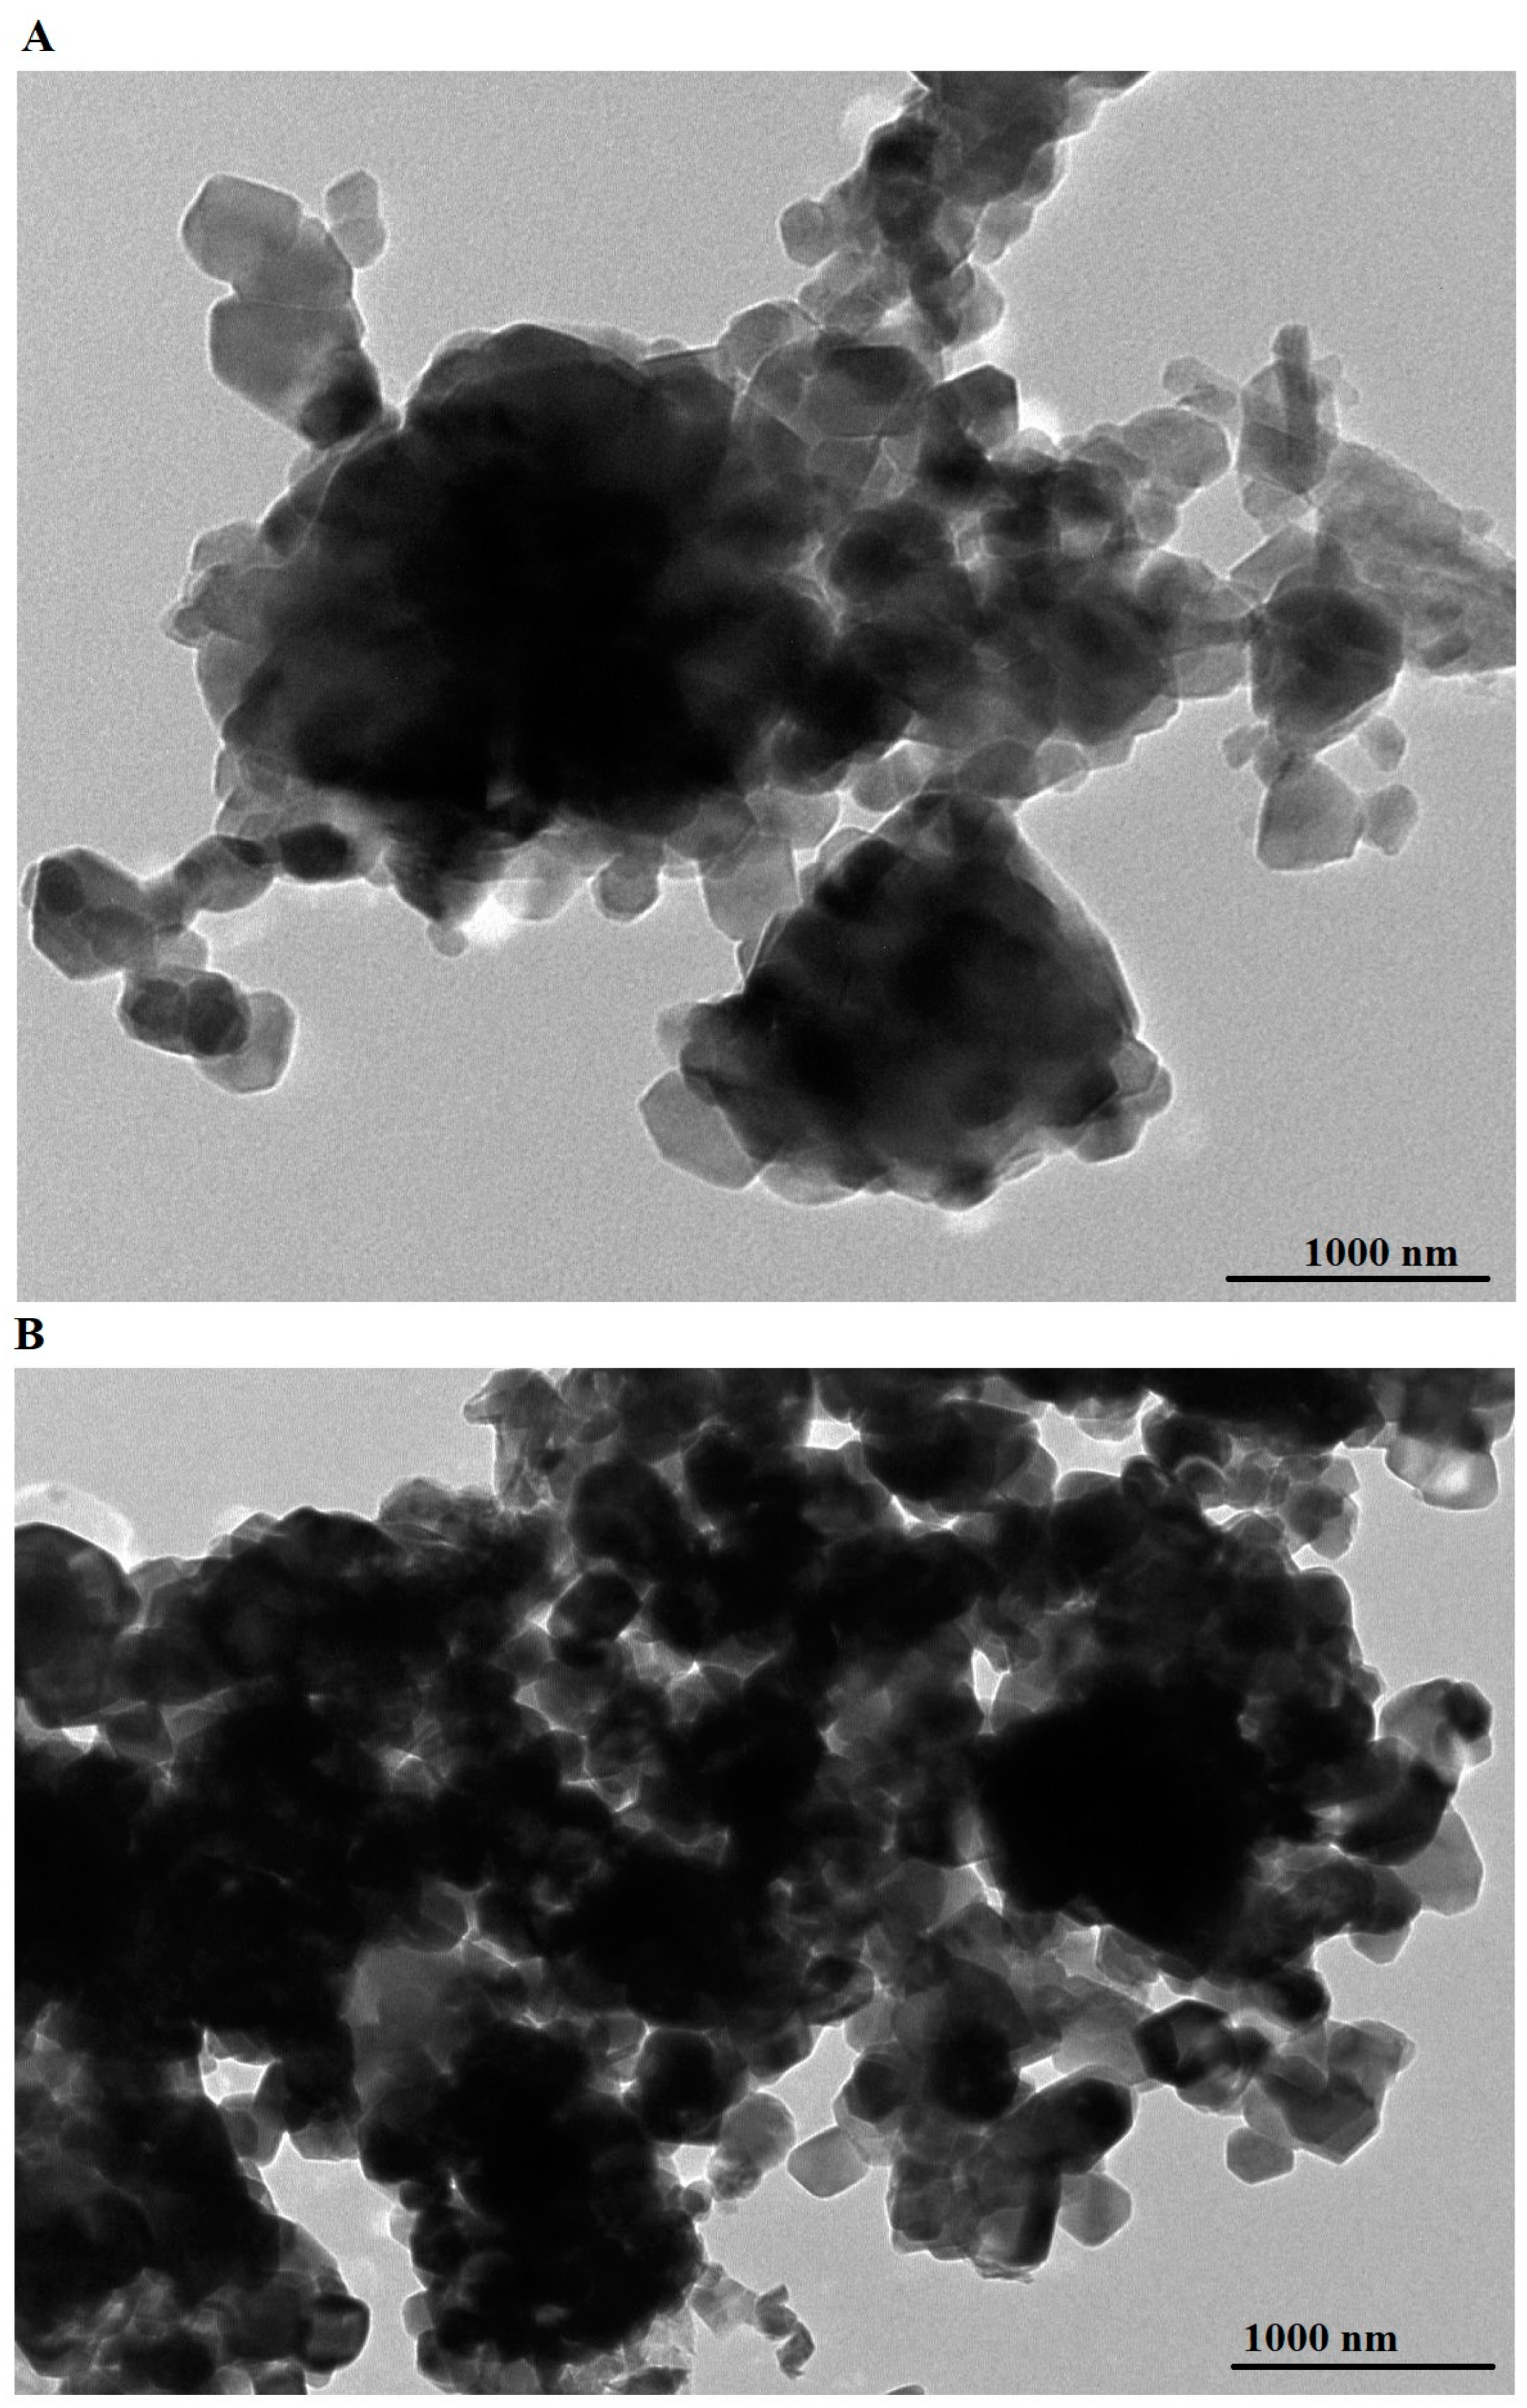
In the presented HR-TEM images (Figure 5), a discernible difference in particle size of irregular shapes between the SG (Figure 5A) and SA (Figure 5B) synthesized products is evident. The average particle size was determined to be approximately 300.02 nm for SG and 231.27 nm for SA. It is surmised that the larger particle sizes observed for both samples compared to XRD may be attributed to the coalescence of primary particles. Such coalescence leads to an aggregation of nanocrystals, forming larger secondary particles that are observable in the HR-TEM images.
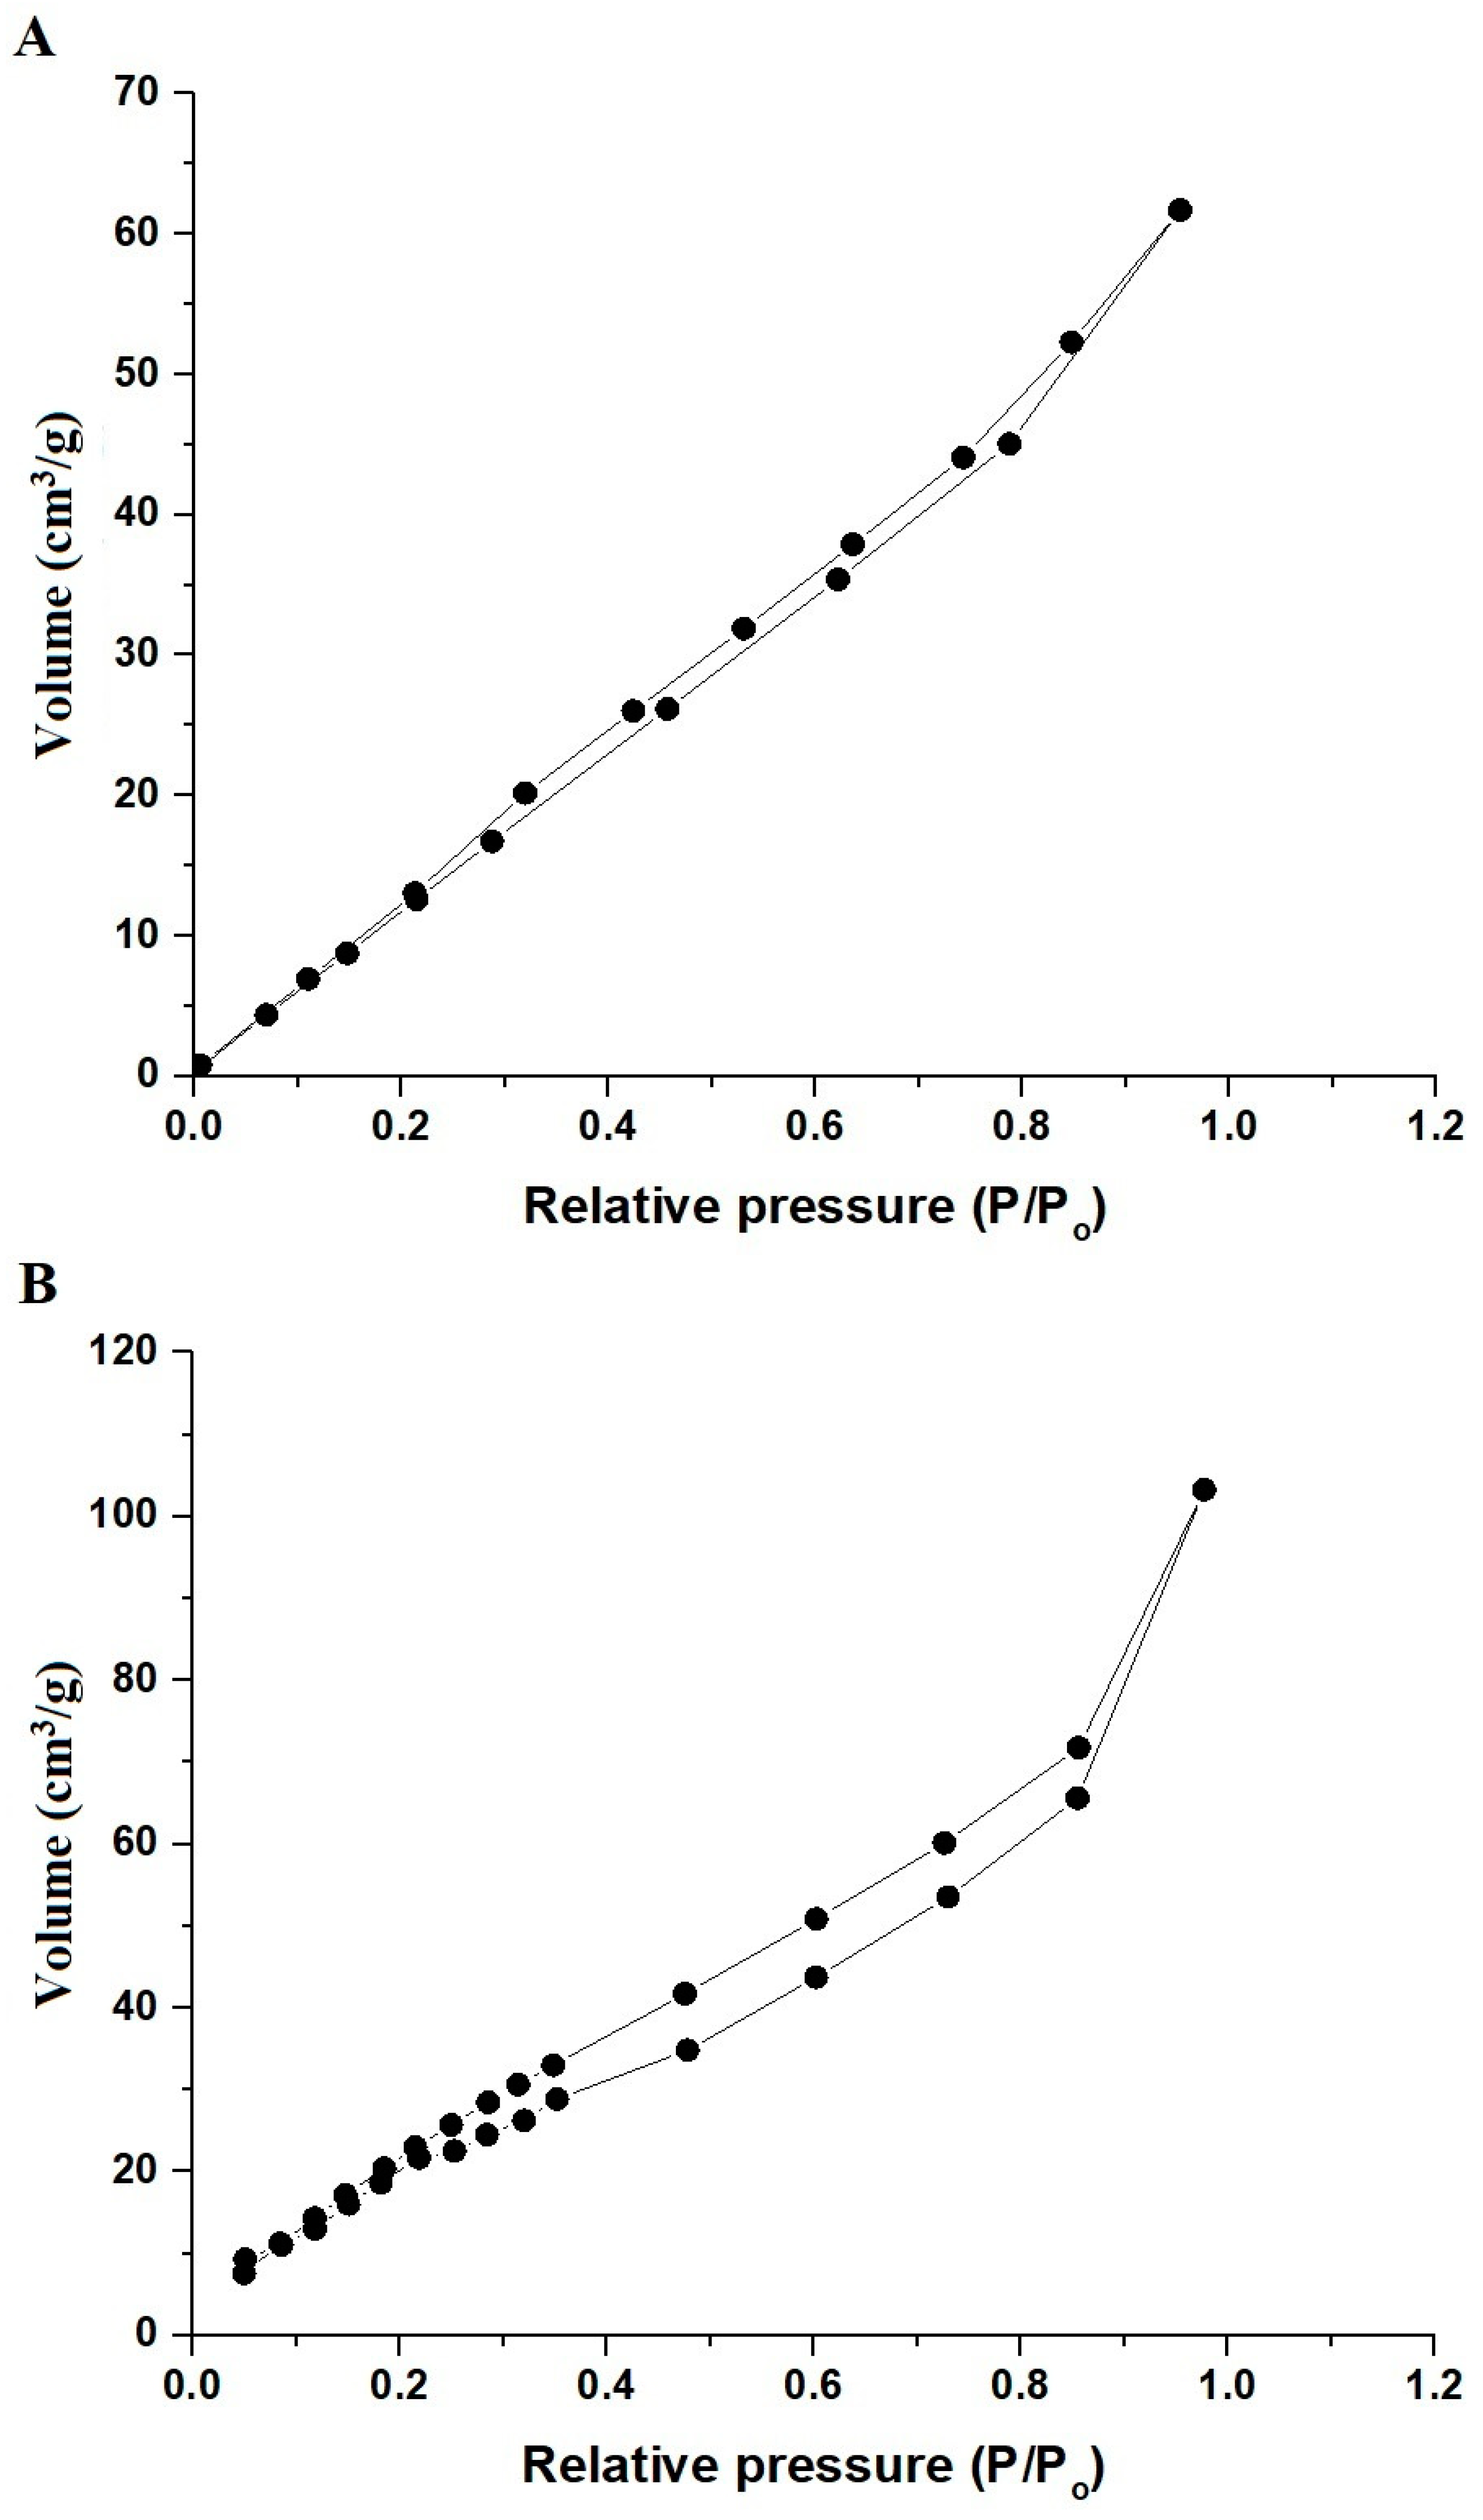
The nitrogen adsorption-desorption isotherms presented in Figure 6A,B, along with the data on surface texture provided in Table 1 for the SG and SA samples, suggest the mesoporous nature of samples and Type IV of isotherms [37]. The SA sample exhibits a markedly larger Brunauer-Emmett-Teller (BET) surface area and a greater total pore volume compared to the SG sample. These variances are attributable to the effect of the chosen fuel on the process of particle development and their aggregation. The combustion of glutamine generates higher temperatures, leading to more pronounced sintering effects. This process potentially results in the collapse of pores or an increase in particle size, consequently diminishing the porosity and surface area, as evidenced in the SG sample.

2.2. Removal of Rhodamine b Dye from Aqueous Media

2.2.1. Influence of pH

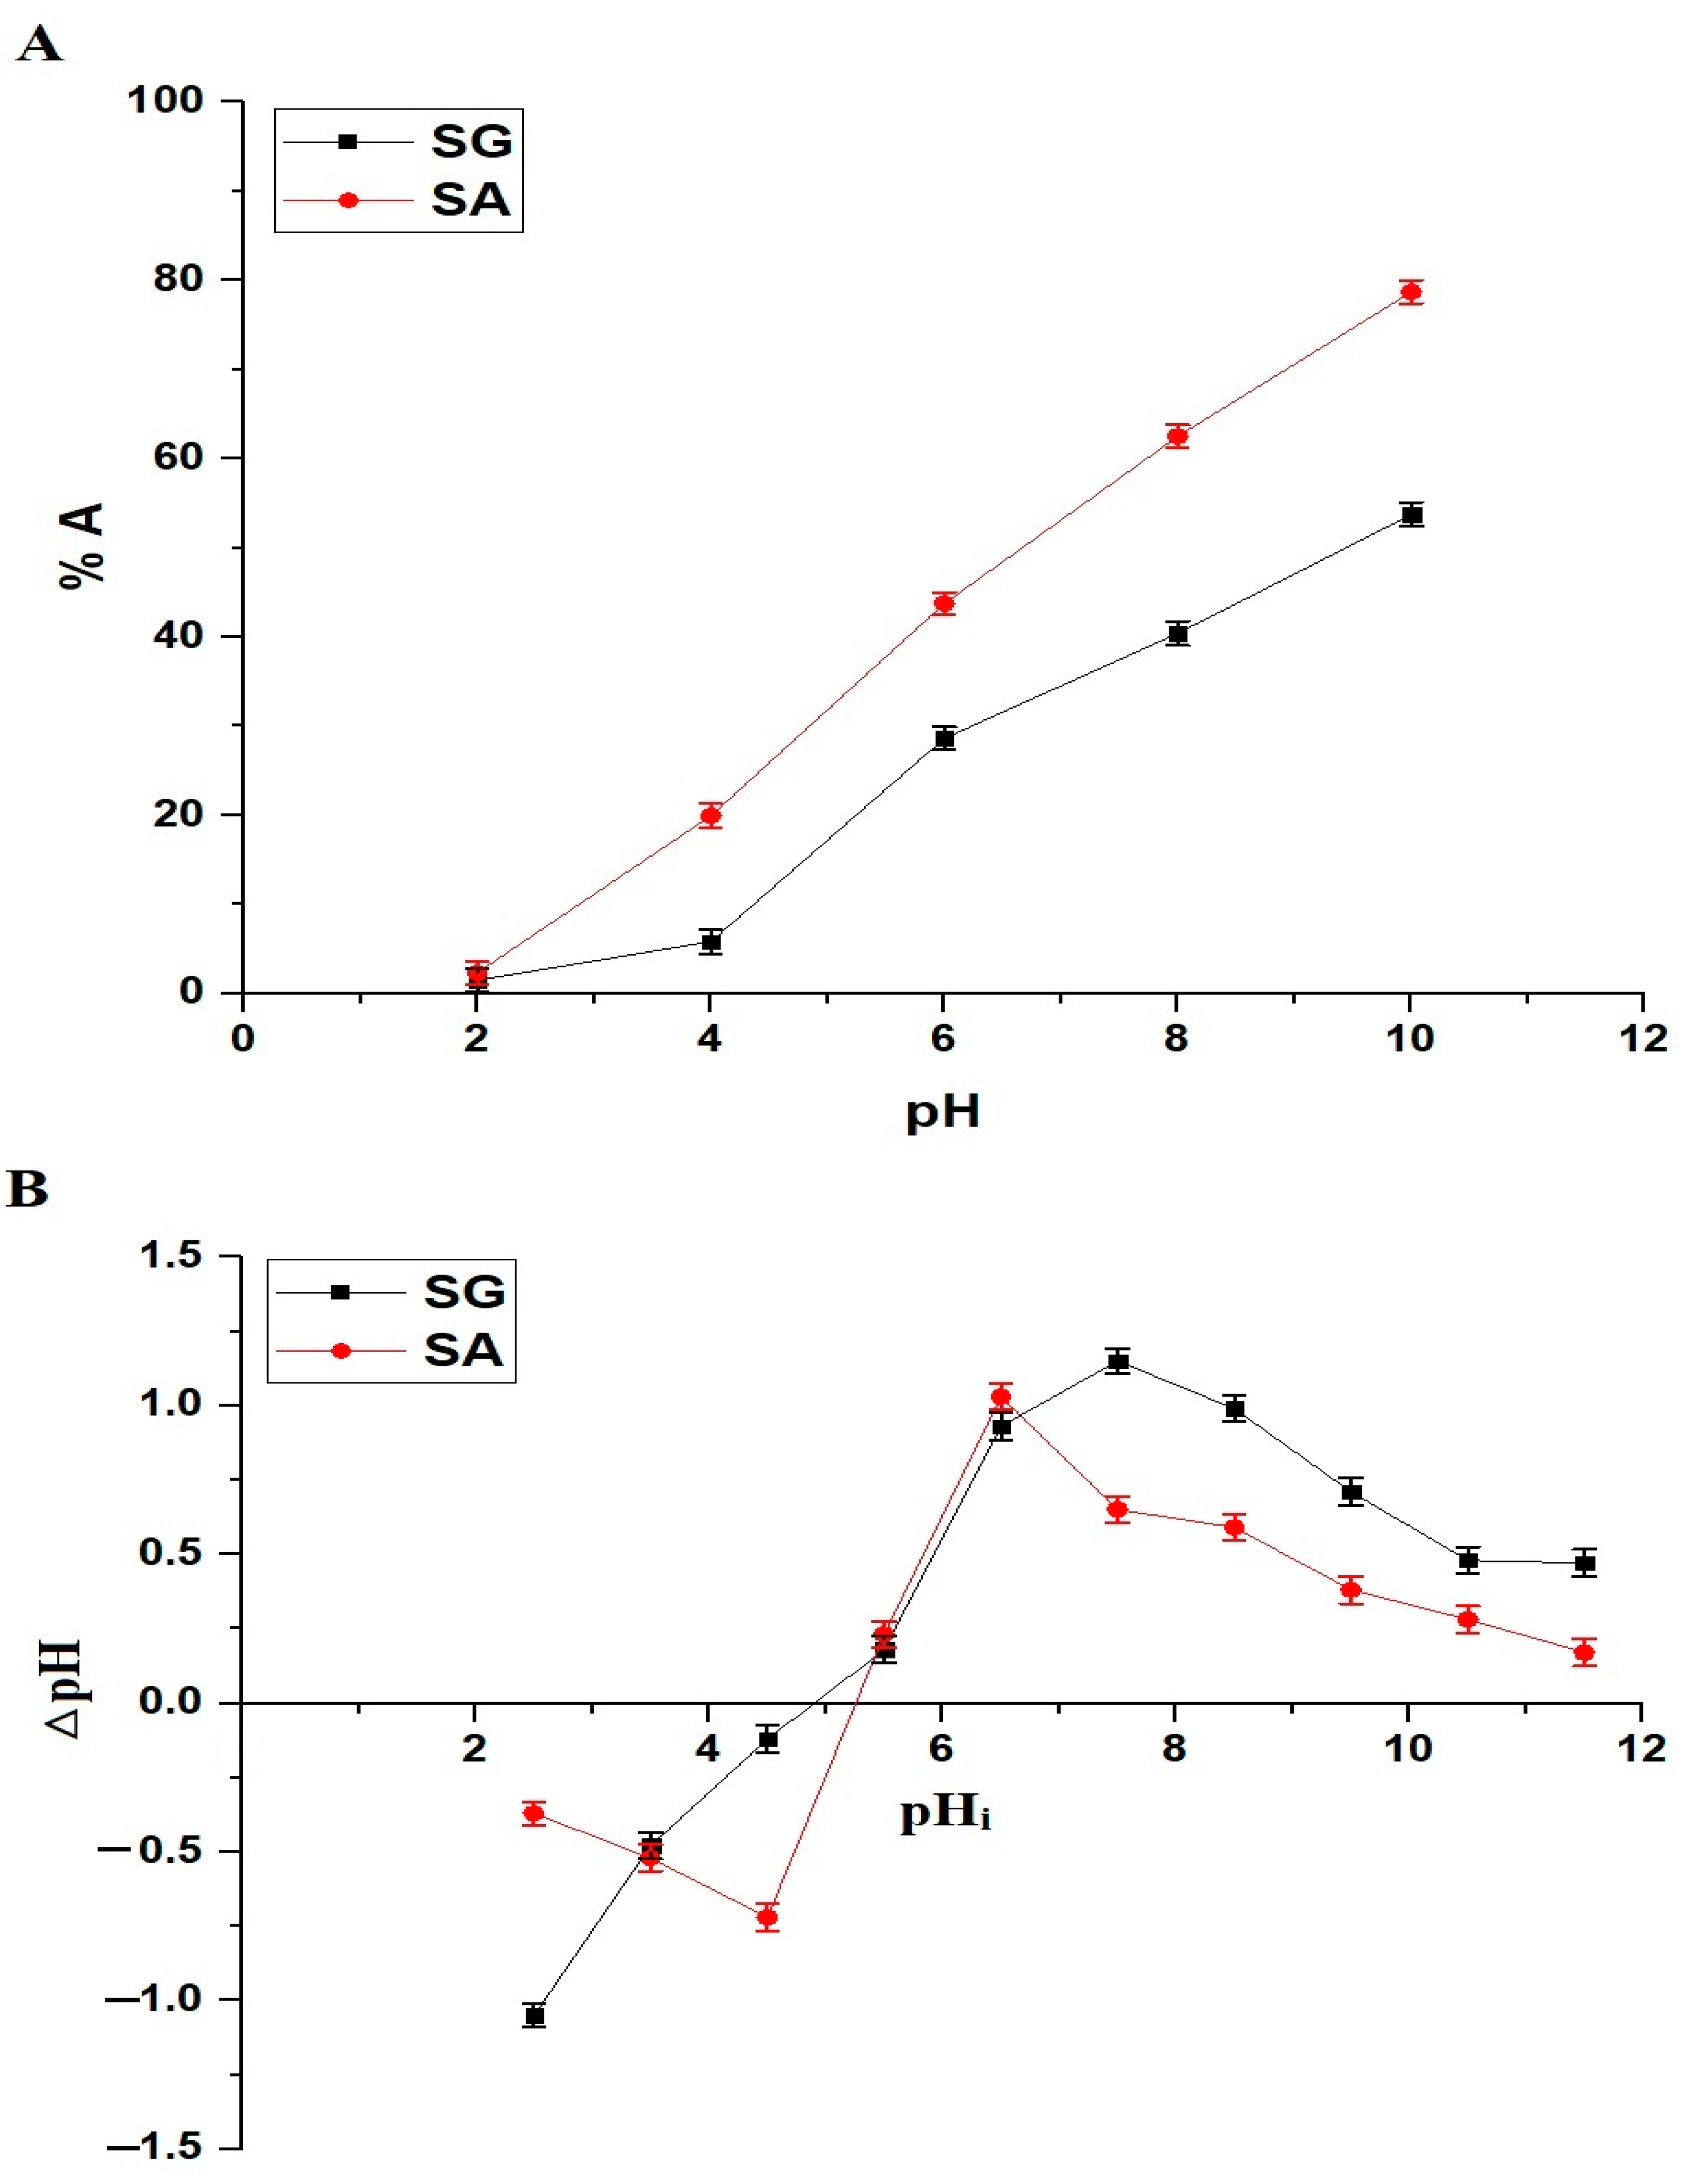
Figure 7A illustrates the dependency of rhodamine b dye’s adsorption effectiveness on the pH when applied to the SG and SA samples, revealing an increase in adsorption as the pH rises for both. This trend can be linked to the surface charge characteristics of the SG and SA samples and the dye’s cationic nature.
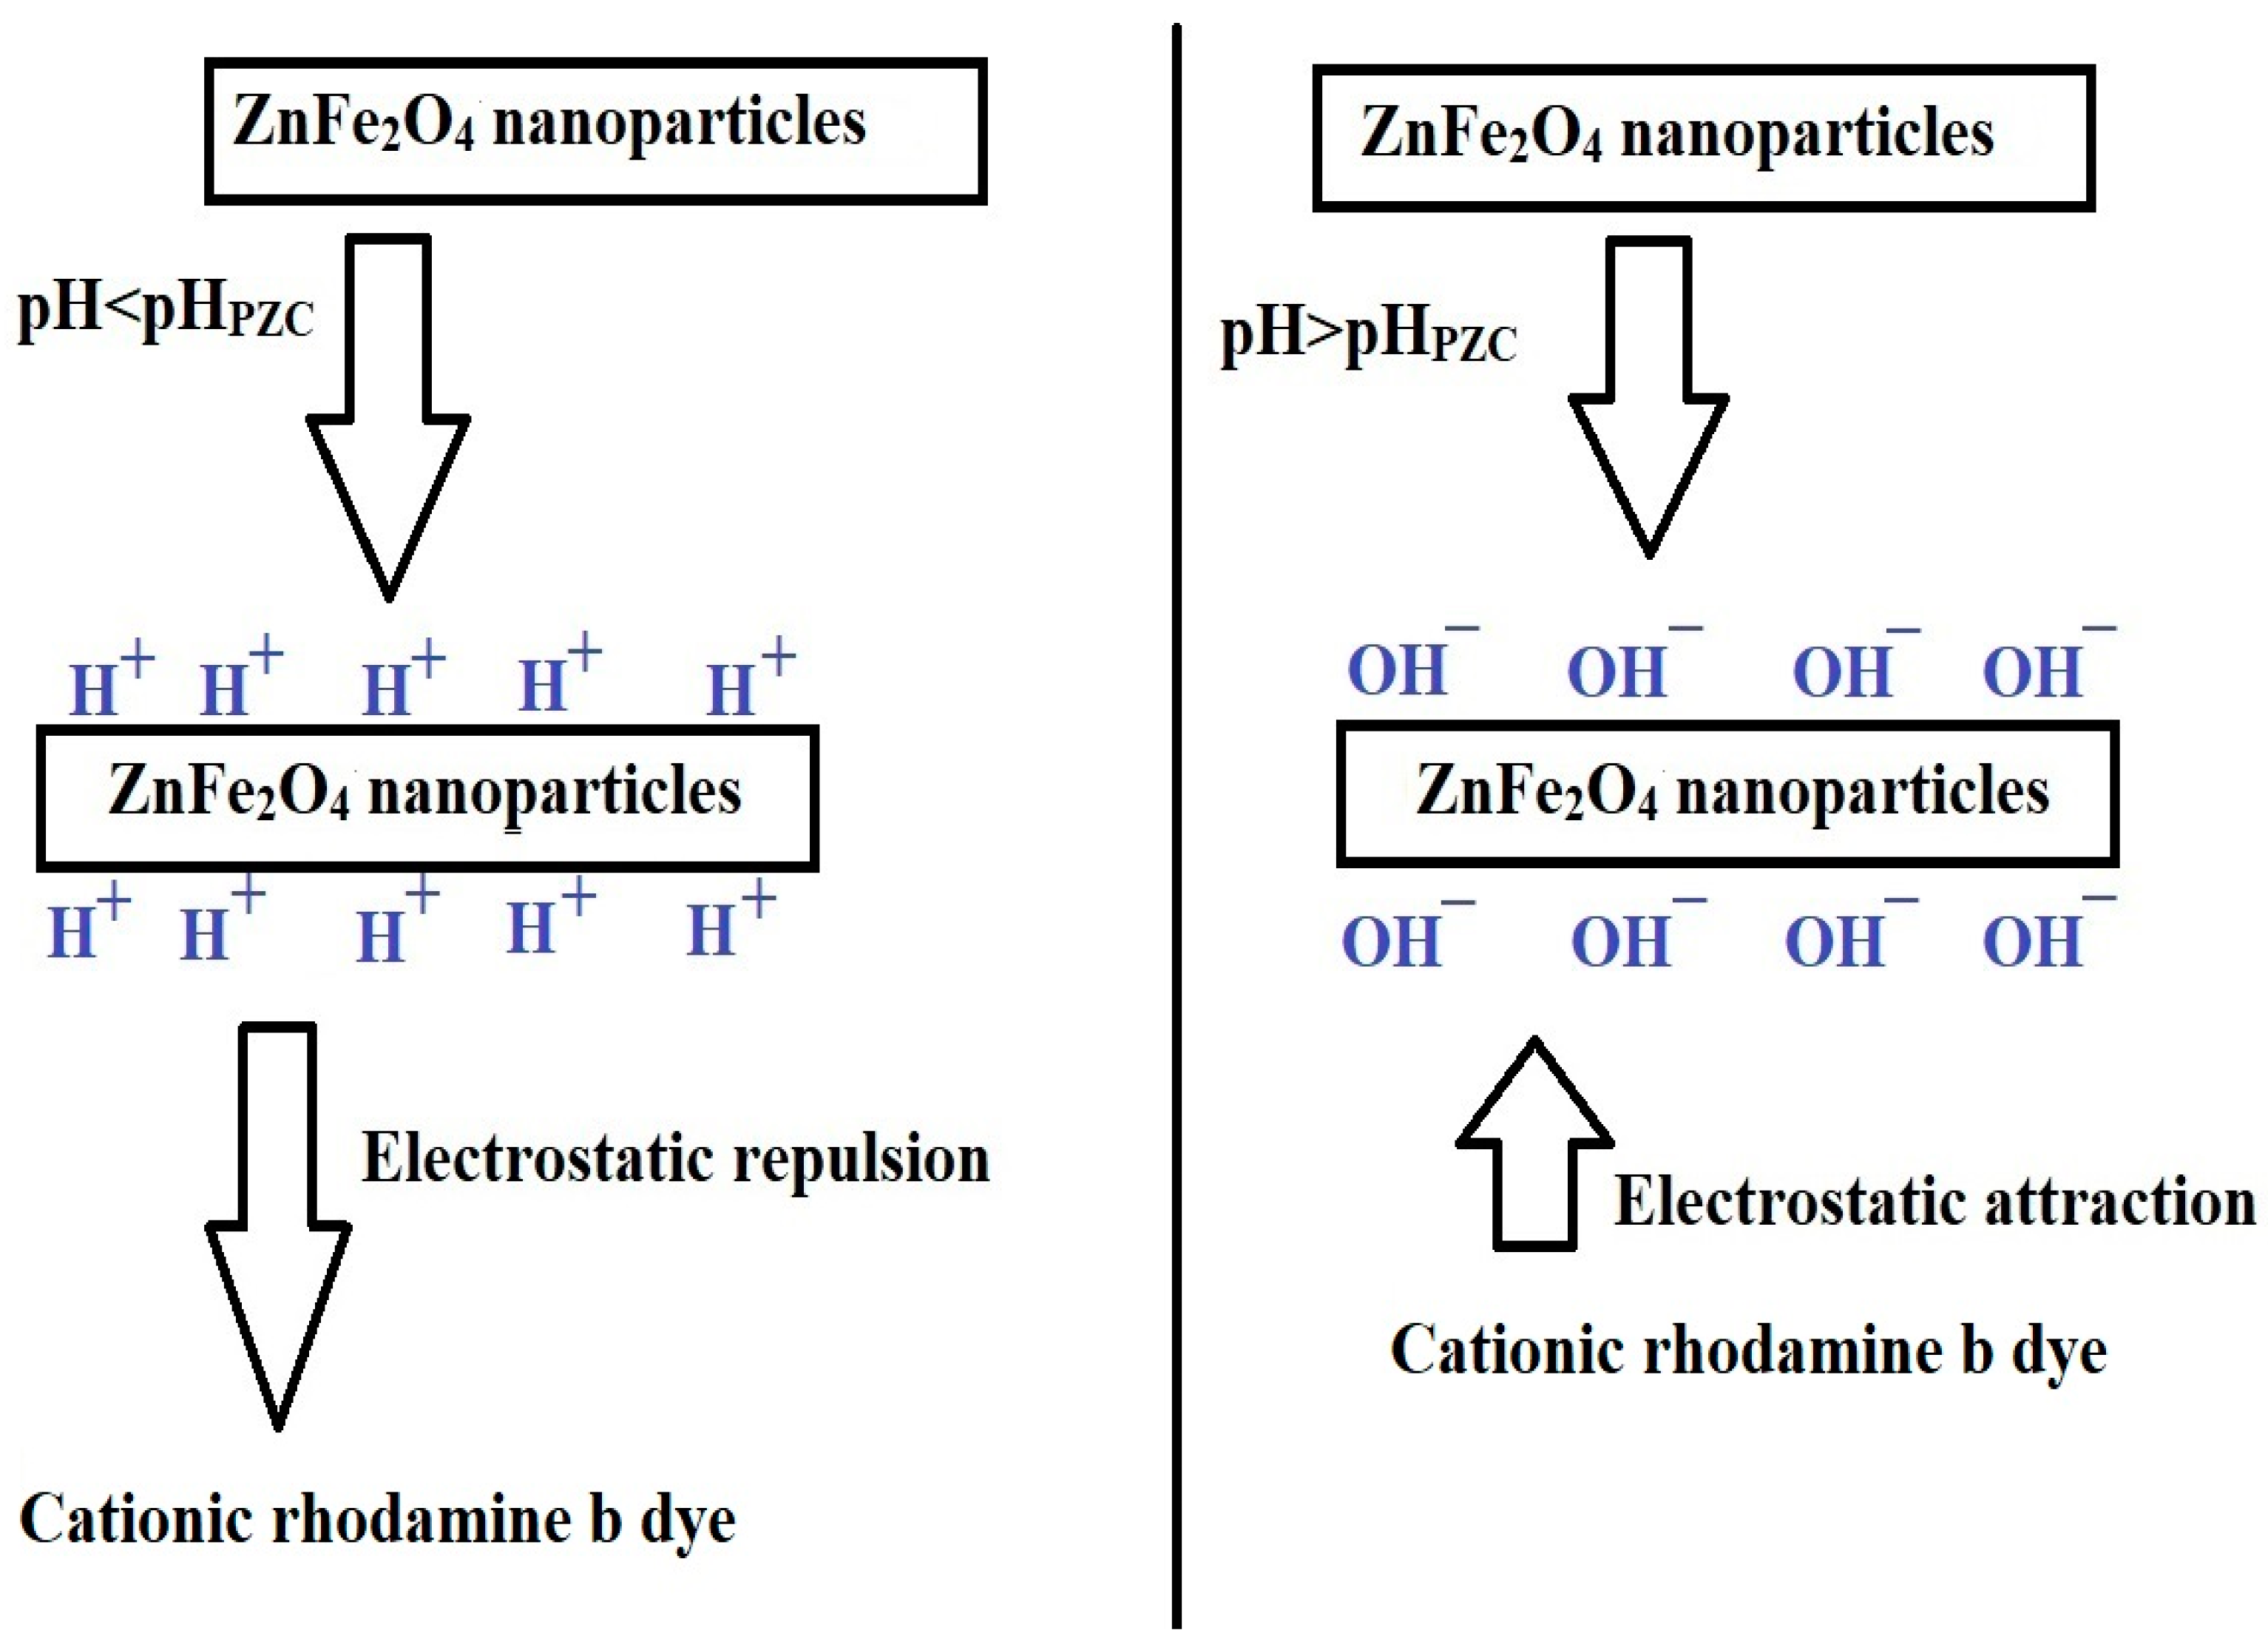
The point of zero charge (pHPZC), shown in Figure 7B, is a pivotal factor that designates the pH value at which the adsorbent’s surface charge becomes neutral. The pHPZC values for the SG and SA samples are 4.92 and 5.26, respectively. It is obvious that when the pH is below the pHPZC, the adsorbent surface of the SG or SA sample is positively charged, leading to a repulsion with the positively charged rhodamine b dye molecules and a decrease in dye adsorption, as indicated in Scheme 2 [37,38]. Conversely, when the pH exceeds the pHPZC, the adsorbent surface of the SG or SA sample is negatively charged, fostering an electrostatic attraction with the cationic dye and consequently elevating the adsorption percentage, as outlined in Scheme 2 [37,38].
The adsorption percentages of rhodamine b dye on the SG and SA samples reach 53.74% and 78.68%, respectively, at a pH of 10. Furthermore, the disparity in adsorption efficacy between the SG and SA samples aligns with their respective surface areas discussed earlier. The SA sample, which has a larger surface area, demonstrates superior adsorption capabilities across all tested pH values, suggesting that an expansive surface area bolsters the availability of adsorption sites. In contrast, the SG sample shows reduced adsorption efficiency, which can be ascribed to its smaller surface area, potentially limiting interactions between the dye and adsorbent sites.

2.2.2. Influence of Contact Time

Figure 8 depicts the influence of contact time on the removal efficiency of rhodamine b dye by the SG and SA samples. A notable growth in the adsorption percentage of rhodamine b dye is observed as the contact time extends, stabilizing beyond 70 min. This swift uptick in adsorption highlights the ample presence of active sites or a significant surface area available for interaction with the dye molecules. The sudden increase in the adsorption percentage of rhodamine b dye as the contact time increased from 60 to 70 min was due to the transition from external surface adsorption to internal pore adsorption. The time frame between 60 and 70 min might reflect the point at which the majority of available external sites are occupied, and dye molecules start to interact more with internal adsorption sites, leading to a noticeable uptick in adsorption. Furthermore, the stabilization suggests that an equilibrium state has been reached, implying full saturation of the adsorption sites by the dye molecules. Additionally, the data reveal a distinct difference in the adsorption efficiency of the two nanoparticles over time. Specifically, after approximately 70 min, the adsorption percentages for rhodamine b dye on the SG and SA samples stand at 53.61 and 78.29%, respectively. This variance in adsorption percentages between the SG and SA samples can be linked to their respective surface areas, echoing earlier discussions.
The elimination breakthrough time (EBT) observed is slower for the SG sample compared to the SA sample. This can be attributed to several factors, such as BET surface area and average particle size. The BET surface area and total pore volume of the SA sample are significantly higher than those of the SG sample, as shown in Table 1. The larger surface area and pore volume of the SA sample provide more active sites for adsorption, leading to a faster initial adsorption rate. Also, the average particle size of the SA sample is smaller compared to the SG sample, as observed in Figure 5. Smaller particles have a higher surface-to-volume ratio, facilitating more efficient adsorption interactions. The nitrogen adsorption-desorption isotherms in Figure 6 indicate that the SA sample has a more pronounced mesoporosity, which enhances the diffusion rate of dye molecules into the pores, resulting in a quicker adsorption process. These factors collectively contribute to the observed differences in the EBT between the SG and SA samples.
Moreover, the equations below represent the linear versions of both the pseudo-first-order and pseudo-second-order kinetic models that were utilized to analyze the adsorption process of rhodamine b dye on the SG and SA samples [37,38,39].
Pseudo-first-order:
log O e O t = l o g O e L 1 2.303 t
Pseudo-second-order:
t O t = 1 L 2 O e 2 + 1 O e t
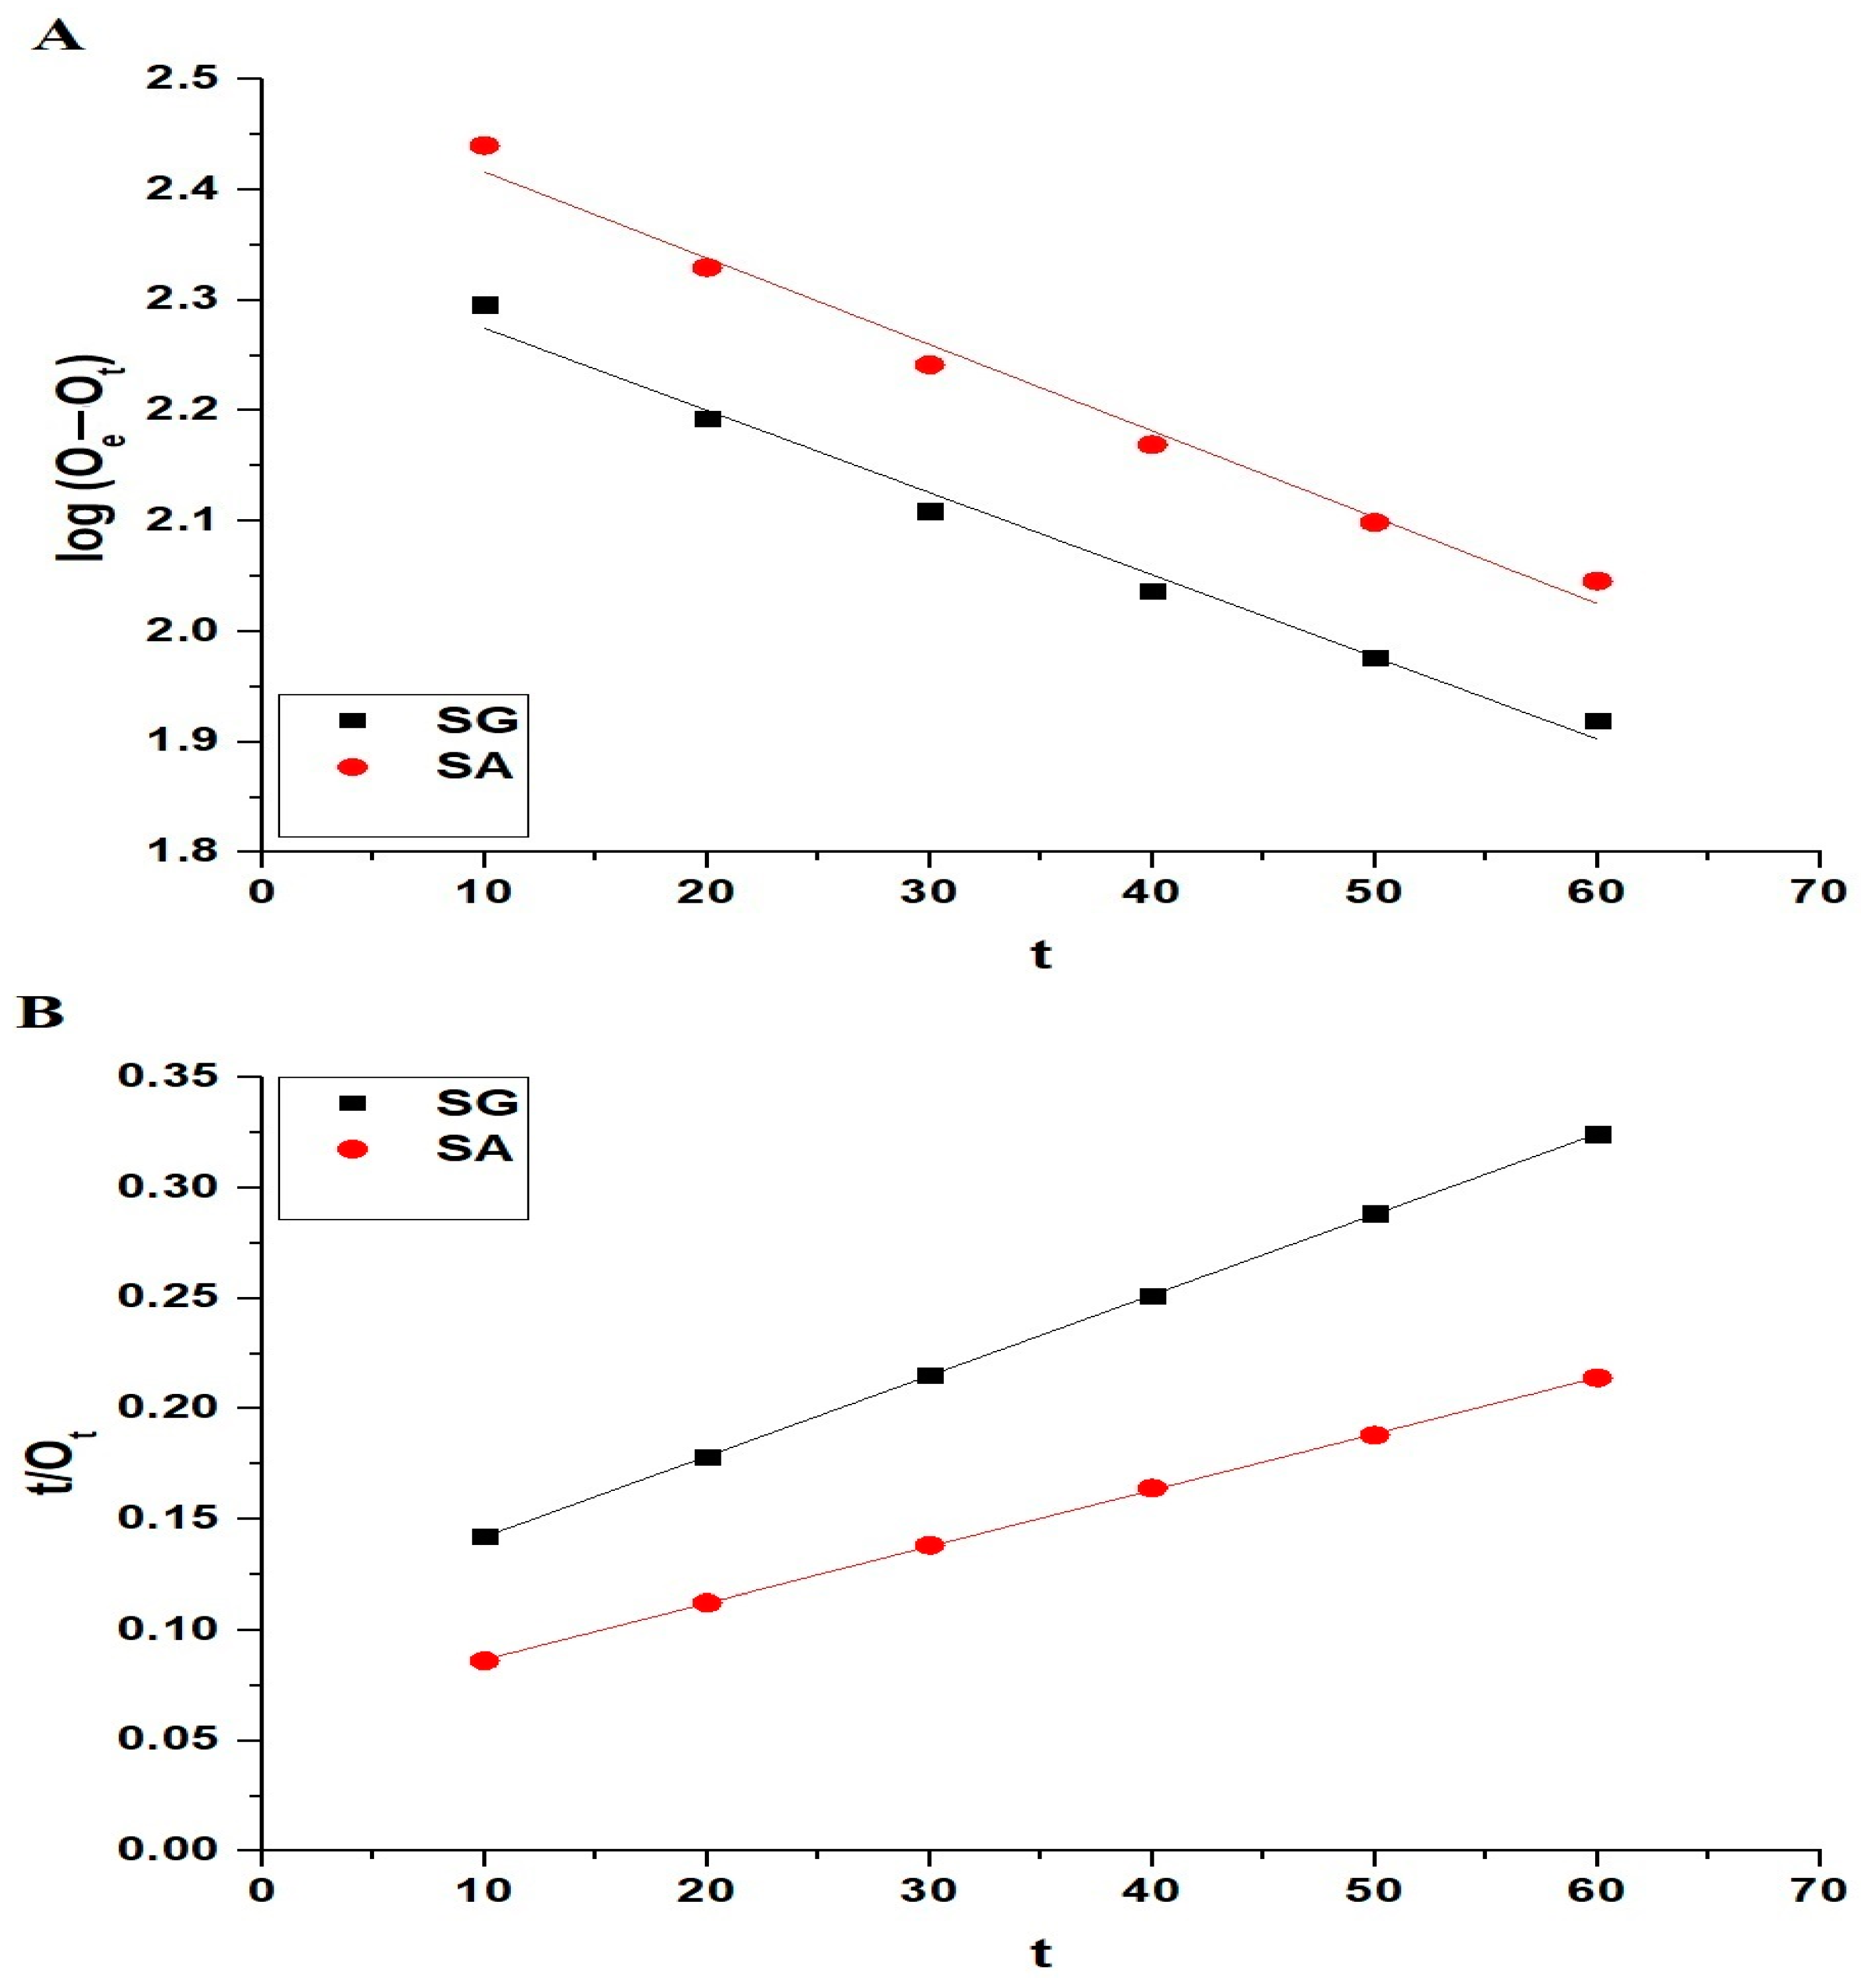
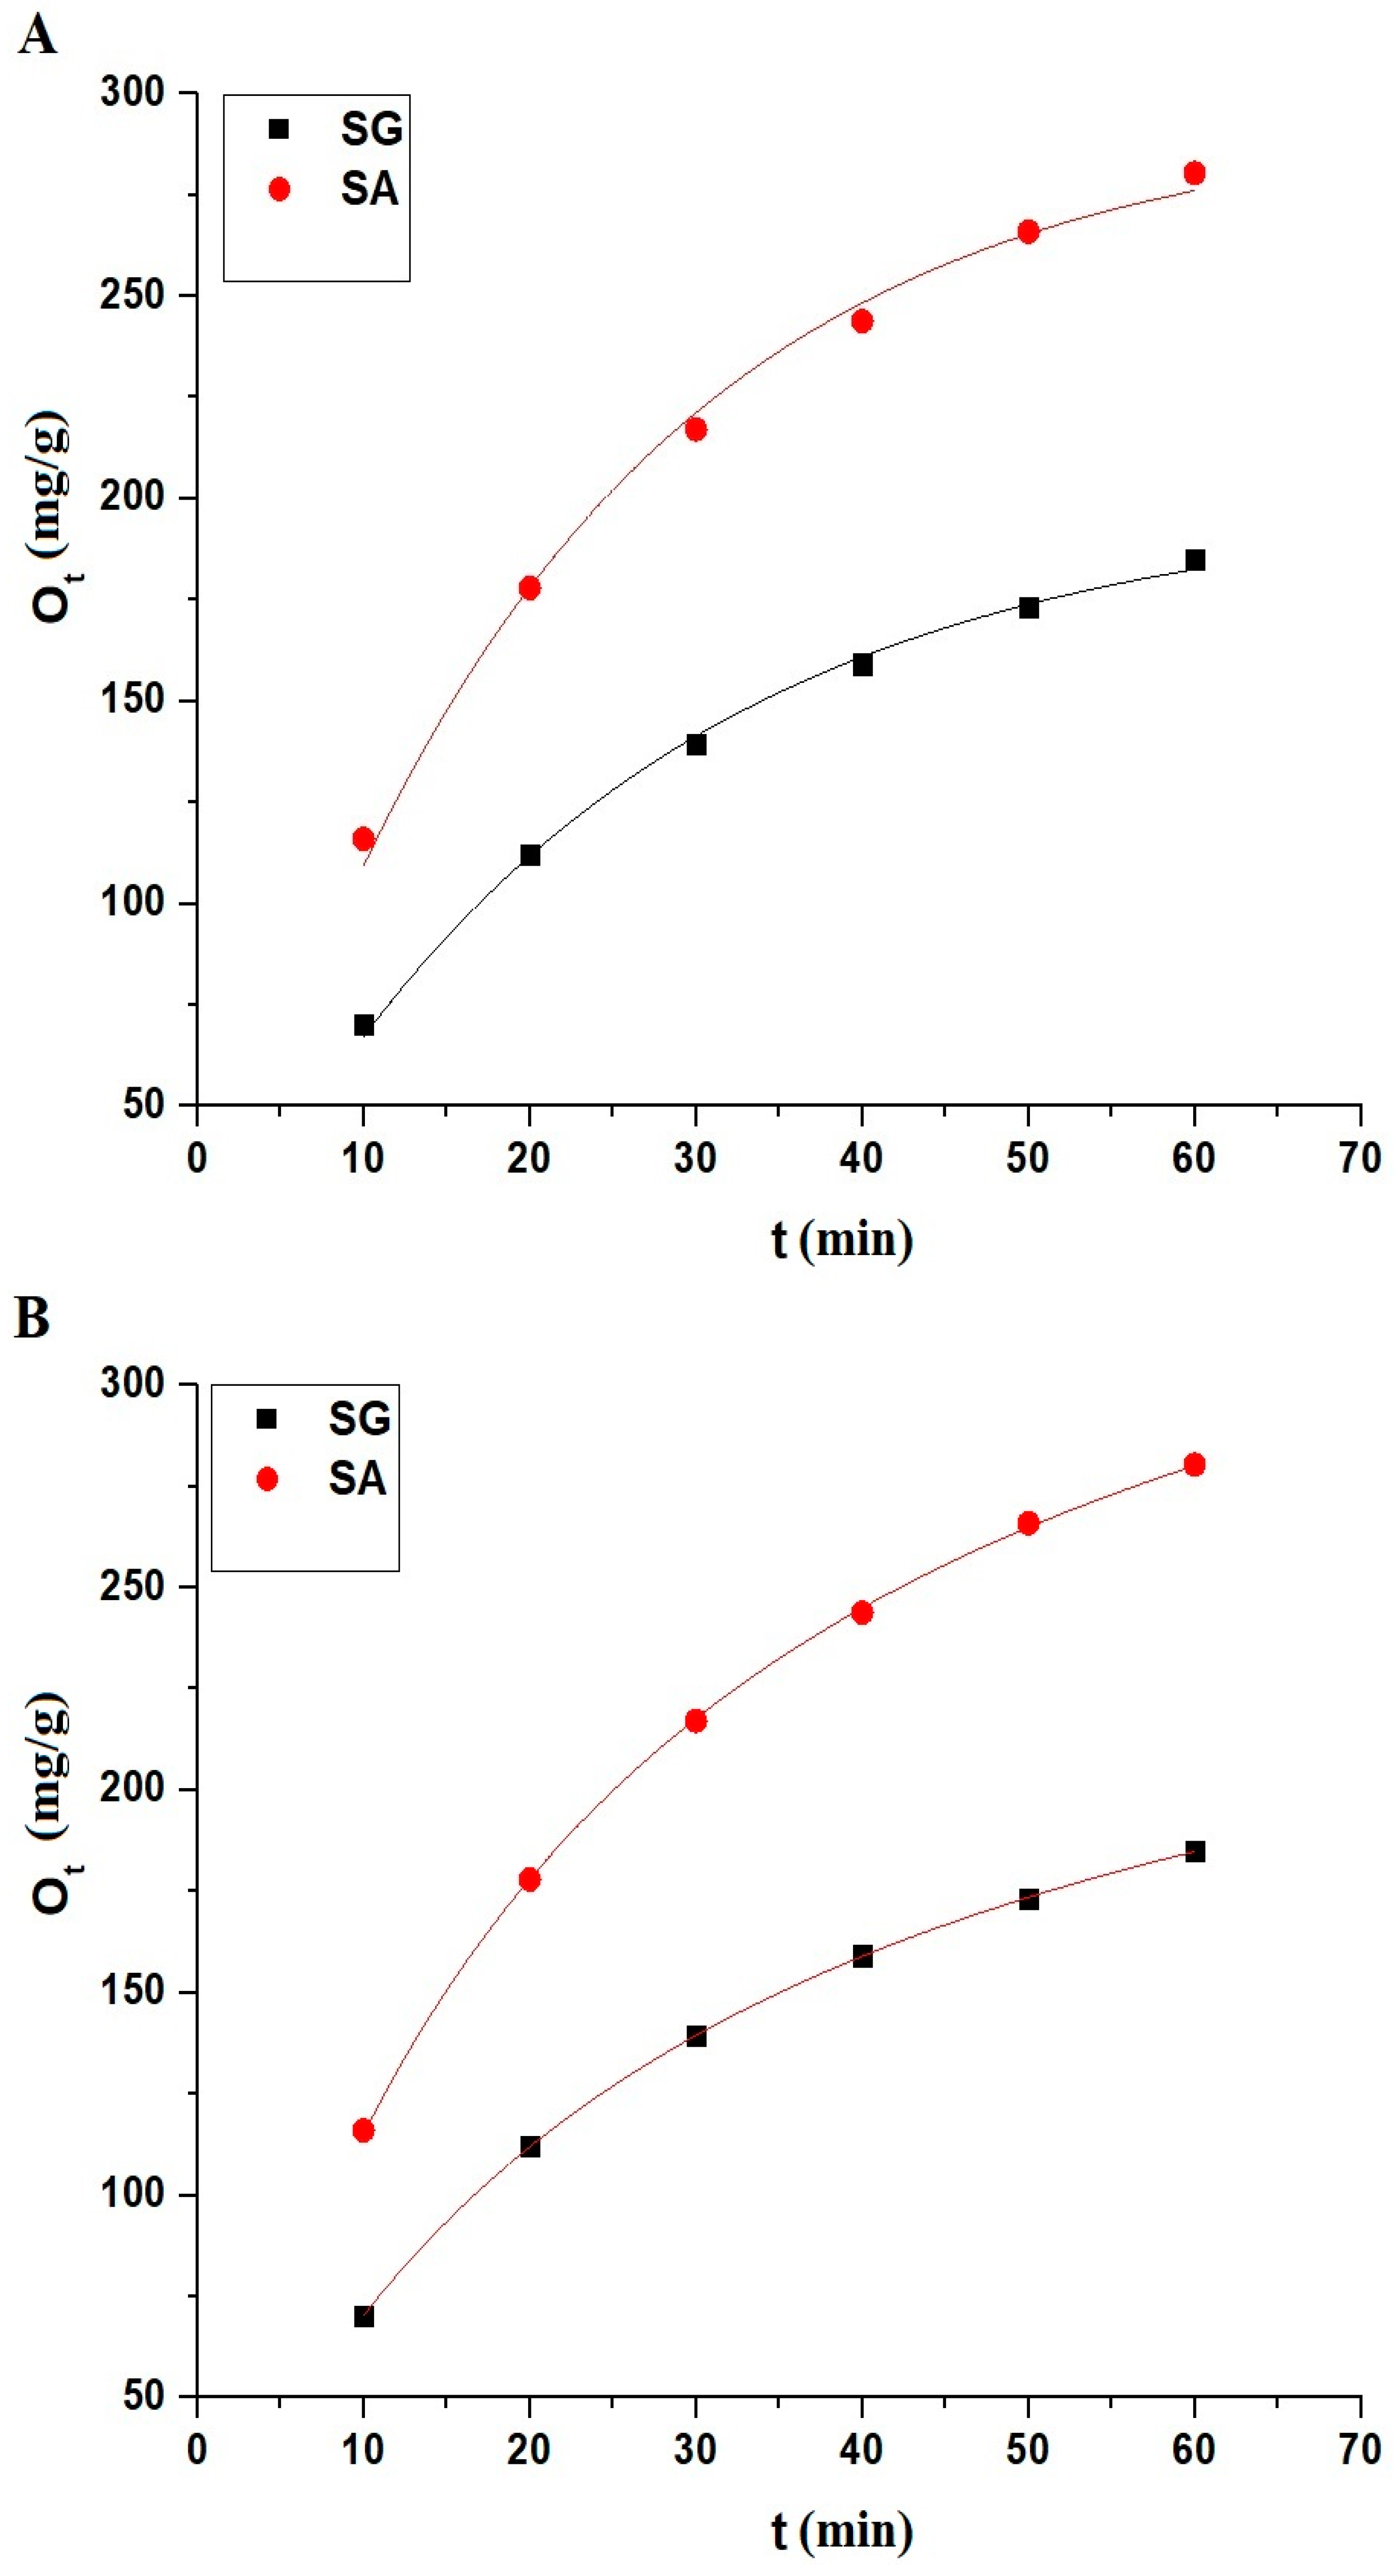
where Ot (mg/g) represents the amount of rhodamine b dye removed at contact time t, whereas Oe (mg/g) represents the equilibrium adsorption capacity. In addition, the rate constants L1 and L2 indicate the rate of the pseudo-first-order and pseudo-second-order models, with the units of 1/min as well as g/mg.min, respectively. Figure 9 and Table 2 jointly offer an in-depth evaluation of the linear models for rhodamine b dye adsorption on the SG and SA samples.
Moreover, the equations below represent the nonlinear versions of both the pseudo-first-order and pseudo-second-order kinetic models that were utilized to analyze the adsorption process of rhodamine b dye on the SG and SA samples [40].
Pseudo-first-order:
O t = O e 1 e L 1 t
Pseudo-second-order:
O t = O e 2 L 2 t 1 + O e L 2 t
Figure 10 and Table 3 jointly offer an in-depth evaluation of the nonlinear models for rhodamine b dye adsorption on the SG and SA samples.
By comparing linear models with nonlinear ones, it can be concluded that both the nonlinear and linear pseudo-second-order models are more suitable for describing the adsorption process because the reduced Chi-squared values (χ2) are less than 1 and the residual sum of square values (RSS) are very small. The nonlinear or linear fit of the pseudo-first-order model appears less accurate in comparison to the nonlinear or linear pseudo-second-order model, as evidenced by the observed experimental values (OExp) and the correlation coefficients (R2) presented in Table 2 and Table 3. For both the SG and SA samples, the nonlinear or linear pseudo-second-order kinetic model provides R2 values that are nearer to 1, signifying a more precise alignment with the actual experimental outcomes. Furthermore, the equilibrium capacities calculated (Oe) by the nonlinear or linear pseudo-second-order model are almost exactly in agreement with the observed experimental values (OExp), implying that the adsorption mechanism conforms more closely to the dynamics described by the nonlinear or linear pseudo-second-order model.

2.2.3. Influence of Temperature

In Figure 11, the adsorption efficacy of rhodamine b dye by the SG and SA samples across several temperatures is illustrated. The decrease in the adsorption percentage of rhodamine b dye with rising temperature suggests that the process of rhodamine b dye adsorption onto the SG or SA samples is exothermic.
The Gibbs free energy (ΔG°), entropy change (ΔS°), as well as enthalpy change (ΔH°) for the removal of rhodamine b dye were calculated using Equations (5)–(7) [37,38].
L d = O e C e
l n L d = Δ S ° R Δ H ° R T
Δ G ° = Δ H ° T Δ S °
R is defined as the gas constant (kJ/molK), T is defined as the temperature (K), and Ld is defined as the distribution coefficient (L/g).
Figure 12 and Table 4 provide a combined analysis of the thermodynamic aspects related to the adsorption of rhodamine b dye by the SG and SA samples. The positive change in entropy (ΔS°) observed in both samples indicates a heightened level of disorderliness at the interface between the solid and solution phases during the adsorption process. Furthermore, the negative values of Gibbs free energy (ΔG°) at different temperatures affirm the spontaneous nature of the adsorption phenomenon. Additionally, the negative change in enthalpy (ΔH°) for both samples supports the conclusion that the adsorption process is exothermic and predominantly physical in nature [37,38].

2.2.4. Influence of Concentration

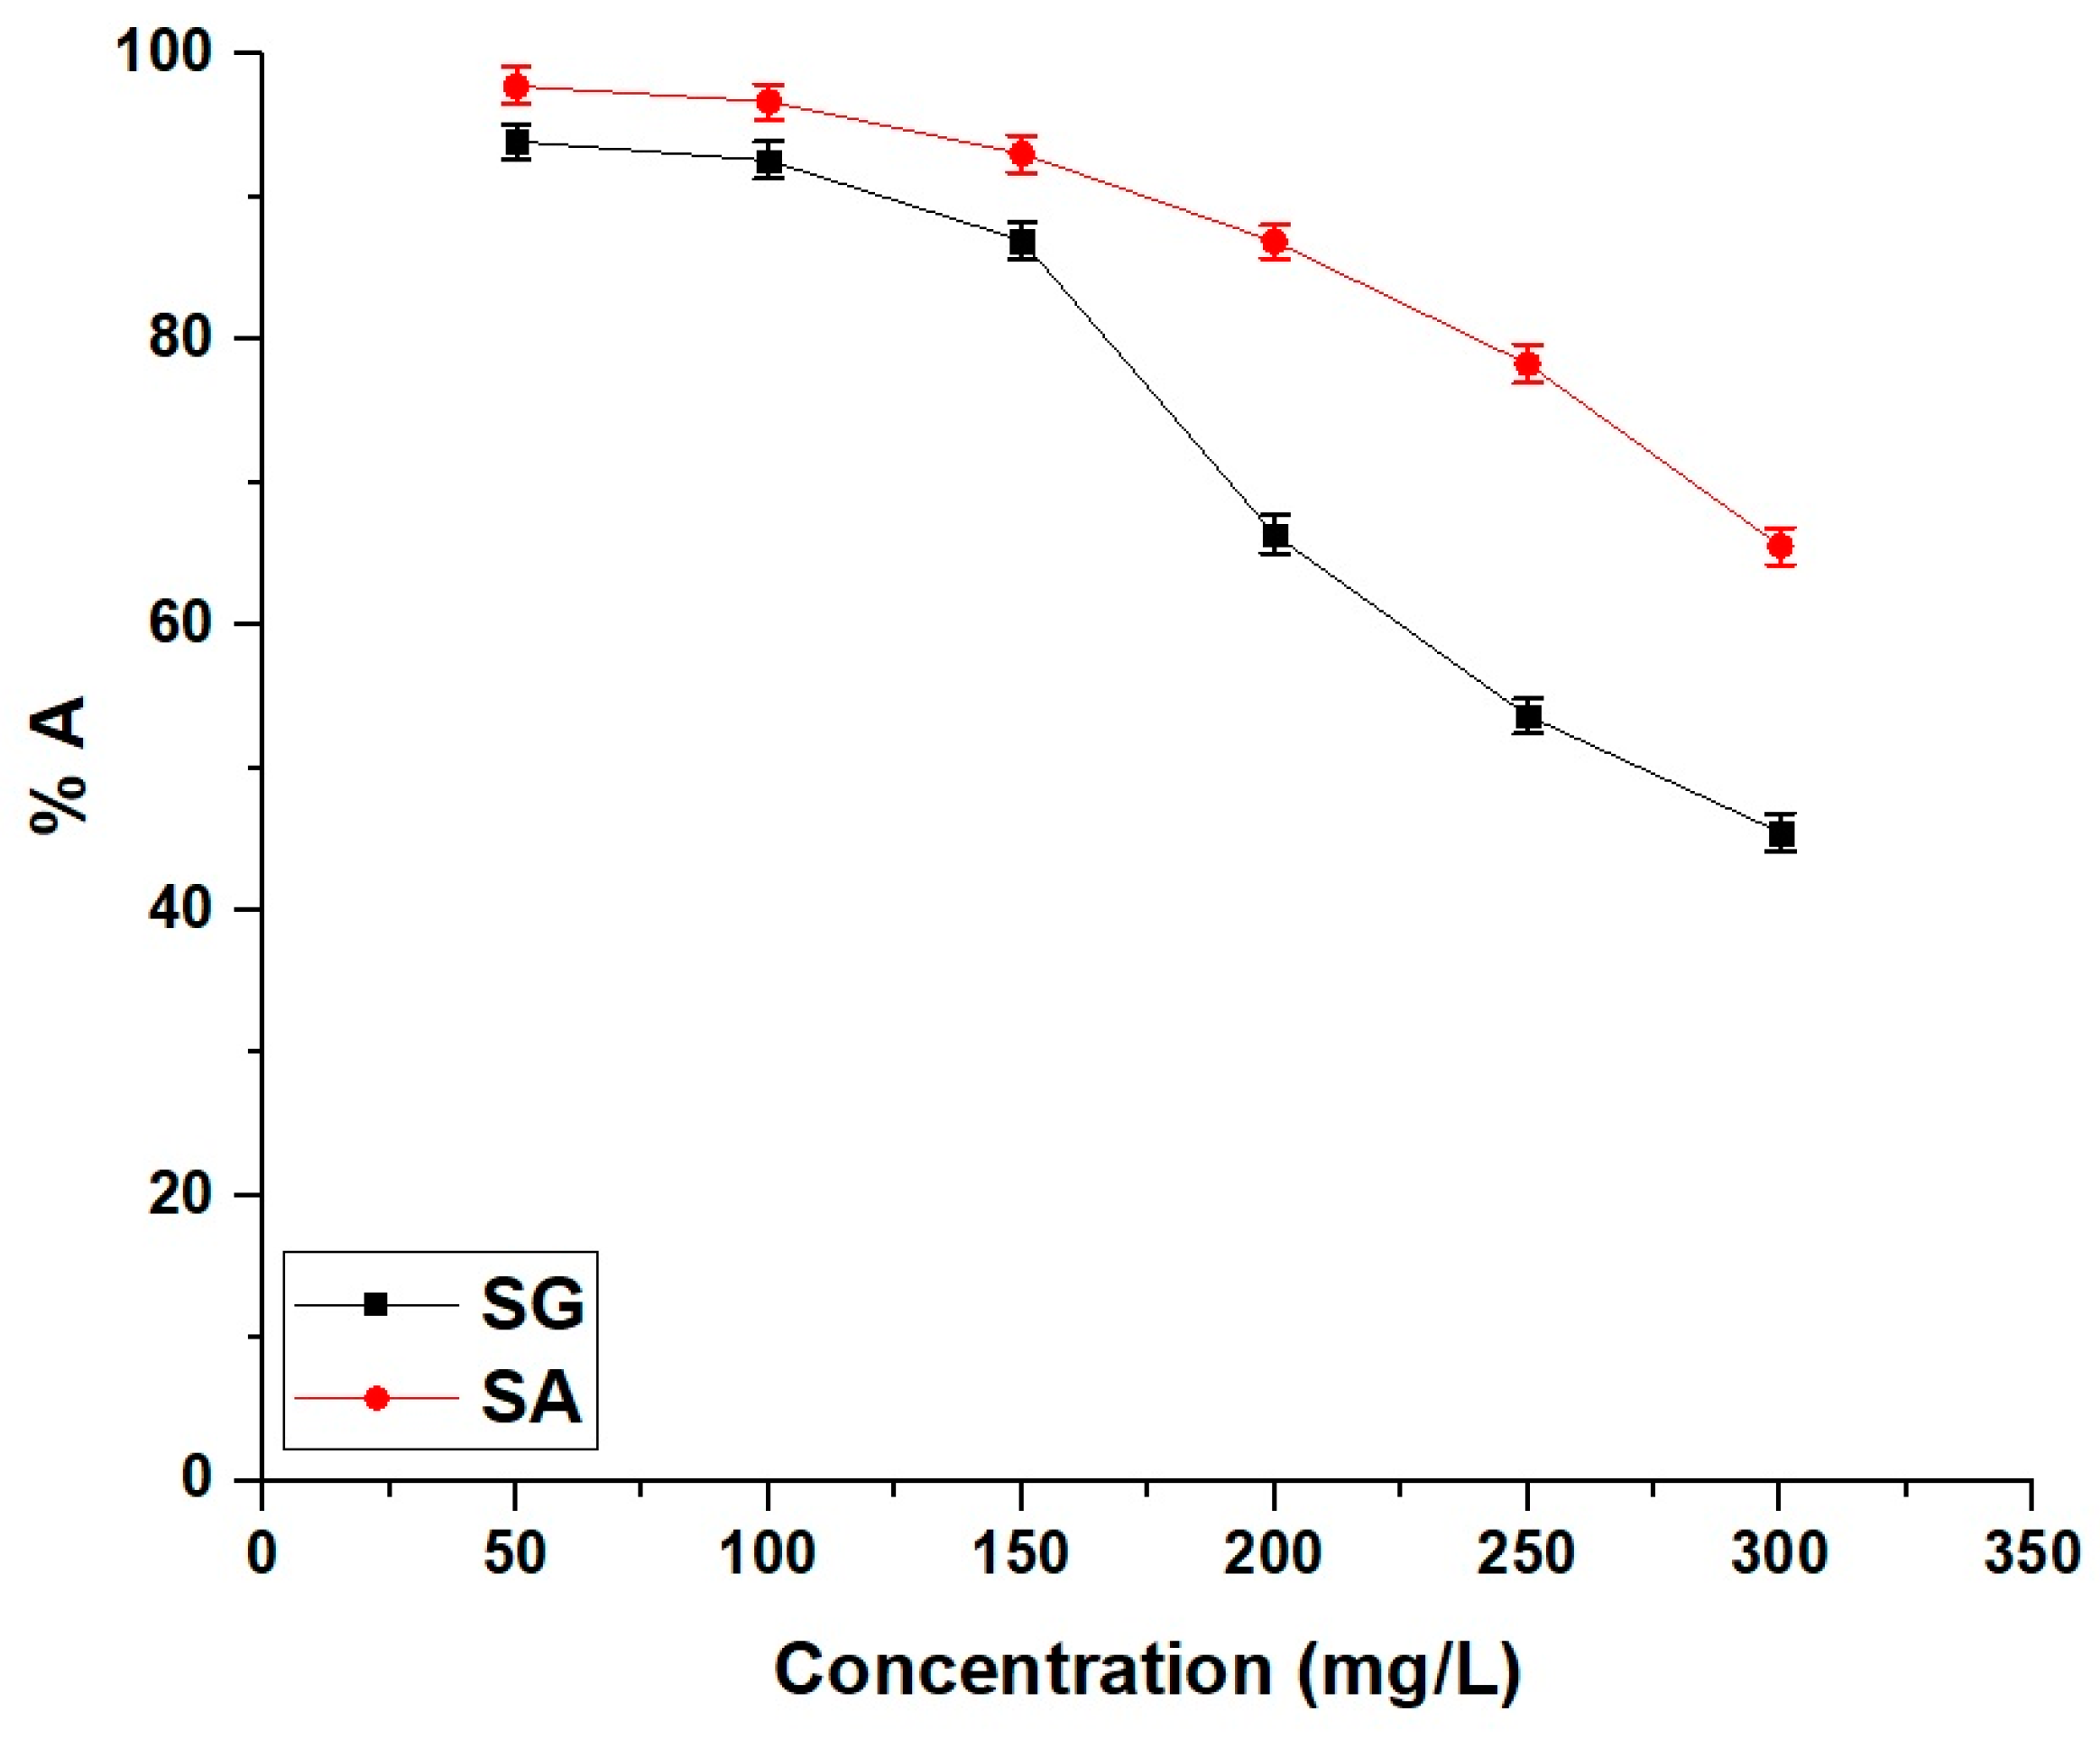
Figure 13 demonstrates the impact of the initial concentration of rhodamine b dye on the adsorption effectiveness of the SG and SA samples. In both cases, the percentage of rhodamine b dye adsorption diminishes with an increase in the initial dye concentration. At lower concentrations of the dye, there are abundant active sites available compared to the number of dye molecules present, resulting in higher adsorption percentages. However, as the concentration of the dye in the solution rises, these active sites become progressively occupied. Eventually, a saturation point is reached where additional dye molecules cannot be readily accommodated, leading to a decline in adsorption efficiency [37,38].
Furthermore, the subsequent equations present the linear representations of both the Langmuir and Freundlich equilibrium isotherms employed to examine the adsorption of rhodamine b dye onto the SG and SA products [37,38,39].
F r e u n d l i c h   i s o t h e r m :   l n O e = l n L 3 + 1 Z l n C e
L a n g m u i r   i s o t h e r m :   C e O e = 1 L 4 O m a x + C e O m a x
1/Z is defined as the adsorption intensity. The rate constants L4 and L3 indicate the rate of the Langmuir as well as Freundlich isotherms, with the units of (L/mg) and (mg/g)(L/mg)1/n), respectively. Moreover, Omax is defined as the maximum uptake capability (mg/g). Equation (10) was employed to estimate Omax by applying the Freundlich equilibrium isotherm [37,38].
O m a x = L 4 C o 1 / Z
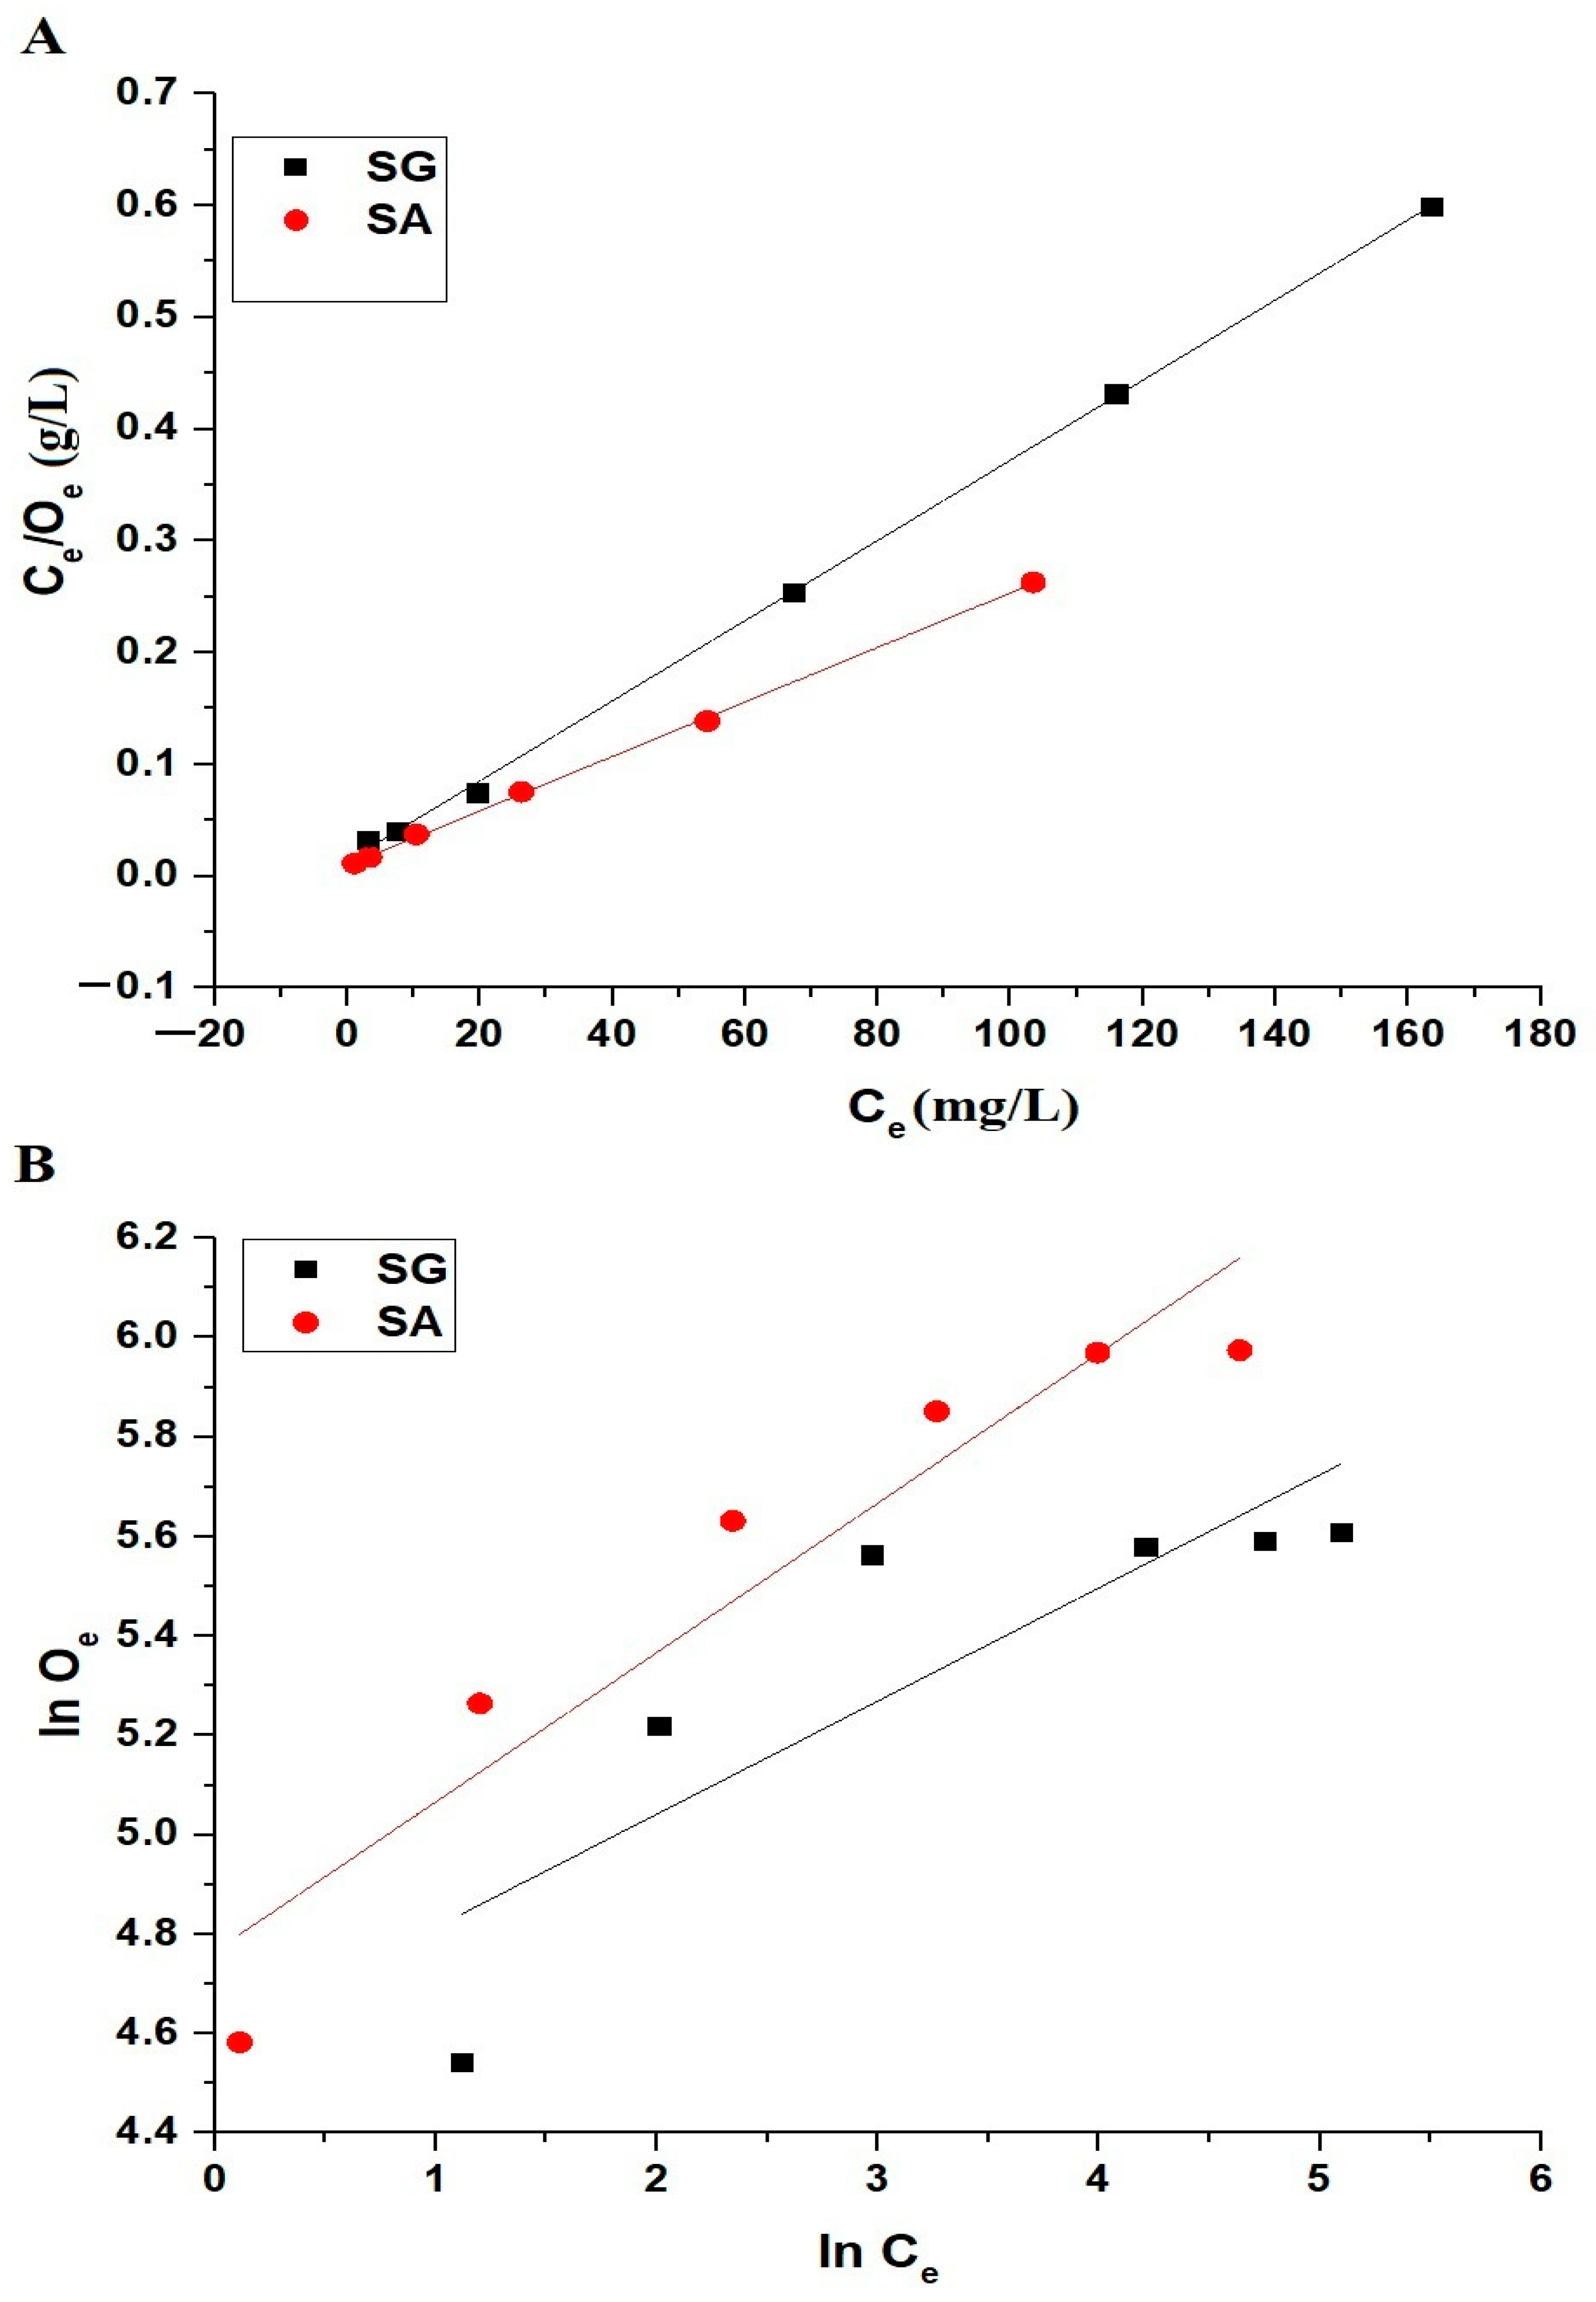
Figure 14 and Table 5 collectively offer a thorough examination of the linear equilibriums concerning the adsorption of rhodamine b dye onto the SG and SA samples.
Furthermore, the subsequent equations present the nonlinear representations of both the Langmuir and Freundlich equilibrium isotherms employed to examine the adsorption of rhodamine b dye onto the SG and SA products [40].
O e = O m a x L 3 C e 1 + L 3 C e
O e = L 4 × C e 1 / Z
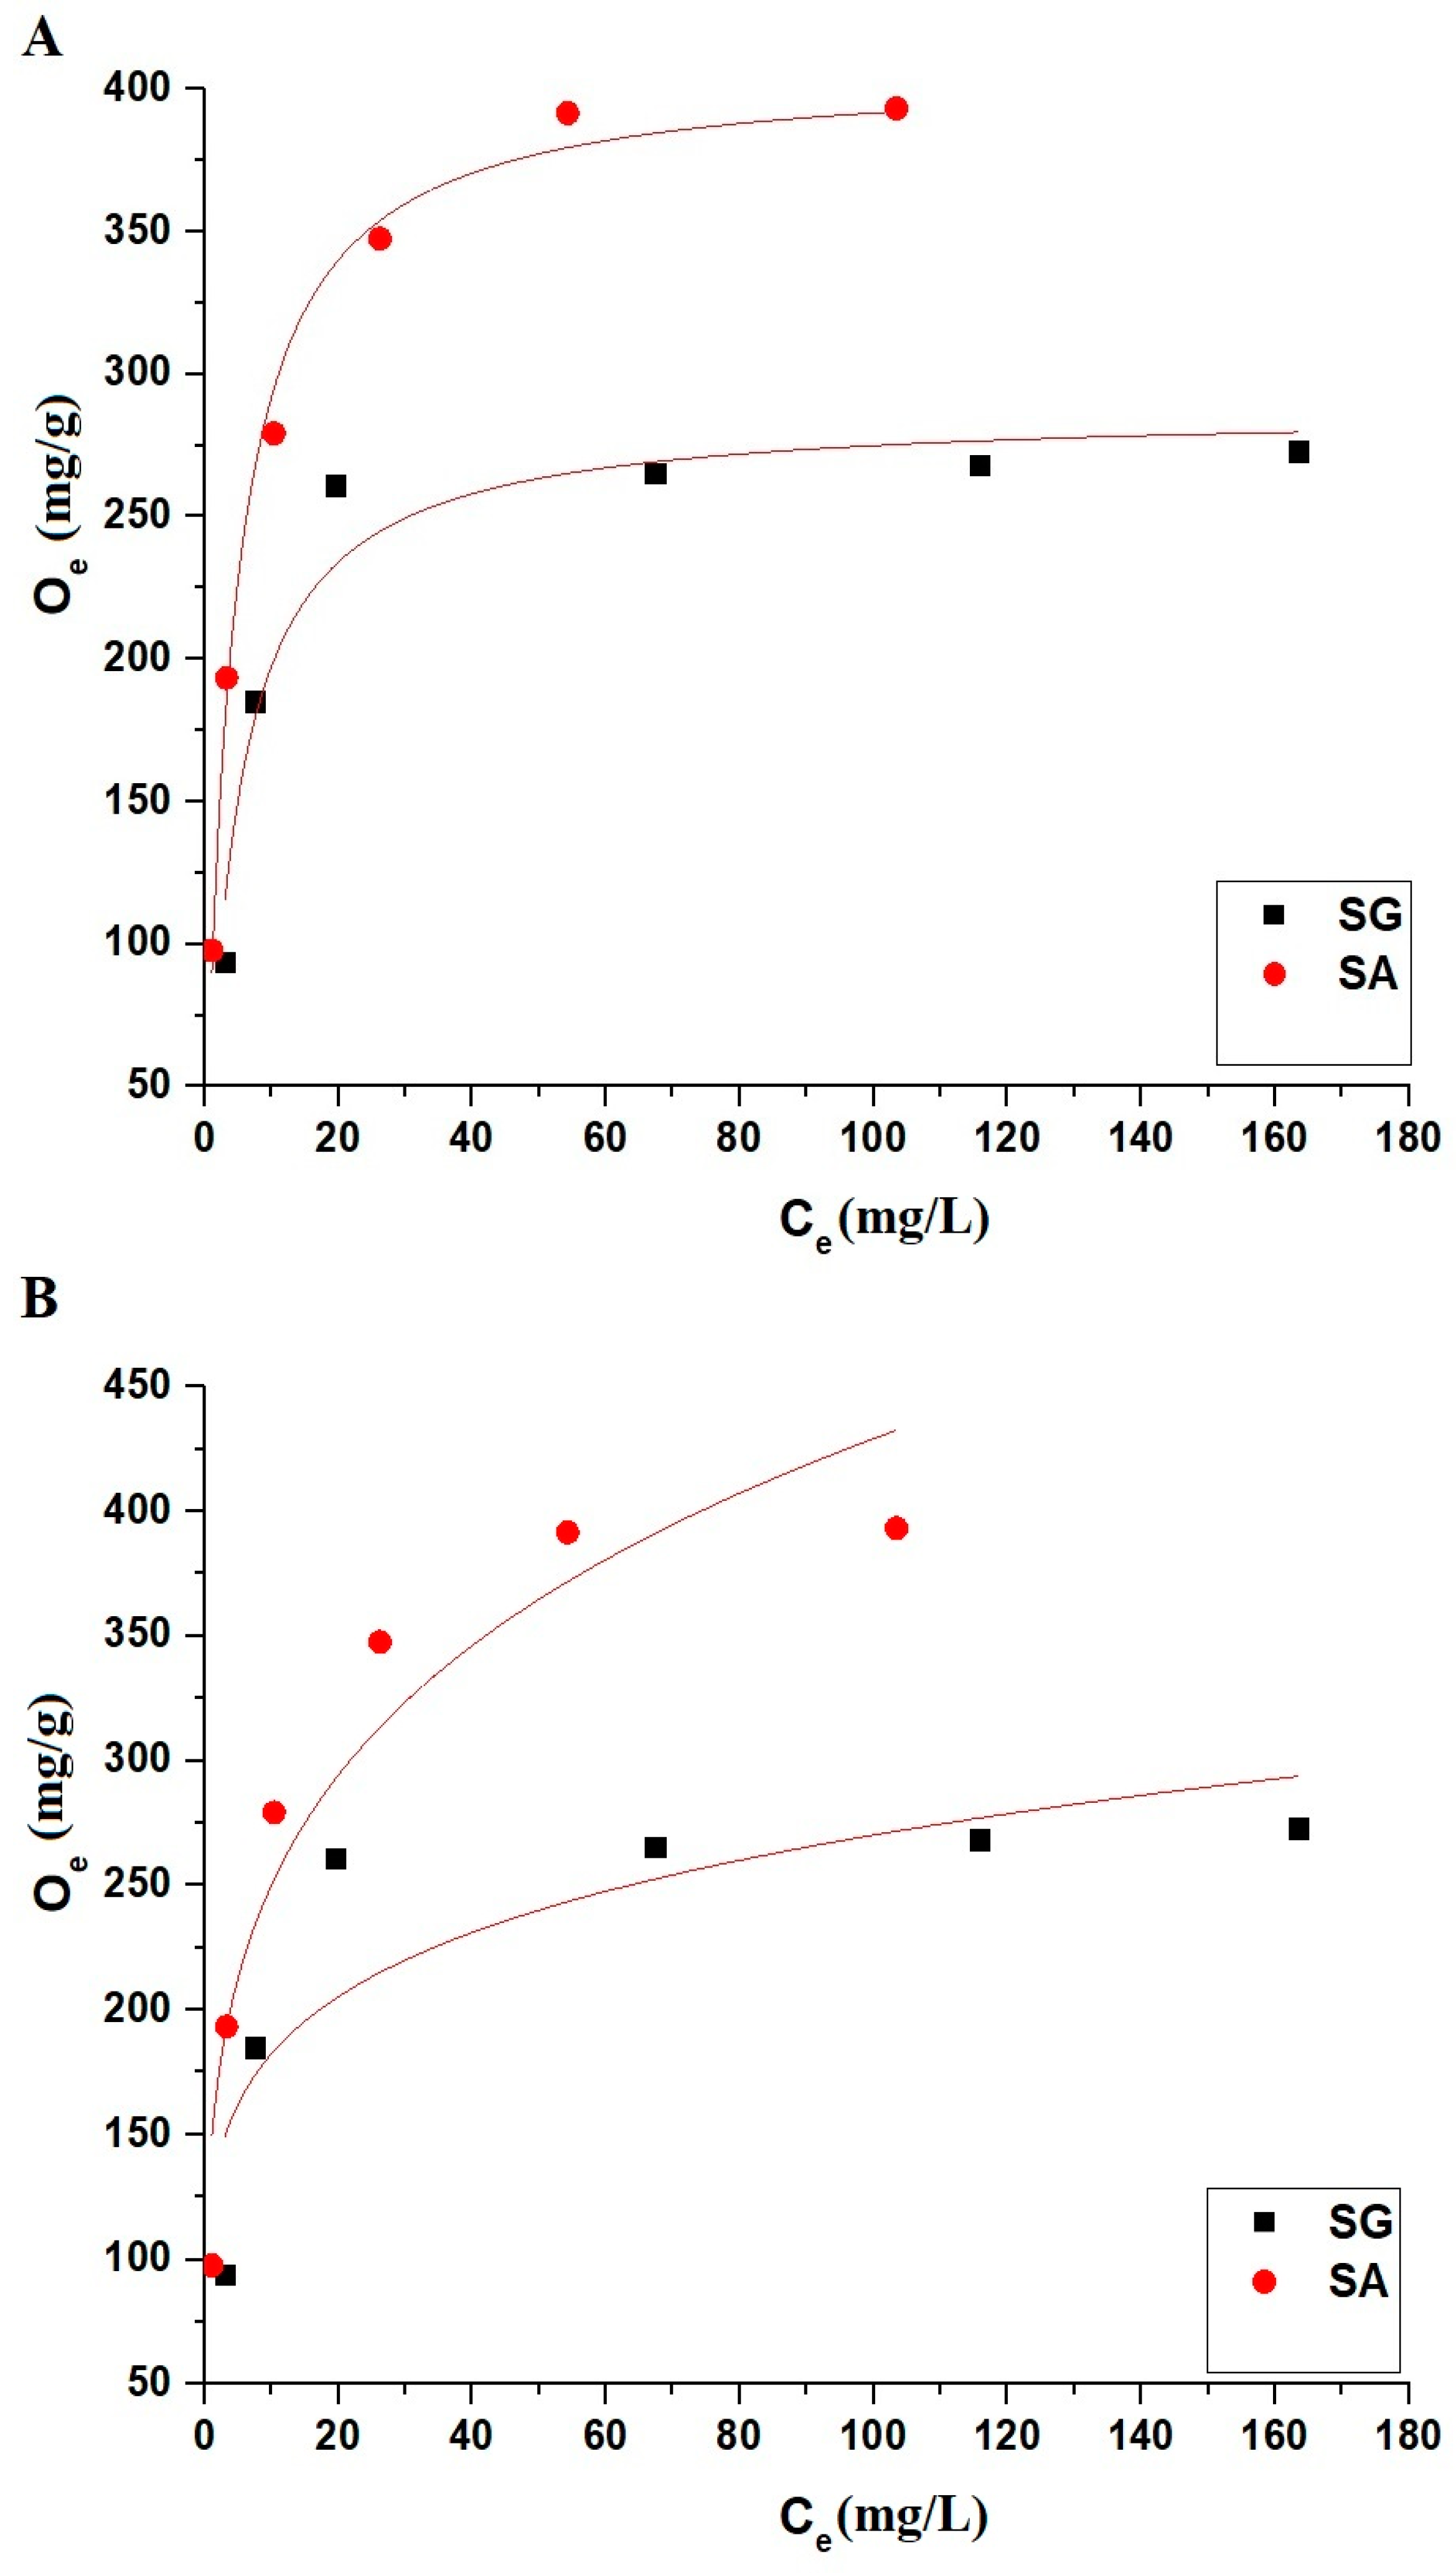
Figure 15 and Table 6 collectively offer a thorough examination of the nonlinear equilibriums concerning the adsorption of rhodamine b dye onto the SG and SA samples.
The linear or nonlinear fit of the Freundlich plot appears less precise in contrast to the linear or nonlinear Langmuir plot, as discerned from the correlation coefficients (R2) provided in Table 5 and Table 6. In both SG and SA samples, the linear Langmuir isotherm produces small RSS values and R2 values that approach 1, implying a superior alignment with the actual experimental data.
The data comparison of various adsorbents (Table 7) reveals that the SG and SA samples demonstrate superior adsorption capacities of 279.33 and 409.84 mg/g, respectively. Hence, the synthesized samples outperform other materials such as biochar, zeolite, kaolinite, SnS2, duolite C-20 resin, and magnetic montmorillonite composite [21,22,23,24,25,26].

2.2.5. Effect of Regeneration and Reusability

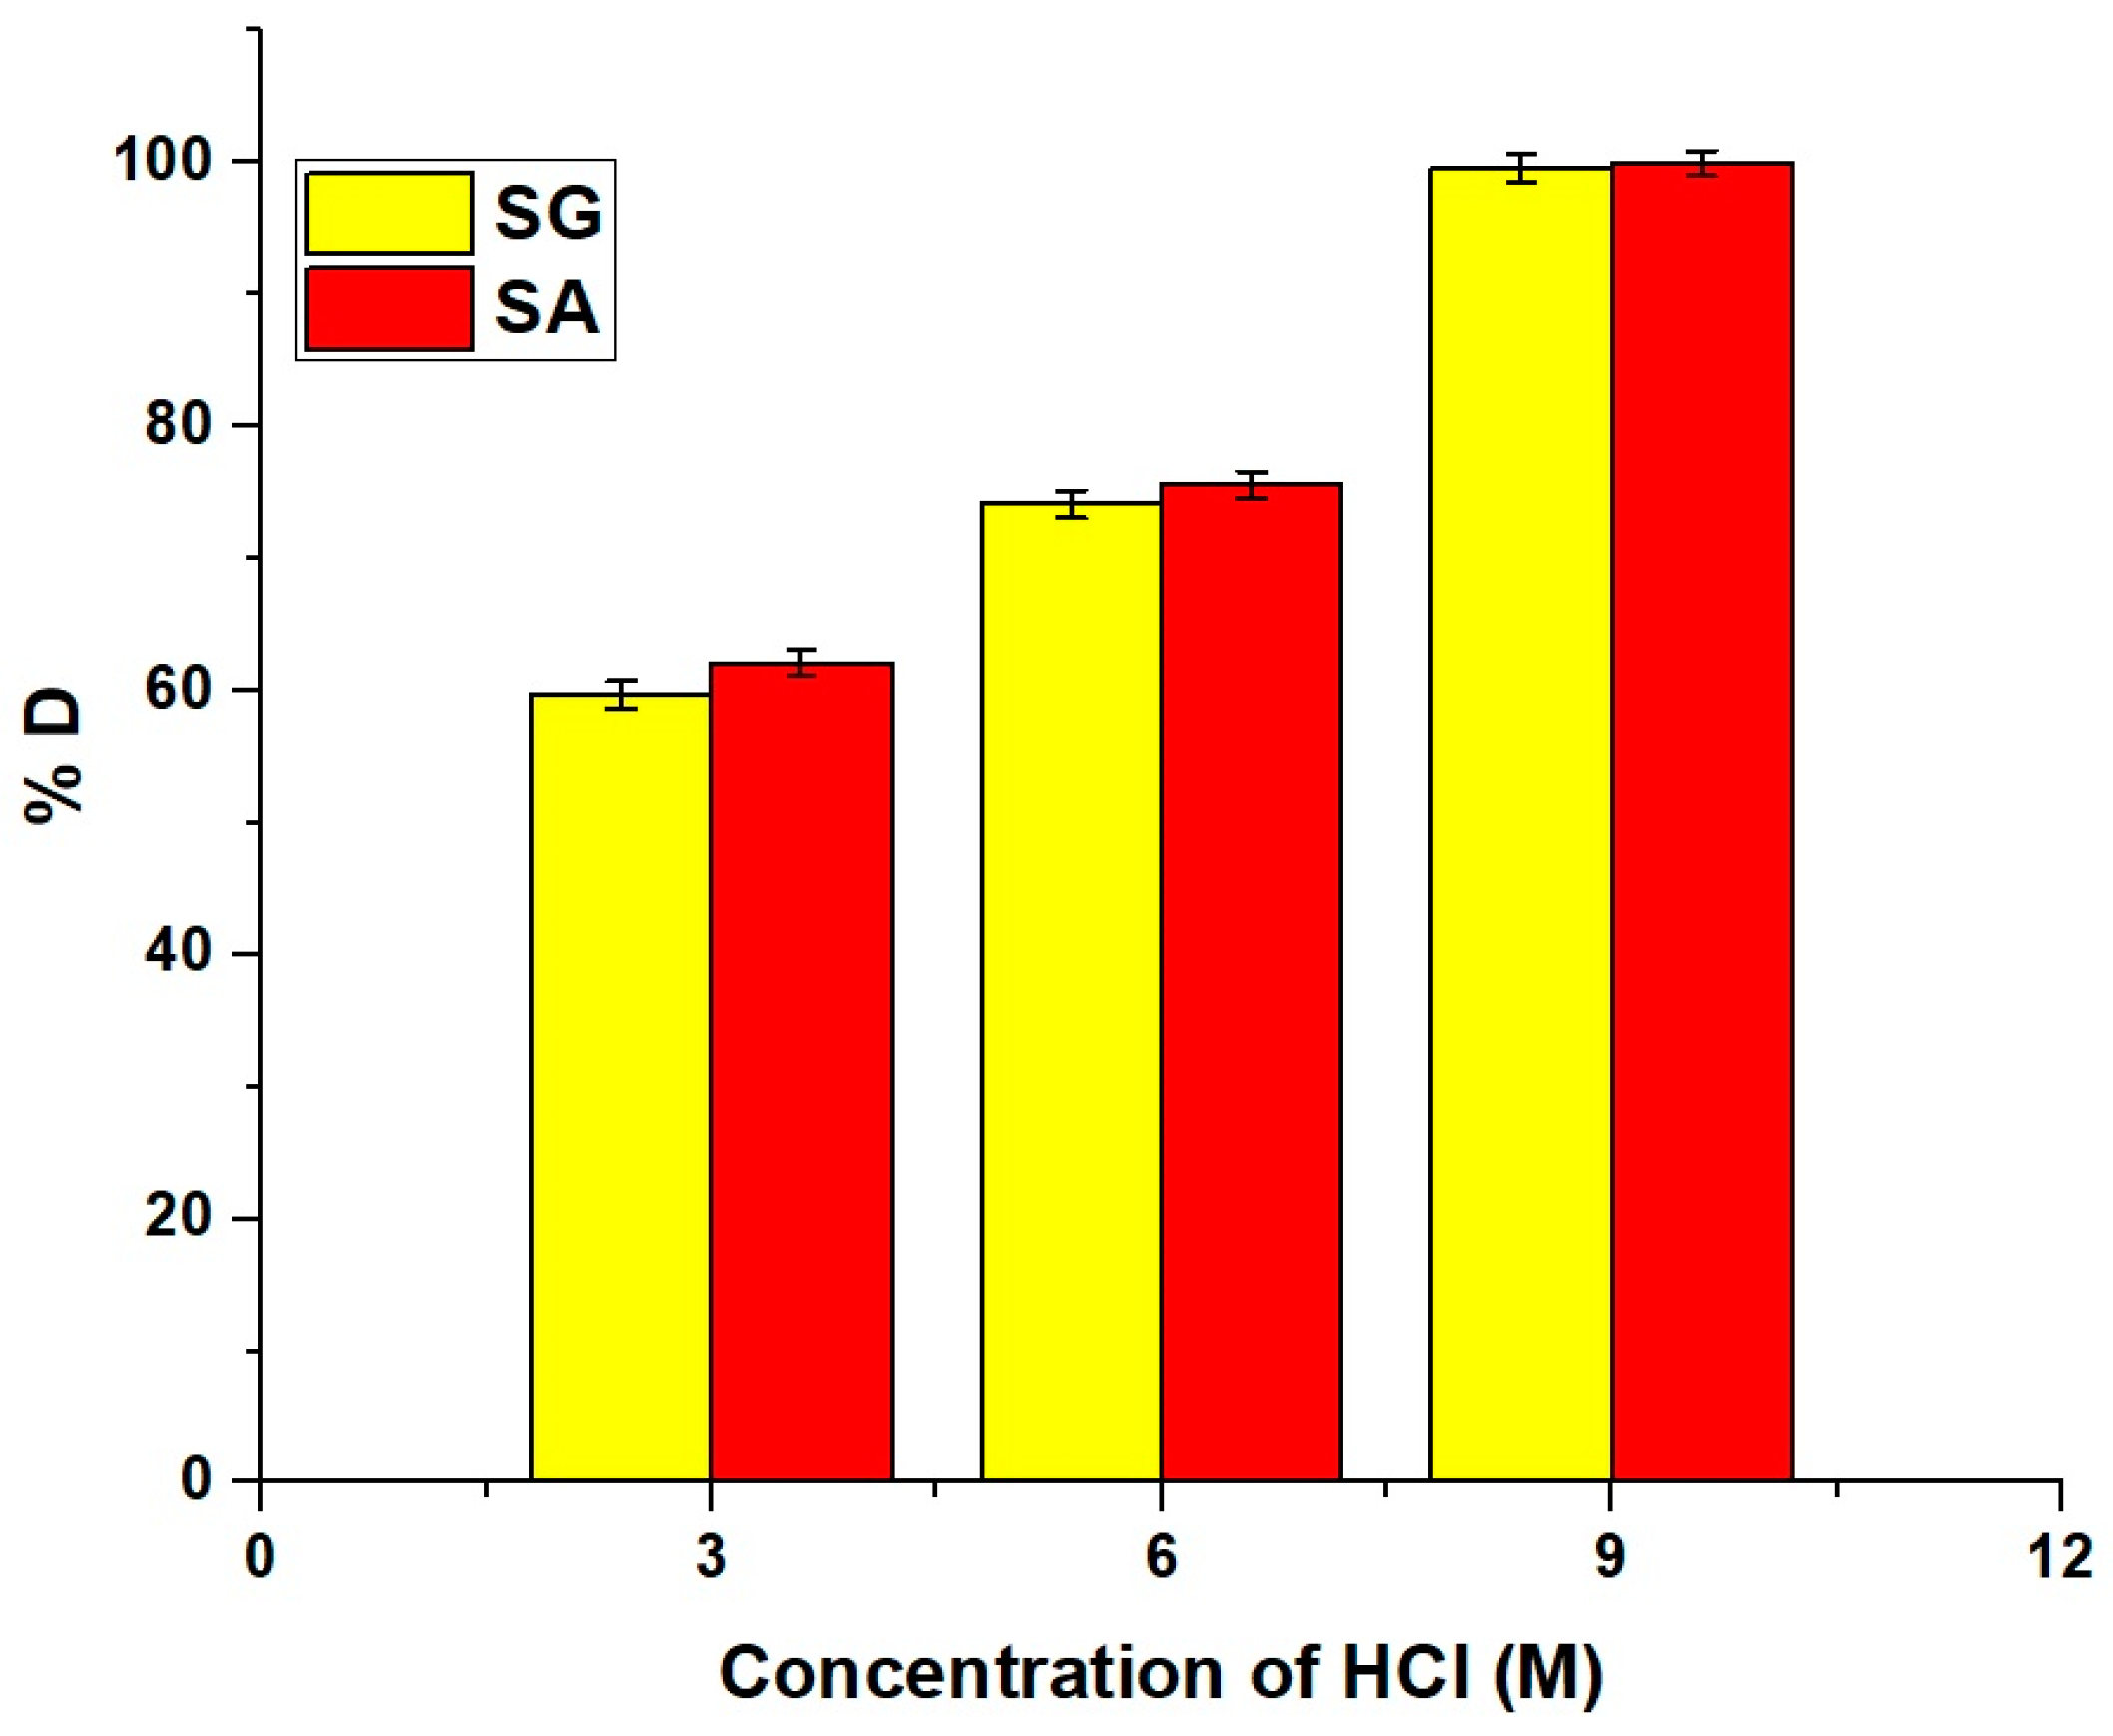
To evaluate the feasibility of regenerating and reusing the SG and SA adsorbents, desorption experiments were carried out using 50 mL of different HCl concentrations (3, 6, and 9 M) as an eluent for rhodamine b dye, as depicted in Figure 16. Additionally, the percentage of desorption (% D) of rhodamine b dye from the SG or SA adsorbents was calculated by applying equation 13 [41].
%   D = 100 C d V d ( C o C e ) V
Vd (L) and Cd (mg/L) are the volume of the eluting agent and the concentration of rhodamine b dye ions in the eluting agent, respectively. The results revealed that 9 M HCl efficiently eliminated rhodamine b dye, achieving a desorption efficiency of over 99%.
After undergoing acidic extraction, the regenerated SG and SA adsorbents were washed with distilled water to prime them for subsequent adsorption cycles. The effect of five consecutive adsorption/desorption cycles on the uptake of rhodamine b dye was examined, and the results are clarified in Figure 17. The data indicate a slight decrease in the percentage of rhodamine b dye sorption by the SG or SA adsorbents as the number of cycles increased. Therefore, it can be concluded that the SG and SA adsorbents demonstrate outstanding reusability for the sorption of rhodamine b dye.

2.2.6. Effect of Selectivity

Regarding the selectivity of the ZnFe2O4 nanoparticles, additional experiments were conducted in a ternary system to study the removal of different dyes, including crystal violet and methylene blue dyes, alongside rhodamine b dye. The initial concentration of each dye in the solution was set to 250 mg/L. A fixed adsorbent dosage of 0.05 g was used in 100 mL of the mixed dye solution. The pH was adjusted to 10 for consistency across all experiments, the contact time was 70 min, and the temperature was 298 K. The residual concentrations of each dye were measured using a UV-Vis spectrophotometer. The adsorption capacities of ZnFe2O4 nanoparticles for rhodamine b, crystal violet, and methylene blue from the mixed dye solution were compared to assess selectivity. The results, summarized in Table 8, demonstrate the adsorption performance for each dye. The ZnFe2O4 nanoparticles showed the highest adsorption capacity for rhodamine b, followed by crystal violet and methylene blue.

2.2.7. Practical Application

In a practical demonstration of the utility of ZnFe2O4 nanoparticles, experiments were conducted to assess the adsorption performance of the SG and SA samples in a student chemistry laboratory wastewater (containing rhodamine b dye). For these experiments, 0.05 g of each adsorbent type was introduced into 50 mL of wastewater sample containing rhodamine b dye at a concentration of 50 mg/L. The pH of the solution was adjusted to 10, and the system was maintained at room temperature for a contact time of 70 min to simulate typical laboratory conditions. The SG sample achieved a rhodamine b dye removal efficiency of 92.67%, while the SA sample demonstrated an enhanced removal efficiency of 96.34%. This significant efficacy in rhodamine b dye removal underscores the potential of ZnFe2O4 nanoparticles, particularly the SA type, for application in the wastewater treatment field.

3. Experimental Section

3.1. Materials

Potassium chloride (KCl), hydrochloric acid (HCl), glutamine (C5H10N2O3), sodium hydroxide (NaOH), zinc(II) nitrate hexahydrate (Zn(NO3)2·6H2O), L-arginine (C6H14N4O2), iron(III) nitrate nonahydrate (Fe(NO3)3·9H2O), and rhodamine b dye (C28H31N2O3Cl) were obtained from Sigma-Aldrich (St. Louis, MO, USA) and then consumed as received without refinement.

3.2. Synthesis of Zinc Ferrite (ZnFe2O4) Nanoparticles

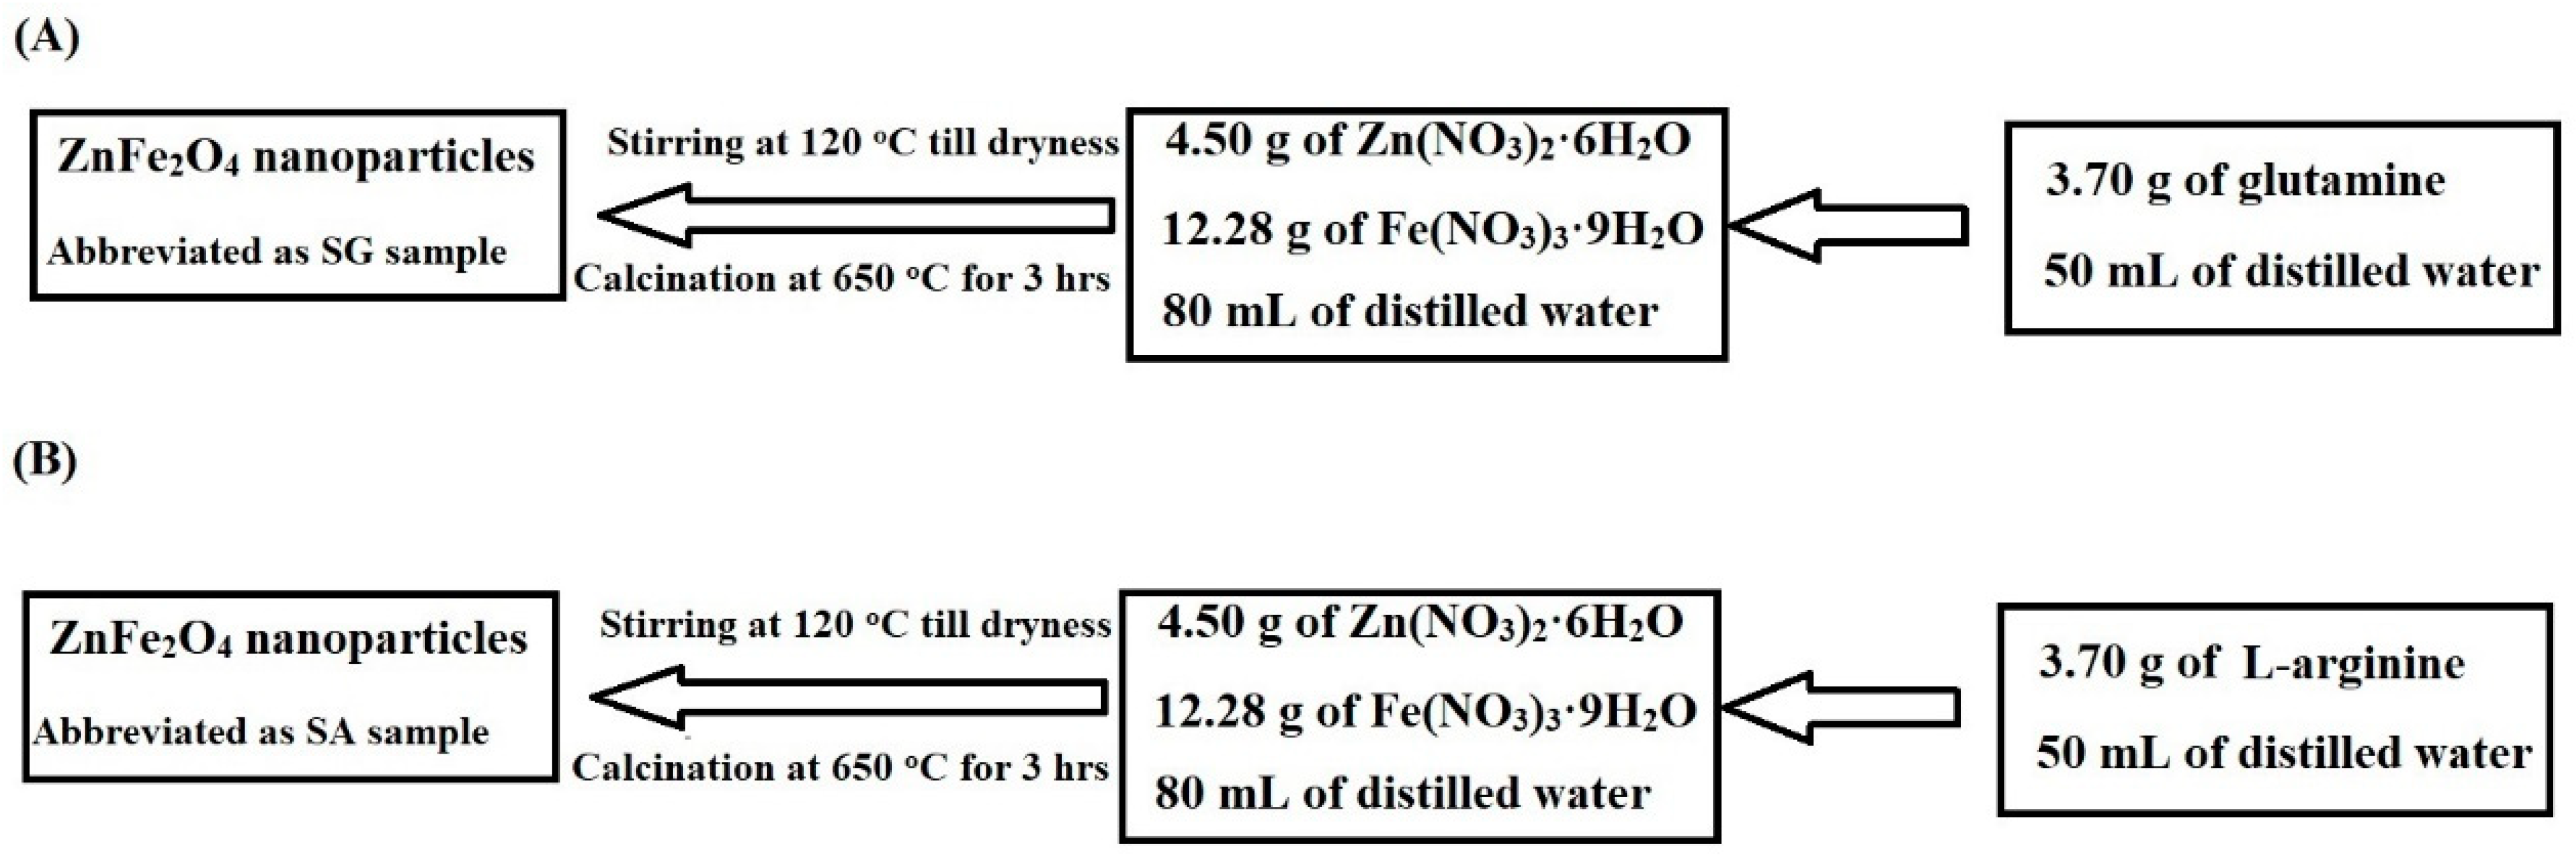
ZnFe2O4 nanoparticles were produced by the combustion approach [31] using two fuels: glutamine and L-arginine, as shown in Scheme 3A,B, respectively. In this regard, 4.50 g of zinc nitrate hexahydrate and 12.28 g of iron nitrate nonahydrate were dissolved in 80 mL of distilled water to prepare the metal precursor solution. Also, 3.70 g of glutamine or 3.11 g of L-arginine were dissolved in 50 mL of distilled water to prepare the fuel solution. After that, the fuel solution was added to the metal precursor solution with continuous stirring at 120 °C until complete evaporation of the solvent occurred. The dry powder obtained was subsequently calcined at 650 °C for 3 hrs to obtain ZnFe2O4 nanoparticles. The ZnFe2O4 nanoparticles, which were produced using L-arginine and glutamine fuels, were abbreviated as SA and SG samples, respectively.
The cost of producing ZnFe2O4 nanoparticles by the combustion method is approximately USD 0.65 /g.

3.3. Instrumentation

XRD analysis of the SG and SA samples was conducted utilizing a D8 Bruker Advance X-ray diffractometer equipped with KαCu radiation (λ = 1.54 Å). FT-IR spectra of the SG and SA samples were obtained utilizing a Perkin Elmer FTIR spectrometer, employing KBr pellets, within the range of 400–4000 cm−1. The surface textures of the SG and SA samples were obtained by a Quantachrome Nova 2000 N2 gas analyzer. The surface morphology and elemental constitution of the SG and SA products were obtained by a JEOL JSM6360 FE-SEM/EDX (JEOL Ltd., Akishima, Japan). The morphologies of the SG and SA products were investigated using a JEOL 2100 HR-TEM (JEOL Ltd., Akishima, Japan).

3.4. Adsorption of Rhodamine b Dye from Aqueous Media

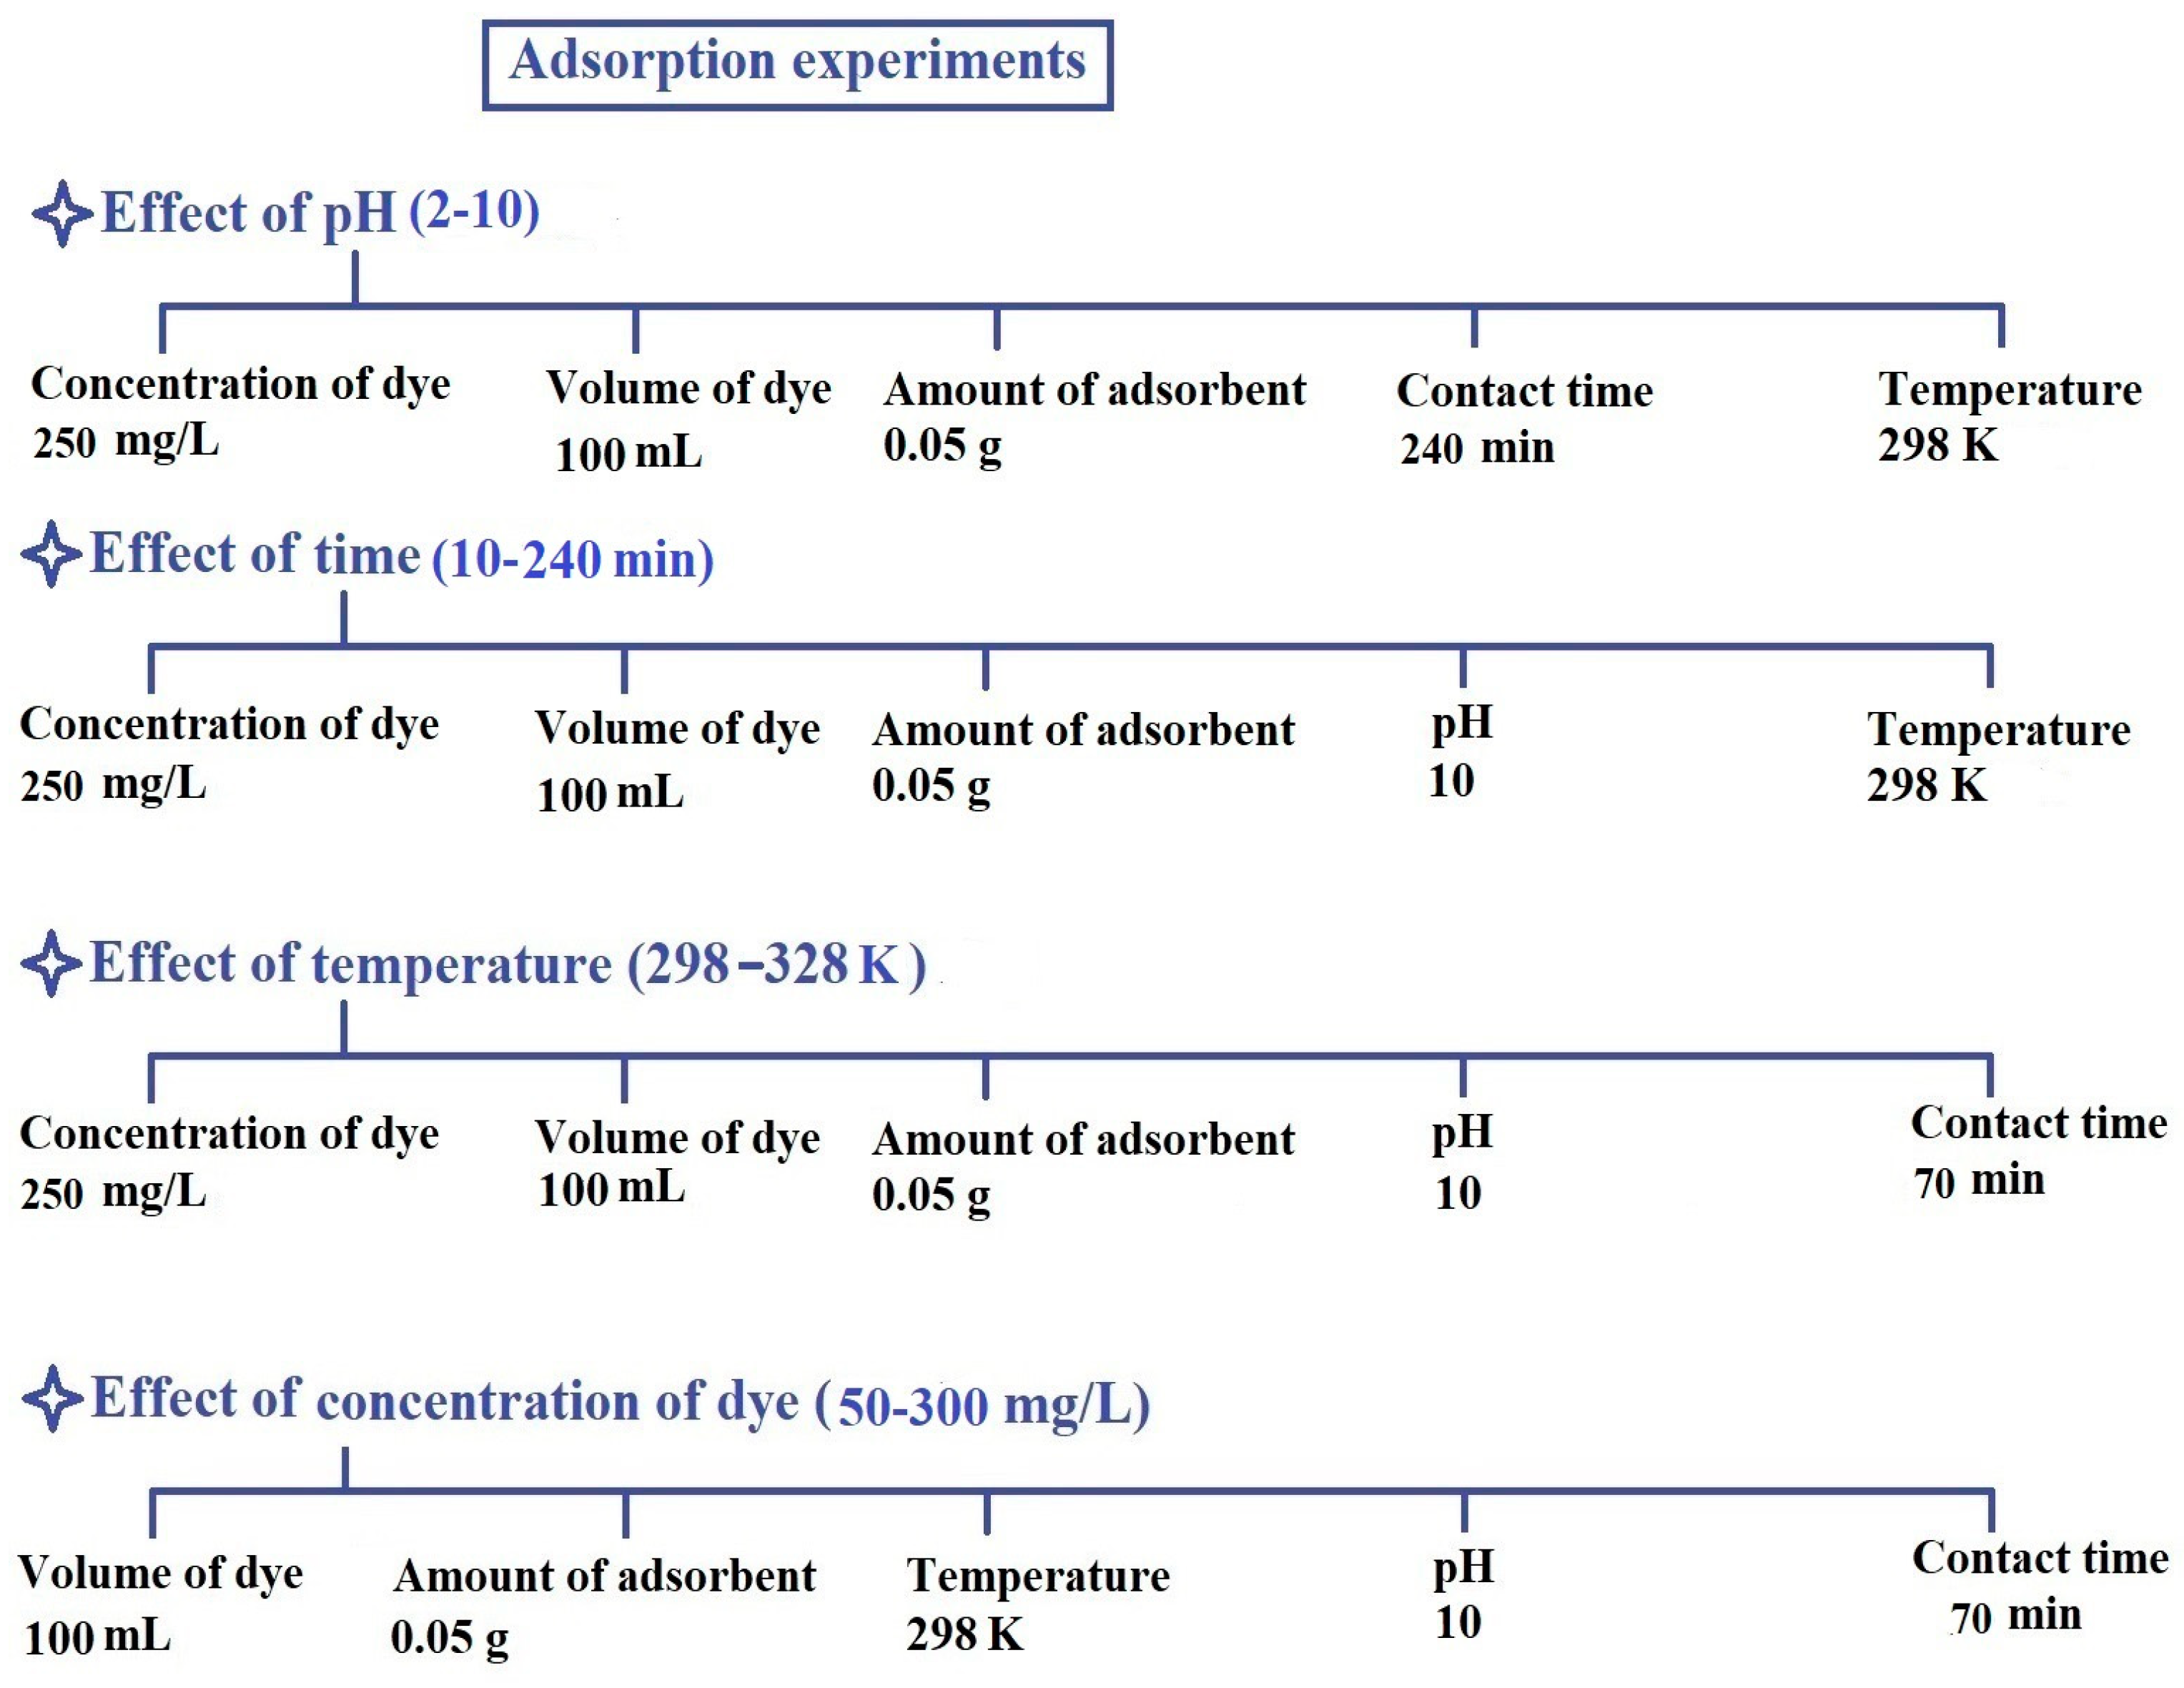
The adsorption experiments were conducted to evaluate the efficacy of the SG and SA products in the removal of rhodamine b dye. The impact of various parameters on the adsorption process was systematically investigated. All experiments were performed in the dark to ensure that the removal of rhodamine b dye was due to adsorption and not photocatalytic degradation. Initially, the effect of pH on rhodamine b dye adsorption was assessed over a 2–10 pH range. In these experiments, a rhodamine b dye concentration of 250 mg/L was utilized, with the volume of rhodamine b dye fixed at 100 mL and the amount of adsorbent set at 0.05 g. The mixture was allowed to interact for a contact time of 240 min at a constant temperature of 298 K. Subsequently, the effect of contact time was examined by varying the interaction period from 10 to 100 min. The concentration of rhodamine b dye and volume remained constant at 250 mg/L and 100 mL, respectively, with an adsorbent amount of 0.05 g. These experiments were carried out at a pH of 10 and a temperature of 298 K. In addition, the effect of temperature on the adsorption efficiency was explored within a 298–328 K range, maintaining the rhodamine b dye concentration, volume of rhodamine b dye, and amount of adsorbent at 250 mg/L, 100 mL, and 0.05 g, respectively. The pH was held at 10, with a fixed contact time of 70 min. Furthermore, the influence of rhodamine b dye concentration on the adsorption efficiency was studied by altering the concentration of rhodamine b dye from 50 to 300 mg/L. Each experiment was conducted with 100 mL of rhodamine b dye solution and 0.05 g of adsorbent at a pH of 10 and a temperature of 298 K for a duration of 70 min. In the final step, magnetic separation using a magnet was employed to remove the magnetic ZnFe2O4 nanoparticles, and the resulting filtrates underwent evaluation to measure the remaining concentration of rhodamine b dye with the aid of a Shimadzu 1800 UV/Vis spectrophotometer (Shimadzu Corporation, Kyoto, Japan). This magnetic separation technique is not only efficient but also cost-effective and simple to implement, ensuring that the nanoparticles do not pose a risk of secondary contamination in the effluent. Scheme 4 summarizes the previous practical steps for the removal of rhodamine b dye by the SG and SA products.
The ability of the SG or SA samples to adsorb rhodamine b dye was quantified through the measurement of adsorption capacity (O, mg/g) and adsorption efficiency (% A), using Equations (14) and (15), respectively [42,43,44].
O = C o C e × V W
% A = C o C e C o × 100
Co = concentration of rhodamine b dye before adsorption (mg/L), whereas Ce = concentration of rhodamine b dye at equilibrium (mg/L). In addition, V = volume of rhodamine b dye (L), whereas W = mass of the adsorbent (g).

3.5. Point of Zero Charge (pHPZC) of the SG and SA Samples

The point of zero charge (pHPZC) for both SG and SA samples was established through the batch equilibrium technique, utilizing 0.01 M KCl as the electrolyte solution [37,38]. For the experimental procedure, several 250 mL conical flasks were set up, each containing 60 mL of 0.01 M KCl. The initial pH values (pHi) of these solutions were adjusted to range from 2.5 to 11.5 using either NaOH or HCl. Following this, each flask received a precise addition of 0.10 g of the SG or SA sample. The samples in the flasks were then subjected to magnetic stirring for 10 hrs. Subsequent to the stirring, the final pH (pHf) for each solution was recorded. The pH shift (ΔpH) in each flask was determined by calculating the difference between the final and initial pH values. A graph plotting ΔpH against pHi was created for each type of sample. The pHPZC was identified at the pHi value where ΔpH equaled zero, indicating a neutral surface charge on the adsorbent where positive and negative charges are balanced [16].

4. Conclusions

This research is dedicated to the synthesis, examination, and application of ZnFe2O4 nanoparticles for the effective removal of rhodamine b dye from aqueous solutions. Utilizing the combustion method, these nanoparticles were synthesized with glutamine (SG) and L-arginine (SA) serving as fuels. Comprehensive analyses of the ZnFe2O4 nanoparticles were conducted using several techniques, such as XRD, FTIR, EDX, FE-SEM, HR-TEM, and BET. XRD results verified the nanoparticles’ cubic spinel formation, devoid of any contaminants, displaying average crystallite sizes of 43.72 nm for SG and 29.38 nm for SA. BET assessments indicated surface areas of 60 m2/g for SG and 85 m2/g for SA. Importantly, the SA sample demonstrated a higher efficiency in adsorbing rhodamine b dye, achieving 409.84 mg/g in contrast to 279.33 mg/g in the SG sample, attributed to its greater surface area and porosity. The removal processes of rhodamine b dye by the SG and SA samples adhered to a pseudo-second-order kinetic model and aligned with the Langmuir equilibrium isotherm. The synthesized ZnFe2O4 nanoparticles were utilized as promising adsorbents for the treatment of wastewater contaminated with rhodamine b dye. Hence, this method offers a potentially effective and sustainable approach to mitigating environmental pollution.

Author Contributions

A.S.A.-W. (Writing—review & editing, Funding acquisition), S.A. (Methodology, Conceptualization). All authors have read and agreed to the published version of the manuscript.

Funding

This research was funded by Princess Nourah bint Abdulrahman University Researchers Supporting Project number (PNURSP2024R35), Princess Nourah bint Abdulrahman University, Riyadh, Saudi Arabia.

Institutional Review Board Statement

Not applicable.

Informed Consent Statement

Not applicable.

Data Availability Statement

The original contributions presented in the study are included in the article, further inquiries can be directed to the corresponding author.

Acknowledgments

The authors are grateful to Princess Nourah bint Abdulrahman University, Riyadh, Saudi Arabia for funding this work through Researchers Supporting Project number (PNURSP2024R35).

Conflicts of Interest

The authors declare no conflicts of interest.

References

  1. Wang, J.; Zhou, L.; Rao, C.; Wang, G.L.; Jiang, F.; Singh, A.; Kumar, A.; Liu, J. Two 3D Supramolecular Isomeric Zn(II)-MOFs as Photocatalysts for Photodegradation of Methyl Violet Dye. Dye. Pigment. 2021, 190, 109285. [Google Scholar] [CrossRef]
  2. Singh, A.; Singh, A.K.; Liu, J.; Kumar, A. Syntheses, Design Strategies, and Photocatalytic Charge Dynamics of Metal-Organic Frameworks (MOFs): A Catalyzed Photo-Degradation Approach towards Organic Dyes. Catal. Sci. Technol. 2021, 11, 3946–3989. [Google Scholar] [CrossRef]
  3. Wang, J.; Rao, C.; Lu, L.; Zhang, S.; Muddassir, M.; Liu, J. Efficient Photocatalytic Degradation of Methyl Violet Using Two New 3D MOFs Directed by Different Carboxylate Spacers. CrystEngComm 2021, 23, 741–747. [Google Scholar] [CrossRef]
  4. El-habacha, M.; Miyah, Y.; Lagdali, S.; Mahmoudy, G.; Dabagh, A.; Chiban, M.; Sinan, F.; Iaich, S.; Zerbet, M. General Overview to Understand the Adsorption Mechanism of Textile Dyes and Heavy Metals on the Surface of Different Clay Materials. Arab. J. Chem. 2023, 16, 105248. [Google Scholar] [CrossRef]
  5. Sağlam, S.; Türk, F.N.; Arslanoğlu, H. Use and Applications of Metal-Organic Frameworks (MOF) in Dye Adsorption: Review. J. Environ. Chem. Eng. 2023, 11, 109285. [Google Scholar] [CrossRef]
  6. Han, Z.; Sun, L.; Chu, Y.; Wang, J.; Wei, C.; Jiang, Q.; Han, C.; Yan, H.; Song, X. States of Graphene Oxide and Surface Functional Groups amid Adsorption of Dyes and Heavy Metal Ions. Chin. J. Chem. Eng. 2023, 63, 197–208. [Google Scholar] [CrossRef]
  7. Osagie, C.; Othmani, A.; Ghosh, S.; Malloum, A.; Kashitarash Esfahani, Z.; Ahmadi, S. Dyes Adsorption from Aqueous Media through the Nanotechnology: A Review. J. Mater. Res. Technol. 2021, 14, 2195–2218. [Google Scholar] [CrossRef]
  8. Kuśmierek, K.; Fronczyk, J.; Świątkowski, A. Adsorptive Removal of Rhodamine B Dye from Aqueous Solutions Using Mineral Materials as Low-Cost Adsorbents. Water. Air. Soil Pollut. 2023, 234, 531. [Google Scholar] [CrossRef]
  9. He, H.; Chai, K.; Wu, T.; Qiu, Z.; Wang, S.; Hong, J. Adsorption of Rhodamine B from Simulated Waste Water onto Kaolin-Bentonite Composites. Materials 2022, 15, 4058. [Google Scholar] [CrossRef]
  10. Bustos-Terrones, Y.A.; Hermosillo-Nevárez, J.J.; Ramírez-Pereda, B.; Vaca, M.; Rangel-Peraza, J.G.; Bustos-Terrones, V.; Rojas-Valencia, M.N. Removal of BB9 Textile Dye by Biological, Physical, Chemical, and Electrochemical Treatments. J. Taiwan Inst. Chem. Eng. 2021, 121, 29–37. [Google Scholar] [CrossRef]
  11. Khasim, S.; Dastager, S.G.; Alahmdi, M.I.; Hamdalla, T.A.; Ulla, M.F.; Panneerselvam, C.; Makandar, M.B. Green Synthesis of Multifunctional Cu/MnO@Biochar 3D Structure as a High-Performance Anode Material in Li-Ion Batteries and Oxidative Removal of Cango-Red Dye. Case Stud. Chem. Environ. Eng. 2024, 9, 100561. [Google Scholar] [CrossRef]
  12. Barakat, N.A.M.; Omran, H.A.; Hassan, M.K.; Mohamed, A.F.; Backar, A.H.; Irfan, O.M.; Mohamed, O.A. Graphite-TiO2-Doped Coated Sand Granules for Efficient Continuous Removal of Methylene Blue Dye: Combining Adsorption and Photocatalytic Degradation. Results Eng. 2023, 20, 101646. [Google Scholar] [CrossRef]
  13. Mcyotto, F.; Wei, Q.; Macharia, D.K.; Huang, M.; Shen, C.; Chow, C.W.K. Effect of Dye Structure on Color Removal Efficiency by Coagulation. Chem. Eng. J. 2021, 405, 126674. [Google Scholar] [CrossRef]
  14. Abo-Ayad, Z.A.; Hussein, M.F.; Zayed, M.A.; Abdelraheem, O.H. GC–MS Identification of DR31 Textile Dye Degradation Products during Its Efficient Electrochemical Removal from Wastewater Media. J. Mol. Liq. 2024, 400, 124408. [Google Scholar] [CrossRef]
  15. Al-Kadhi, N.S.; Al-Senani, G.M.; Algethami, F.K.; Shah, R.K.; Saad, F.A.; ur Rehman, K.; Khezami, L.; Abdelrahman, E.A. Facile Synthesis of MgO/ZnO Nanocomposite for Efficient Removal of Alizarin Red S Dye from Aqueous Media. Inorg. Chem. Commun. 2024, 162, 112233. [Google Scholar] [CrossRef]
  16. Alghanmi, R.M.; Abdelrahman, E.A. Simple Production and Characterization of ZnO/MgO Nanocomposite as a Highly Effective Adsorbent for Eliminating Congo Red Dye from Water-Based Solutions. Inorg. Chem. Commun. 2024, 161, 112137. [Google Scholar] [CrossRef]
  17. Abdelrahman, E.A. Synthesis of Zeolite Nanostructures from Waste Aluminum Cans for Efficient Removal of Malachite Green Dye from Aqueous Media. J. Mol. Liq. 2018, 253, 72–82. [Google Scholar] [CrossRef]
  18. Al-Wasidi, A.S.; Saad, F.A.; Munshi, A.M.; Abdelrahman, E.A. Facile Synthesis and Characterization of Magnesium and Manganese Mixed Oxides for the Efficient Removal of Tartrazine Dye from Aqueous Media. RSC Adv. 2023, 13, 5656–5666. [Google Scholar] [CrossRef]
  19. Al-Wasidi, A.S.; Basha, M.T.; Alghanmi, R.M.; Al-Farraj, E.S.; Abdelrahman, E.A. Functionalization of Sodium Magnesium Silicate Hydroxide/Sodium Magnesium Silicate Hydrate Nanostructures Using 2,3-Dihydroxybenzaldehyde as a Novel Nanocomposite for the Efficient Removal of Cd(II) and Cu(II) Ions from Aqueous Media. Separations 2023, 10, 88. [Google Scholar] [CrossRef]
  20. Al, N.S.; Fawaz, K.; Reem, A.S.; Eida, K.S.; Farraj, S.A.; El, G.S.; Abdelrahman, E.A. A Facile Sol-Gel Synthesis and Characterization of MgCO3/MnCO3 and MgMn2O4/Mn2O3 Novel Nanostructures With Remarkably High Adsorption Activity Toward Eriochrome Black T Dye. J. Inorg. Organomet. Polym. Mater. 2023, 33, 2046–2057. [Google Scholar] [CrossRef]
  21. Behera, A.K.; Shadangi, K.P.; Sarangi, P.K. Efficient Removal of Rhodamine B Dye Using Biochar as an Adsorbent: Study the Performance, Kinetics, Thermodynamics, Adsorption Isotherms and Its Reusability. Chemosphere 2024, 354, 141702. [Google Scholar] [CrossRef]
  22. Pedebos, M.E.S.; Druzian, D.M.; Oviedo, L.R.; Ruiz, Y.P.M.; Galembeck, A.; Pavoski, G.; Espinosa, D.C.R.; da Silva, W.L. Removal of Rhodamine B Dye by Adsorption onto an Eco-Friendly Zeolite and Machine Learning Modeling. J. Photochem. Photobiol. A Chem. 2024, 449, 115404. [Google Scholar] [CrossRef]
  23. El Hassani, A.A.; Tanji, K.; El Mrabet, I.; Fahoul, Y.; El Gaidoumi, A.; Benjelloun, A.T.; Sfaira, M.; Zaitan, H.; Kherbeche, A. A Combined Molecular Dynamics Simulation, DFT Calculations, and Experimental Study of the Adsorption of Rhodamine B Dye on Kaolinite and Hydroxyapatite in Aqueous Solutions. Surfaces Interfaces 2023, 36, 102647. [Google Scholar] [CrossRef]
  24. Ouachtak, H.; El Haouti, R.; El Guerdaoui, A.; Haounati, R.; Amaterz, E.; Addi, A.A.; Akbal, F.; Taha, M.L. Experimental and Molecular Dynamics Simulation Study on the Adsorption of Rhodamine B Dye on Magnetic Montmorillonite Composite γ-Fe2O3@Mt. J. Mol. Liq. 2020, 309, 113142. [Google Scholar] [CrossRef]
  25. Al-Rashed, S.M.; Al-Gaid, A.A. Kinetic and Thermodynamic Studies on the Adsorption Behavior of Rhodamine B Dye on Duolite C-20 Resin. J. Saudi Chem. Soc. 2012, 16, 209–215. [Google Scholar] [CrossRef]
  26. Wang, S.; Yang, B.; Liu, Y. Synthesis of a Hierarchical SnS2 Nanostructure for Efficient Adsorption of Rhodamine B Dye. J. Colloid Interface Sci. 2017, 507, 225–233. [Google Scholar] [CrossRef]
  27. Madhurima, V.P.; Kumari, K.; Jain, P.K. Synthesis and Study of Carbon Nanomaterials through Arc Discharge Technique for Efficient Adsorption of Organic Dyes. Diam. Relat. Mater. 2024, 141, 110538. [Google Scholar] [CrossRef]
  28. El-Kammah, M.; Elkhatib, E.; Gouveia, S.; Cameselle, C.; Aboukila, E. Enhanced Removal of Indigo Carmine Dye from Textile Effluent Using Green Cost-Efficient Nanomaterial: Adsorption, Kinetics, Thermodynamics and Mechanisms. Sustain. Chem. Pharm. 2022, 29, 100753. [Google Scholar] [CrossRef]
  29. Kumari, S.; Khan, A.A.; Chowdhury, A.; Bhakta, A.K.; Mekhalif, Z.; Hussain, S. Efficient and Highly Selective Adsorption of Cationic Dyes and Removal of Ciprofloxacin Antibiotic by Surface Modified Nickel Sulfide Nanomaterials: Kinetics, Isotherm and Adsorption Mechanism. Colloids Surfaces A Physicochem. Eng. Asp. 2020, 586, 124264. [Google Scholar] [CrossRef]
  30. Singla, P.; Goel, N.; kumar, V.; Singhal, S. Boron Nitride Nanomaterials with Different Morphologies: Synthesis, Characterization and Efficient Application in Dye Adsorption. Ceram. Int. 2015, 41, 10565–10577. [Google Scholar] [CrossRef]
  31. Hegazey, R.M.; Abdelrahman, E.A.; Kotp, Y.H.; Hameed, A.M.; Subaihi, A. Facile Fabrication of Hematite Nanoparticles from Egyptian Insecticide Cans for Efficient Photocatalytic Degradation of Rhodamine B Dye. J. Mater. Res. Technol. 2020, 9, 1652–1661. [Google Scholar] [CrossRef]
  32. Abkenar, S.D.; Hassannezhad, M.; Hosseini, M.; Ganjali, M.R. Efficient Removal of Malachite Green from Aqueous Solution by Adsorption on Carbon Nanotubes Modified with ZnFe2O4 Nanoparticles. J. Serbian Chem. Soc. 2019, 84, 701–712. [Google Scholar] [CrossRef]
  33. Nguyen, U.T.P.; Bui, D.X.M.; Nguyen, T.T.T.; Nguyen, N.H.; Nguyen, D.T.C.; Tran, T.V. Green Synthesis of ZnFe2O4 Nanoparticles Using Chrysanthemum Spp. Flower Extract for the Adsorption and Photocatalytic Degradation of Malachite Green Dye. J. Chem. Technol. Biotechnol. 2022, 98, 2639–2654. [Google Scholar] [CrossRef]
  34. Abdulhamid, Z.M.; Dabbawala, A.A.; Delclos, T.; Straubinger, R.; Rueping, M.; Polychronopoulou, K.; Anjum, D.H. Synthesis, Characterization, and Preliminary Insights of ZnFe2O4 Nanoparticles into Potential Applications, with a Focus on Gas Sensing. Sci. Rep. 2023, 13, 19705. [Google Scholar] [CrossRef] [PubMed]
  35. Alharbi, A.; Abdelrahman, E.A. Efficient Photocatalytic Degradation of Malachite Green Dye Using Facilely Synthesized Hematite Nanoparticles from Egyptian Insecticide Cans. Spectrochim. Acta—Part A Mol. Biomol. Spectrosc. 2020, 226, 117612. [Google Scholar] [CrossRef]
  36. Saafan, S.A.; El-Nimr, M.K.; Hussein, M.M.; Omar, M.K. FTIR, DC, and AC Electrical Measurements of Mg Zn Nano-Ferrites and Their Composites with Polybenzoxazine. Appl. Phys. A Mater. Sci. Process. 2021, 127, 800. [Google Scholar] [CrossRef]
  37. Al-Kadhi, N.S.; Al-Senani, G.M.; Algethami, F.K.; Shah, R.K.; Saad, F.A.; Munshi, A.M.; Rehman, K.; Khezami, L.; Abdelrahman, E.A. Calcium Ferrite Nanoparticles: A Simple Synthesis Approach for the Effective Disposal of Congo Red Dye from Aqueous Environments. Inorganics 2024, 12, 69. [Google Scholar] [CrossRef]
  38. Alhalili, Z.; Abdelrahman, E.A. Facile Synthesis and Characterization of Manganese Ferrite Nanoparticles for the Successful Removal of Safranine T Dye from Aqueous Solutions. Inorganics 2024, 15, 30. [Google Scholar] [CrossRef]
  39. Koohi, P.; Rahbar-kelishami, A.; Shayesteh, H. Efficient Removal of Congo Red Dye Using Fe3O4/NiO Nanocomposite: Synthesis and Characterization. Environ. Technol. Innov. 2021, 23, 101559. [Google Scholar] [CrossRef]
  40. Abdelrahman, E.A.; Algethami, F.K.; Alsalem, H.S.; Binkadem, M.S. Facile Synthesis and Characterization of Novel Nanostructures for the Efficient Disposal of Crystal Violet Dye From. Inorganics 2023, 11, 339. [Google Scholar] [CrossRef]
  41. Shafeeq, K.; El, S.M.; Mostafa, R.; Reem, M.H.K.; Fawaz, K.S.; Mohamed, A.S. Functionalization of Calcium Silicate/Sodium Calcium Silicate Nanostructures with Chitosan and Chitosan/Glutaraldehyde as Novel Nanocomposites for the Efficient Adsorption of Cd(II) and Cu(II) Ions from Aqueous Solutions. Silicon 2023, 16, 1713–1730. [Google Scholar] [CrossRef]
  42. Al-Wasidi, A.S.; Algethami, F.K.; Saad, F.A.; Abdelrahman, E.A. Remarkable High Adsorption of Methylene Blue Dye from Aqueous Solutions Using Facilely Synthesized MgFe2O4 Nanoparticles. J. Inorg. Organomet. Polym. Mater. 2023, 33, 2035–2045. [Google Scholar] [CrossRef]
  43. Al-wasidi, A.S.; Katouah, H.A.; Saad, F.A.; Abdelrahman, E.A. Functionalization of Silica Nanoparticles by 5-Chloro-8-Quinolinol as a New Nanocomposite for the Efficient Removal and Preconcentration of Al3+ Ions from Water Samples. ACS Omega 2023, 8, 15276–15287. [Google Scholar] [CrossRef]
  44. Algethami, F.K.; Al, A.S.; Eida, W.; Al Farraj, S.; Katouah, H.A.; Abdelrahman, E.A. Discover Nano Facile Synthesis and Characterization of Fe3O4/Analcime Nanocomposite for the Efficient Removal of Cu(II) and Cd(II) Ions from Aqueous Media. Discov. Nano 2023, 18, 70. [Google Scholar] [CrossRef]
Scheme 1. Production of zinc ferrite (ZnFe2O4) nanoparticles by the combustion method using glutamine (A) and L-arginine (B) fuels.
Inorganics 12 00191 sch001
Figure 1. XRD analysis of the SG (A) and SA (B) products.
Inorganics 12 00191 g001
Figure 2. FTIR spectra of the SG (A) and SA (B) products.
Inorganics 12 00191 g002
Figure 3. EDX patterns of the SG (A) and SA (B) products.
Inorganics 12 00191 g003
Figure 4. FE-SEM analysis of the SG (A) and SA (B) products.
Inorganics 12 00191 g004
Figure 5. HR-TEM analysis of the SG (A) and SA (B) products.
Inorganics 12 00191 g005
Figure 6. N2 adsorption-desorption analysis of the SG (A) and SA (B) products.
Inorganics 12 00191 g006
Figure 7. Influence of pH on the adsorption of the rhodamine b dye by the SG and SA products (A). The point of zero charge of the SG and SA samples (B).
Inorganics 12 00191 g007
Scheme 2. Elimination mechanism of rhodamine b dye by ZnFe2O4 nanoparticles.
Inorganics 12 00191 sch002
Figure 8. Influence of contact time on the adsorption of the rhodamine b dye by the SG and SA samples.
Inorganics 12 00191 g008
Figure 9. Linear kinetic modeling of rhodamine b dye adsorption onto the SG and SA samples by the pseudo-first-order (A) and pseudo-second-order (B) kinetic plots.
Inorganics 12 00191 g009
Figure 10. Nonlinear kinetic modeling of rhodamine b dye adsorption onto the SG and SA samples by the pseudo-first-order (A) and pseudo-second-order (B) kinetic plots.
Inorganics 12 00191 g010
Figure 11. Influence of temperature on the adsorption of the rhodamine b dye by the SG and SA samples.
Inorganics 12 00191 g011
Figure 12. Thermodynamic analysis of rhodamine b dye adsorption on the SG and SA samples via Van’t Hoff plots.
Inorganics 12 00191 g012
Figure 13. Impact of initial dye concentration on the adsorption of the rhodamine b dye by the SG and SA samples.
Inorganics 12 00191 g013
Figure 14. Equilibrium linear modeling of rhodamine b dye adsorption onto the SG and SA samples by the Langmuir (A) and Freundlich (B) equilibrium plots.
Inorganics 12 00191 g014
Figure 15. Equilibrium nonlinear modeling of rhodamine b dye adsorption onto the SG and SA samples by the Langmuir (A) and Freundlich (B) equilibrium plots.
Inorganics 12 00191 g015
Figure 16. Effect of desorption of rhodamine b dye ions from the SG and SA adsorbents. Experimental conditions: contact time = 70 min, initial dye concentration = 250 mg/L, volume of dye = 100 mL, pH = 10, adsorbent dose = 0.05 g, temperature = 298 K, concentration of HCl eluting agent range = 3–9 M, volume of HCl = 50 mL, desorption time = 30 min.
Inorganics 12 00191 g016
Figure 17. Effect of reusability of the SG and SA adsorbents on the sorption of rhodamine b dye. Experimental conditions: initial dye concentration = 250 mg/L, volume of dye solution = 100 mL, amount of adsorbent = 0.05 g, pH = 10, contact adsorption time = 70 min, adsorption temperature = 298 K, concentration of HCl eluting agent = 9 M, volume of HCl = 50 mL, desorption time = 30 min.
Inorganics 12 00191 g017
Scheme 3. Practical procedure for the fabrication of SG (A) and SA (B) samples by the combustion method.
Inorganics 12 00191 sch003
Scheme 4. Experimental influences for the study of rhodamine b dye adsorption by the SG and SA products.
Inorganics 12 00191 sch004
Table 1. Surface textures of the SG and SA samples.
SampleBET Surface Area (m2/g)Total Pore Volume (cm3/g)Average Pore Size (nm)
SG600.09473.36
SA850.15383.77
Table 2. Comparative kinetic parameters of linear models for rhodamine b dye removal by the SG and SA samples.
SamplesOExp (mg/g)Pseudo-First-OrderPseudo-Second-Order
L1
(1/min)
Oe
(mg/g)
R2RSSL2 (g/mg.min)Oe
(mg/g)
R2RSS
SG268.060.01713223.380.98360.001290.00013273.970.99993.12 × 10−7
SA391.440.01801312.080.98180.001580.00011392.160.99981.70 × 10−6
Table 3. Comparative kinetic parameters of nonlinear models for rhodamine b dye removal by the SG and SA samples.
SamplesOExp (mg/g)Pseudo-First-OrderPseudo-Second-Order
L1
(1/min)
Oe
(mg/g)
R2χ2L2 (g/mg.min)Oe
(mg/g)
R2χ2
SG268.060.04110199.510.99695.601.26 × 10−4274.000.99990.0279
SA391.440.04661294.020.993425.021.06 × 10−4392.480.99980.8874
Table 4. Comparative thermodynamic constants for rhodamine b dye removal by the SG and SA samples.
SamplesΔS° (kJ/molK)ΔH° (kJ/mol)ΔG° (kJ/mol)
298308318328
SG0.03499−12.54−22.97−23.32−23.67−24.02
SA0.03318−14.82−24.71−25.04−25.37−25.70
Table 5. Comparative linear equilibrium constants for rhodamine b dye removal by the SG and SA samples.
SamplesLangmuirFreundlich
Omax
(mg/g)
L3
(L/mg)
R2RSSOmax (mg/g)L4
(mg/g)(L/mg)1/n
1/ZR2RSS
SG279.330.26150.99931.51 × 10−4344.9598.180.22760.66820.23738
SA409.840.25030.99942.26 × 10−5617.61117.460.30060.88320.13744
Table 6. Comparative nonlinear equilibrium constants for rhodamine b dye removal by the SG and SA samples.
SamplesLangmuirFreundlich
Omax
(mg/g)
L3
(L/mg)
R2χ2Omax (mg/g)L4
(mg/g)(L/mg)1/n
1/ZR2χ2
SG287.420.21920.9317353.11315.76123.190.17050.66001757.88
SA407.010.25360.9900140.35532.07145.610.23470.88491621.50
Table 7. Comparison of maximum adsorption capacities for various adsorbents, including the synthesized SG and SA samples.
AdsorbentOmax (mg/g)Ref.
Biochar169.5[21]
Zeolite259.17[22]
Kaolinite19.19[23]
Magnetic montmorillonite composite209.20[24]
Duolite C-20 resin28.571[25]
SnS2200.00[26]
SG279.33This study
SA409.84This study
Table 8. Adsorption capacities of ZnFe2O4 nanoparticles for different dyes in mixed solution.
DyeAdsorption Capacity (mg/g)
SGSA
Rhodamine b 110.67170.68
Crystal violet90.56138.24
Methylene blue78.10100.92
Disclaimer/Publisher’s Note: The statements, opinions and data contained in all publications are solely those of the individual author(s) and contributor(s) and not of MDPI and/or the editor(s). MDPI and/or the editor(s) disclaim responsibility for any injury to people or property resulting from any ideas, methods, instructions or products referred to in the content.