Article

Unraveling the Crystal Structure of Sodium Tetrabenzylborate: Synthesis through the Sodium Borohydride Reduction of Benzaldehyde in the Solid State

by
Carlos A. Castilla-Martinez
1,
Dominique Granier
2,
Pascal G. Yot
2 and
Umit B. Demirci
1,*
1
Institut Européen des Membranes, IEM—UMR 5635, Univ Montpellier, CNRS, ENSCM, Montpellier, France
2
Institut Charles Gerhardt Montpellier, ICGM—UMR 5253, Univ Montpellier, CNRS, ENSCM, Montpellier, France
*
Author to whom correspondence should be addressed.
Inorganics 2024, 12(7), 179; https://doi.org/10.3390/inorganics12070179
Submission received: 28 May 2024 / Revised: 20 June 2024 / Accepted: 22 June 2024 / Published: 27 June 2024
(This article belongs to the Section Inorganic Materials)

Abstract

:
We present the synthesis, characterization, and crystal structure of sodium tetrabenzylborate, a novel tetraalkoxyborate obtained via a direct mechanochemical reaction between benzaldehyde and sodium borohydride at room temperature. The molecular and crystal structures of this borate were investigated using 11B MAS NMR, IR spectroscopy, differential scanning calorimetry (DSC), and X-ray diffraction (XRD) analyses. Crystalline sodium tetrabenzylborate exists in two different crystal structures, which were elucidated using powder- and single-crystal-XRD analyses. At a low temperature (e.g., −100 °C), sodium tetrabenzylborate crystallizes in the monoclinic system with the space group P21 (No. 4), but at room temperature, it displays a crystallization in the tetragonal system with the space group I 4 ¯ (No. 82). According to the DSC analysis, the phase transition occurs at −45 °C. Upon hydrolysis, sodium tetrabenzylborate undergoes direct transformation into benzyl alcohol, thereby confirming the ability of sodium borohydride to convert an aldehyde into its primary alcohol analog. The key findings from our analyses are presented herein.

Graphical Abstract

1. Introduction

Sodium borohydride NaBH4 is a boron-based hydride that has been extensively investigated for its role as a hydrogen carrier and reducing agent [1,2,3]. It has long been recognized for its ability to convert aldehydes into primary alcohols and ketones into secondary alcohols. Alcohols find widespread applications across diverse industries, including chemical, energy and pharmaceutical sectors [4]. Several methods have been reported for the reduction of aldehydes and ketones into alcohols, ranging from synthesis in aprotic solvents to chemoselective reduction employing different additives such as polyethylene glycol dimethyl ethers, carbonates, catalysts, or ionic salts [5,6,7,8].
The reduction of aldehydes and ketones to alcohols by sodium borohydride involves a two-step process: initially, the nucleophilic hydride ion of sodium borohydride attacks the carbonyl group, forming a tetraalkoxyborate intermediate, which is subsequently protonated by water or an acid [5]. A more environmentally friendly approach for obtaining alcohols from aldehydes was proposed by Naimi-Jamal et al. [9], wherein the respective aldehyde, benzaldehyde CHO-C6H5 for example, was ball milled with sodium borohydride in a stoichiometric ratio in solvent-free conditions. This method directly yielded sodium tetrabenzylborate NaB(O-CH2-C6H5)4, which is the tetraalkoxyborate intermediate. However, little is known about the molecular and crystal structure of these tetraalkoxyborates, including sodium tetrabenzylborate. Therefore, this study reports the synthesis and characterization of sodium tetrabenzylborate obtained by the mechanochemical reaction between sodium borohydride and benzaldehyde. The resulting borate compound, sodium tetrabenzylborate, is a crystalline solid that exists in two allotropic forms. Its comprehensive characterization is presented hereafter.

2. Results

2.1. Sodium Tetrabenzylborate

A representative scheme of the reaction yielding benzyl alcohol and sodium metaborate tetrahydrate is shown in Figure 1. Through a mechanochemical reaction, sodium borohydride transfers one of its hydrides, H, to the carbon of the CHO group of benzaldehyde; concomitantly, the oxygen of CHO forms a bond with the electron-deficient B atom of sodium borohydride. In this way, sodium tetrabenzylborate is formed.
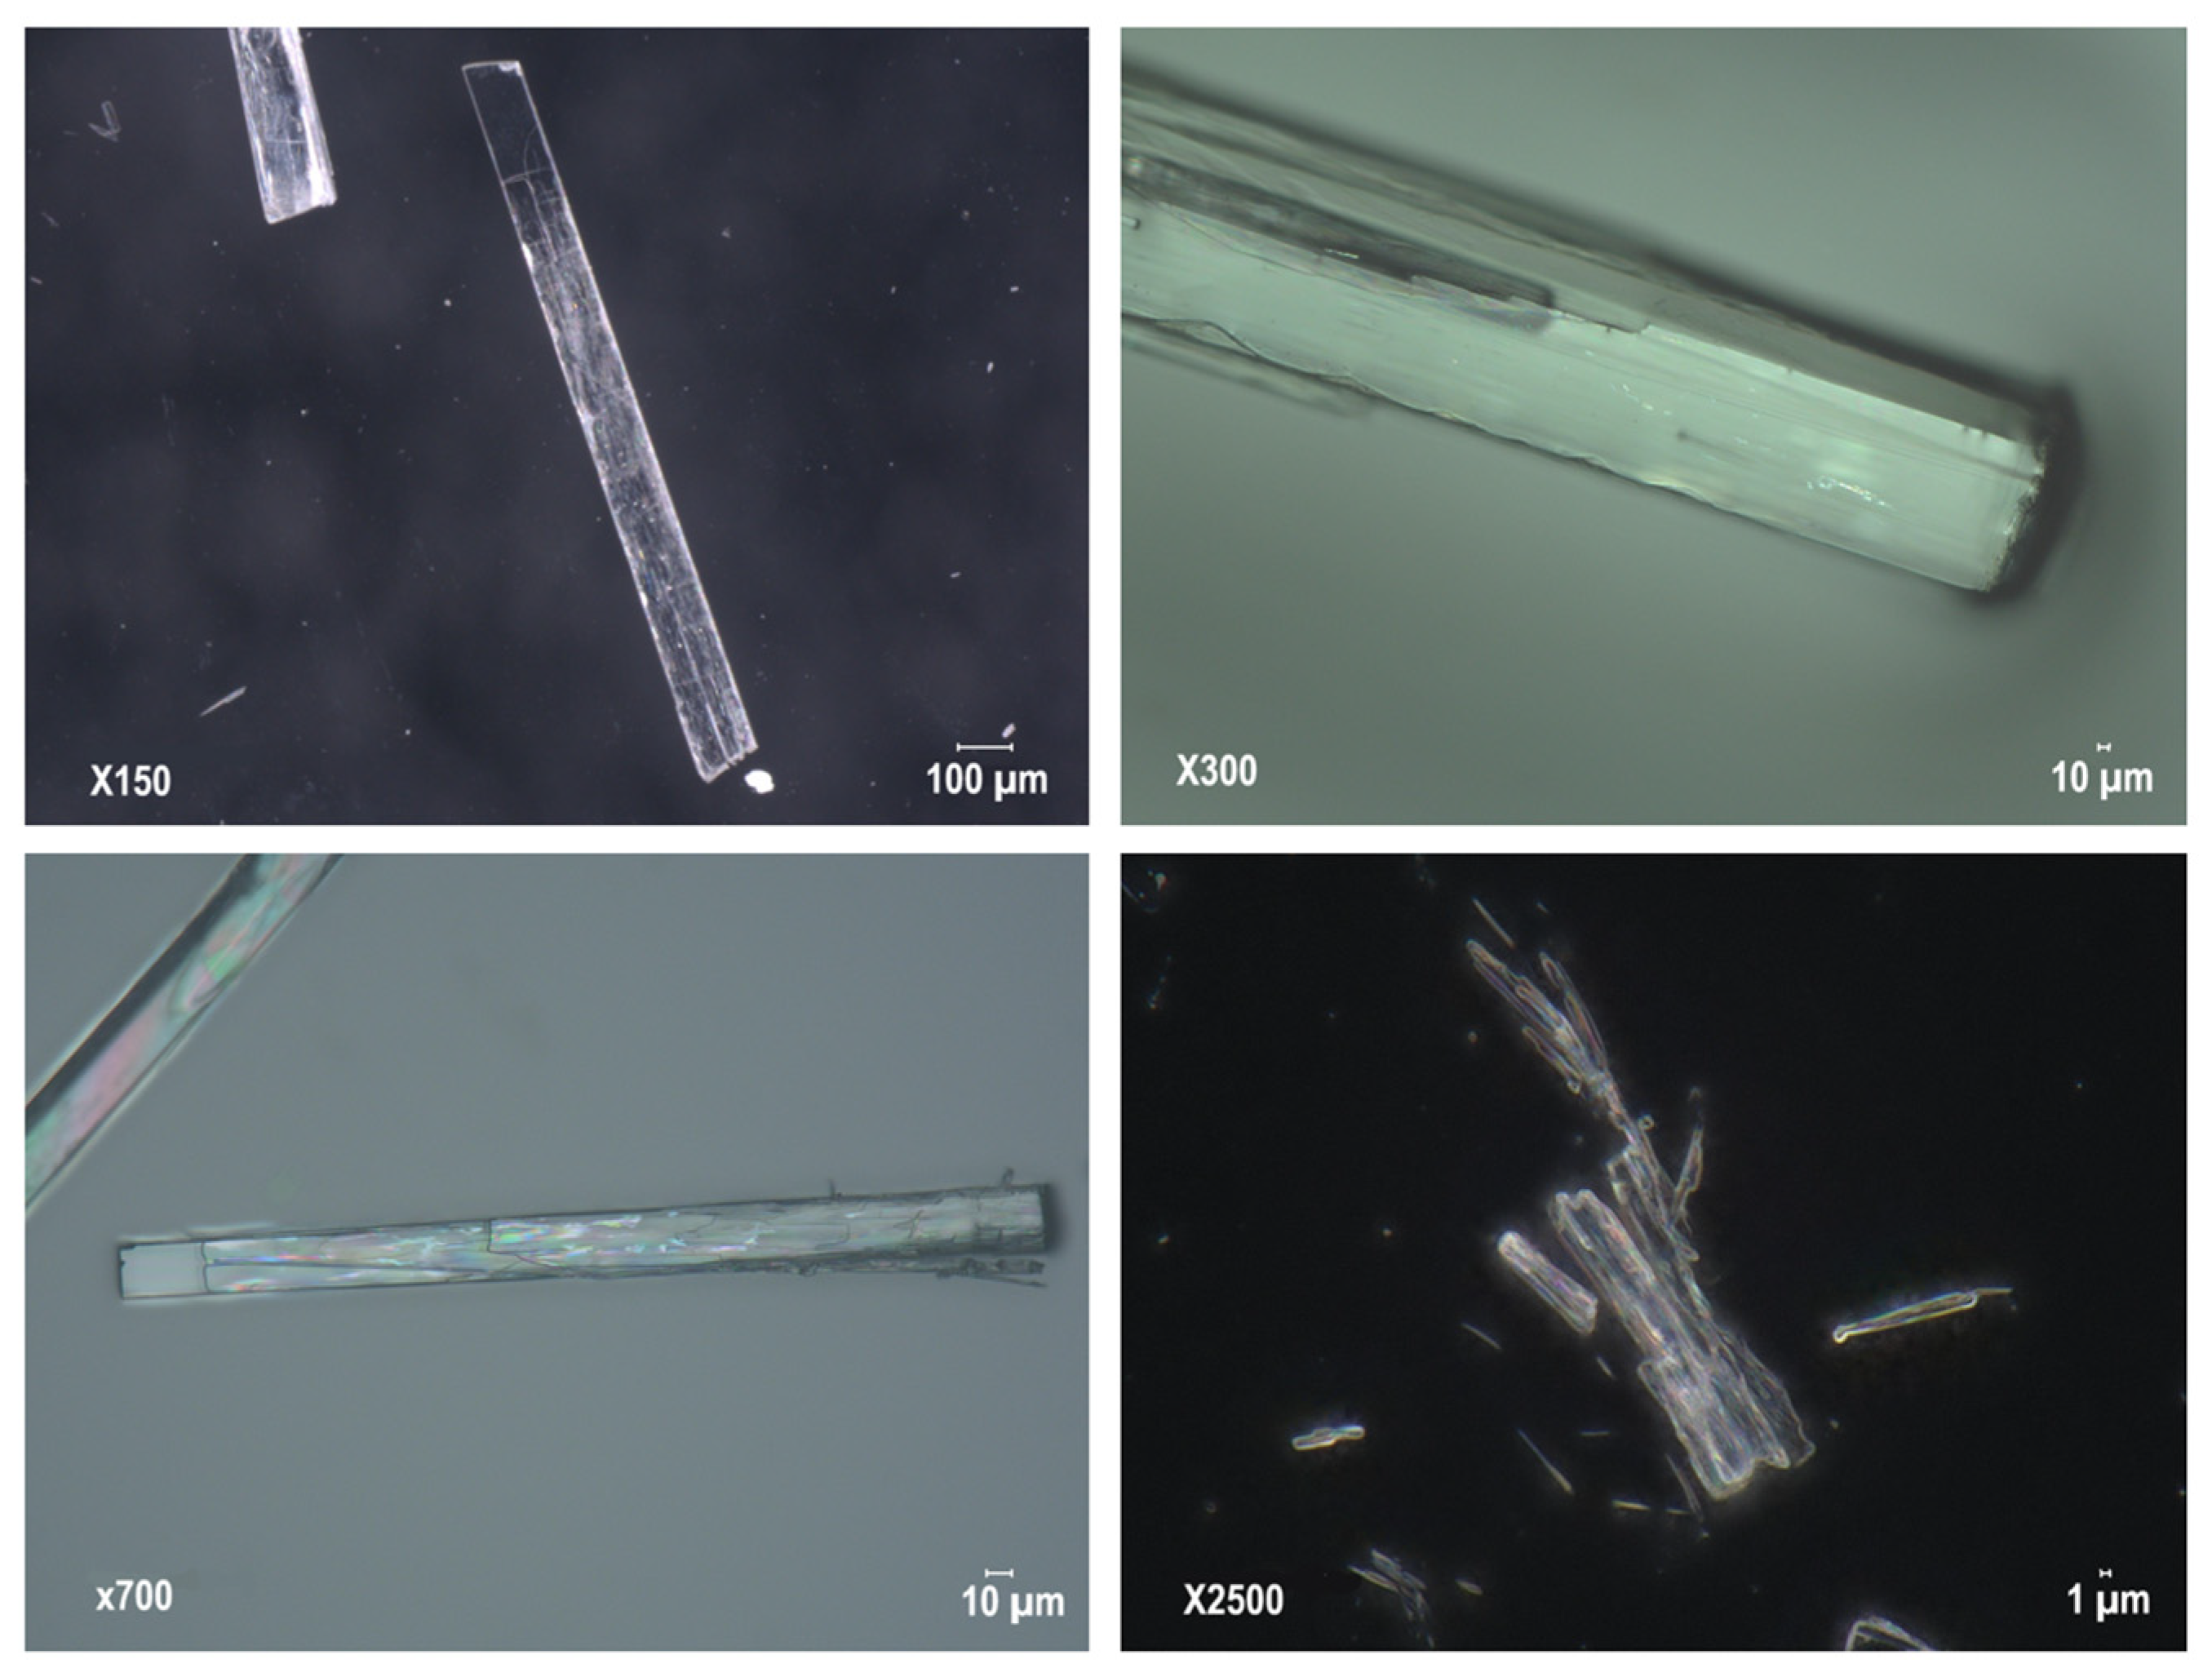
Sodium tetrabenzylborate crystals were grown from a dimethylformamide–cyclohexane system. The obtained crystals are colorless with a stick-shape morphology (Figure 2), with lengths varying between 0.1 and 0.5 mm and widths of about 100 µm.

2.2. Molecular Structure

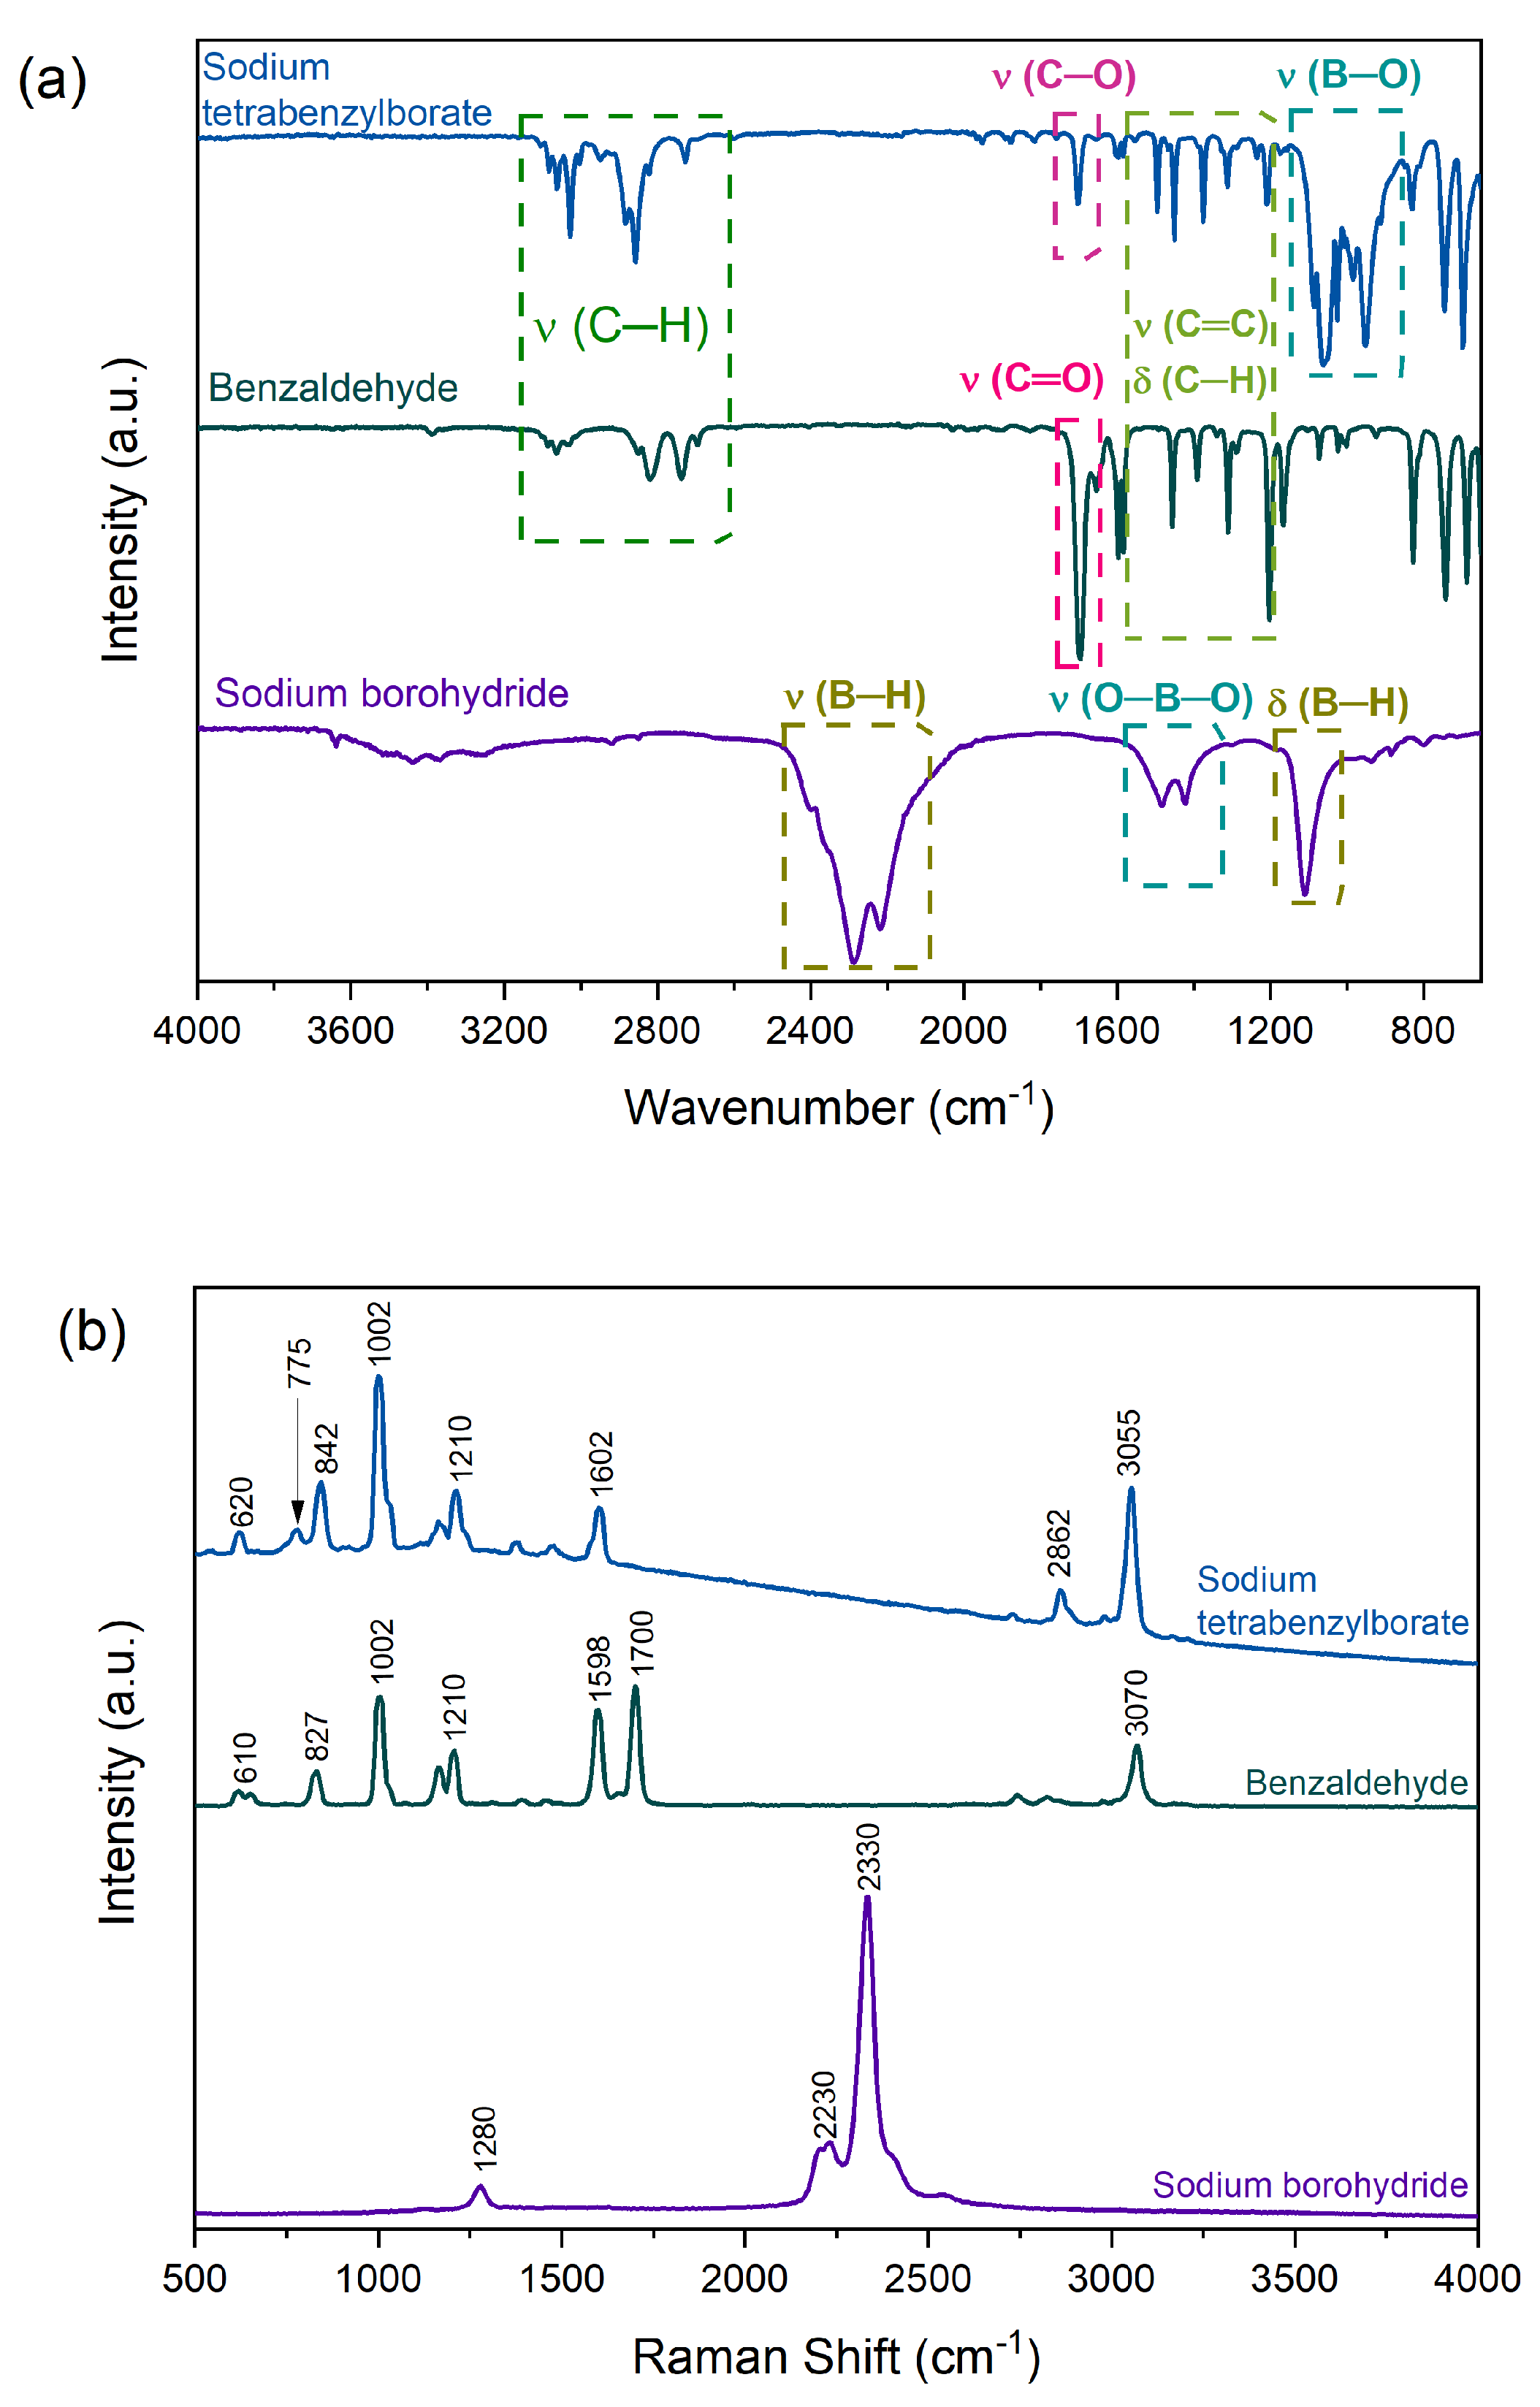
The IR spectra of sodium borohydride, benzaldehyde, and sodium tetrabenzylborate are depicted in Figure 3a. Sodium borohydride presents typical bands associated with metal borohydrides [10,11], with the bands between 2000 and 2500 cm−1 corresponding to the stretching mode of B–H bonds. The single peak seen at 1100 cm−1 indicates the tetrahedral symmetry of the [BH4] anion [12]. Additionally, bands at approximately 1400 cm−1 are attributed to the O–B–O bond [13] of sodium metaborate tetrahydrate NaB(OH)2·2H2O, which can be present as an impurity in commercial sodium borohydride, or by the spontaneous hydrolysis of NaBH4 during the IR analysis of the sample. This also explains the broad low-intensity band between 3200 and 3600 cm−1, which is characteristic of O–H bonds. The spectrum of benzaldehyde displays all of the expected bands characteristic of this compound [14], including the C–H stretching vibrational bands of the benzene ring and the aldehyde functional group between 2700 and 3200 cm−1, the stretching mode of the C=O bond at 1700 cm−1, and the bending C–H and stretching C=C vibrational modes between 1200 and 1600 cm−1. The spectrum of sodium tetrabenzylborate exhibits some differences from that of benzaldehyde. The stretching vibrational bands of the C–H bond are shifted and increased in intensity, suggesting a different chemical environment for the compound. The bands at ca. 1700 cm−1 have a reduced intensity, indicating a C–O bond instead. Intense bands appear between 800 and 1200 cm−1, attributed to the asymmetrical stretching modes of tetraborate BO4 [15], confirming the successful formation of sodium tetrabenzylborate.
Raman spectroscopy analysis was also conducted on sodium borohydride, benzaldehyde and sodium tetrabenzylborate (Figure 3b). Sodium borohydride shows two sets of vibrational modes: one at 1280 cm−1, corresponding to the symmetric bending mode of the BH4 anion, and the other corresponding to the stretching modes between 2230 cm−1 (asymmetric) and 2330 cm−1 (symmetric) [10]. The spectra of benzaldehyde and sodium tetrabenzylborate exhibit similar bands with some differences. The more intense repeating bands assigned to benzaldehyde/sodium tetrabenzylborate are as follows: 610/620 cm−1, 1002/1002 cm−1, and 1598/1602 cm−1 for the aromatic ring modes; 827/842 cm−1 for the bending mode of the CCO; and 1210/1210 cm−1 for the stretching mode of the C–C of the same CCO group [16]. There are noticeable differences between the two spectra. For instance, the band at 1700 cm−1 corresponding to the C=O stretching in benzaldehyde is absent in sodium tetrabenzylborate. In the latter, the bands between 2800 and 3100 cm−1 are more intense due to the hydrogenation from the O=CH group to O–CH2. Additionally, a band at 775 cm−1 appears in the spectrum of sodium tetrabenzylborate, attributed to the formation of the B–O bonds [17].
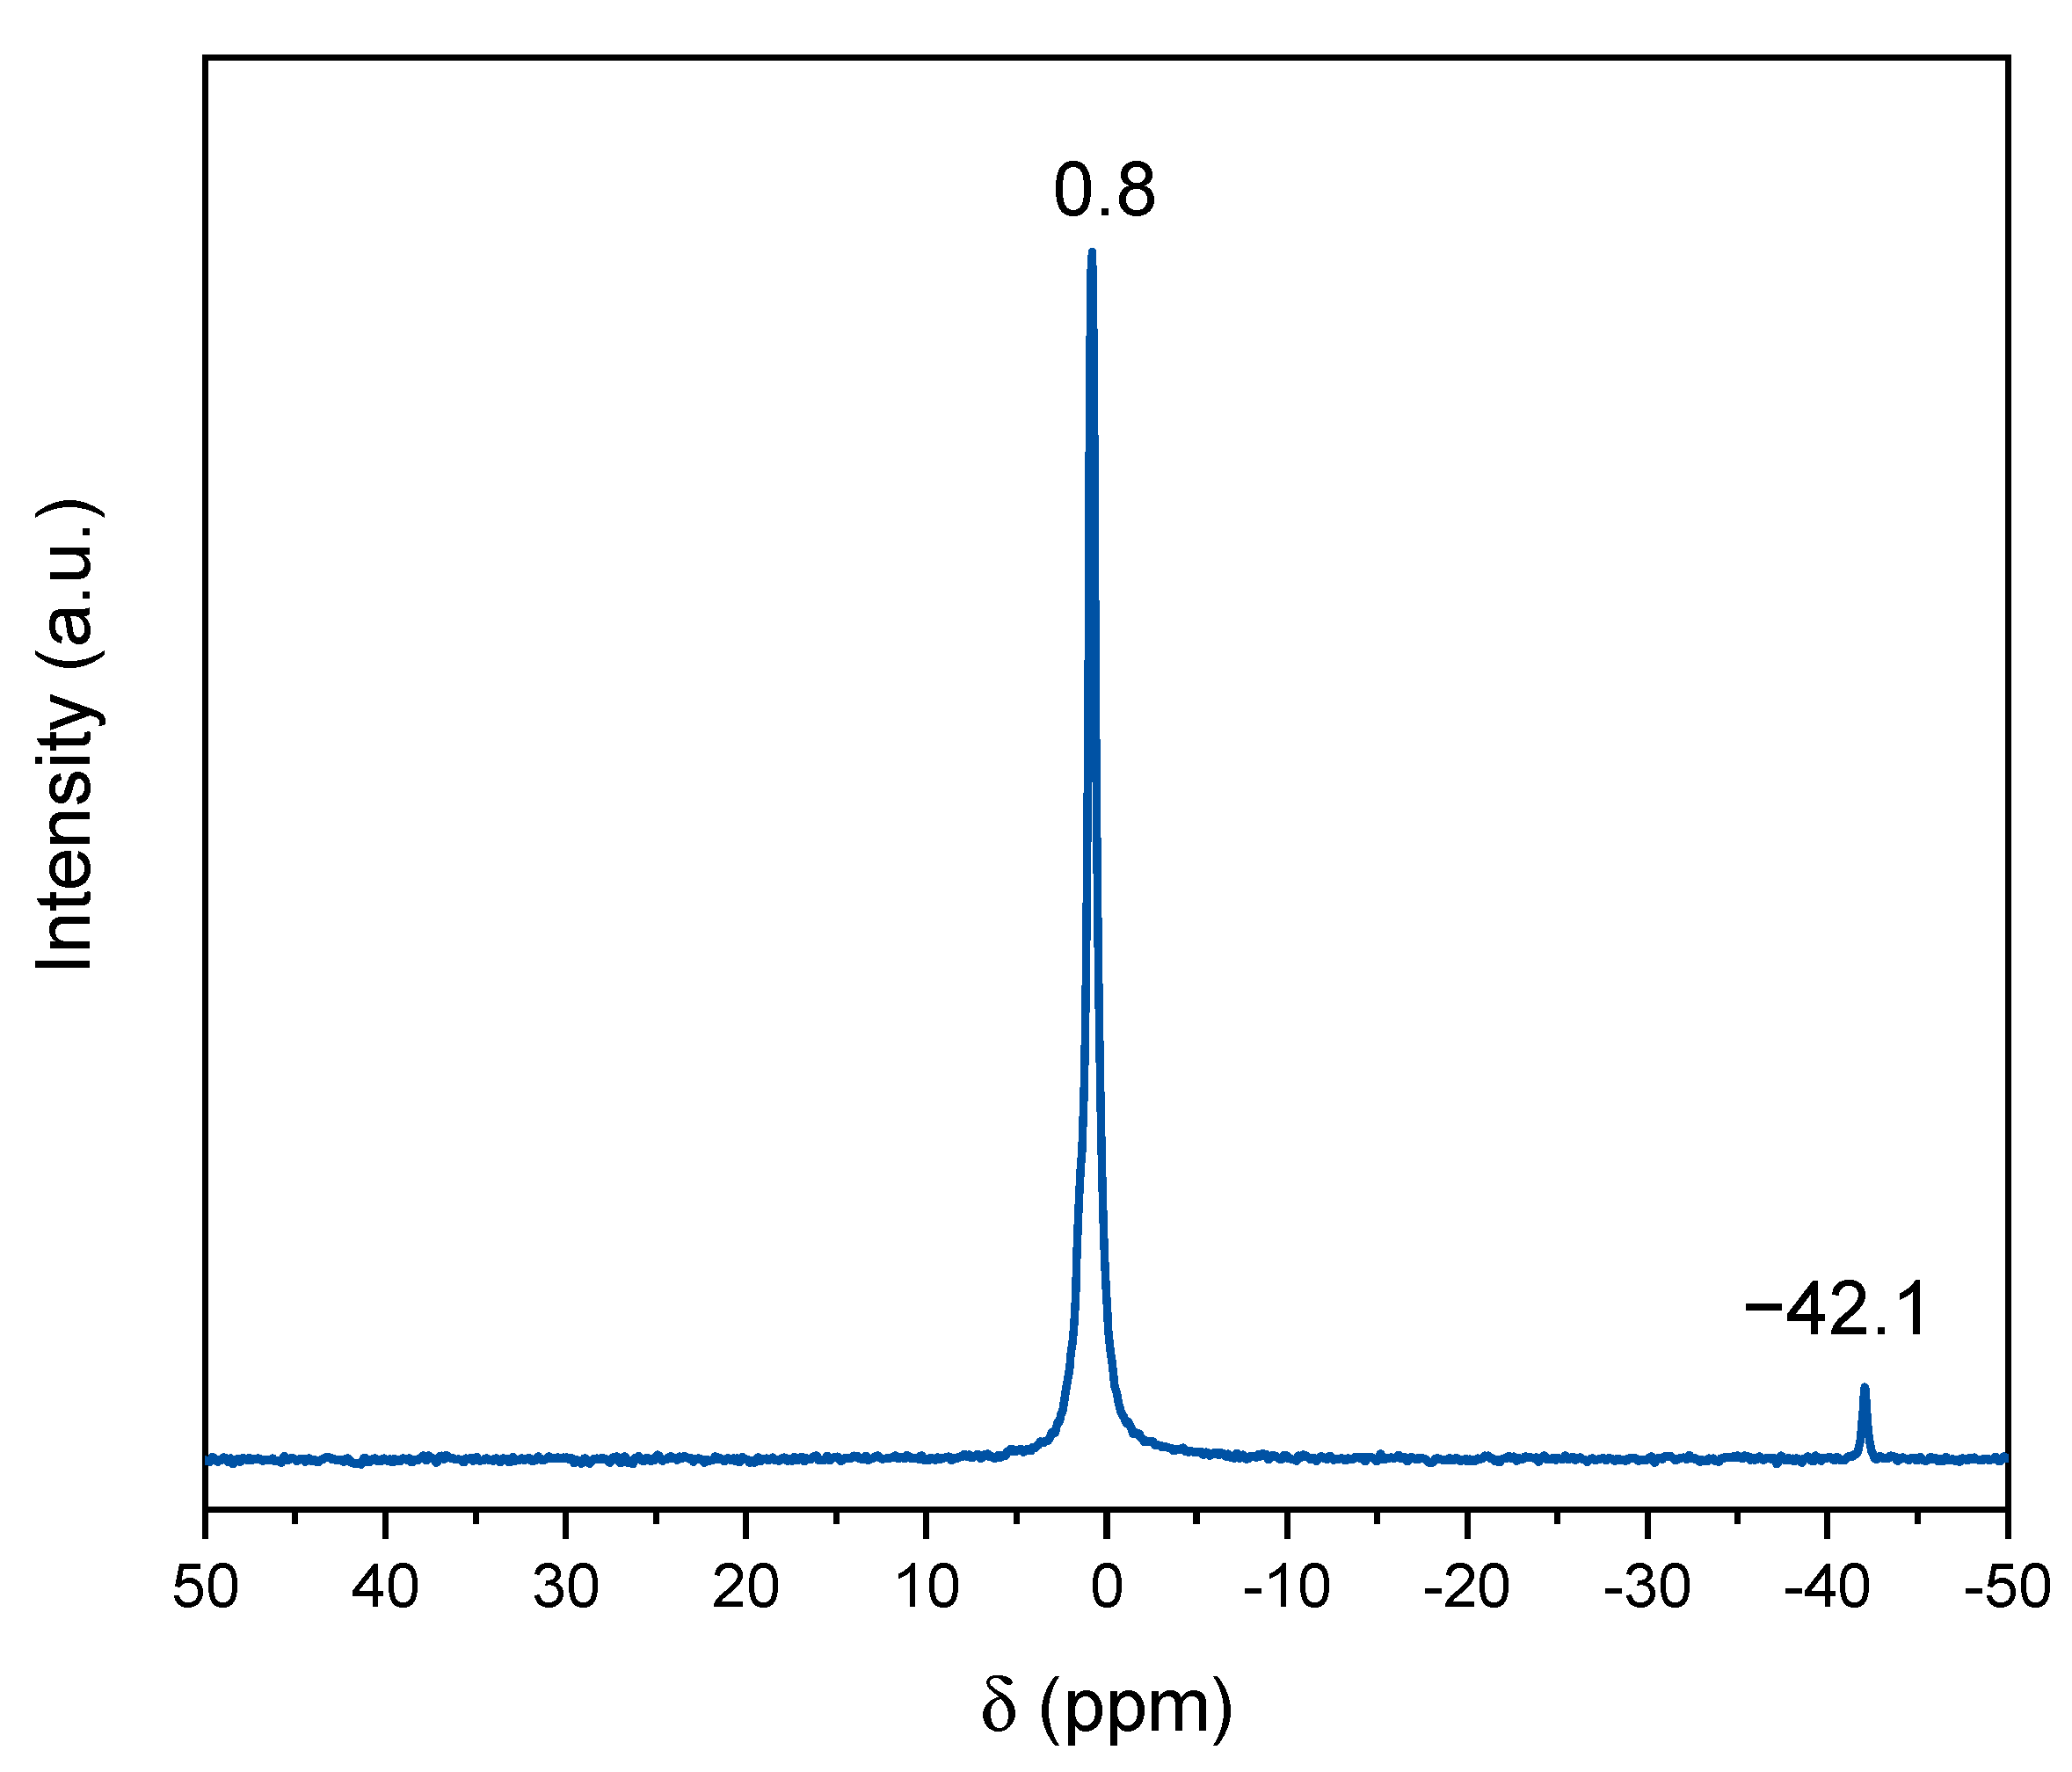
Sodium tetrabenzylborate was then analyzed by means of 11B MAS NMR (Figure 4), revealing two peaks in the spectrum. The first peak, centered at 0.8 ppm, is characteristic of borates [18,19]. This signal arises from BO4 environments, which is consistent with the structure of sodium tetrabenzylborate. Additionally, a small signal is observed at −42 ppm; it is attributed to a BH4 environment, likely due to residual sodium borohydride upon the mechanochemical process.

2.3. Thermal Analysis

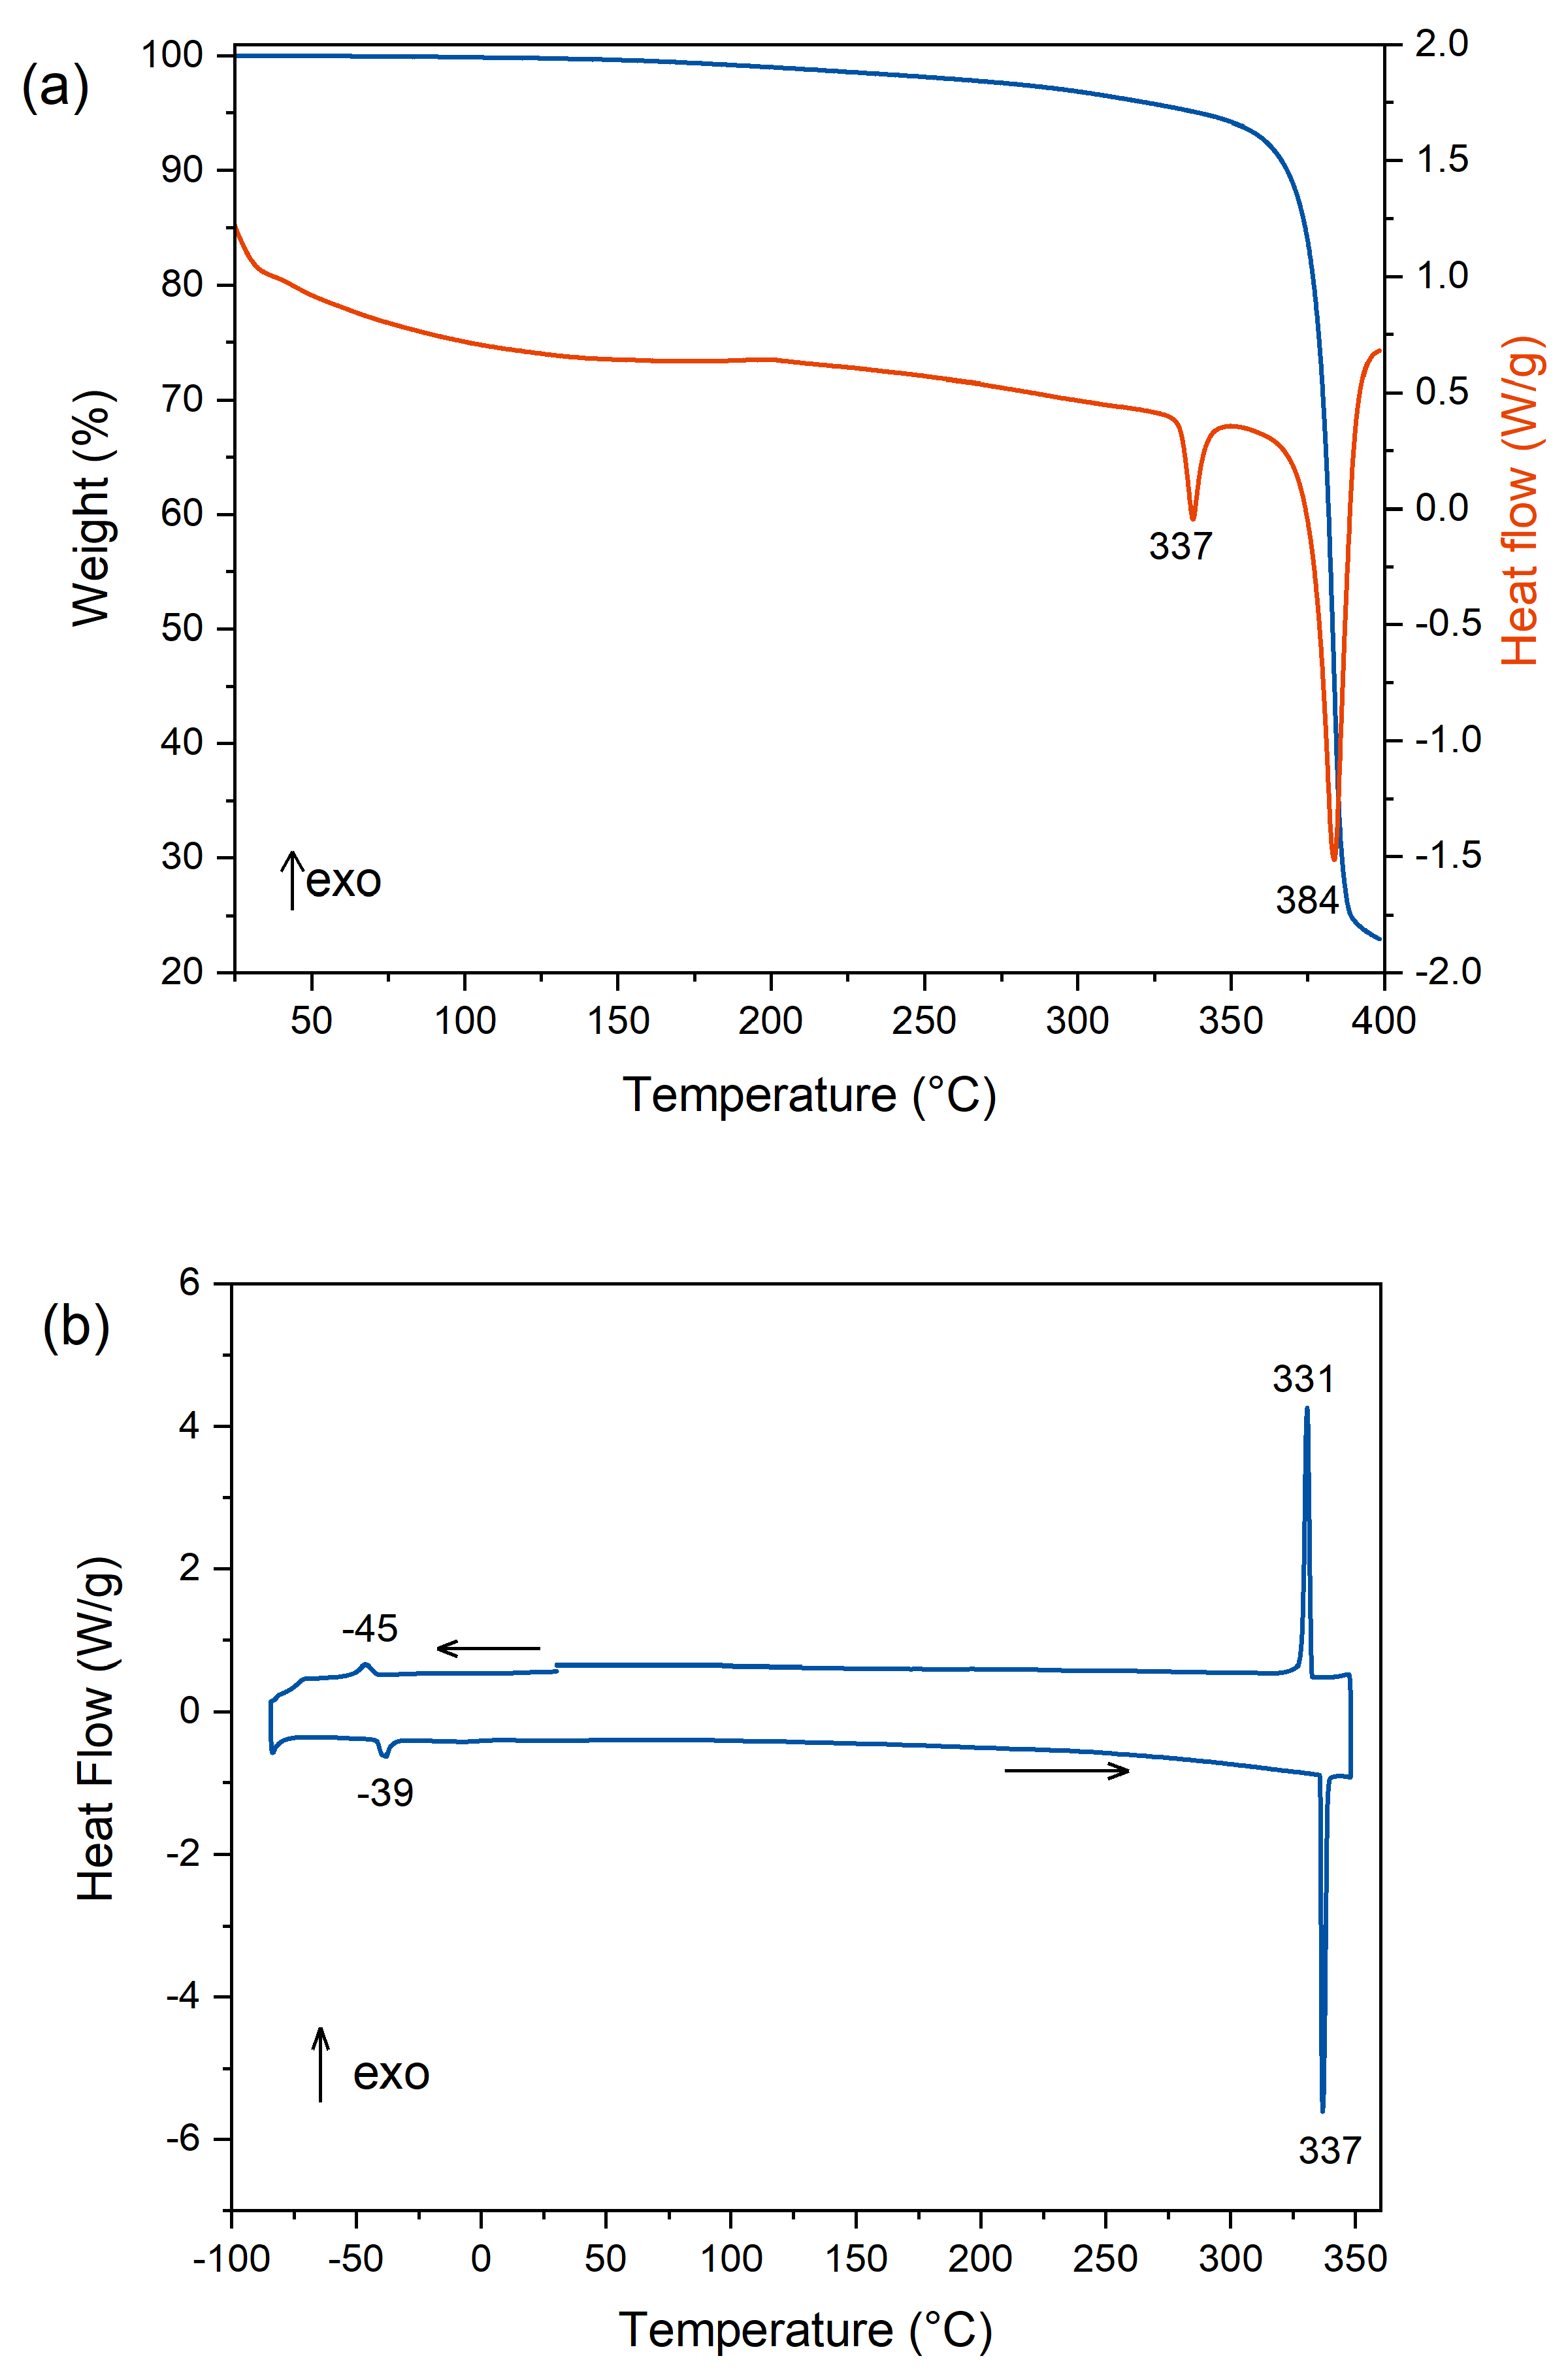
A simultaneous TGA-DSC analysis was carried out to investigate the thermal behavior of sodium tetrabenzylborate (Figure 5a). The compound is stable up to 150 °C. From 150 to 350 °C, there is a slow decomposition, and the compound loses 6 wt. %; subsequently, the material decomposes and the mass loss is about 70 wt. % between 350 and 400 °C. The DSC curve shows a first endothermic peak at 337 °C, suggesting the melting of the material. This is followed by an endothermic event that peaks at 384 °C, which is likely due to material decomposition.
To gain a more comprehensive understanding of the thermal behavior of the compound, a cyclic DSC analysis was performed (Figure 5b). The sample was first cooled down and then heated. The curve revealed a reversible phenomenon that occurs at −45 °C during cooling (exothermic) and at −39 °C during heating (endothermic). These peaks indicate a crystalline phase transition (as discussed hereafter). Upon further heating, a second endothermic event is observed at 337 °C, which aligns well with the melting already observed through TGA-DSC analysis (Figure 5a). The counterpart of this event is the exothermic peak at 331 °C, which is due to the solidification of the sodium tetrabenzylborate melt.

2.4. Crystal Structure Determination

The solid prepared as previously described was investigated by means of powder X-ray diffraction (P-XRD) at room temperature. This revealed crystallization in the tetragonal system with the space group I 4 ¯ (No. 82), with lattice parameters of a = 14.9502(17) Å and c = 5.7837(6) Å, and a unit-cell volume of V = 1292.7(2) Å3. The structural model was determined and refined using the Rietveld method, with detailed information provided in the Supplementary Materials file (Section 1, including Figures S1 and S2 and Tables S1 and S2).
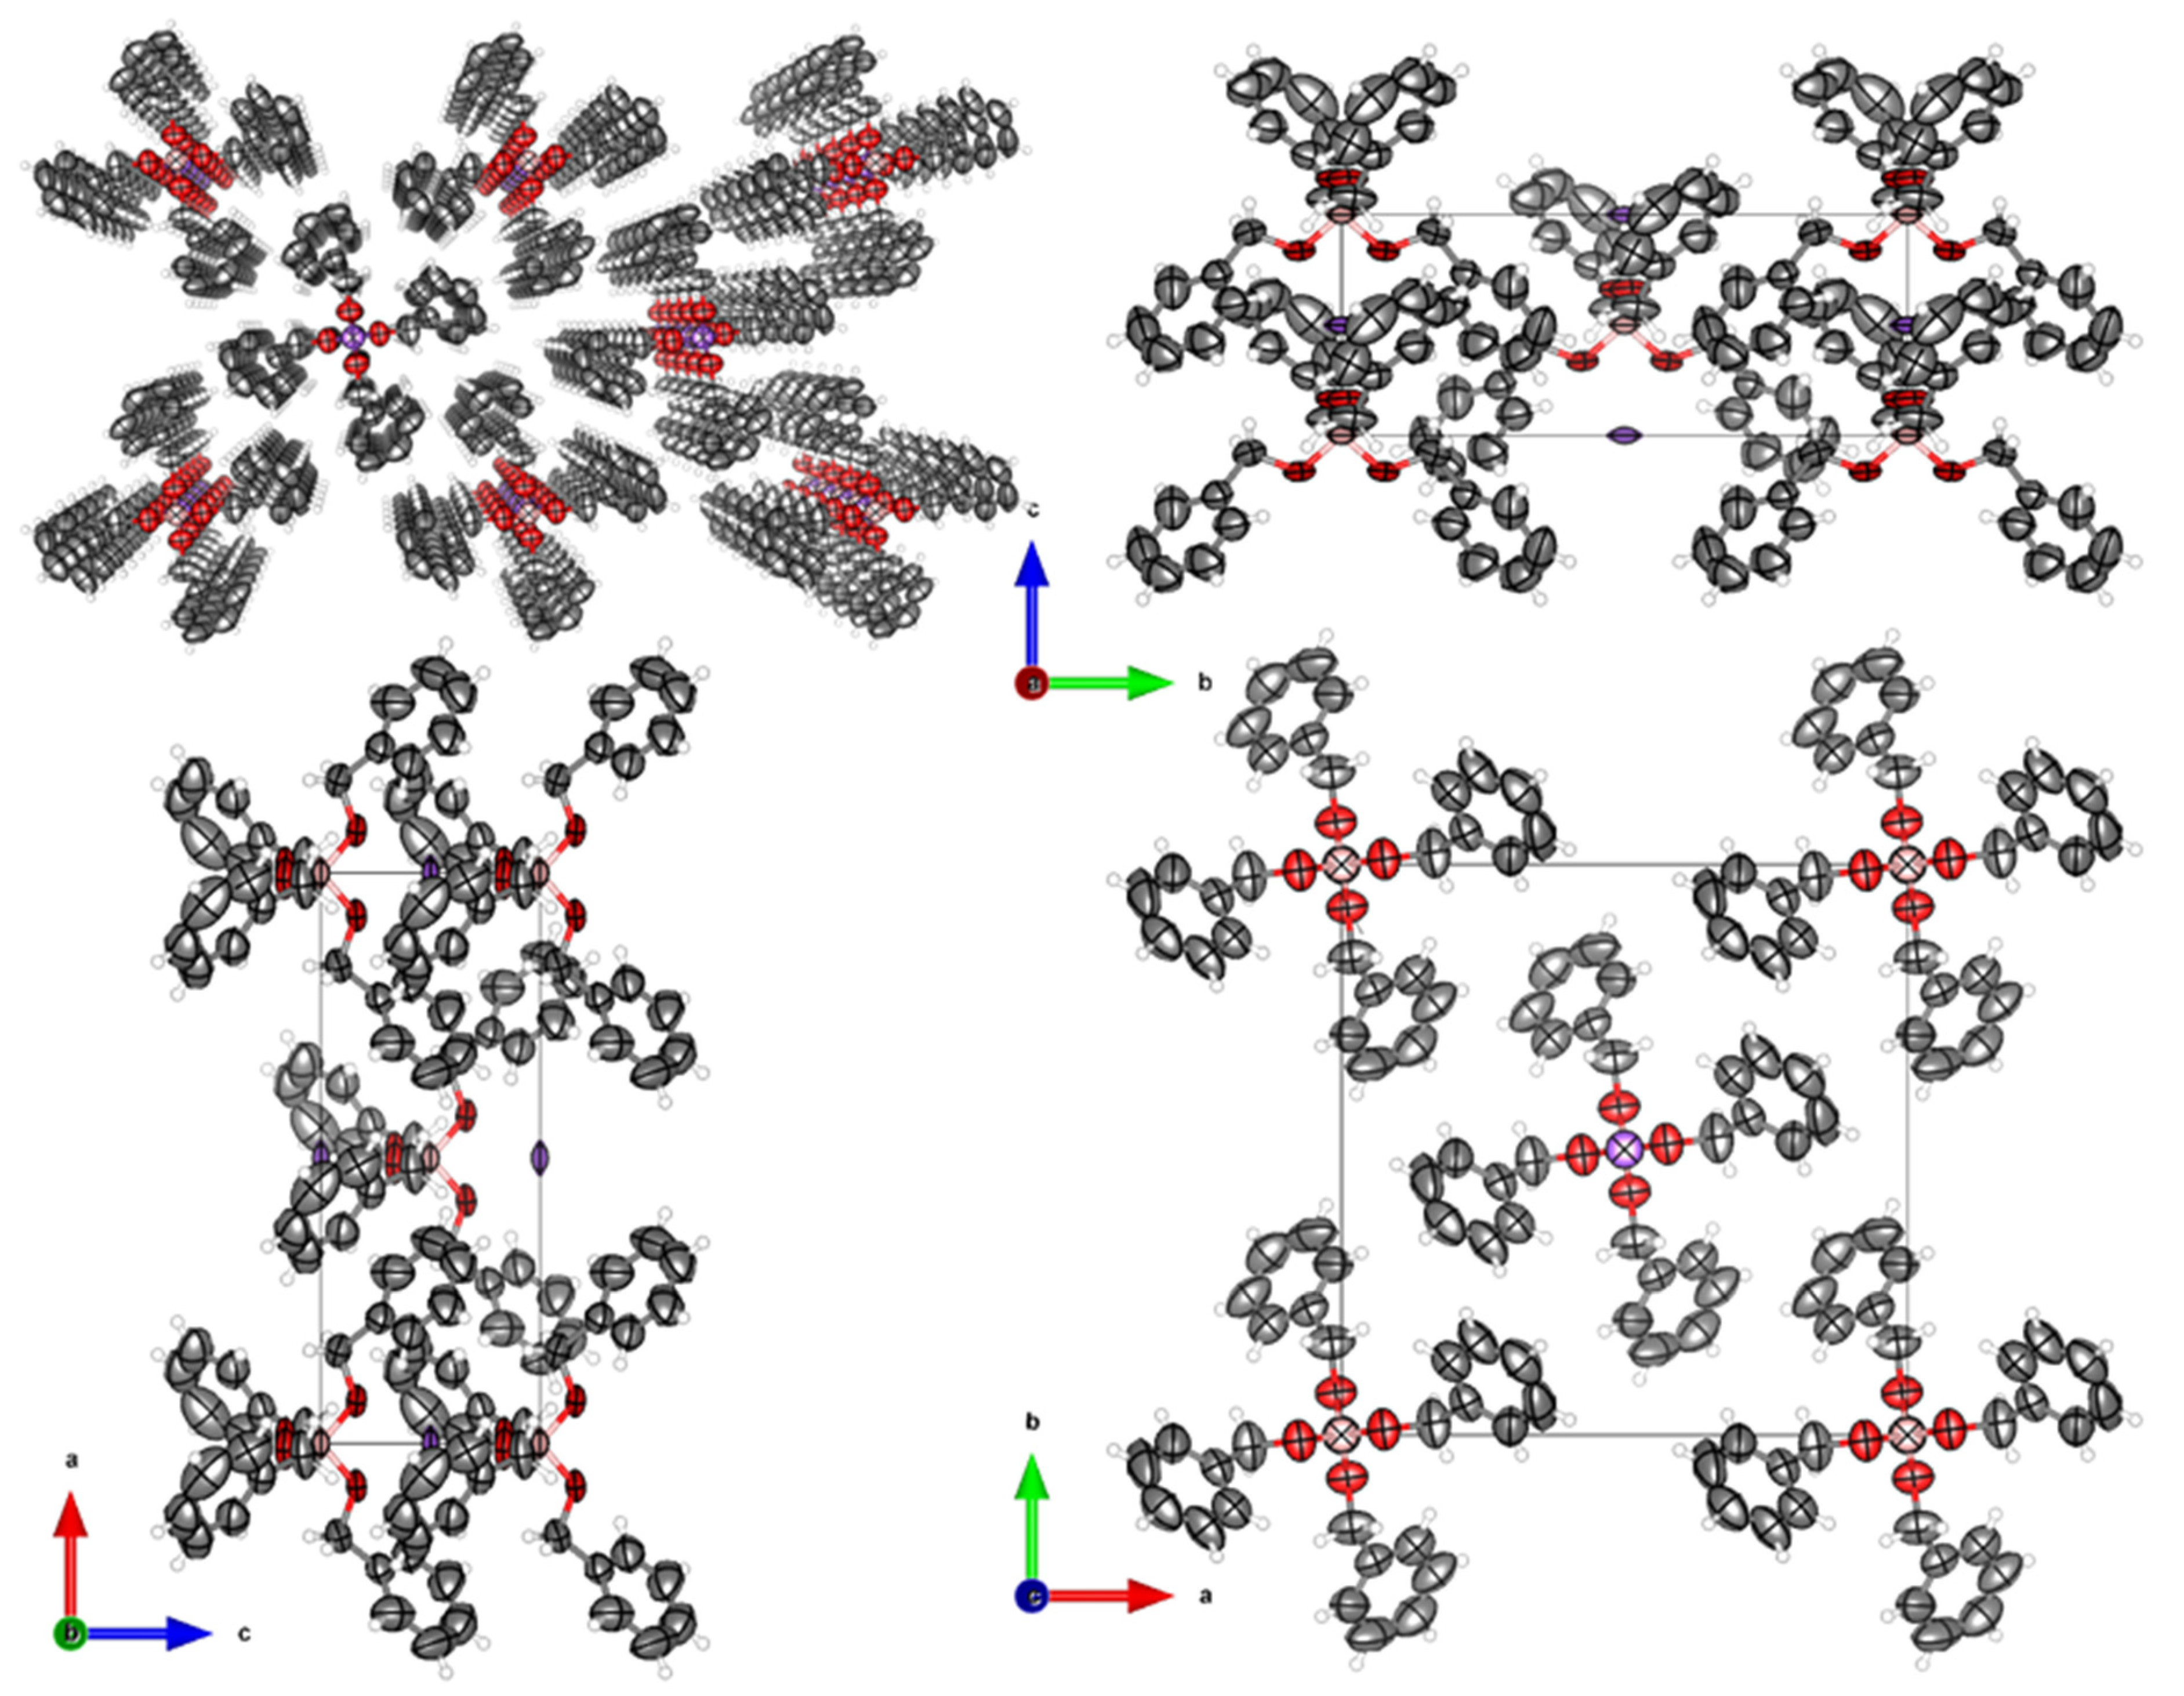
As the DSC analysis indicated the formation of two crystalline phases, we wanted to gain deeper insight into these phases, and single-crystal X-ray diffraction (SC-XRD) was performed at 25 °C and at −100 °C. At 25 °C, the crystal structure obtained by SC-XRD (Figure 6) confirms the structural model determined by P-XRD—that is, the tetragonal system with the space group I 4 ¯ and with the lattice parameters of a = 14.9406(8) Å, c = 5.7838(4) Å and V = 1291.07(13) Å3. Hereafter, the crystal structure at 25 °C will be referred to as the room temperature one (RT).
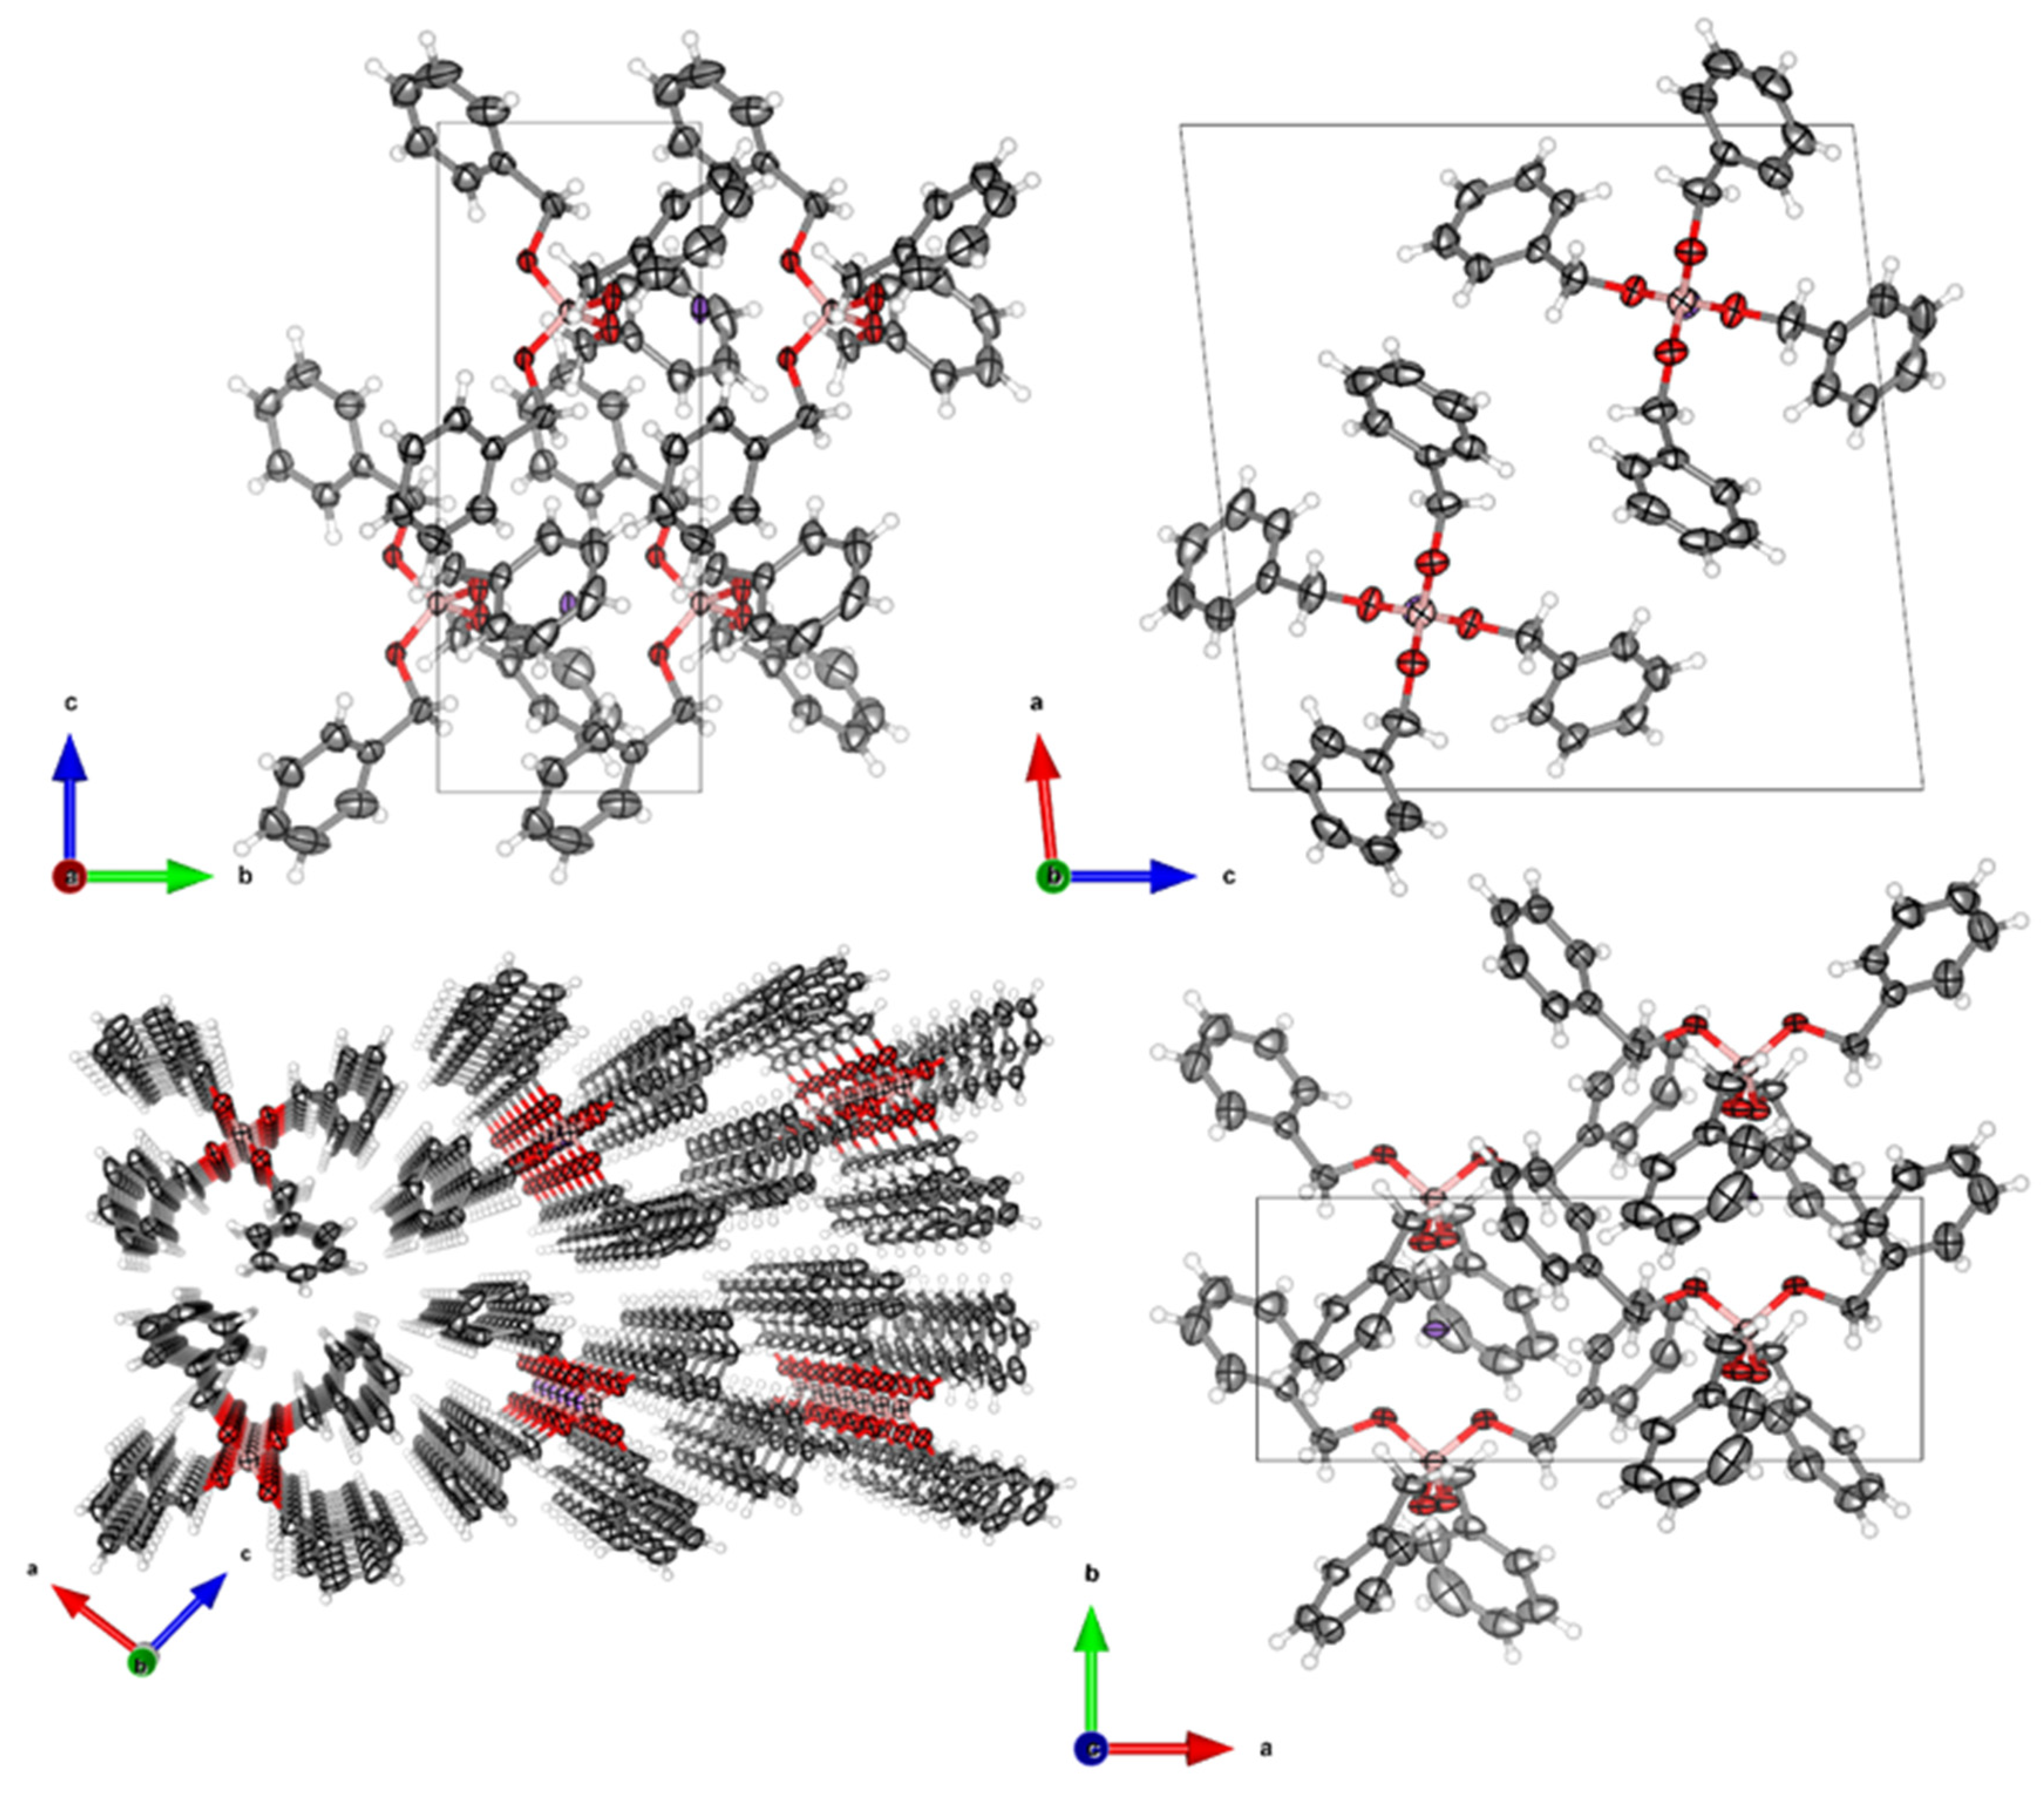
At −100 °C, the solid was found to crystallize in the monoclinic system with the space group P21 (No. 4). The lattice parameters of the crystal are as follows: a = 14.0787(4) Å, b = 5.7733(2) Å, c = 14.8056(4) Å and β = 96.021(1)°, with a unit-cell volume V = 1250.32(7) Å3. The structural model of sodium tetrabenzylborate obtained at −100 °C, the low temperature (LT) phase, is shown in Figure 7. Detailed crystallographic data and refinement conditions for the two investigated temperatures are summarized in Table 1. The Supplementary Materials file contains all of the details related to the crystal structures at the two temperatures, including atomic positions, bond lengths, geometrical and torsion angles, as well as the refinement procedure (Section 2, including Tables S3–S12, and Figures S3 and S4).
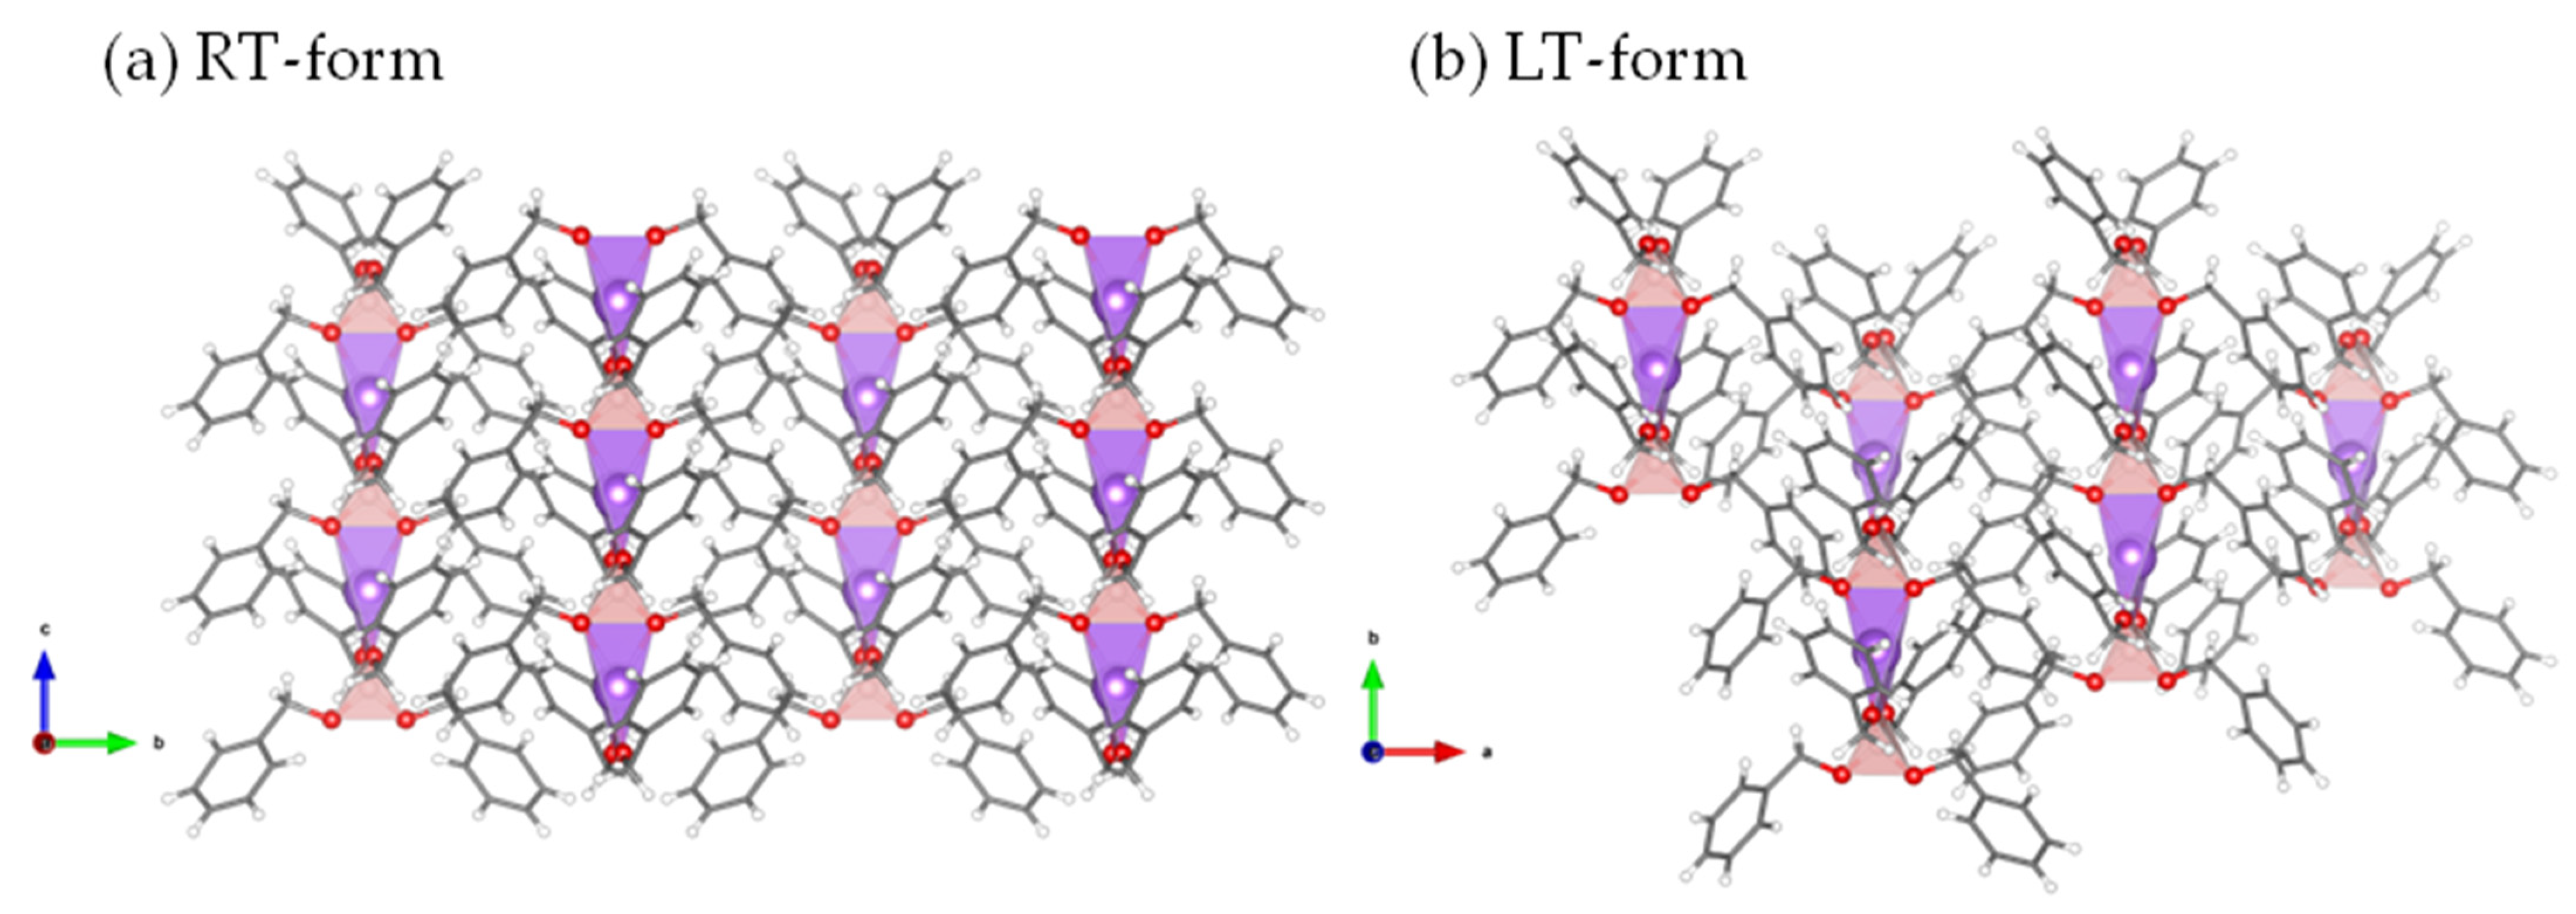
Sodium tetrabenzylborate molecules are aligned along the c and b crystallographic axes in the RT and LT forms, respectively, with interchain distances (B to Na) of approximately 10.56 Å at 25 °C and 10.81 Å at −100 °C. Intermolecular H···H distances were found to be approximately 3.4 Å for both phases. In both arrangements, the sodium cation is fourth-coordinated by oxygen from the tetraalkoxyborate, forming helicoidal chains of BO4 and NaO4 tetrahedra-sharing edges (Figure 8). The bridging angles B–O–Na for the two allotropic forms were measured to be 100.19° in the RT form (and present four different values 99.38, 99.57, 100.1) and 100.68° in the LT form.
In this configuration, the Na–O distances are approximately 2.25 Å in both structures. Nevertheless, at room temperature, although the same Na–O distances (2.2481(16) Å) are observed within the NO4 polyhedron (Table S5), the O–Na–O angles are equal to 59.78 and 138.75° (Table S6), resulting in a non-regular tetrahedron. In contrast, at −100 °C, four different Na–O distances ranging from 2.2399(12) to 2.2583(12) Å are observed (Table S10), with O–Na–O angles in the range 60.00° to 139.45°, indicating a stronger distortion of the polyhedron compared to that observed in the RT form. Regarding the BO4 tetrahedron, the B–O distances are approximately 1.4643(18) Å and vary within the range 1.460(2)–1.470(2) Å in the RT and LT forms, respectively. In contrast, the O–B–O angles are similar for both structural models, with angles of 99.8° and 114.49° in the BO4 tetrahedron.

2.5. Hydrolysis of the Tetraalkoxyborate into Benzyl Alcohol

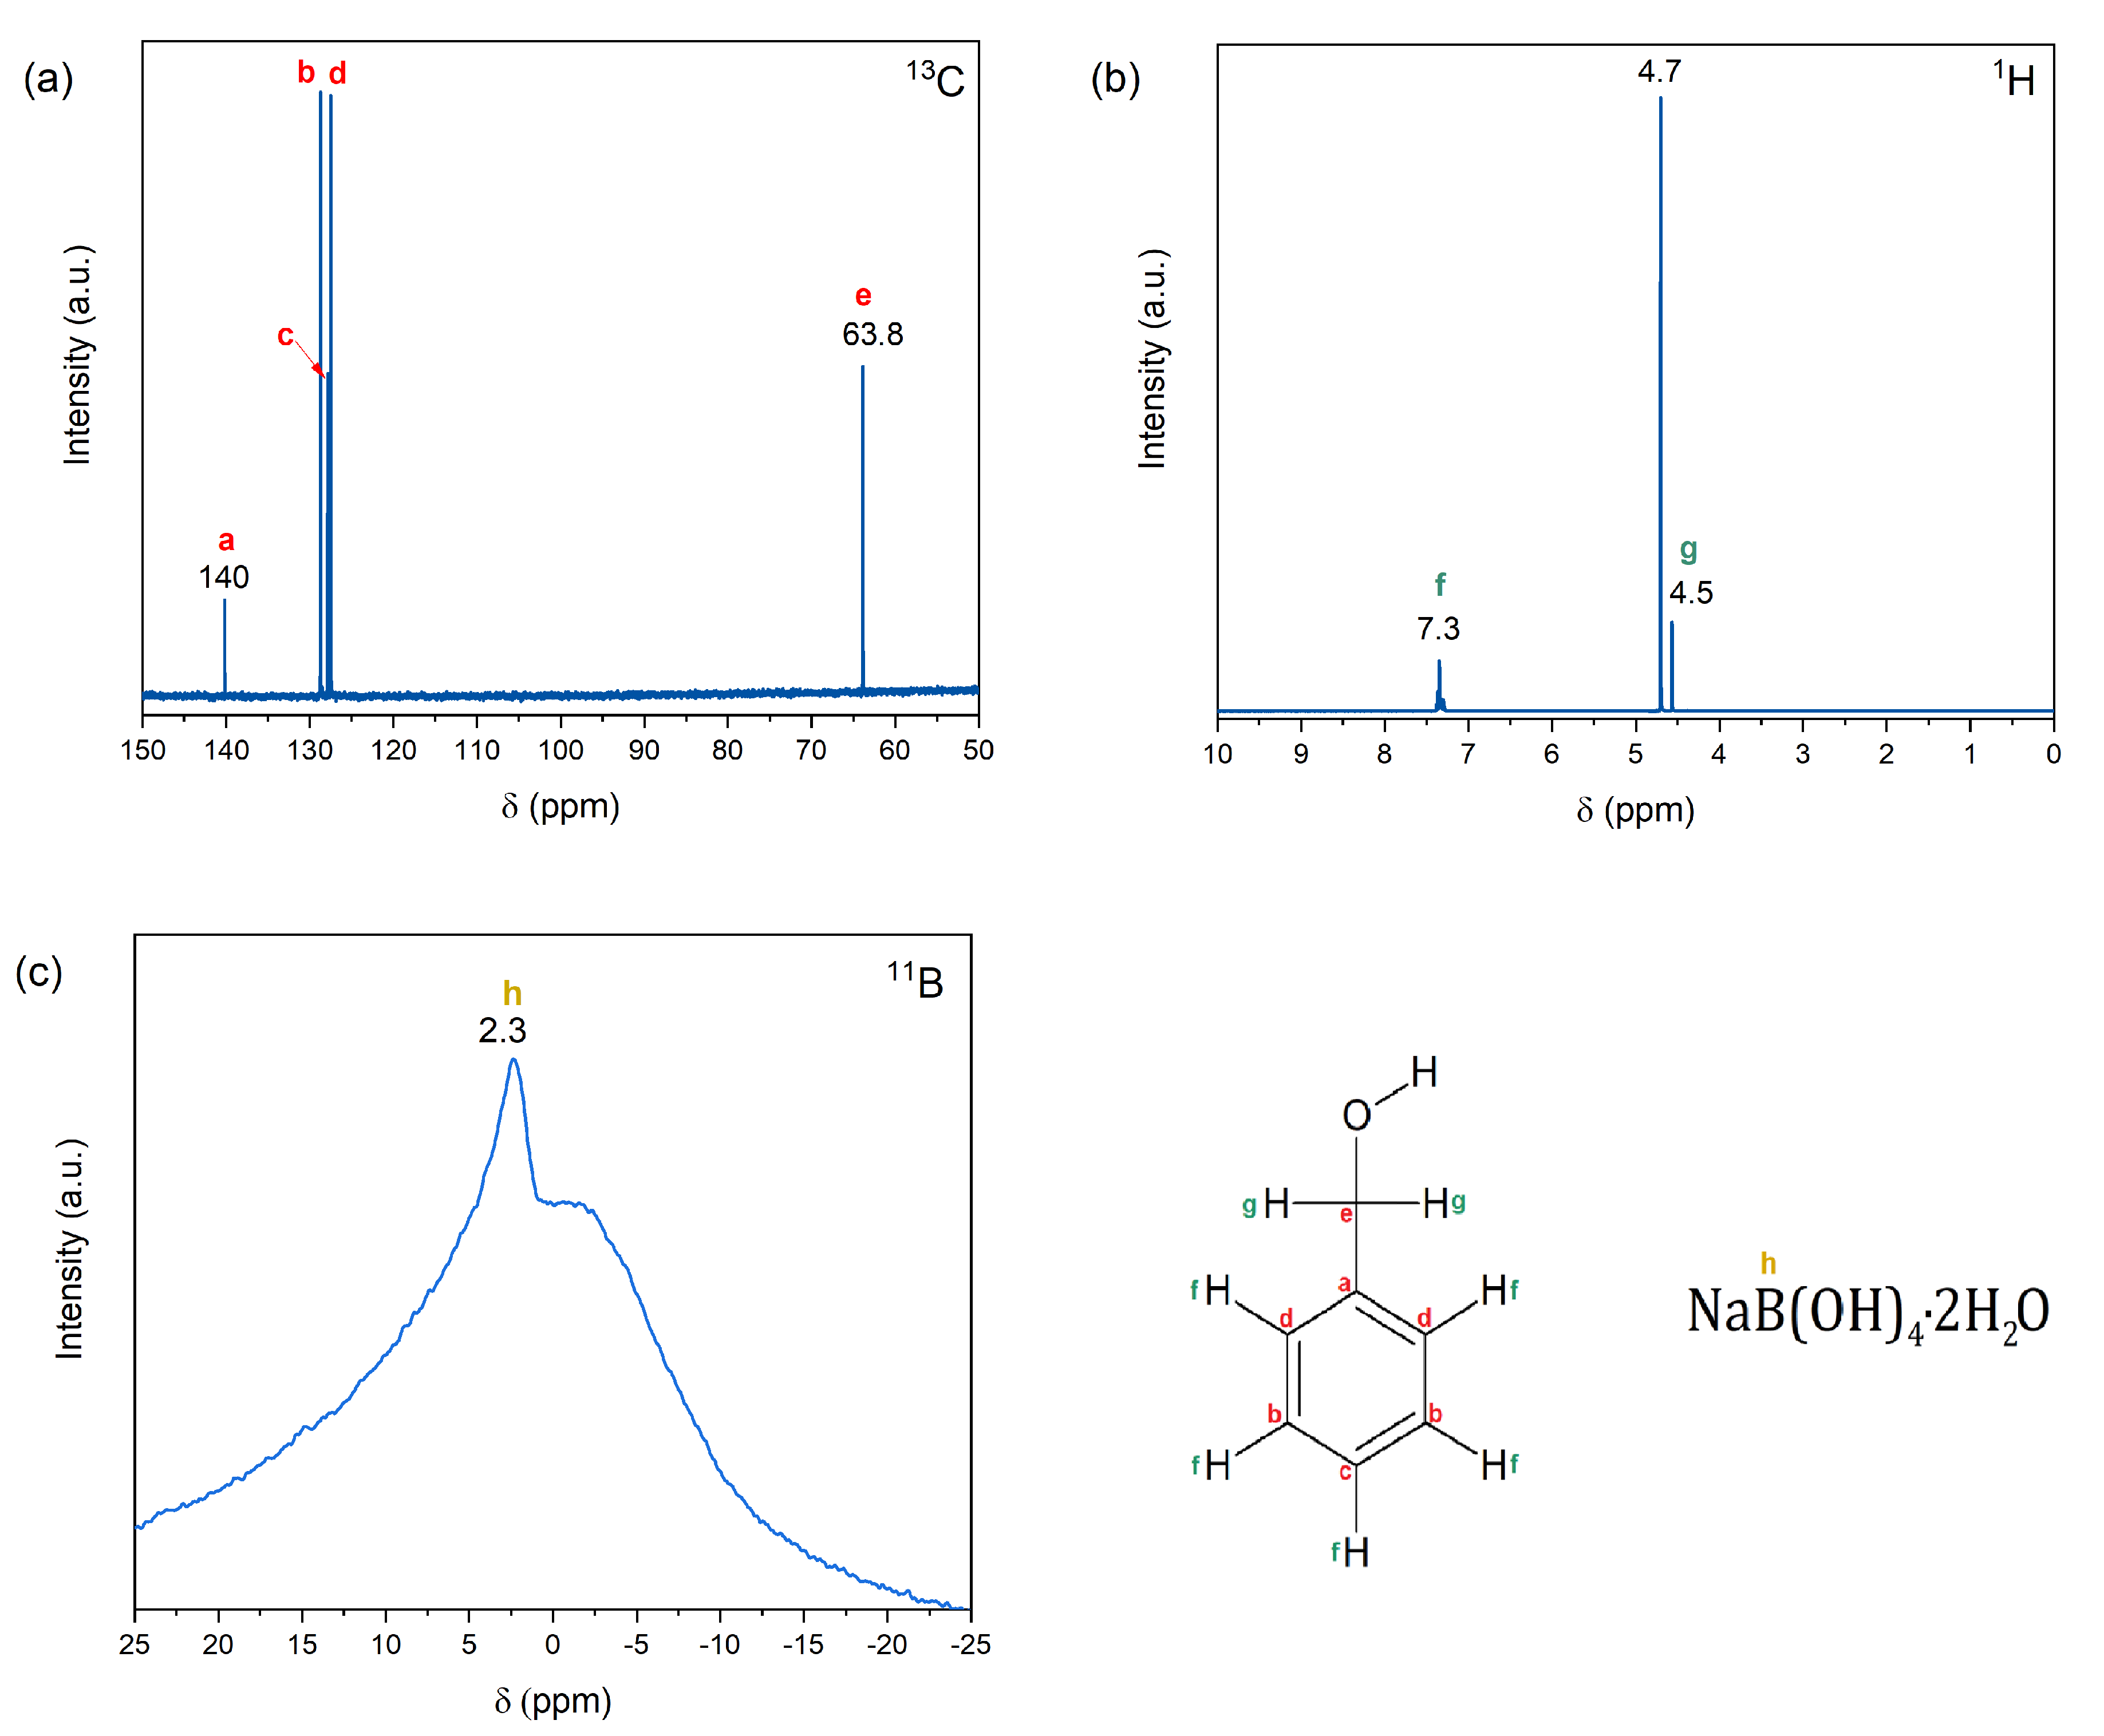
To corroborate the findings of Naimi-Jamal et al. [9] on the formation of alcohols from aldehydes, we conducted the hydrolysis of sodium tetrabenzylborate to produce benzyl alcohol (Figure 1). A small quantity of sodium tetrabenzylborate was solubilized in deuterium oxide and the resulting solution was analyzed by means of NMR. The production of benzyl alcohol was confirmed. The 13C NMR spectrum (Figure 9a) displays all of the expected signals for this compound. The signal at 63.8 ppm corresponds to the CH2 group bonded to the –OH group, while the signals between 127 and 129 ppm are attributed to the five carbons of the phenyl ring. The signal at 140 ppm corresponds to the carbon atom bonded to the CH2.
The 1H NMR spectrum (Figure 9b) displays three signals: a peak at 4.7 ppm assigned to the solvent (D2O), a multiplet at 7.3 ppm which indicates the phenyl ring protons, and a signal at 4.5 ppm belonging to the CH2 group. Notably, the proton of the OH group is not observed due to the use of D2O as the solvent. These results confirm that sodium tetrabenzylborate undergoes hydrolysis to form benzyl alcohol. The 11B NMR spectrum (Figure 9c) displays a single signal centered at 2.3 ppm, which represents the B(OH)4 anion, thereby confirming the formation of sodium metaborate tetrahydrate, NaB(OH)4·2H2O.

3. Materials and Methods

3.1. Reagents

Sodium borohydride (NaBH4, Sigma-Aldrich, ≥98.0%) and benzaldehyde (C7H6O, Sigma-Aldrich, ≥99.0%) were used for the synthesis of sodium tetrabenzylborate. Dimethylformamide DMF (C3H7NO, Sigma-Aldrich, anhydrous, 99.8%) and cyclohexane (C6H12, Sigma-Aldrich, anhydrous, 99.5%) were used to grow single crystals of the material. All materials were used as received.

3.2. Synthesis

The synthesis of sodium tetrabenzylborate was performed under an inert atmosphere to prevent its hydrolysis. Inside an argon-filled glovebox (MBraun M200B; H2O ≤ 0.1 ppm, O2 ≤ 0.1 ppm; 25 °C), 0.075 g of sodium borohydride (2 mmol), 0.84 g of benzaldehyde (8 mmol), and 5 stainless steel balls (total weight of the balls, 20 g) were put into a stainless-steel reactor. The reactor containing the mixture was sealed and transferred out of the glovebox. It was then loaded into a Retsch PM100 planetary ball mill. The following milling program was used: 20 min of milling at 450 rpm followed by a 10 min break; this was repeated 4 times for a total duration of for 2 h. After milling, the reactor was retrieved from the mill and transferred back to the glovebox. The resulting solid product was then recovered, stored, and further characterized.

3.3. Growth of Single Crystals

Under an argon atmosphere, 20 mg of sodium tetrabenzylborate was dissolved in 1.5 mL of DMF and introduced into a small glass tube. This tube was then inserted into a larger flask containing anhydrous cyclohexane. The system was closed and after a few weeks, needle-like crystals were obtained (Figure 2).

3.4. Characterizations

Fourier transformed infrared spectroscopy (IR) analysis was carried out in a NEXUS instrument (ThermoFisher) equipped with an attenuated total reflection accessory, with a wavelength from 600 to 4000 cm−1. For the magic angle spinning nuclear magnetic resonance (MAS NMR) analysis, a VNMRS400 (Varian) instrument was used. The samples were analyzed under 400 MHz at 0 °C. The sample was prepared inside the glovebox, in a zirconia rotor of 3.2 mm of diameter. Liquid NMR was performed in a Bruker 400 MHz apparatus, using deuterium oxide as the deuterated solvent. Simultaneous thermogravimetric (TG) and differential scanning calorimetry (DSC) analyses were carried out in a SDT Q600 apparatus (TA Instruments) under a N2 flow of 100 mL min−1 and a heating ramp of 5 °C min−1. Cyclic DSC analysis was carried out in a Q20 apparatus (TA Instruments) with a temperature ramp of 5 °C min−1. In both thermal analyses, sodium tetrabenzylborate was enclosed in a sealed aluminum crucible.
The X-ray single-crystal structural data were collected at −100 °C on a Bruker D8 VENTURE equipped with a PHOTON II CPAD detector and a microfocus X-ray source with Cu-Kα radiation (λ = 1.54178 Å) operating at 50 kV and 1 mA. A suitable crystal was chosen and mounted on a 150 µm aperture Dual-Thickness Microloop. Single-crystal X-ray diffraction allowed the collection of 1446 frames over a total exposure time of 7.32 h. The frames were integrated using the Bruker SAINT Software package with a narrow-frame algorithm, resulting in the measurement of 6976 reflections in the angle range 6.012° < 2θ < 144.898°. Data collection was conducted at −100 °C. Using Olex2, the structure was solved using the SHELXT structure solution program with Intrinsic Phasing and refined with the olex2.refine package [20,21]. Deposition Numbers 2,352,500 (sodium tetrabenzylborate powder), 2,348,781 (sodium tetrabenzylborate LT-phase @173K), and 2,352,383 (sodium tetrabenzylborate RT-phase @293K) contain the supplementary crystallographic data for this paper. These data are provided free of charge by the joint Cambridge Crystallographic Data Centre and Fachinformationszentrum Karlsruhe Access Structures service.

3.5. Hydrolysis Reaction

Inside the glovebox, 2 mg of sodium tetrabenzylborate was prepared in a vial, which was then transferred outside of the glovebox. Subsequently, 1 mL of deuterium oxide was added to the borate. The solution was analyzed the next day via liquid-state NMR.

4. Conclusions

In this study, we successfully synthesized a novel sodium-based tetraalkoxyborate, sodium tetrabenzylborate, via the direct mechanochemical reaction between benzaldehyde and sodium borohydride at room temperature. Sodium tetrabenzylborate is a crystalline solid with colorless, stick-shaped crystals. Its crystal structure was determined by means of powder- and single-crystal-XRD techniques, demonstrating excellent agreement between the two methods. At room temperature, the crystal structure of sodium tetrabenzylborate is tetragonal (space group I 4 ¯ ), and at a low temperature, it is monoclinic (space group P 2 1 ). The transition between the two crystal phases was observed to occur at −45 °C by DSC. In other words, these results shed more light into the molecular and crystal structure of sodium tetrabenzylborate as a typical example of tetraalkoxyborates.
Sodium tetrabenzylborate rapidly hydrolyzes into benzyl alcohol upon contact with water. This confirms the ability of sodium borohydride to convert an aldehyde, benzaldehyde, into its primary alcohol, benzyl alcohol, via the formation of a tetraalkylborate intermediate, sodium tetrabenzylborate. The overall process is solvent-free and proceeds in two steps at room temperature.
Alkali tetraalkoxyborates hold promise for various applications due to their unique properties. Their Lewis acid-base characteristics make them attractive as catalysts for certain organic reactions such as the methoxylation of aromatic chlorides [22]. More recently, tetraalkoxyborates have shown potential in battery applications due to their high thermal stability compared to commercial lithium hexafluorophosphate and their high ionic conductivity [23]. Our study confirmed the possibility of obtaining crystalline alkali tetraalkoxyborates through a greener synthesis route (i.e., mechanochemical reaction), which may be seen as potential electrolytes for batteries.

Supplementary Materials

The following supporting information (structured in two sections, including the power X-ray diffraction data and the single crystal X-ray diffraction results) can be downloaded at: https://www.mdpi.com/article/10.3390/inorganics12070179/s1; Figure S1: The observed powder XRD profile (depicted by the black line) is overlaid with the calculated profile (shown in red) for the Rietveld refinement of sodium tetrabenzylborate (NaB(O-CH2-C6H5)4). The difference plot is presented below (in blue) based on the same scale of intensity. Green tick marks indicate the calculated angles for the Bragg peaks in 2θ; Figure S2: Crystal structure of sodium tetrabenzylborate at room temperature as determined by P-XRD, along the [111] direction. The H, B, O, C, and Na atoms are represented by white, pink, red, dark gray, and violet spheres, respectively; Figure S3. Label of the atoms of the asymmetric unit of sodium tetrabenzylborate at 298 K. The H, B, O, C and Na atoms are represented by white, pink, red, dark gray, and violet spheres, respectively; Figure S4: Label of the atoms of the asymmetric unit of sodium tetrabenzylborate at 173 K. The H, B, O, C, and Na atoms are represented by white, pink, red, dark gray, and violet spheres, respectively; Table S1: Space group, number of asymmetric units (Z), unit cell parameters (a, and c), and unit cell volume for solid-state sodium tetrabenzylborate after the refinement of the powder diffraction pattern; Table S2: Standardized experimental structural parameters for the refined structure at 173 K; Table S3: Standardized experimental structural parameters for the refined structure at 298 K; Table S4: Experimental structural parameters for the refined structure at 298 K; Table S5: Bond lengths for the refined structure at 173 K; Table S6: Geometrical angles for the refined structure at 173 K; Table S7: Torsion angles for the refined structure at 173 K; Table S8: Standardized experimental structural parameters for the refined structure at 173 K; Table S9: Experimental structural parameters for the refined structure at 173 K; Table S10: Bond lengths for the refined structure at 173 K; Table S11: Geometrical angles for the refined structure at 173 K; Table S12: Torsion angles for the refined structure at 173 K. [20,24,25] are cited in the Supplementary Materials.

Author Contributions

Conceptualization, C.A.C.-M. and U.B.D.; methodology, C.A.C.-M., D.G., P.G.Y. and U.B.D.; validation, C.A.C.-M., D.G., P.G.Y. and U.B.D.; formal analysis, C.A.C.-M., D.G., P.G.Y. and U.B.D.; investigation, C.A.C.-M., D.G., P.G.Y. and U.B.D.; writing—original draft preparation, C.A.C.-M., P.G.Y. and U.B.D.; writing—review and editing, C.A.C.-M., P.G.Y. and U.B.D.; supervision, P.G.Y. and U.B.D.; project administration, U.B.D.; funding acquisition, U.B.D. All authors have read and agreed to the published version of the manuscript.

Funding

This research was funded by the AGENCE NATIONALE DE LA RECHERCHE, grant number ANR-18-CE05-0032.

Data Availability Statement

The data that support the findings of this study are available from the corresponding author upon reasonable request.

Conflicts of Interest

The authors declare no conflicts of interest.

References

  1. Chaikin, S.W.; Brown, W.G. Reduction of Aldehydes, Ketones and Acid Chlorides by Sodium Borohydride. J. Am. Chem. Soc. 1949, 71, 122–125. [Google Scholar] [CrossRef]
  2. Schlesinger, H.I.; Brown, H.C.; Finholt, A.E.; Gilbreath, J.R.; Hoekstra, H.R.; Hyde, E.K. Sodium Borohydride, Its Hydrolysis and Its Use as a Reducing Agent and in the Generation of Hydrogen1. J. Am. Chem. Soc. 1953, 75, 215–219. [Google Scholar] [CrossRef]
  3. Brown, H.C.; Wheeler, O.H.; Ichikawa, K. Chemical Effects of Steric Strains—XIII. Tetrahedron 1957, 1, 214–220. [Google Scholar] [CrossRef]
  4. Luk, H.T.; Mondelli, C.; Ferré, D.C.; Stewart, J.A.; Pérez-Ramírez, J. Status and Prospects in Higher Alcohols Synthesis from Syngas. Chem. Soc. Rev. 2017, 46, 1358–1426. [Google Scholar] [CrossRef] [PubMed]
  5. Gayathri, K.M.; Paramparambath, S.; Satheesh, A.; Selvam, S.; Kandasamy, E. Reduction of Aldehydes and Ketones by NaBH4 in Presence of 1-Alkyl-1,2,4-Triazolium Salts. Mater. Today Proc. 2020, 33, 2381–2384. [Google Scholar] [CrossRef]
  6. Zeynizadeh, B.; Yahyaei, S. A Mild and Convenient Method for the Reduction of Carbonyl Compounds with NaBH4 in the Presence of Catalytic Amounts of MoCl5. Bull. Korean Chem. Soc. 2003, 24, 1664–1670. [Google Scholar] [CrossRef]
  7. Chandrasekhar, S.; Shrinidhi, A. Selective Aldehyde Reduction in Ketoaldehydes with NaBH4-Na2CO3-H2O at Room Temperatures. Synth. Commun. 2014, 44, 2051–2056. [Google Scholar] [CrossRef]
  8. Tanemura, K.; Suzuki, T.; Nishida, Y.; Satsumabayashi, K.; Horaguchi, T. Chemoselective Reduction of Aldehydes in the Presence of Ketones with NaBH 4 in Polyethylene Glycol Dimethyl Ethers. Synth. Commun. 2005, 35, 867–872. [Google Scholar] [CrossRef]
  9. Naimi-Jamal, M.R.; Mokhtari, J.; Dekamin, M.G.; Kaupp, G. Sodium Tetraalkoxyborates: Intermediates for the Quantitative Reduction of Aldehydes and Ketones to Alcohols through Ball Milling with NaBH4. Eur. J. Org. Chem. 2009, 2009, 3567–3572. [Google Scholar] [CrossRef]
  10. Renaudin, G.; Gomes, S.; Hagemann, H.; Keller, L.; Yvon, K. Structural and Spectroscopic Studies on the Alkali Borohydrides MBH4 (M = Na, K, Rb, Cs). J. Alloys Compd. 2004, 375, 98–106. [Google Scholar] [CrossRef]
  11. D’Anna, V.; Spyratou, A.; Sharma, M.; Hagemann, H. FT-IR Spectra of Inorganic Borohydrides. Spectrochim. Acta Part A Mol. Biomol. Spectrosc. 2014, 128, 902–906. [Google Scholar] [CrossRef] [PubMed]
  12. Botasini, S.; Méndez, E. On the Purity Assessment of Solid Sodium Borohydride. J. Power Sources 2012, 197, 218–223. [Google Scholar] [CrossRef]
  13. Burkholder, T.R.; Andrews, L. Reactions of Boron Atoms with Molecular Oxygen. Infrared Spectra of BO, BO2, B2O2, B2O3, and BO−2 in Solid Argon. J. Chem. Phys. 1991, 95, 8697–8709. [Google Scholar] [CrossRef]
  14. Li, Y.; Zhang, H.; Liu, Q. FT-IR Spectroscopy and DFT Calculation Study on the Solvent Effects of Benzaldehyde in Organic Solvents. Spectrochim. Acta Part A Mol. Biomol. Spectrosc. 2012, 86, 51–55. [Google Scholar] [CrossRef] [PubMed]
  15. Goel, N.; Sinha, N.; Kumar, B. Growth and Properties of Sodium Tetraborate Decahydrate Single Crystals. Mater. Res. Bull. 2013, 48, 1632–1636. [Google Scholar] [CrossRef]
  16. Machado, N.F.L.; Marques, M.P.M.; Batista de Carvalho, L.a.E.; Castro, J.L.; Otero, J.C. Anomalous Surface-Enhanced Raman Scattering of Aromatic Aldehydes and Carboxylic Acids. J. Raman Spectrosc. 2017, 48, 413–417. [Google Scholar] [CrossRef]
  17. Applegarth, L.M.S.G.A.; Pye, C.C.; Cox, J.S.; Tremaine, P.R. Raman Spectroscopic and Ab Initio Investigation of Aqueous Boric Acid, Borate, and Polyborate Speciation from 25 to 80 °C. Ind. Eng. Chem. Res. 2017, 56, 13983–13996. [Google Scholar] [CrossRef]
  18. Alderman, O.L.G.; Iuga, D.; Howes, A.P.; Pike, K.J.; Holland, D.; Dupree, R. Spectral Assignments and NMR Parameter–Structure Relationships in Borates Using High-Resolution 11B NMR and Density Functional Theory. Phys. Chem. Chem. Phys. 2013, 15, 8208. [Google Scholar] [CrossRef] [PubMed]
  19. Hansen, M.R.; Vosegaard, T.; Jakobsen, H.J.; Skibsted, J. 11B Chemical Shift Anisotropies in Borates from 11B MAS, MQMAS, and Single-Crystal NMR Spectroscopy. J. Phys. Chem. A 2004, 108, 586–594. [Google Scholar] [CrossRef]
  20. Dolomanov, O.V.; Bourhis, L.J.; Gildea, R.J.; Howard, J.A.K.; Puschmann, H. OLEX2: A Complete Structure Solution, Refinement and Analysis Program. J. Appl. Crystallogr. 2009, 42, 339–341. [Google Scholar] [CrossRef]
  21. Bourhis, L.J.; Dolomanov, O.V.; Gildea, R.J.; Howard, J.A.K.; Puschmann, H. The Anatomy of a Comprehensive Constrained, Restrained Refinement Program for the Modern Computing Environment—Olex2 Dissected. Acta Crystallogr. A Found. Adv. 2015, 71, 59–75. [Google Scholar] [CrossRef] [PubMed]
  22. Tolnai, G.L.; Pethő, B.; Králl, P.; Novák, Z. Palladium-Catalyzed Methoxylation of Aromatic Chlorides with Borate Salts. Adv. Synth. Catal. 2014, 356, 125–129. [Google Scholar] [CrossRef]
  23. Berger, A.; Ibrahim, A.; Hales, T.A.; D’Angelo, A.M.; Buckley, C.E.; Paskevicius, M. Alkali Metal Alkoxyborate Ester Salts; a Contemporary Look at Old Compounds. Dalton Trans. 2024, 53, 3638–3653. [Google Scholar] [CrossRef] [PubMed]
  24. Favre-Nicolin, V.; Černý, R. FOX, ‘free Objects for Crystallography’: A Modular Approach to Ab. Initio Structure Determination from Powder Diffraction. J. Appl. Crystallogr. 2002, 35, 734–743. [Google Scholar] [CrossRef]
  25. Petříček, V.; Dušek, M.; Palatinus, L. Crystallographic Computing System JANA2006: General Features. Z. Für Krist. Cryst. Mater. 2014, 229. [Google Scholar] [CrossRef]
Figure 1. Scheme illustrating the reaction between sodium borohydride and benzaldehyde, and its further hydrolysis into benzyl alcohol and sodium metaborate tetrahydrate.
Inorganics 12 00179 g001
Figure 2. Optical microscope images of sodium tetrabenzylborate crystals at different magnifications.
Inorganics 12 00179 g002
Figure 3. (a) IR and (b) Raman spectra of sodium borohydride, benzaldehyde, and sodium tetrabenzylborate. The vibrational modes are indicated by the dashed rectangles, as well as the Raman shifts in cm−1.
Inorganics 12 00179 g003
Figure 4. 11B MAS NMR spectrum of sodium tetrabenzylborate. The chemical shifts in ppm are indicated in this figure.
Inorganics 12 00179 g004
Figure 5. (a) Simultaneous TG-DSC analyses and (b) cyclic DSC analysis between −90 and 350 °C of sodium tetrabenzylborate. The peak temperatures in °C are indicated in this figure.
Inorganics 12 00179 g005
Figure 6. Crystal structure of sodium tetrabenzylborate at 25 °C, along the three crystallographic axes. The H, B, O, C, and Na atoms are represented by white, pink, red, dark gray, and violet spheres, respectively.
Inorganics 12 00179 g006
Figure 7. Crystal structure of sodium tetrabenzylborate at −100 °C, along the three crystallographic axes. The H, B, O, C and Na atoms are represented by white, pink, red, dark gray and violet spheres, respectively.
Inorganics 12 00179 g007
Figure 8. Comparison of the two structures (a) room- and (b) low-temperature form showing the tetrahedra BO4-NaO4 chains. The BO4 and NaO4 tetrahedra are represented in light pink and violet, respectively.
Inorganics 12 00179 g008
Figure 9. NMR spectra of the (a) 13C, (b) 1H, and (c) 11B nuclei of the products obtained after sodium tetrabenzylborate hydrolysis. The chemical shifts in ppm are indicated, and the signals are assigned to the molecules of benzyl alcohol and sodium metaborate tetrahydrate represented next to the spectra.
Inorganics 12 00179 g009
Table 1. Space group, unit cell parameters, goodness of fit (GoF), R values, and structural parameters for the refined structure of sodium tetraalkoxyborate at 25 and −100 °C.
Empirical formulaC28H28BNaO4
Formula weight (g mol−1)188.945
Temperature (K/°C)298 (25)173 (−100)
Wavelength (Å)0.710731.54178
Crystal systemtetragonalmonoclinic
Space group I 4 ¯ (No. 82)P21 (No. 4)
Unit cell dimensions:
a (Å)14.9406 (8)14.0787 (4)
b (Å) 5.7733 (2)
c (Å)5.7838 (4)14.8056 (4)
β (°) 96.0210 (10)
Cell volume (Å3)1291.07 (13)1250.32 (6)
Z22
Calculated density (g cm−3)1.1891.228
Absorption coefficient (μ·mm−1)0.0920.789
F (000)488.3488.0
Crystal size (mm)0.3 × 0.015 × 0.010.3 × 0.015 × 0.01
2θ range for data collection (°)3.86 to 50.76.002 to 114.898
Limiting indices−18 ≤ h ≤ 18, −18 ≤ k ≤ −17, −6 ≤ l ≤ 6−18 ≤ h ≤ 18, −6 ≤ k ≤ 6, −18 ≤ l ≤ 18
Reflexion collected932423,291
Completeness2θ = 50.5°: 100%2θ = 144.9°: 99%
Independent reflections1186 [Rint = 0.0545, Rsigma = 0.0458]4783 [Rint = 0.0423, Rsigma = 0.0332]
Refinement methodFull-matrix least-squares on F2
Data/restraints/parameters1186/0/774783/1/308
Goodness-of-fit on F21.0381.072
Final R indices [I > 2σ(I)]R1 = 0.0516, wR2 = 0.1673R1 = 0.0330, wR2 = 0.0822
R indices (all data)R1 = 0.0692, wR2 = 0.200R1 = 0.0363, wR2 = 0.0851
LDPH (e Å−3) [a]0.26/−0.430.24/−0.14
Flack parameter0 (220)0.05 (3)
Disclaimer/Publisher’s Note: The statements, opinions and data contained in all publications are solely those of the individual author(s) and contributor(s) and not of MDPI and/or the editor(s). MDPI and/or the editor(s) disclaim responsibility for any injury to people or property resulting from any ideas, methods, instructions or products referred to in the content.