
The Influence of the Cu Foam on the Electrochemical Reduction of Carbon Dioxide


Abstract
1. Introduction
2. Results and Discussion
3. Materials and Methods
3.1. Preparation of the Electrodes
3.2. Preparation of the Electrolysis Batch
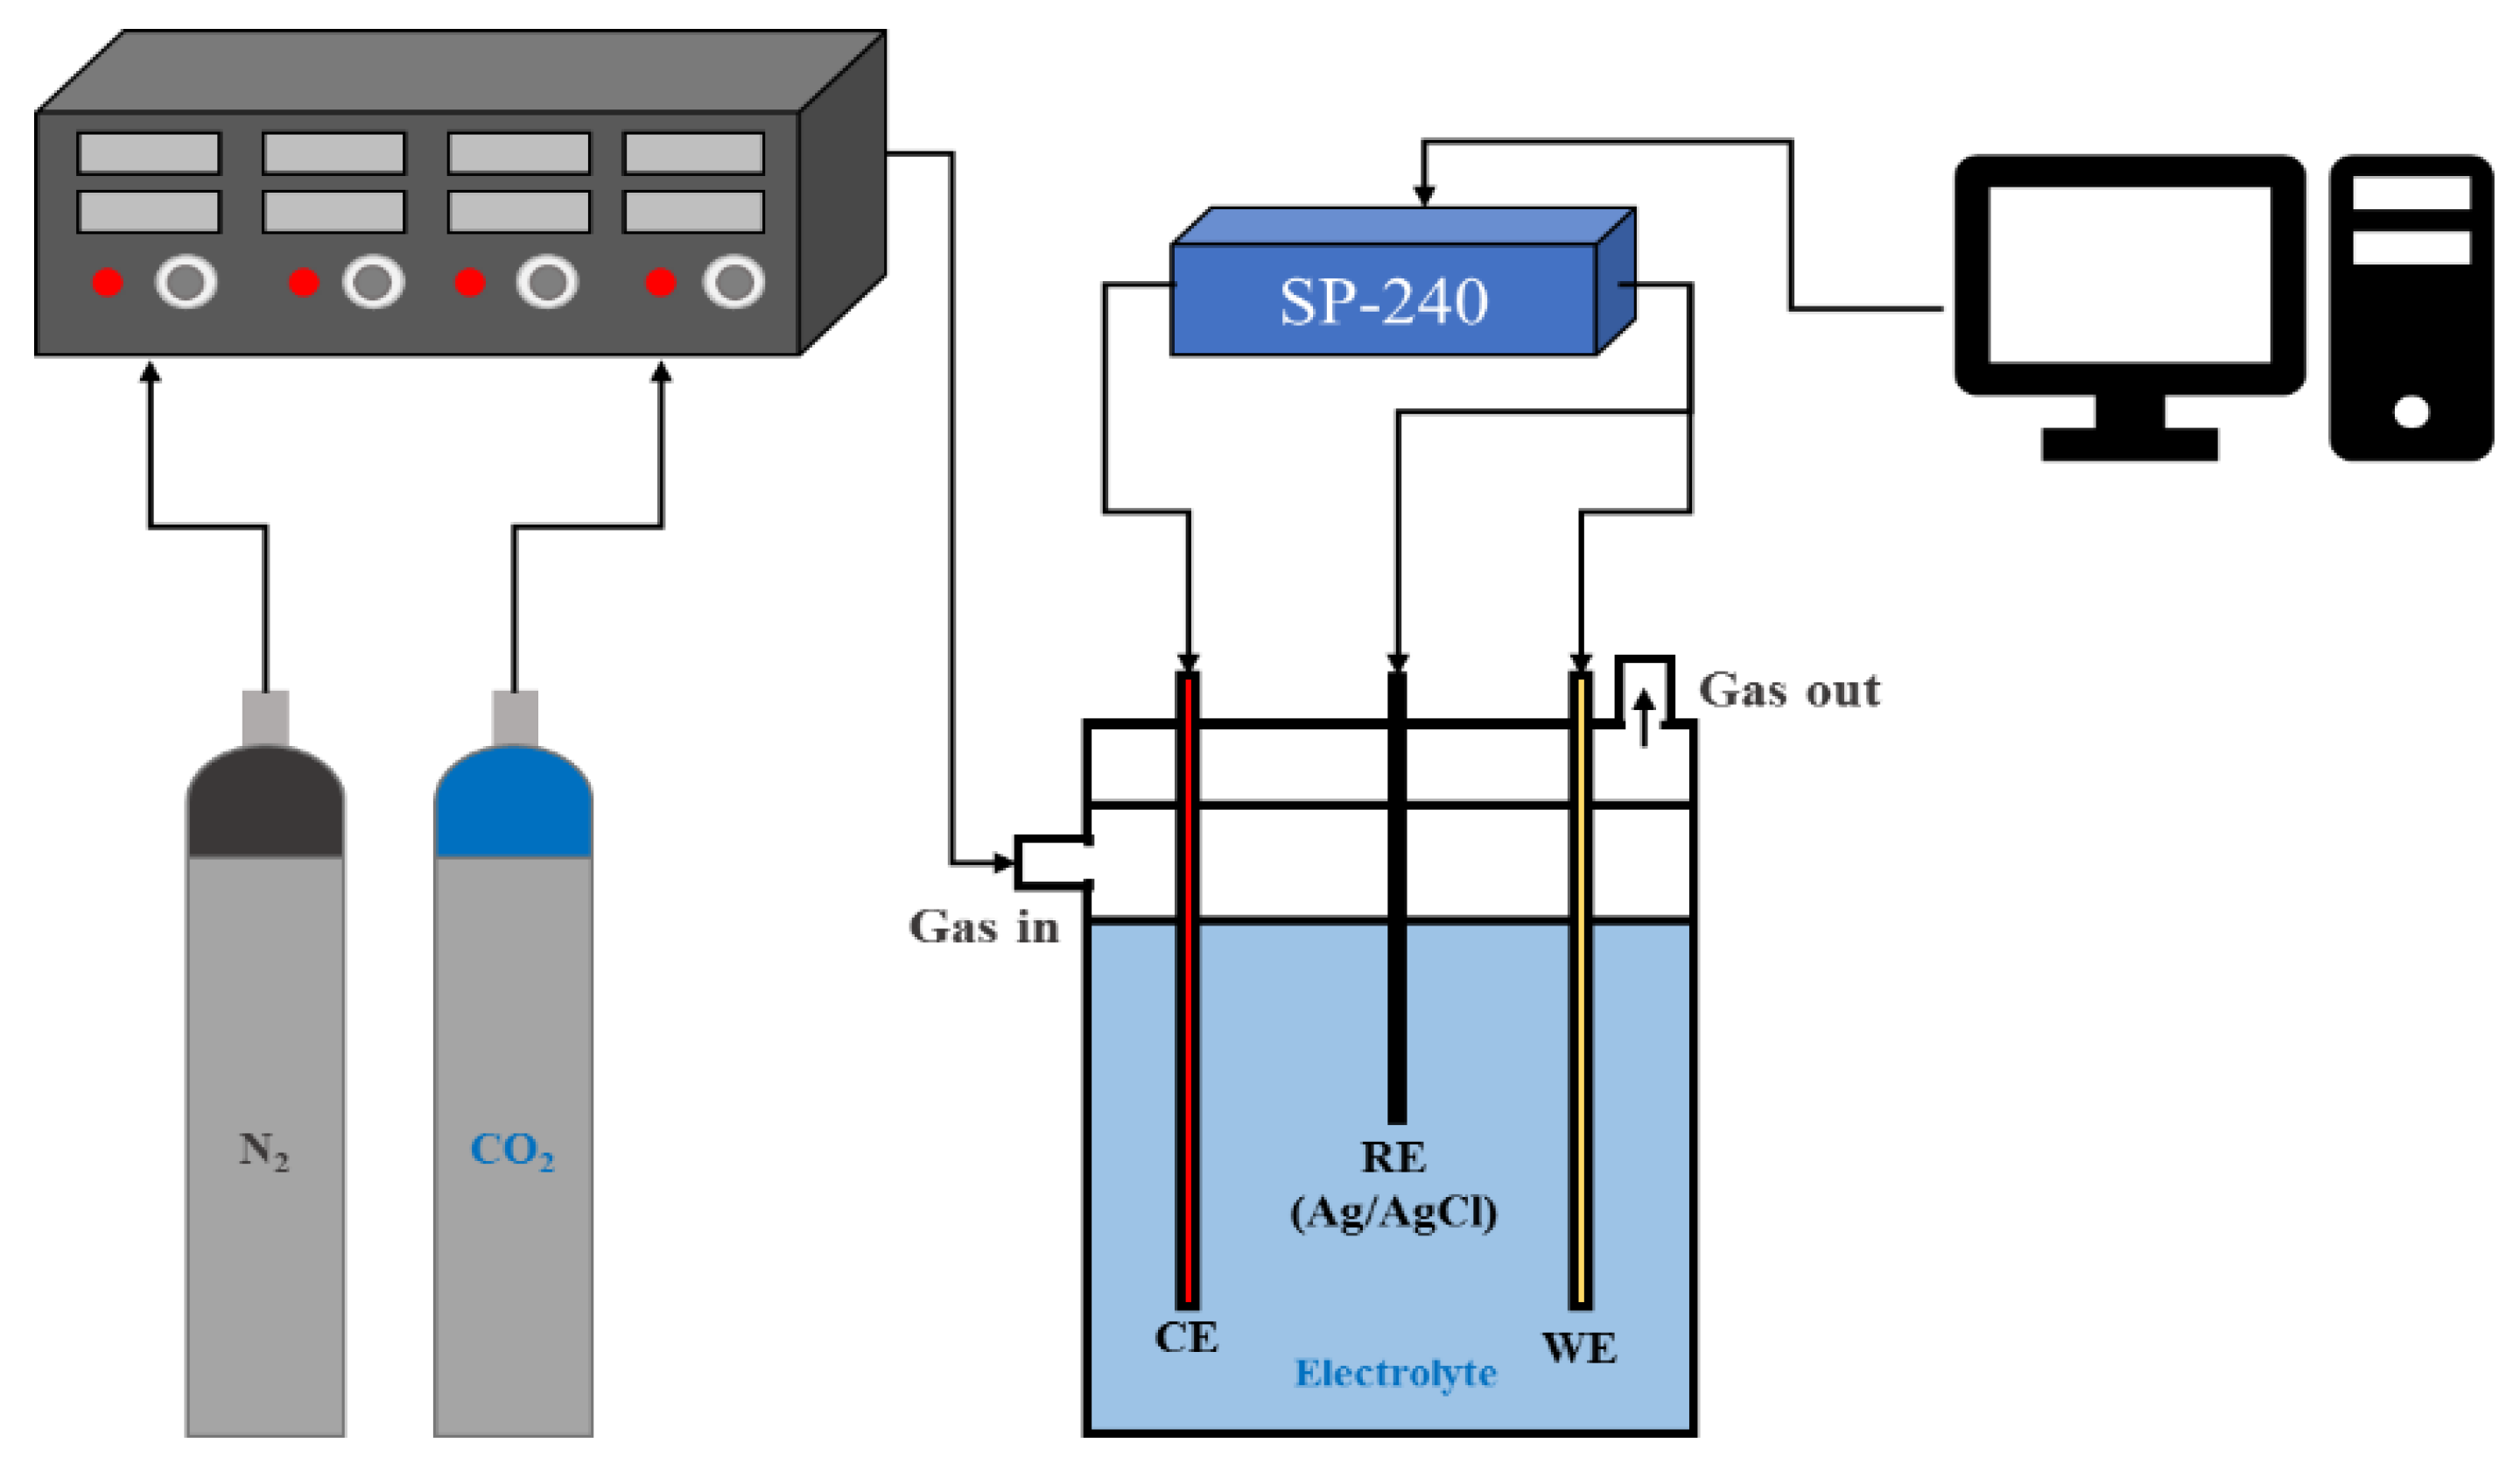
3.3. Measurement Equipment for Electrochemical Reaction
4. Conclusions
Author Contributions
Funding
Data Availability Statement
Acknowledgments
Conflicts of Interest
References
- Chen, J.M. Carbon Neutrality: Toward a Sustainable Future. Innovation 2021, 2, 100127. [Google Scholar] [CrossRef]
- Chen, L.; Msigwa, G.; Yang, M.; Osman, A.I.; Fawzy, S.; Rooney, D.W.; Yap, P.-S. Strategies to Achieve a Carbon Neutral Society: A Review. Environ. Chem. Lett. 2022, 20, 2277–2310. [Google Scholar] [CrossRef]
- Centi, G.; Perathoner, S. Opportunities and Prospects in the Chemical Recycling of Carbon Dioxide to Fuels. Catal. Today 2009, 148, 191–205. [Google Scholar] [CrossRef]
- Saravanan, A.; Kumar, P.S.; Vo, D.V.N.; Jeevanantham, S.; Bhuvaneswari, V.; Narayanan, V.A.; Yaashikaa, P.R.; Swetha, S.; Reshma, B. A comprehensive review on different approaches for CO2 utilization and conversion pathways. Chem. Eng. Sci. 2021, 236, 8. [Google Scholar] [CrossRef]
- Meyer, T.J. Chemical approaches to artificial photosynthesis. Acc. Chem. Res. 1989, 22, 163–170. [Google Scholar] [CrossRef]
- Leitner, W. The coordination chemistry of carbon dioxide and its relevance for catalysis: A critical survey. Coord. Chem. Rev. 1996, 153, 257–284. [Google Scholar] [CrossRef]
- Sakakura, T.; Choi, J.C.; Yasuda, H. Transformation of Carbon Dioxide. Chem. Rev. 2007, 107, 2365–2387. [Google Scholar] [CrossRef]
- Oloman, C.; Li, H. Electrochemical Processing of Carbon Dioxide. ChemSusChem 2008, 1, 385–391. [Google Scholar] [CrossRef]
- Thakur, I.S.; Kumar, M.; Varjani, S.J.; Wu, Y.; Gnansounou, E.; Ravindrane, S. Sequestration and utilization of carbon dioxide by chemical and biological methods for biofuels and biomaterials by chemoautotrophs: Opportunities and challenges. Bioresour. Technol. 2018, 256, 478. [Google Scholar] [CrossRef]
- Roy, S.; Cherevotan, A.; Peter, S.C. Thermochemical CO2 Hydrogenation to Single Carbon Products: Scientific and Technological Challenges. ACS Energy Lett. 2018, 3, 1938–1966. [Google Scholar] [CrossRef]
- Koh, J.H.; Won, D.H.; Eom, T.; Kim, N.-K.; Jung, K.D.; Kim, H.; Hwang, Y.J.; Min, B.K. Facile CO2 electro-reduction to formate via oxygen bidentate intermediate stabilized by high-index planes of Bi dendrite catalyst. ACS Catal. 2017, 7, 5071–5077. [Google Scholar] [CrossRef]
- Al-Tamreh, S.A.; Ibrahim, M.H.; El-Naas, M.H.; Vaes, J.; Pant, D.; Benamor, A.; Amhamed, A. Electroreduction of Carbon Dioxide into Formate: A Comprehensive Review. ChemElectroChem 2021, 8, 3207–3222. [Google Scholar] [CrossRef]
- Feaster, J.T.; Shi, C.; Cave, E.R.; Hatsukade, T.; Abram, D.N.; Kuhl, K.P.; Hahn, C.; Nørskov, J.K.; Jaramillo, T.F. Understanding selectivity for the electrochemical reduction of carbon dioxide to formic acid and carbon monoxide on metal electrodes. ACS Catal. 2017, 7, 4822–4827. [Google Scholar] [CrossRef]
- Hori, Y.; Kikuchi, K.; Suzuki, S. Production of Co and Ch4 in Electrochemical Reduction of Co2 at Metal Electrodes in Aqueous Hydrogencarbonate Solution. Chem. Lett. 1985, 14, 1695–1698. [Google Scholar] [CrossRef]
- Hori, Y.; Takahashi, R.; Yoshinami, Y.; Murata, A. Electrochemical Reduction of CO at a Copper Electrode. J. Phys. Chem. B 1997, 101, 7075–7081. [Google Scholar] [CrossRef]
- Shi, Y.; Wang, Z.; Gao, H.; Niu, J.; Ma, W.; Qin, J.; Peng, Z.; Zhang, Z. A Self-Supported, Three-Dimensional Porous Copper Film as a Current Collector for Advanced Lithium Metal Batteries. J. Mater. Chem. A 2019, 7, 1092–1098. [Google Scholar] [CrossRef]
- Guo, N.; Xue, H.; Bao, A.; Wang, Z.; Sun, J.; Song, T.; Ge, X.; Zhang, W.; Huang, K.; He, F.; et al. Achieving Superior Electrocatalytic Performance by Surface Copper Vacancy Defects during Electrochemical Etching Process. Angew. Chem. Int. Ed. 2020, 59, 13778–13784. [Google Scholar] [CrossRef]
- Deng, W.; Yuan, T.; Chen, S.; Li, H.; Hu, C.; Dong, H.; Wu, B.; Wang, T.; Li, J.; Ozin, G.A.; et al. Effect of Bicarbonate on CO2 Electroreduction over Cathode Catalysts. Fundam. Res. 2021, 1, 432–438. [Google Scholar] [CrossRef]
- Liu, X.; Yang, Z.; Quan, H.; Li, J.; Xiang, Y.; Wu, F. EGaIn Coated 3D-Cu Foam as a Self-Healing Current Collector for Lithium Ion Batteries. Electrochem. Commun. 2021, 132, 107145. [Google Scholar] [CrossRef]
- Nesin, O.M.; Pakhomova, O.N.; Xiao, S.; Pakhomov, A.G. Manipulation of Cell Volume and Membrane Pore Comparison Following Single Cell Permeabilization with 60- and 600-Ns Electric Pulses. Biochim. Et Biophys. Acta (BBA)—Biomembr. 2011, 1808, 792–801. [Google Scholar] [CrossRef]
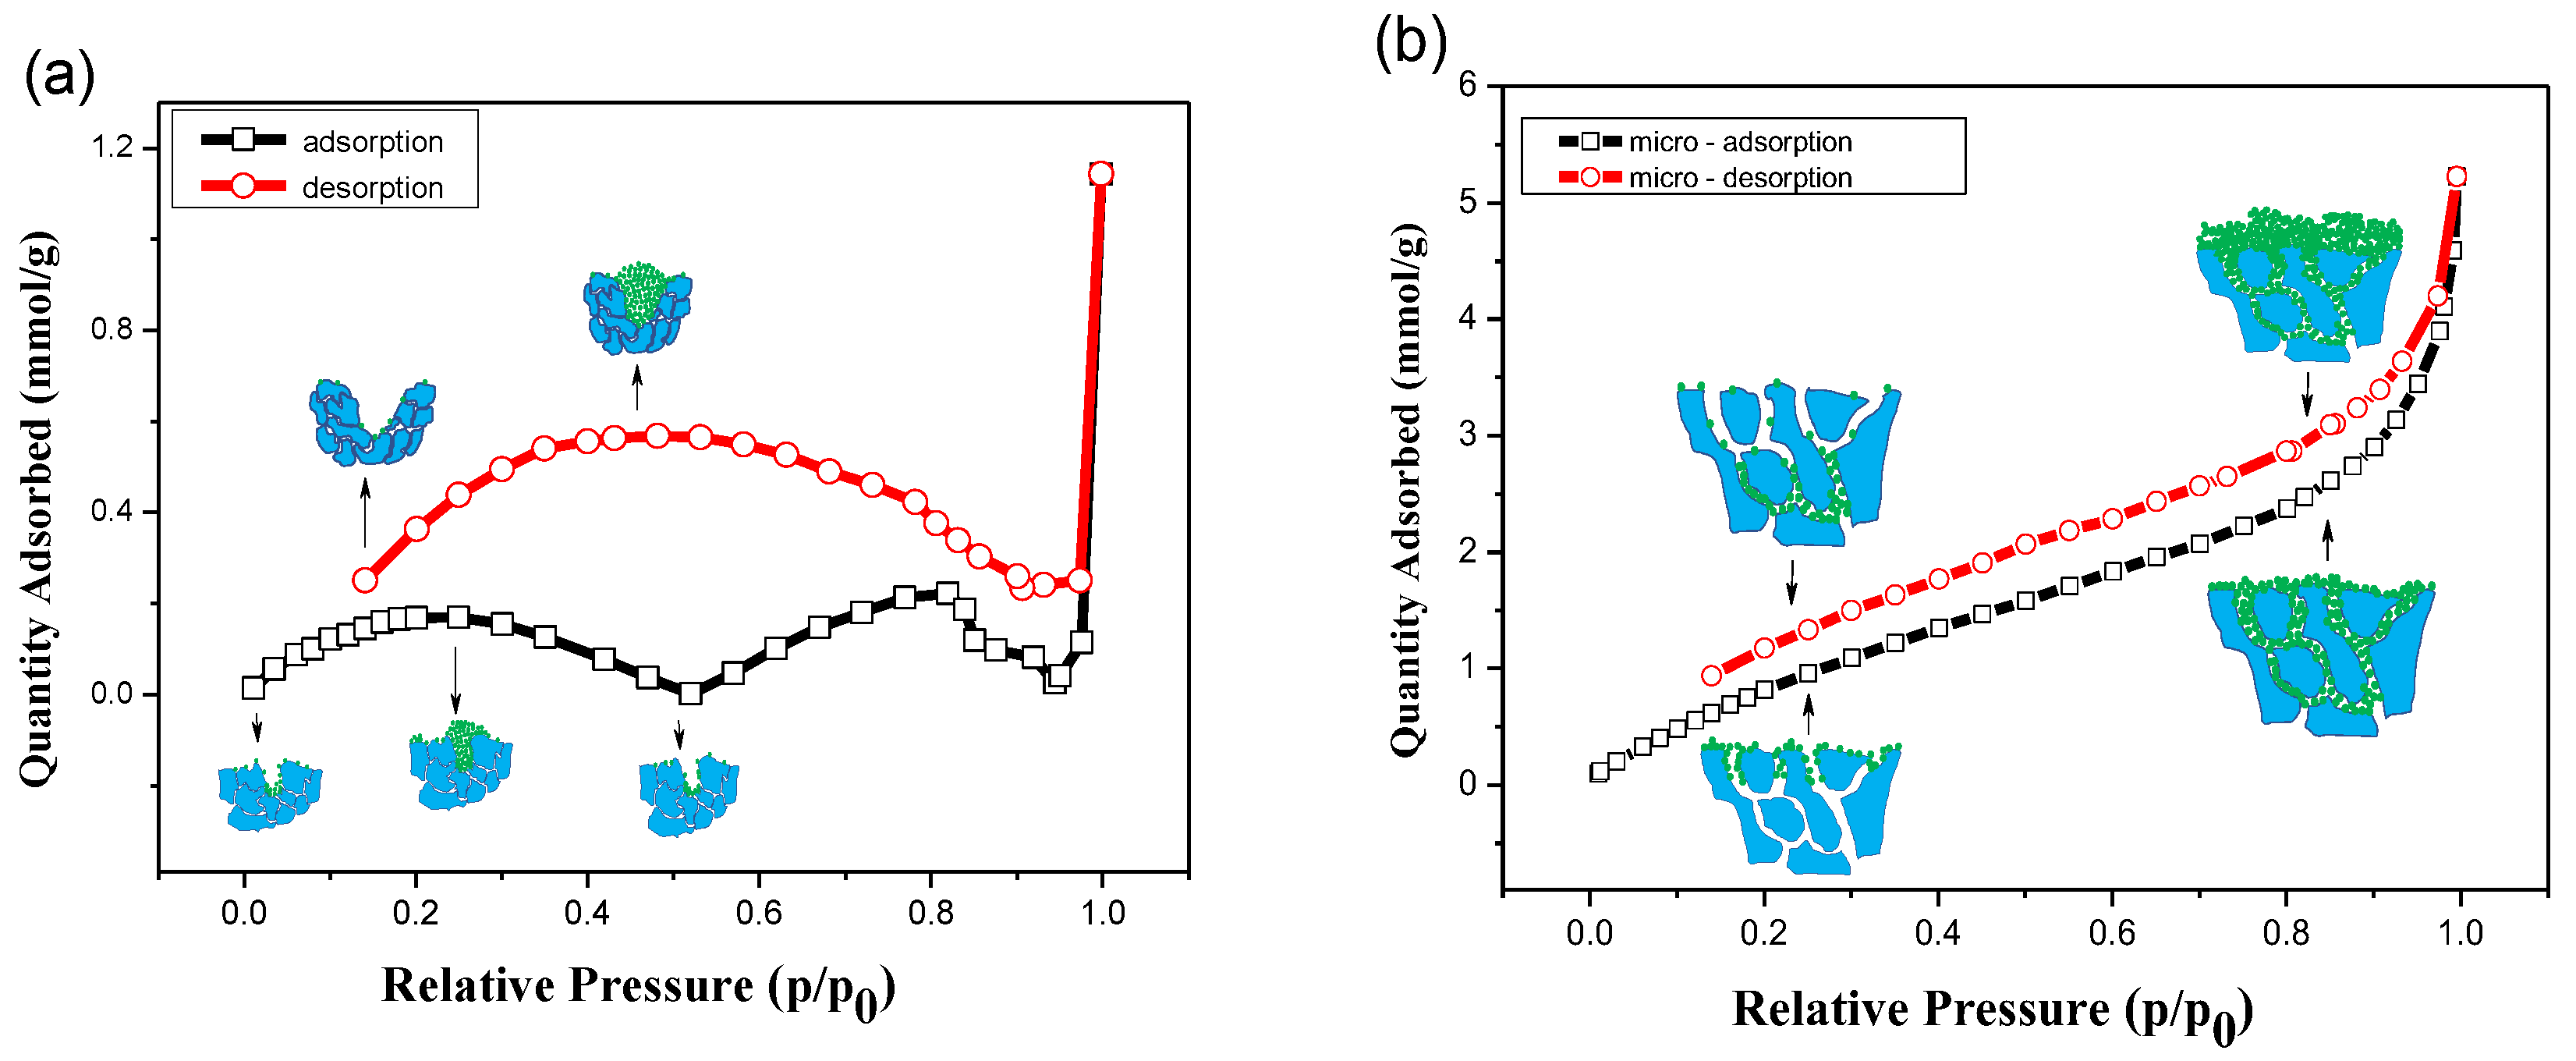
- Qajar, A.; Peer, M.; Rajagopalan, R.; Liu, Y.; Brown, C.; Foley, H.C. Surface Compression of Light Adsorbates inside Microporous PFA-Derived Carbons. Carbon 2013, 60, 538–549. [Google Scholar] [CrossRef]
- Kowalczyk, P.; Furmaniak, S.; Gauden, P.; Terzyk, A. Carbon Dioxide Adsorption-Induced Deformation of Microporous Carbons. J. Phys. Chem. C 2010, 114, 5126–5133. [Google Scholar] [CrossRef]
- Groen, J.C.; Peffer, L.A.A.; Pérez-Ramírez, J. Pore Size Determination in Modified Micro- and Mesoporous Materials. Pitfalls and Limitations in Gas Adsorption Data Analysis. Mesoporous Mater. 2003, 60, 1–17. [Google Scholar] [CrossRef]
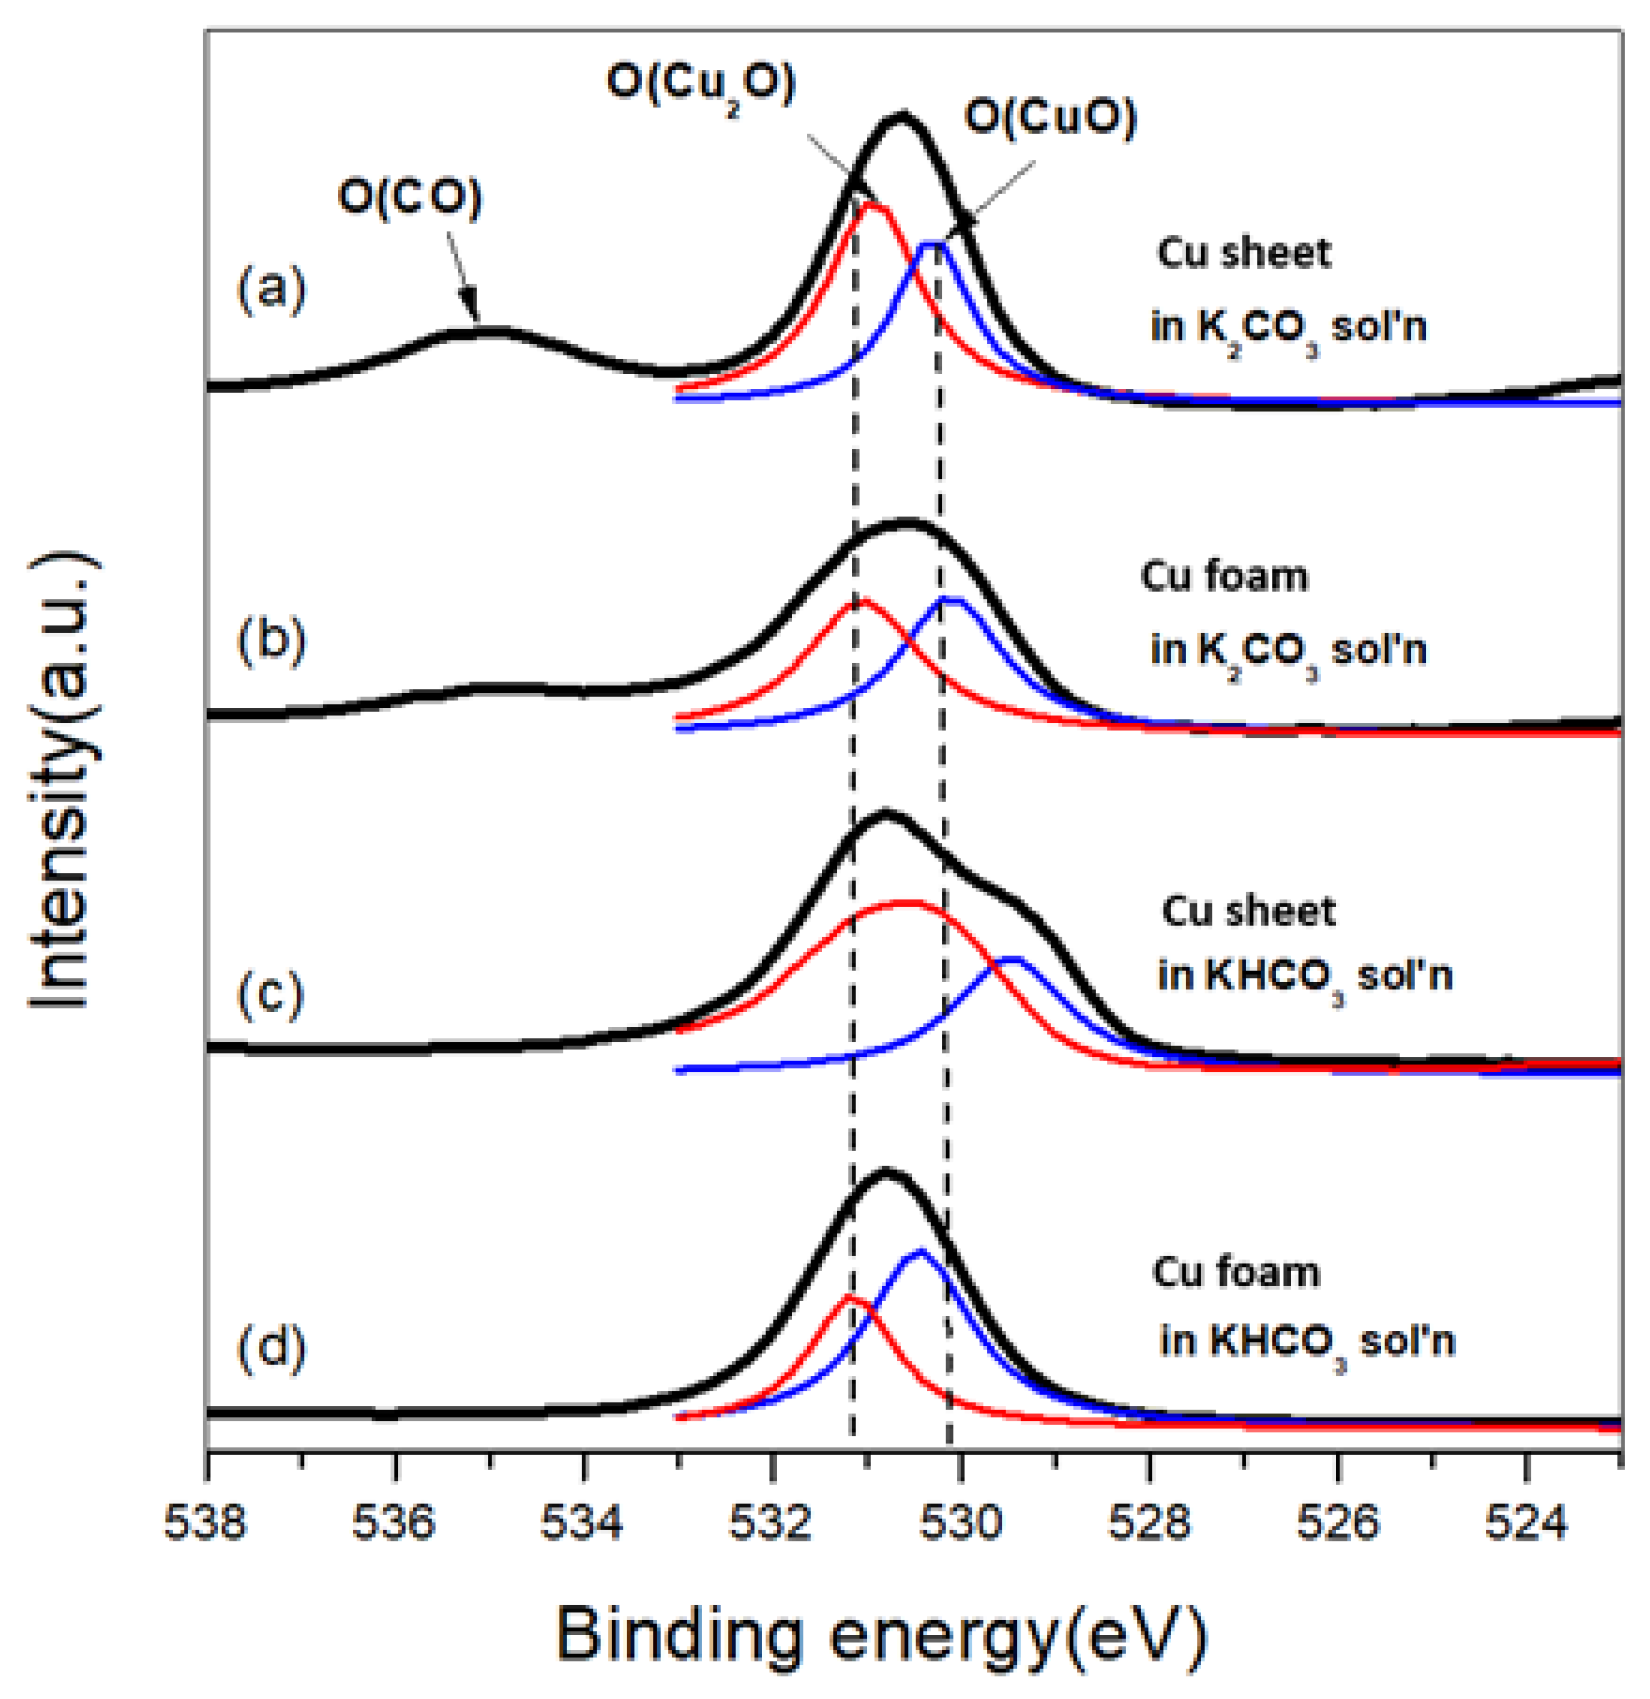
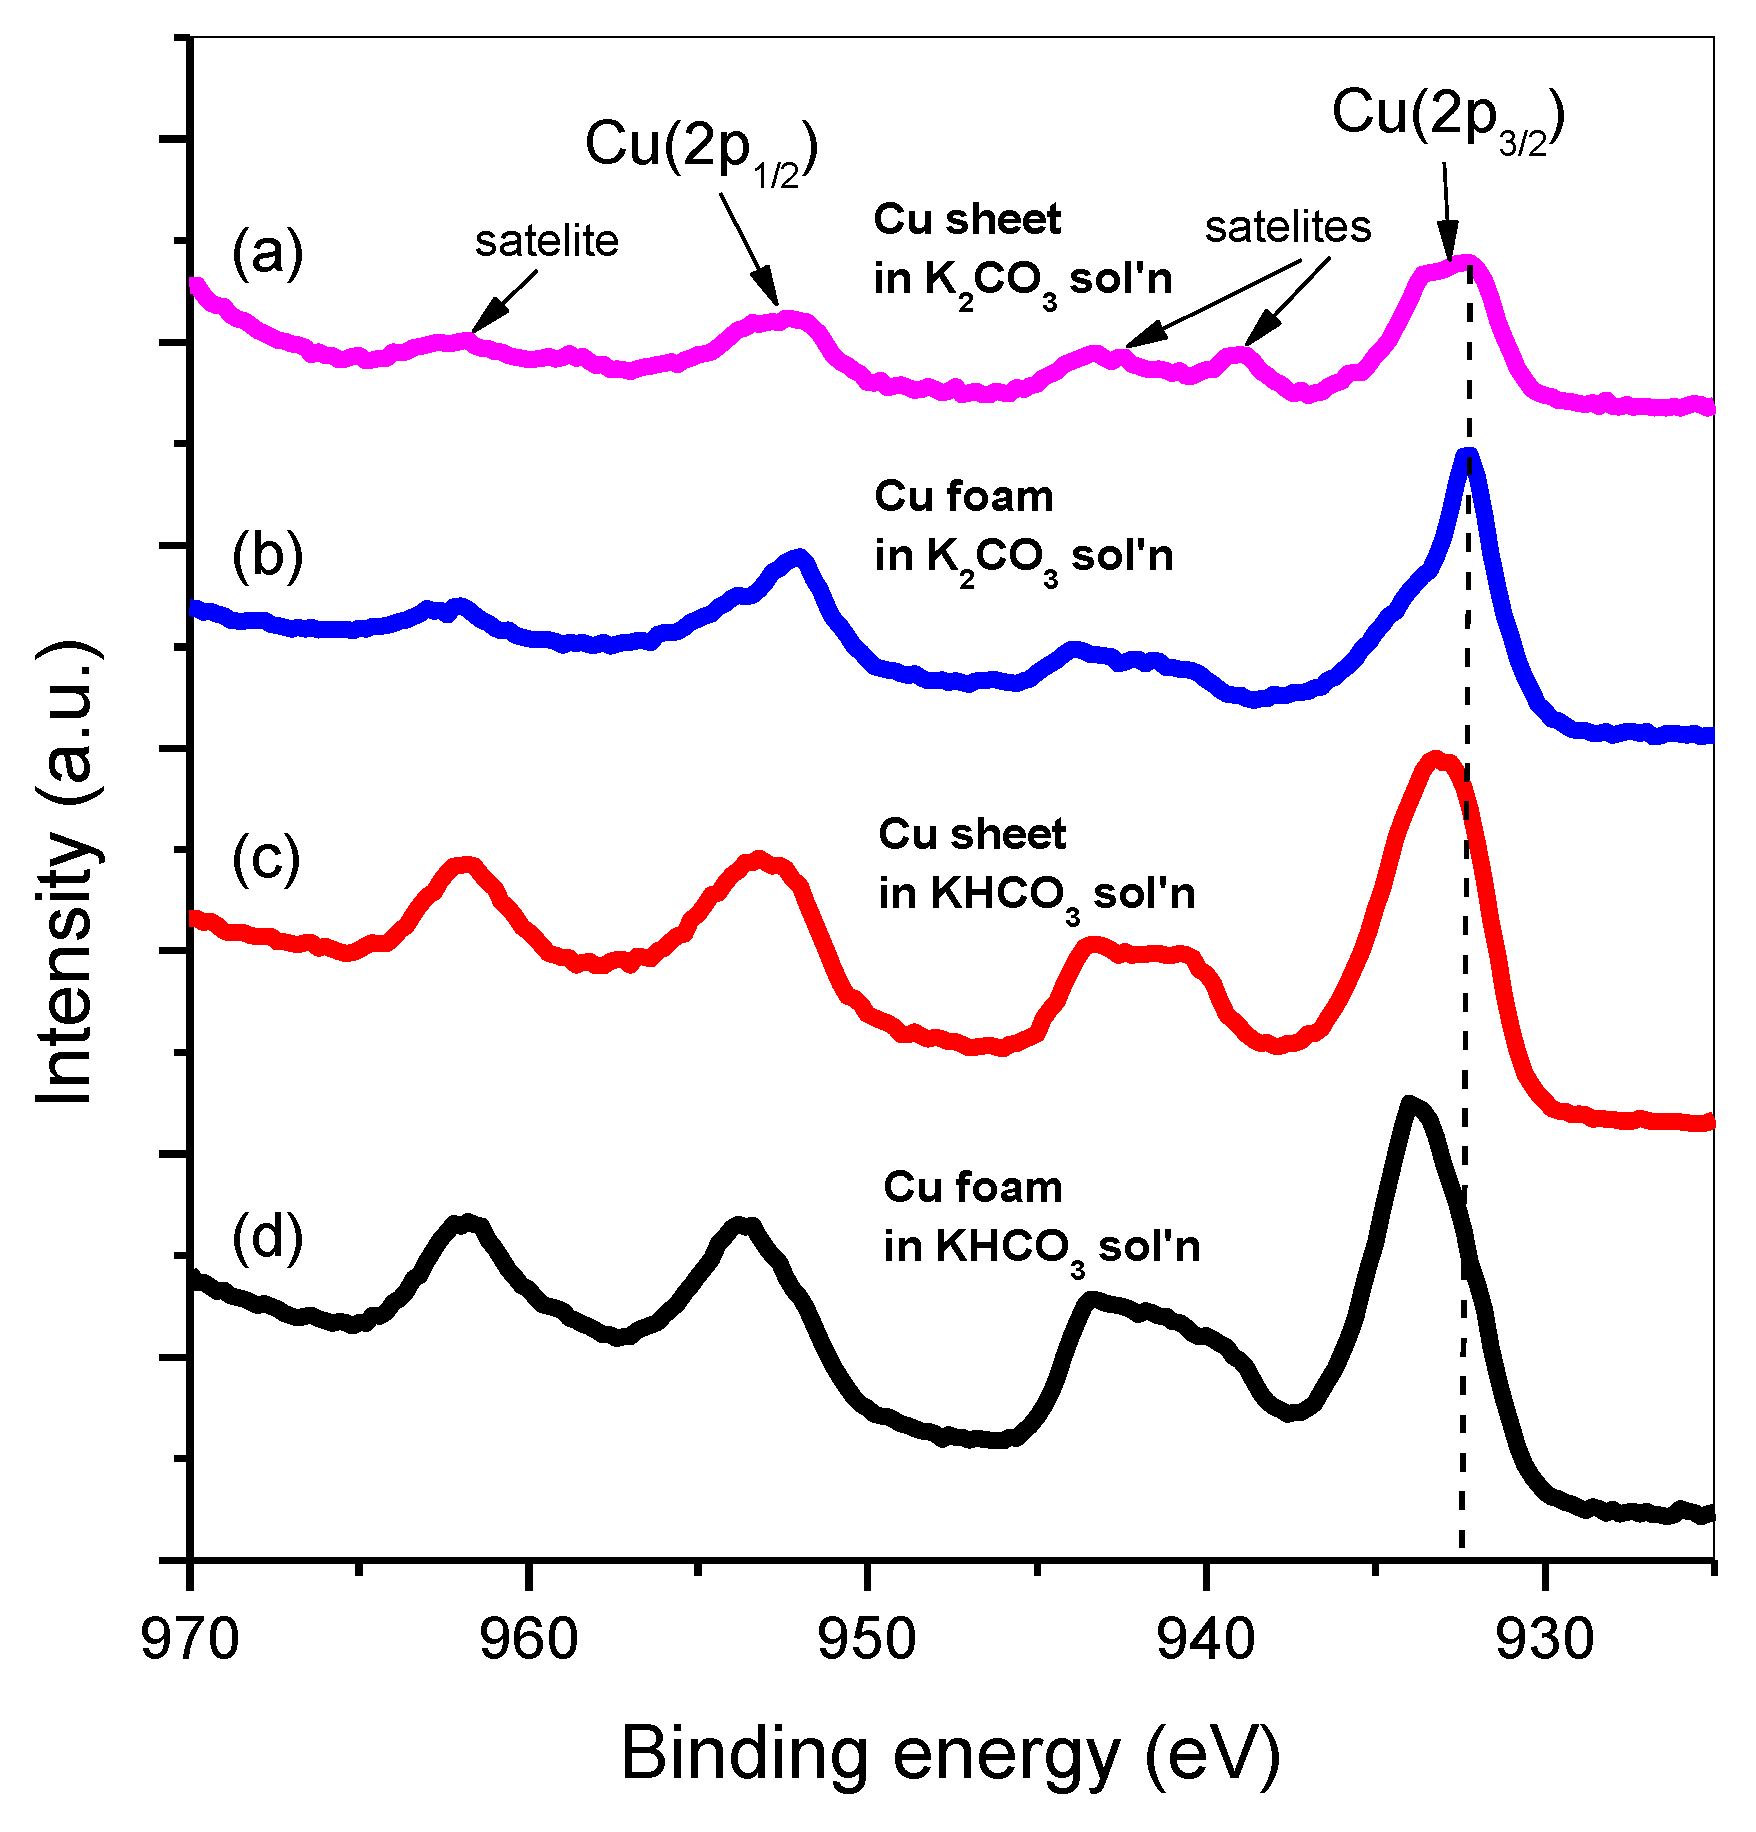
- He, J.; Corneille, J.S.; Estrada, C.A.; Wu, M.; Goodman, D.W. CO Interaction with Ultrathin MgO Films on a Mo(100) Surface Studied by Infrared Reflection–Absorption Spectroscopy, Temperature Programmed Desorption, and X-ray Photoelectron Spectroscopy. J. Vac. Sci. Technol. A 1992, 10, 2248–2252. [Google Scholar] [CrossRef]
- Huang, Y.; Ong, C.W.; Yeo, B.S. Effects of Electrolyte Anions on the Reduction of Carbon Dioxide to Ethylene and Ethanol on Copper (100) and (111) Surfaces. ChemSusChem 2018, 11, 3299–3306. [Google Scholar] [CrossRef] [PubMed]
- Peterson, A.A.; Abild-Pedersen, F.; Studt, F.; Rossmeisl, J.; Nørskov, J.K. How Copper Catalyzes the Electroreduction of Carbon Dioxide into Hydrocarbon Fuels. Energy Environ. Sci. 2010, 3, 1311–1315. [Google Scholar] [CrossRef]
- Hori, Y.; Murata, A.; Takahashi, R. Formation of Hydrocarbons in the Electrochemical Reduction of Carbon Dioxide at a Copper Electrode in Aqueous Solution. J. Chem. Soc. Faraday Trans. 1 1989, 85, 2309–2326. [Google Scholar] [CrossRef]
- Gao, D.; Scholten, F.; Roldan Cuenya, B. Improved CO2 Electroreduction Performance on Plasma-Activated Cu Catalysts via Electrolyte Design: Halide Effect. ACS Catal. 2017, 7, 5112–5120. [Google Scholar] [CrossRef]
- Dutta, A.; Rahaman, M.; Mohos, M.; Zanetti, A.; Broekmann, P. Electrochemical CO2 conversion using skeleton (sponge) type of Cu catalysts. ACS Catal. 2017, 7, 5431–5437. [Google Scholar] [CrossRef]
- Dutta, A.; Rahaman, M.; Luedi, N.C.; Mohos, M.; Broekmann, P. Morphology matters: Tuning the product distribution of CO2 electroreduction on oxide-derived Cu foam catalysts. ACS Catal. 2016, 6, 3804–3814. [Google Scholar] [CrossRef]
- Tang, W.; Peterson, A.A.; Varela, A.S.; Jovanov, Z.P.; Bech, L.; Durand, W.J.; Dahl, S.; Nørskov, J.K.; Chorkendorff, I. The importance of surface morphology in controlling the selectivity of polycrystalline copper for CO2 electroreduction. Phys. Chem. Chem. Phys. 2012, 14, 76–81. [Google Scholar] [CrossRef] [PubMed]
- Mariano, R.G.; McKelvey, K.; White, H.S.; Kanan, M.W. Selective increase in CO2 electroreduction activity at grain-boundary surface terminations. Science 2017, 358, 1187–1192. [Google Scholar] [CrossRef] [PubMed]
- Gupta, N.; Gattrell, M.; MacDougall, B. Calculation for the cathode surface concentrations in the electrochemical reduction of CO2 in KHCO3 solutions. J. Appl. Electrochem. 2006, 36, 161–172. [Google Scholar] [CrossRef]
- Zhang, K.; Zhang, G.; Liu, X.; Phan, A.N.; Luo, K. A Study on CO2 Decomposition to CO and O2 by the Combination of Catalysis and Dielectric-Barrier Discharges at Low Temperatures and Ambient Pressure. Ind. Eng. Chem. Res. 2017, 56, 3204–3216. [Google Scholar] [CrossRef]
- Dutta, A.; Montiel, I.Z.; Erni, R.; Kiran, K.; Rahaman, M.; Drnec, J.; Broekmann, P. Activation of Bimetallic AgCu Foam Electrocatalysts for Ethanol Formation from CO2 by Selective Cu Oxidation/Reduction. Nano Energy 2020, 68, 104331. [Google Scholar] [CrossRef]
- Dutta, A.; Rahaman, M.; Hecker, B.; Drnec, J.; Kiran, K.; Montiel, I.Z.; Weber, D.J.; Zanetti, A.; López, A.C.; Martens, I.; et al. CO2 electrolysis–Complementary operando XRD, XAS and Raman spectroscopy study on the stability of CuxO foam catalysts. J. Catal. 2020, 389, 592–603. [Google Scholar] [CrossRef]
- Hanselman, S.; Koper, M.T.; Calle-Vallejo, F. Computational comparison of late transition metal (100) surfaces for the electrocatalytic reduction of CO to C2 species. ACS Energy Lett. 2018, 3, 1062–1067. [Google Scholar] [CrossRef]
- Dutta, A.; Morstein, C.E.; Rahaman, M.; Lopez, A.C.; Broekmann, P. Beyond Copper in CO2 Electrolysis: Effective Hydrocarbon Production on Silver-Nanofoam Catalysts. ACS Catal. 2018, 8, 8357–8368. [Google Scholar] [CrossRef]
- Reller, C.; Krause, R.; Volkova, E.; Schmid, B.; Neubauer, S.; Rucki, A.; Schuster, M.; Schmid, G. Selective Electroreduction of CO2 toward Ethylene on Nano Dendritic Copper Catalysts at High Current Density. Adv. Energy Mater. 2017, 7, 1602114. [Google Scholar] [CrossRef]
- Padilla, M.; Baturina, O.; Gordon, J.P.; Artyushkova, K.; Atanassov, P.; Serov, A. Selective CO2 electroreduction to C2H4 on porous Cu films synthesized by sacrificial support method. J. CO2 Util. 2017, 19, 137–145. [Google Scholar] [CrossRef]
- Hoang, T.T.H.; Verma, S.; Ma, S.; Fister, T.T.; Timoshenko, J.; Frenkel, A.I.; Kenis, P.J.A.; Gewirth, A.A. Nanoporous Copper–Silver Alloys by Additive-Controlled Electrodeposition for the Selective Electroreduction of CO2 to Ethylene and Ethanol. J. Am. Chem. Soc. 2018, 140, 5791–5797. [Google Scholar] [CrossRef] [PubMed]
- Ahn, S.; Klyukin, K.; Wakeham, R.J.; Rudd, J.A.; Lewis, A.R.; Alexander, S.; Carla, F.; Alexandrov, V.; Andreoli, E. Poly-Amide Modified Cu foam Electrodes for Enhanced Electrochemical Reduction of Carbon Dioxide. ACS Catal. 2018, 8, 4132–4142. [Google Scholar] [CrossRef]
- Hoang, T.T.; Ma, S.; Gold, J.I.; Kenis, P.J.; Gewirth, A.A. Nanoporous copper films by additive-controlled electrodeposition: CO2 reduction catalysis. ACS Catal. 2017, 7, 3313–3321. [Google Scholar] [CrossRef]
- Dunwell, M.; Lu, Q.; Heyes, J.M.; Rosen, J.; Chen, J.G.; Yan, Y.; Jiao, F.; Xu, B. The Central Role of Bicarbonate in the Electrochemical Reduction of Carbon Dioxide on Gold. J. Am. Chem. Soc. 2017, 139, 3774–3783. [Google Scholar] [CrossRef]


| Electrode | FE (%) | Electrolyte | E (vs. RHE) | Current Density (mA/cm2) | Ref |
|---|---|---|---|---|---|
| Ag15Cu85 foam | 36 | 0.5 M KHCO3 | −1.1 | −11.32 | [35] |
| CuxO foam | 6 | 0.5 M KHCO3 | −0.67 | 0.47 | [36] |
| Nanoporous Cu films | 46 | 0.1 M KHCO3 | 0.96 | 14.3 | [37] |
| Ag (CO) | 5 | 0.5 M KHCO3 | −1.5 | −36 | [38] |
| Cu (C2 hydrocarbons) | 22 | 0.1 M KHCO3 | −0.8 | −12 | [30] |
| Nano-deposited Cu dendrites | 57 | 0.1 M KBr/Br2 | −1.85 | 170 | [39] |
| Porous Cu films | 34.8 | 0.1 M KHCO3 | 18 | [40] | |
| Nano-porous CuAg alloy | 60 | 1 M KOH | −0.7 | 300 | [41] |
| Poly-amide-modified Cu foam | 26 | 0.10 M NaHCO3 | −0.95 | 110 | [42] |
| Nanoporous Cu films | 40 | 1 M KOH | 700 A/g | [43] | |
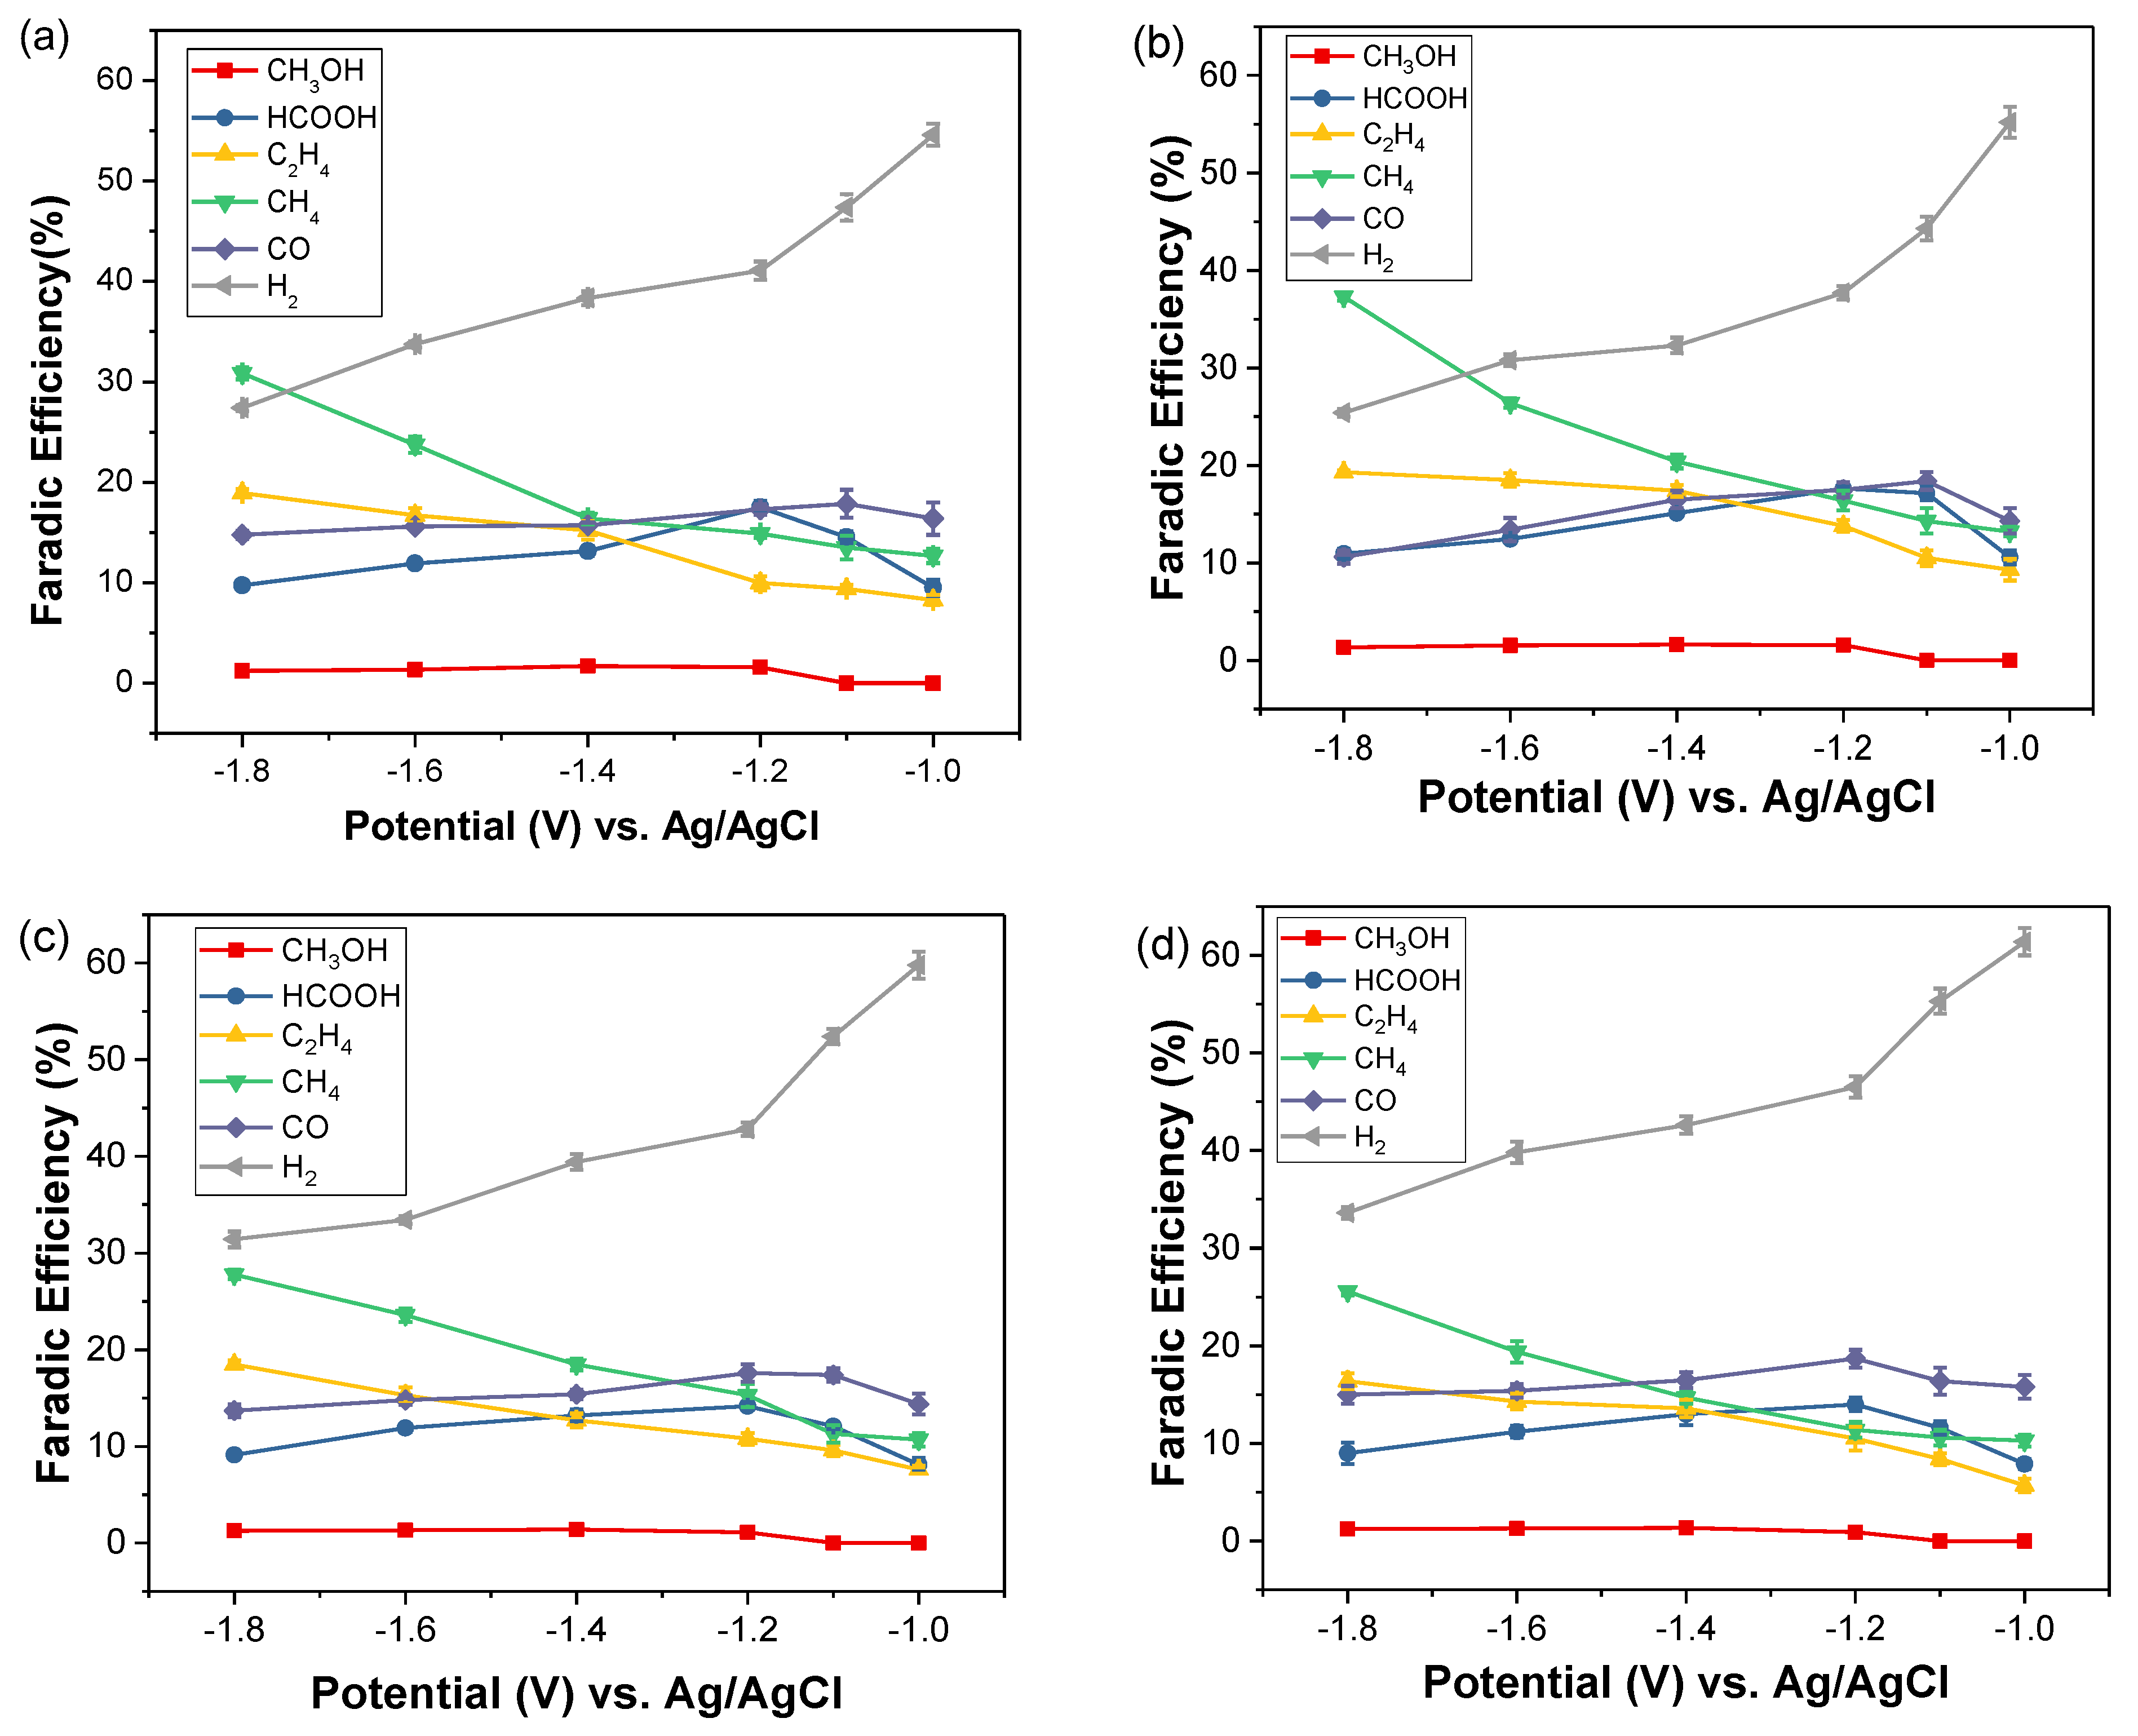
| Cu foam | 9.6 | 0.5 M KHCO3 | −0.9 | 5.6 | This study |
Disclaimer/Publisher’s Note: The statements, opinions and data contained in all publications are solely those of the individual author(s) and contributor(s) and not of MDPI and/or the editor(s). MDPI and/or the editor(s) disclaim responsibility for any injury to people or property resulting from any ideas, methods, instructions or products referred to in the content. |
© 2024 by the authors. Licensee MDPI, Basel, Switzerland. This article is an open access article distributed under the terms and conditions of the Creative Commons Attribution (CC BY) license (https://creativecommons.org/licenses/by/4.0/).
Share and Cite
Lee, Y.-G.; Chiao, H.-H.; Weng, Y.-C.; Lay, C.-H. The Influence of the Cu Foam on the Electrochemical Reduction of Carbon Dioxide. Inorganics 2024, 12, 57. https://doi.org/10.3390/inorganics12020057
Lee Y-G, Chiao H-H, Weng Y-C, Lay C-H. The Influence of the Cu Foam on the Electrochemical Reduction of Carbon Dioxide. Inorganics. 2024; 12(2):57. https://doi.org/10.3390/inorganics12020057
Chicago/Turabian StyleLee, Yuan-Gee, Hui-Hsuan Chiao, Yu-Ching Weng, and Chyi-How Lay. 2024. "The Influence of the Cu Foam on the Electrochemical Reduction of Carbon Dioxide" Inorganics 12, no. 2: 57. https://doi.org/10.3390/inorganics12020057
APA StyleLee, Y.-G., Chiao, H.-H., Weng, Y.-C., & Lay, C.-H. (2024). The Influence of the Cu Foam on the Electrochemical Reduction of Carbon Dioxide. Inorganics, 12(2), 57. https://doi.org/10.3390/inorganics12020057