2.1. Predicted Data from Nernst–Hartley Equations and Comparison with New Experimental Data and Their Analysis for Two Aqueous Systems: (CoCl2 Plus NaCl) and (CoCl2 Plus HCl)
Table 2 and
Table 3 summarize the predicted and experimental values of the D
ab diffusion coefficients for solutions of different compositions for two aqueous systems {(CoCl
2 plus NaCl) and (CoCl
2 plus HCl)}. Regarding the last values, they were obtained from at least six independent measurements, all carried out in the present work. The main diffusion coefficients
D11 and
D22 were generally reproducible within ±(0.020 × 10
−9 m
2 s
−1, and the cross-coefficients were in general reproducible within about ±(0.040 × 10
−9 m
2 s
−1).
An analysis of
Table 2 and
Table 3 shows that there is a reasonable agreement between the experimental and predicted data for diluted solutions. The deviations between experimental and predicted main diffusion coefficients are generally less than 5%.
Nonideal solution behaviour and electrophoretic terms not included in the Nernst limiting Dab estimations can explain the highest deviations observed.
It is important to highlight that there is a similar behaviour observed in the variation of these parameters Dab (experimental and theoretical) as a function of their composition. Furthermore, it should be noted that although the predicted Dab values are the same for equal CoCl2 solute fractions, X1, but calculated with different concentrations of each component, the same does not apply to the experimental data.
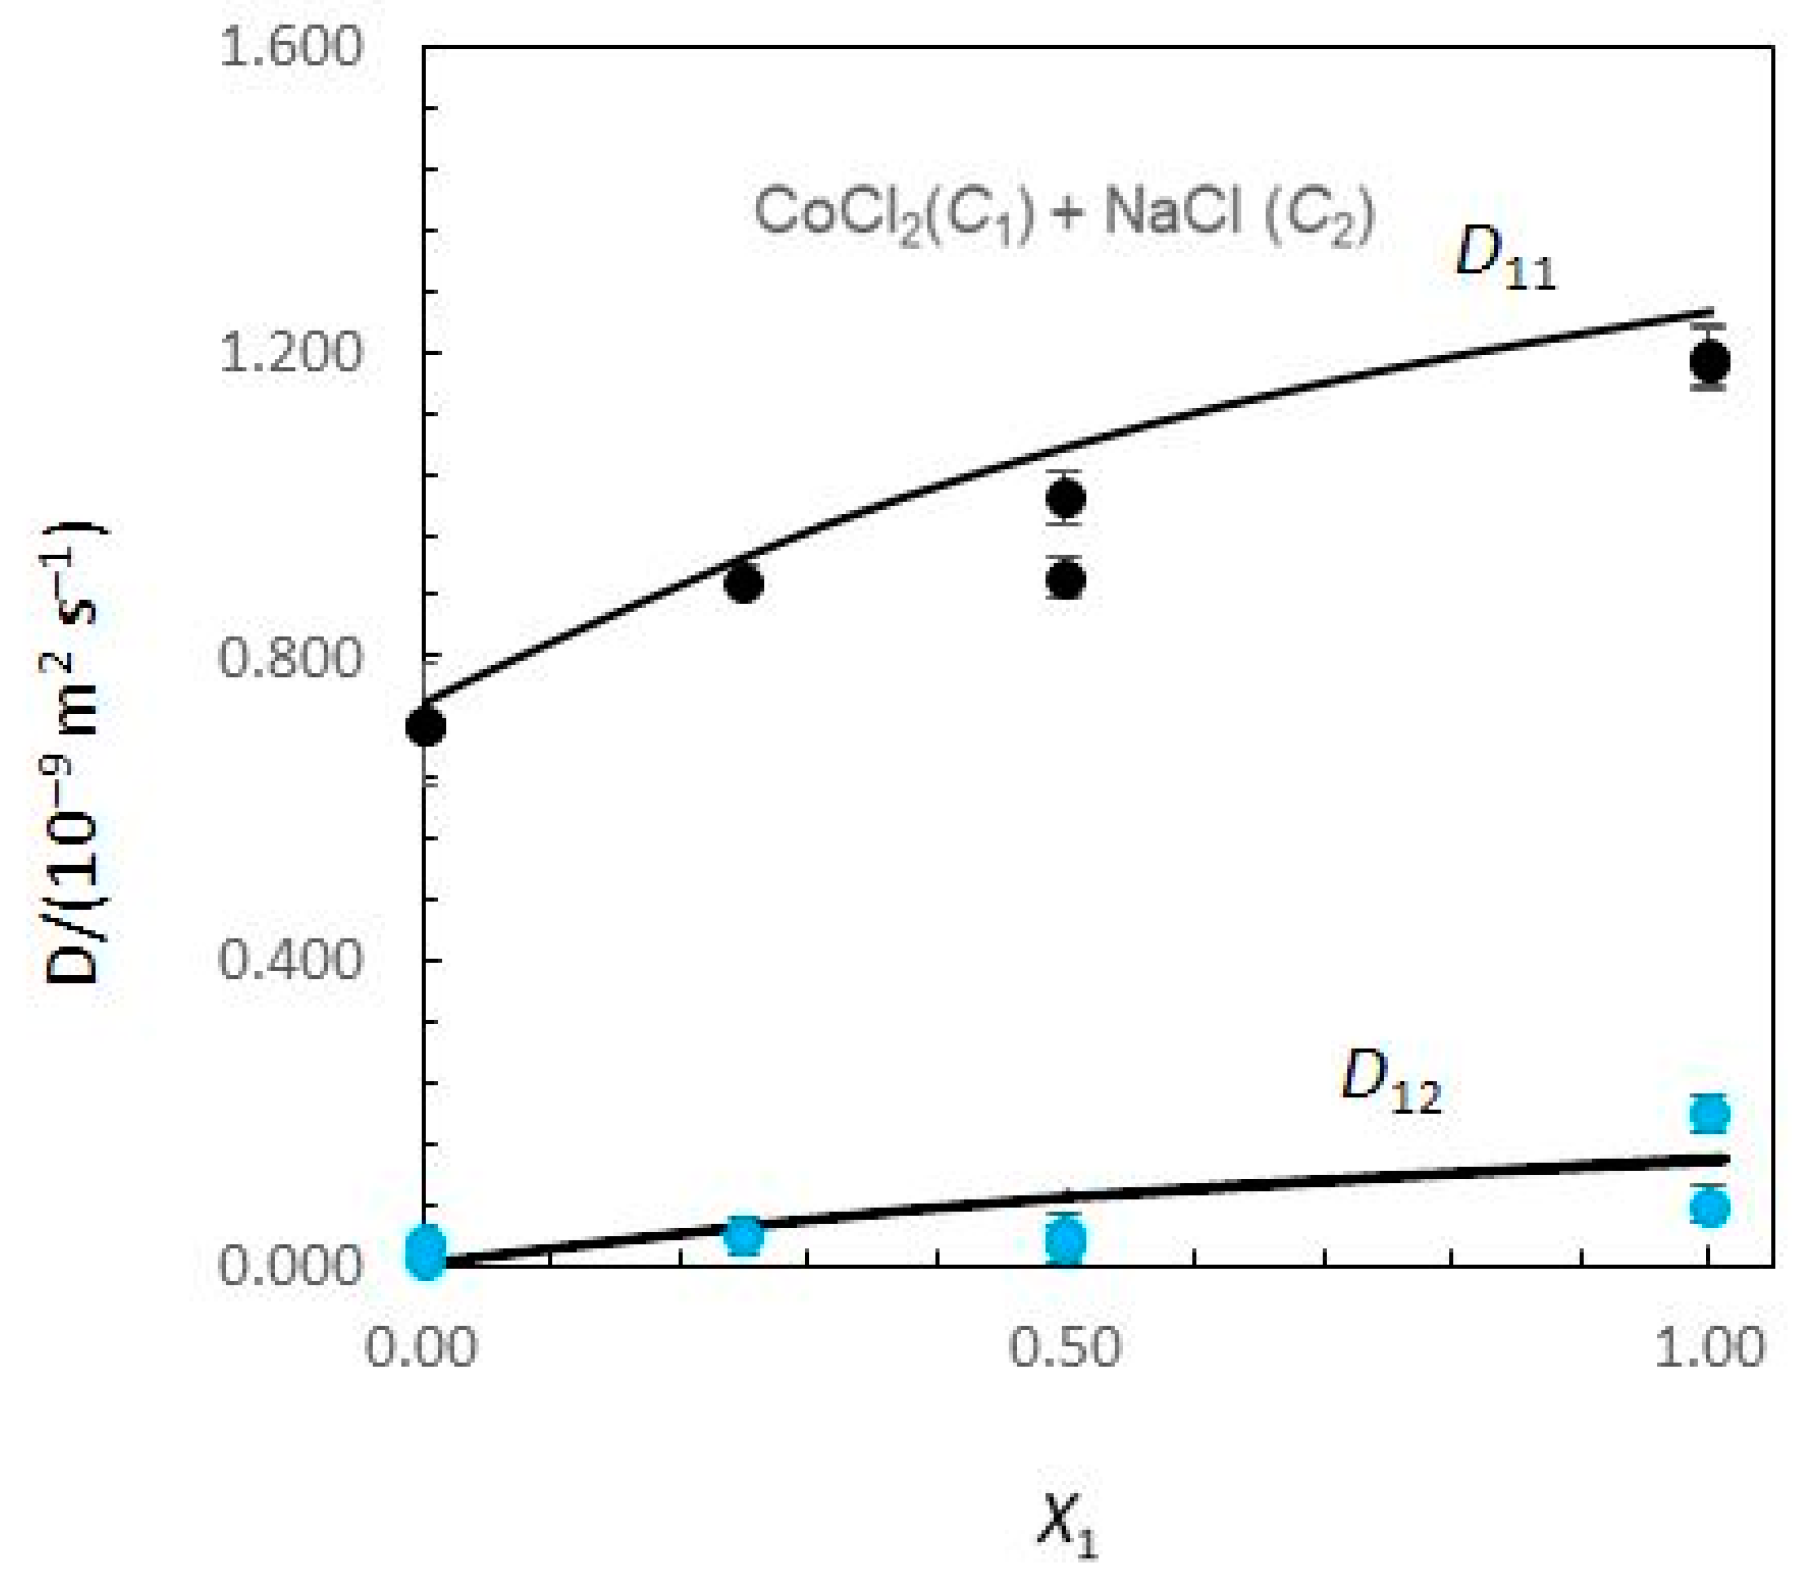
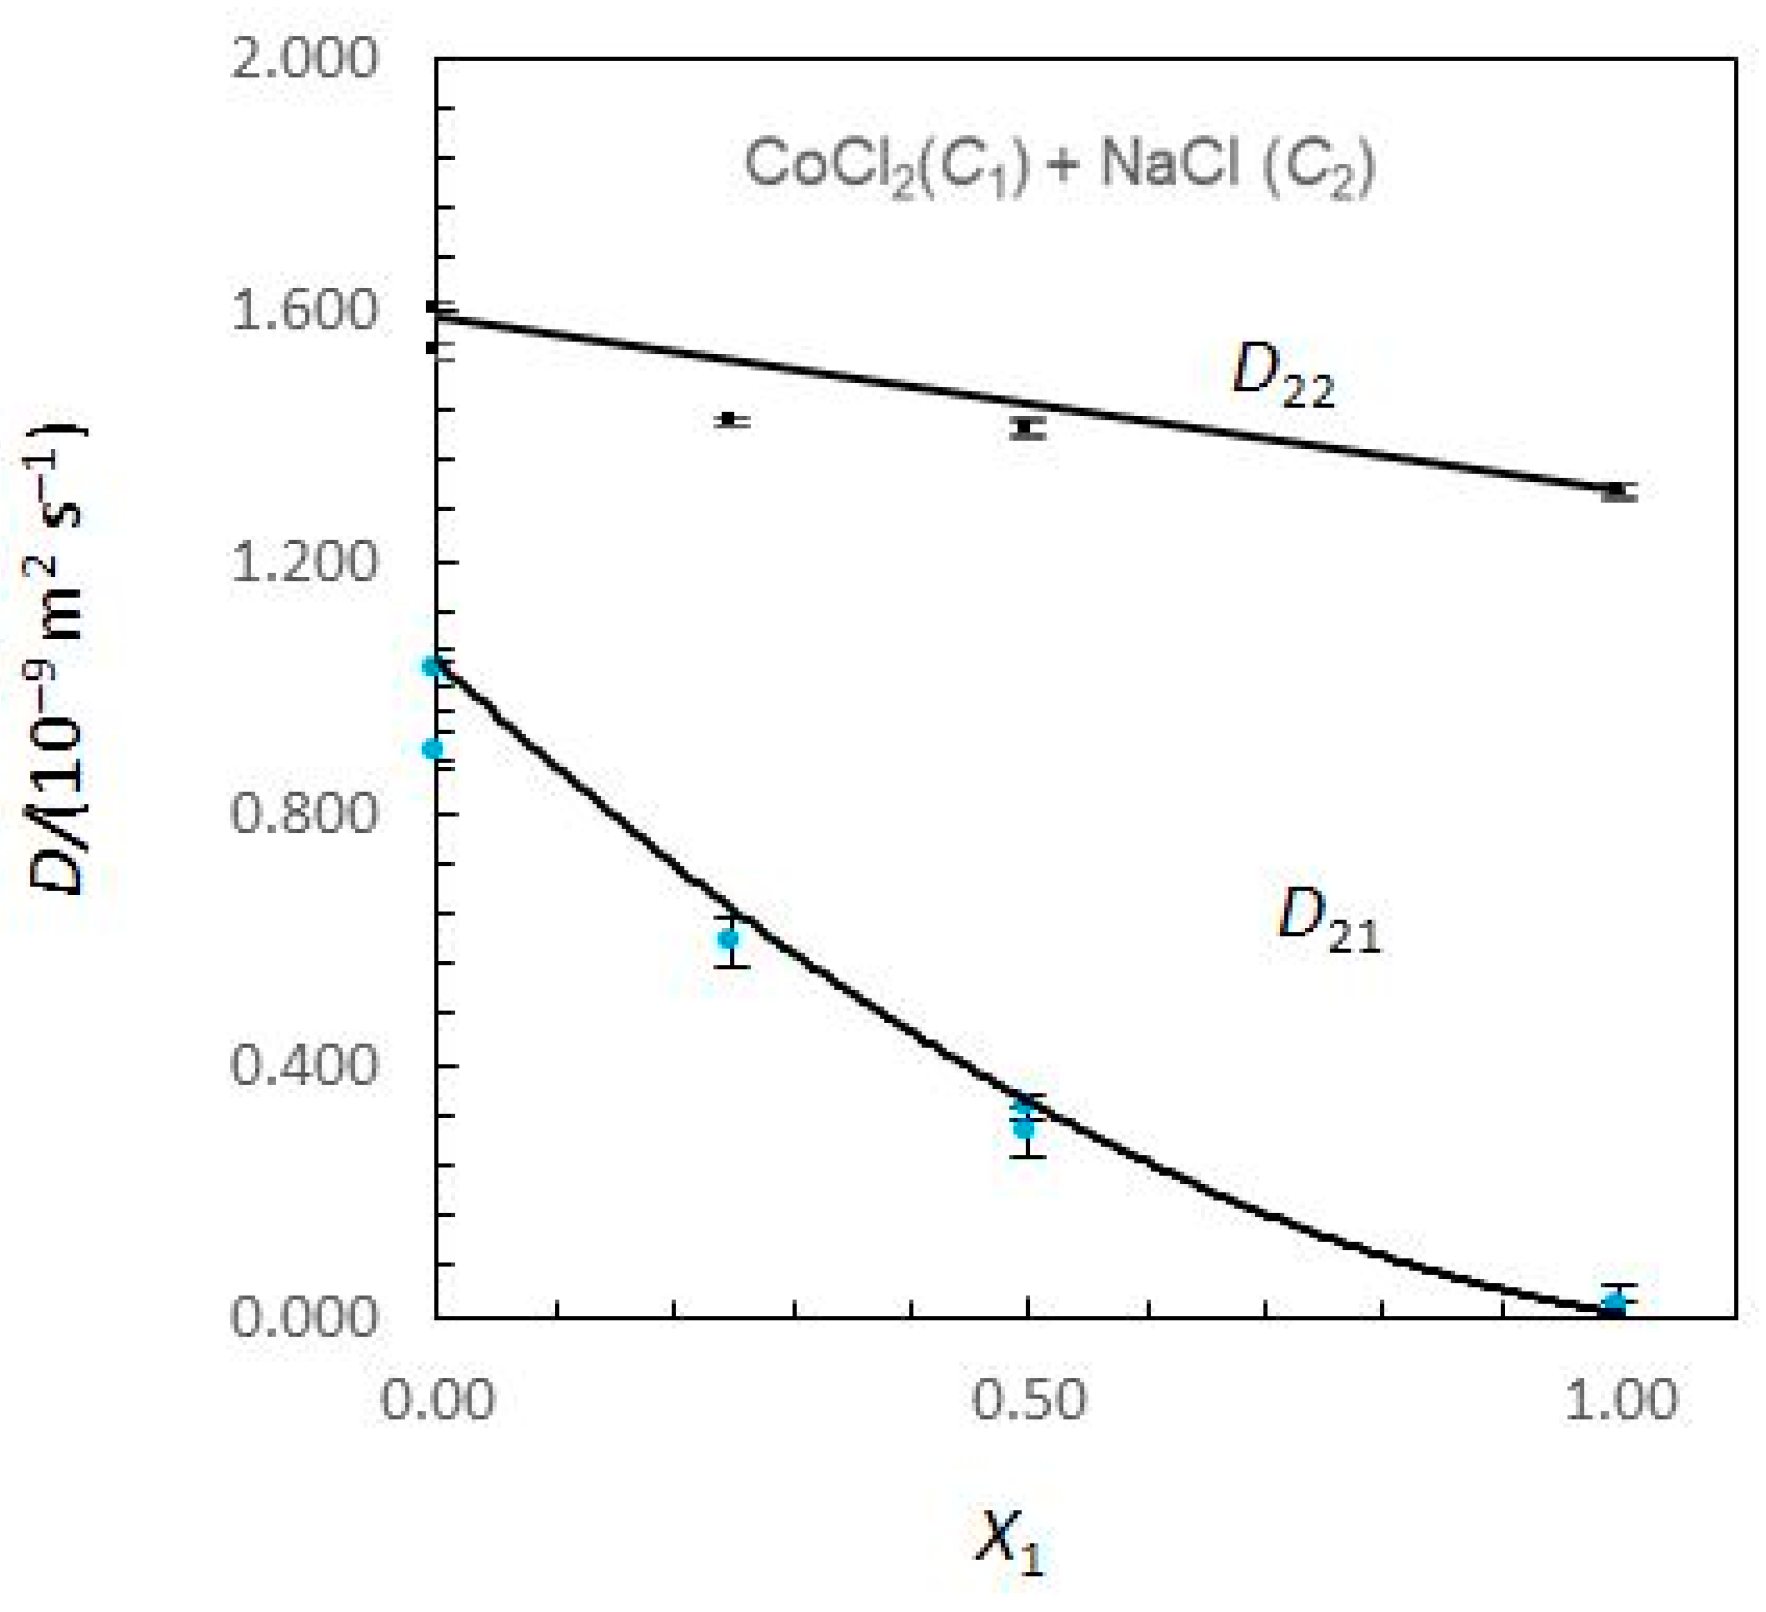
Figure 1 and
Figure 2 show the limiting Nernst–Hartley
Dik coefficients for aqueous CoCl
2 (
C1) + NaCl (
C2) solutions plotted against the solute fraction of CoCl
2.
Considering
Figure 1, the Nernst–Hartley
D11 values for composition limits
X1 = 0 and
X1 = 1 are
DCo (the tracer diffusion coefficient of Co
2+ ions in supporting NaCl solutions) and
(the binary mutual diffusion coefficient of aqueous CoCl
2), respectively. Equivalently, the limiting
D22 values for
X1 = 0 and
X1 = 1 are
and
DNa. As the solute fraction of CoCl
2 increases from 0 to 1,
D12 changes from 0 to
and
D21 changes from
to 0. In these intervals of concentrations, a significant variation of
D12 and
D21 is observed. While
D12 are negative,
D21 are positive. At
X1 = 1,
D21 is zero, because sodium chloride concentration gradients cannot drive coupled flows of cobalt chloride in solutions. Similarly,
D12 → 0 as
X1 → 0.
A possible justification for the behaviour of coupled diffusion can be made on the basis of the electrostatic mechanism. The diffusion coefficient of the Cl
− ions is larger than that of the Co
2+ ions (
Table 1). Consequently, a CoCl
2 concentration gradient produces an electric field that slows down the Cl
− ions and speeds up the Co
2+ ions to maintain electroneutrality along the diffusion path. If NaCl is present in the solution, the electric field generated by a CoCl
2 concentration gradient drives a coupled flow of Na
+ ions in the same direction as the flux of Co
2+, helping to explain the positive values estimated for cross-coefficient
D21. Similarly,
DNa <
DCl and
D12 > 0. However, it can also be worth noticing the higher values obtained for
D21 when compared with those obtained for
D12.
Table 3 shows the effects of coupled diffusion between these CoCl
2 and HCl components. In this case, as the diffusion coefficient of the H
+ ions is much larger than that of the Cl
− ions (
Table 1); a HCl concentration gradient produces an electric field which slows down the Co
2+ ions and speeds up the Cl
− ions to maintain electroneutrality. Consequently,
D12 < 0.
It can be concluded that strongly coupled diffusion occurs between cobalt chloride and hydrochloric acid, while sodium chloride gradients have a weaker influence on cobalt chloride diffusion. Furthermore, these predicted values are usually acceptable at highly diluted solutions, as the differences between them and experimental values are equal to, or less than, experimental uncertainty. In conclusion, when there is no experimental diffusion data, we can use the Nernst–Hartley equations to comprehend the composition dependence of the mutual diffusion coefficients of ternary systems, despite the limitations of this approach.
2.2. Predicted Ternary Diffusion Coefficients from Nernst Equations for Different Aqueous Systems
From the analysis of
Table 4,
Table 5,
Table 6,
Table 7,
Table 8 and
Table 9, it can be inferred that for these solutions of these mixed electrolytes, the tendency of limiting ternary coefficients with the composition is similar. For example, in four aqueous systems {(CoCl
2 + HCl), (CrCl
3 + HCl), (HgCl
2 + HCl), and (PbCl
2 + HCL)}, the
D22 values are considerably larger than the
D11 values and increase dramatically with the solute 1 fraction, defined as
X1 =
C1/(
C1 +
C2)). Also, the cross-coefficient
D12 becomes very large and negative with the increasing solute 1 fraction.
The values of the ternary diffusion coefficient ratios
D12/
D22 and
D21/
D11 (
Table 10 and
Table 11) permit us to give the number of moles of one component transported per mole of the other component.
From
Table 10, the higher positive value obtained for
D12/
D22 in the CrCl
3/NaCl system, when compared with the others, stands out; therefore, we can say that one mole of diffusing NaCl co-transports up to 2.9 mol of CrCl
3.
Relative to the effects of added hydrochloric acid on the diffusion of aqueous CoCl2, CrCl3, HgCl2, and PbCl2, the D12/D22 values are lower and similar between them (that is, one mole of diffusing HCl counter-transports up to 0.1 of MCl2 (M = Co2+, Hg2+, Pb2+) and 0.2 mol of CrCl3.
From the positive
D21/
D11 values (
Table 11), it can be concluded that a mole of diffusing of MCl
2 (M = Co
2+, Hg
2+, Pb
2+) and CrCl
3 favour the transport of NaCl (and HCl) in the same direction. However, the added HCl is more relevant, considering the highest values for this ratio (achieving the maximum value for system CrCl
3 plus HCl). In this case, a mole of diffusing CrCl
3 co-transports at most 6 mol of HCl).
Based on these observations, it can be inferred that there is coupled diffusion in such systems that disrupts the thermodynamic equilibrium. For instance, when cobalt–chromium dental alloys are present in the oral cavity and exposed to low pH, it can create favourable conditions for the production of flows of chromium ions into the human body.
Figure 3 illustrates the coupled diffusion occurring in these aqueous systems, revealing the number of moles of salts containing metallic ions (Co
2+, Hg
2+, Pb
2+, and Cr
3+) transported by each mole of NaCl and HCl at different pHs. That is, the values
D12/
D22 are plotted for each system at different pHs (
Table 10).
From
Figure 3, we can observe that the D
12/D
22 values are close, independent of the pH level.
However, the direction of flux of these ions depends strongly on the component added to these systems. While NaCl concentration gradients drive co-current fluxes of Co2+, Hg2+, Pb2+, and Cr3+ in solutions, HCl concentration gradients drive counter-current fluxes of these ions in solutions.


