Article

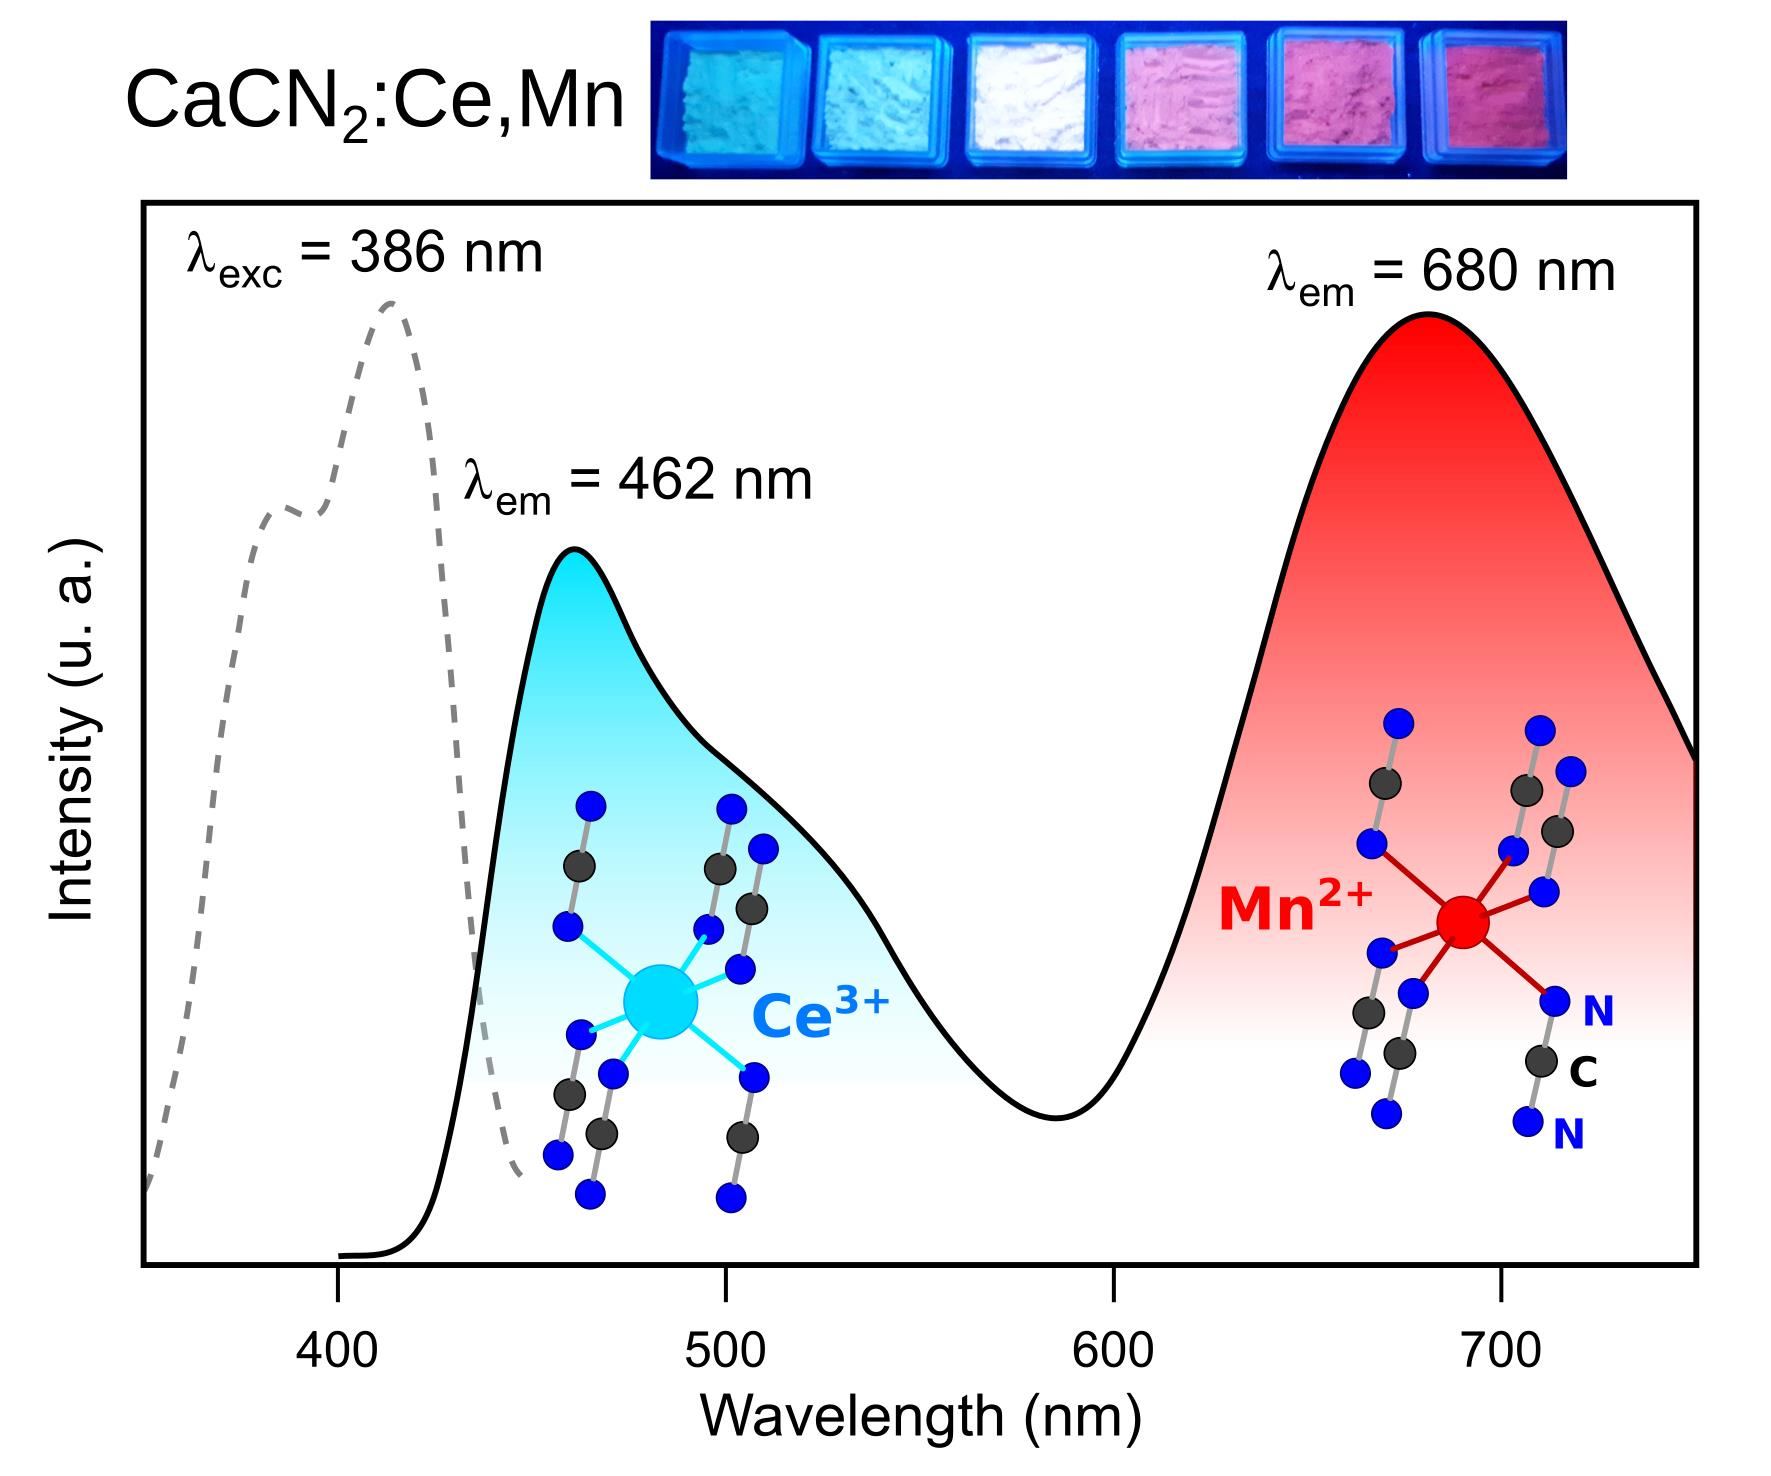
Synthesis, Luminescence and Energy Transfer Properties of Ce3+/Mn2+ Co-Doped Calcium Carbodiimide Phosphors

by
Erwan Leysour de Rohello
1,
Yan Suffren
1,
Francis Gouttefangeas
2,
Odile Merdrignac-Conanec
1,
Olivier Guillou
1 and
François Cheviré
1,*
1
Univ Rennes 1, INSA Rennes, CNRS, ISCR (Institut des Sciences Chimiques de Rennes)—UMR 6226, F 35000 Rennes, France
2
Univ Rennes 1, CNRS, ScanMAT—UAR 2025, F 35000 Rennes, France
*
Author to whom correspondence should be addressed.
Inorganics 2023, 11(7), 291; https://doi.org/10.3390/inorganics11070291
Submission received: 6 June 2023 / Revised: 26 June 2023 / Accepted: 4 July 2023 / Published: 7 July 2023
(This article belongs to the Special Issue 10th Anniversary of Inorganics: Inorganic Solid State Chemistry)

Abstract

:
Ce3+-doped and Ce3+/Mn2+ co-doped calcium carbodiimide (CaCN2) phosphors were synthesized from doped calcium carbonate and carbon nitride by a solid-state reaction at 700 °C under flowing NH3 using a very short reaction time (1 h). The samples were characterized by powder X-ray diffraction, scanning electron microscopy and their diffuse reflectance and luminescence properties were investigated. Single-doped CaCN2:Ce3+ exhibits a blue emission under near-ultraviolet activation (386 nm) corresponding to the 5d12F5/2 and 5d12F7/2 transitions of Ce3+. Maximum emission is obtained at temperatures lower than 150 K and then progressively decreases up to 387 K, with an 80% drop in the emission at room temperature. Efficient energy transfers from Ce3+ to Mn2+ via a non-radiative dipole–dipole mechanism are evidenced for the co-doped samples, leading to various colored phosphors under near-ultraviolet activation (386 nm). The emission color of the obtained phosphors can be modulated from blue to red through a shade of white depending on the sensitizer/activator ratio.

Graphical Abstract

1. Introduction

Light-emitting diodes (LEDs) are considered as indispensable solid-state light sources for the next generation of lighting. In this current era of energy saving and sustainable development, LEDs represent a green alternative to other conventional lighting systems used nowadays. In particular, LEDs have some advantages over fluorescent and incandescent lamps such as high efficiency, energy saving, long operation lifetime and mercury free. Nowadays, conventional white LEDs are made up of a blue LED chip (GaN/InGaN) coated with a yellowish light-emitting phosphor (Y3Al5O12:Ce3+, YAG:Ce3+). However, the light produced by such devices lacks some red emission component, which results in a bad rendering of the colors of the illuminated objects and high correlated color temperature [1,2]. In addition, recent studies have reported that prolonged exposure to artificial blue-rich white light can have a harmful effect on mental alertness, circadian rhythm, metabolism and mood patterns as the photosensitive ganglion cells in the retina signal the brain to stop producing melatonin [3,4]. To overcome these problems, the development of blue, red and green phosphors that can be excited by near-ultraviolet (near-UV) light-emitting diodes has been largely investigated within the past decade. Nonetheless, to date, the strategy of using multiphosphors usually suffers from several drawbacks which are a high manufacturing cost, the trade-off in luminous efficiency attributed to re-absorption among the different phosphors and the non-uniformity of luminescent properties within the phosphor mixture, leading to color alteration [5,6]. Hence, many efforts have been devoted to design single-phase white light-emitting phosphors, which have benefits, such as good emission color stability and high color rendering index [7,8,9,10].
Over the last decade, inorganic carbodiimide materials with the general formula Mx(NCN)y (M = alkali, alkaline-earth, rare-earth or transition metals) have emerged as potential materials for lighting due to their remarkably high thermal and chemical properties [11,12,13,14,15,16,17,18,19,20]. More particularly, the emission properties of rare earth elements involving 5d-4f electronic transitions, i.e., Eu2+ and Ce3+, were recently investigated in various carbodiimides hosts such as SrCN2:Eu2+ (orange red) [14,15,16], BaCN2:Eu2+ (red) [17] or Gd2(CN2)3:Ce3+ (yellow) [11] with activation capabilities in the near-UV-blue range. Since the involved 5d orbitals are external, the position of these energy levels and, consequently, the wavelengths of excitation and emission bands strongly depend on the host lattices. As a nitrogen-containing pseudo-chalcogenide anion, the [N=C=N]2− group has an electronegativity value of 3.36 within those of N3− and O2−, 3.04 and 3.44, respectively [21,22], thus a lower nephelauxetic effect on activators nd states is expected compared to nitrides in regard to oxides hosts. A common carbodiimide compound is CaCN2 used as fertilizer since the early 20th century and obtained from the reaction of CaC2 with nitrogen at 1000 °C [23]. CaCN2 crystallizes in the rhombohedral R 3 ¯ m space group (No. 166) and its crystal structure is displayed in Figure S1. In CaCN2, the Ca2+ cation is octahedrally coordinated by nitrogen atoms within layers, that spray parallel to the (001) plane, formed by edge-sharing octahedra and connected by [N=C=N]2− carbodiimide units oriented along the c-axis. Additionally, recent studies have shown that CaCN2:Mn2+ exhibits an intense red emission with acceptable thermal stability but only under high energy activation (λ < 300 nm), thus limiting its use as phosphor material for light-emitting devices [18,20]. In order to improve its activation behavior using the energy transfer approach and allow excitation at lower energy, this study focuses on the effect of Ce/Mn co-doping on its excitation and emission properties. To achieve this, CaCN2:Ce3+ is first synthesized using the previously reported carbon nitride route [16] and its luminescence properties are discussed. Then, the impact of various Ce/Mn doping rates on the excitation and emission properties is investigated.

2. Results and Discussion

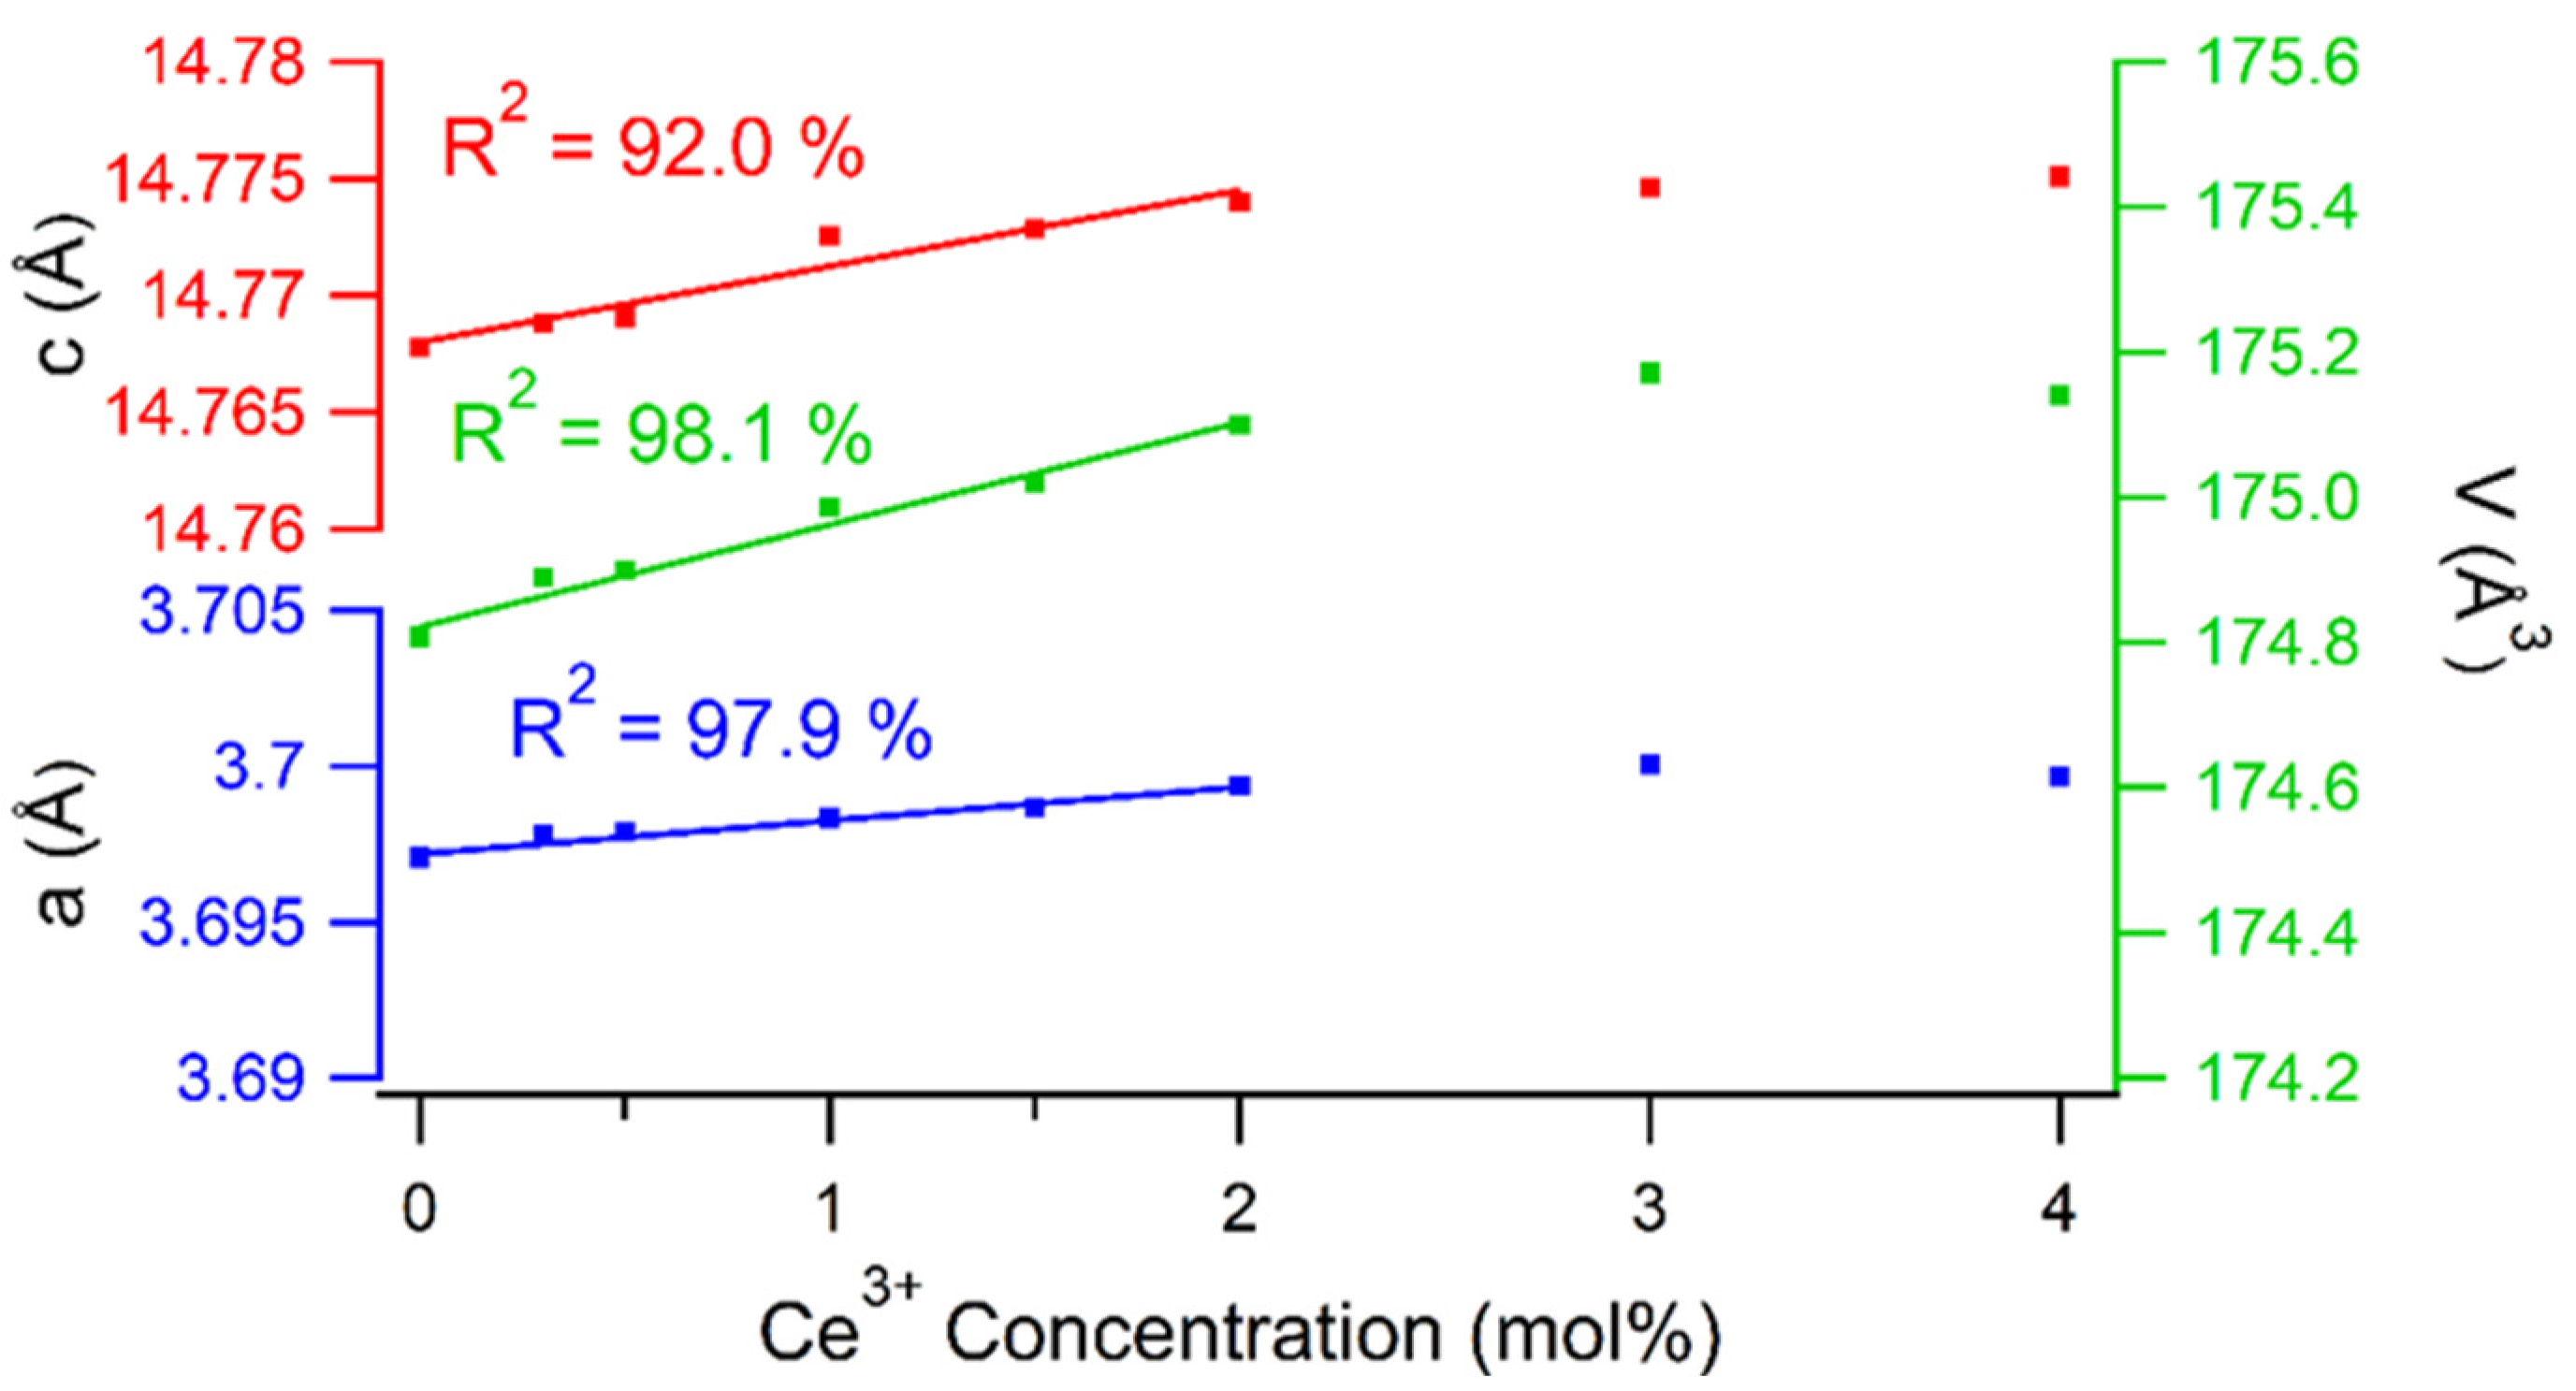
2.1. Materials Characterization and Optical Properties of Ca1−xCexCN2 (0 ≤ x ≤ 0.04)

2.1.1. Materials Characterization

All Ca1−xCexCN2 (x = 0, 0.003, 0.005, 0.01, 0.015, 0.02, 0.03 and 0.04) samples were identified by the X-ray powder diffraction technique (XRD). As shown in Figure 1, all compounds can be unambiguously indexed as rhombohedral phase (space group R 3 ¯ m , COD card no. 153-9974). Nonetheless, additional low-intensity lines indicate the presence of cerium oxycarbodiimide Ce2O2CN2 (space group P 3 ¯ m 1 , JCPDS no. 049-1164) as a secondary phase for the sample with Ce3+ content greater than 2 mol%, as evidenced by the presence of lines (001), (101) and (102) located at 10.57°, 28.00° and 33.61°, respectively (zoom Figure 1). Rietveld refinement analyses were conducted on the as-prepared samples to verify the impact of cerium doping on the crystal lattice. The Rietveld refinement result for CaCN2:0.5%Ce as well as details of the structural parameters and the atomic parameters are given in Figure S2 and Tables S1 and S2. The evolution of the a and c unit cell parameters as well as the cell volume versus the Ce3+ doping concentration are presented in Figure 2. Despite similar ionic radii between the Ca2+ and Ce3+ ions in 6-fold coordination, i.e., r C a 2 + = 1.00 Å and r C e 3 + = 1.01 Å [24], a slight increase in the cell parameters can be observed up to 2 mol% (Ce). The lattice parameters then remain more or less constant up to 4 mol% (Ce) due to the formation of Ce2O2CN2 as a secondary phase indicating that the solubility limit of Ce3+ within the CaCN2 matrix is quite limited. One reason can be the formal charge difference between the substituted cation Ca2+ and the dopant cation Ce3+, resulting in local distortions and/or the creation of defects to maintain the overall electroneutrality of the crystal lattice, such as cationic vacancies according to the equation: 3 Ca2+ → 2 Ce3+ + VCa.
Scanning electron microscopy (SEM) images of the Ca0.995Ce0.005CN2 sample, displayed in Figure 3, show comparable powder morphology to that observed in our previous work for CaCN2 and CaCN2:Mn2+, i.e., agglomerates measuring up to 40 μm formed by well-rounded shaped crystallized elementary particles (Figure 3a,b) [20]. The latter, with size in the micron range, are strongly sintered despite the 1 h annealing dwell used during the synthesis (Figure 3c). Additionally, the particles exhibit a layered texture on their surface in accordance with the 2D crystal structure of CaCN2 (Figure 3d) [25].
Moreover, in order to confirm the amount of dopant as well as the nitrogen and oxygen contents, elemental analyses were performed on each sample using Energy dispersive X-ray spectroscopy (EDS) and the inert gas fusion technique, respectively (see Table 1). The EDS results reveal the presence of residual sodium from the carbonate precursors synthesized by co-precipitation from a sodium carbonate solution. Thus, Ce contents have been recalculated versus calcium content only (values in brackets) to compare with the targeted Ca/Ce ratios. Indeed, slightly higher Ce amounts are systematically observed in the samples. Note that as reported in our previous work [20], sodium can be removed by increasing the reaction temperature up to 800 °C but at the cost of the formation of stable CaO and MnO side-products. Moreover, removal of sodium does not improve the luminescence properties of the CaCN2 based phosphors. On the other hand, nitrogen contents are consistent with calculated values within experimental errors. However, there is a downward trend in the latter in samples with values of x ≥ 0.03, as well as an increase in the amounts of oxygen, both associated with the presence of the Ce2O2CN2 impurity.

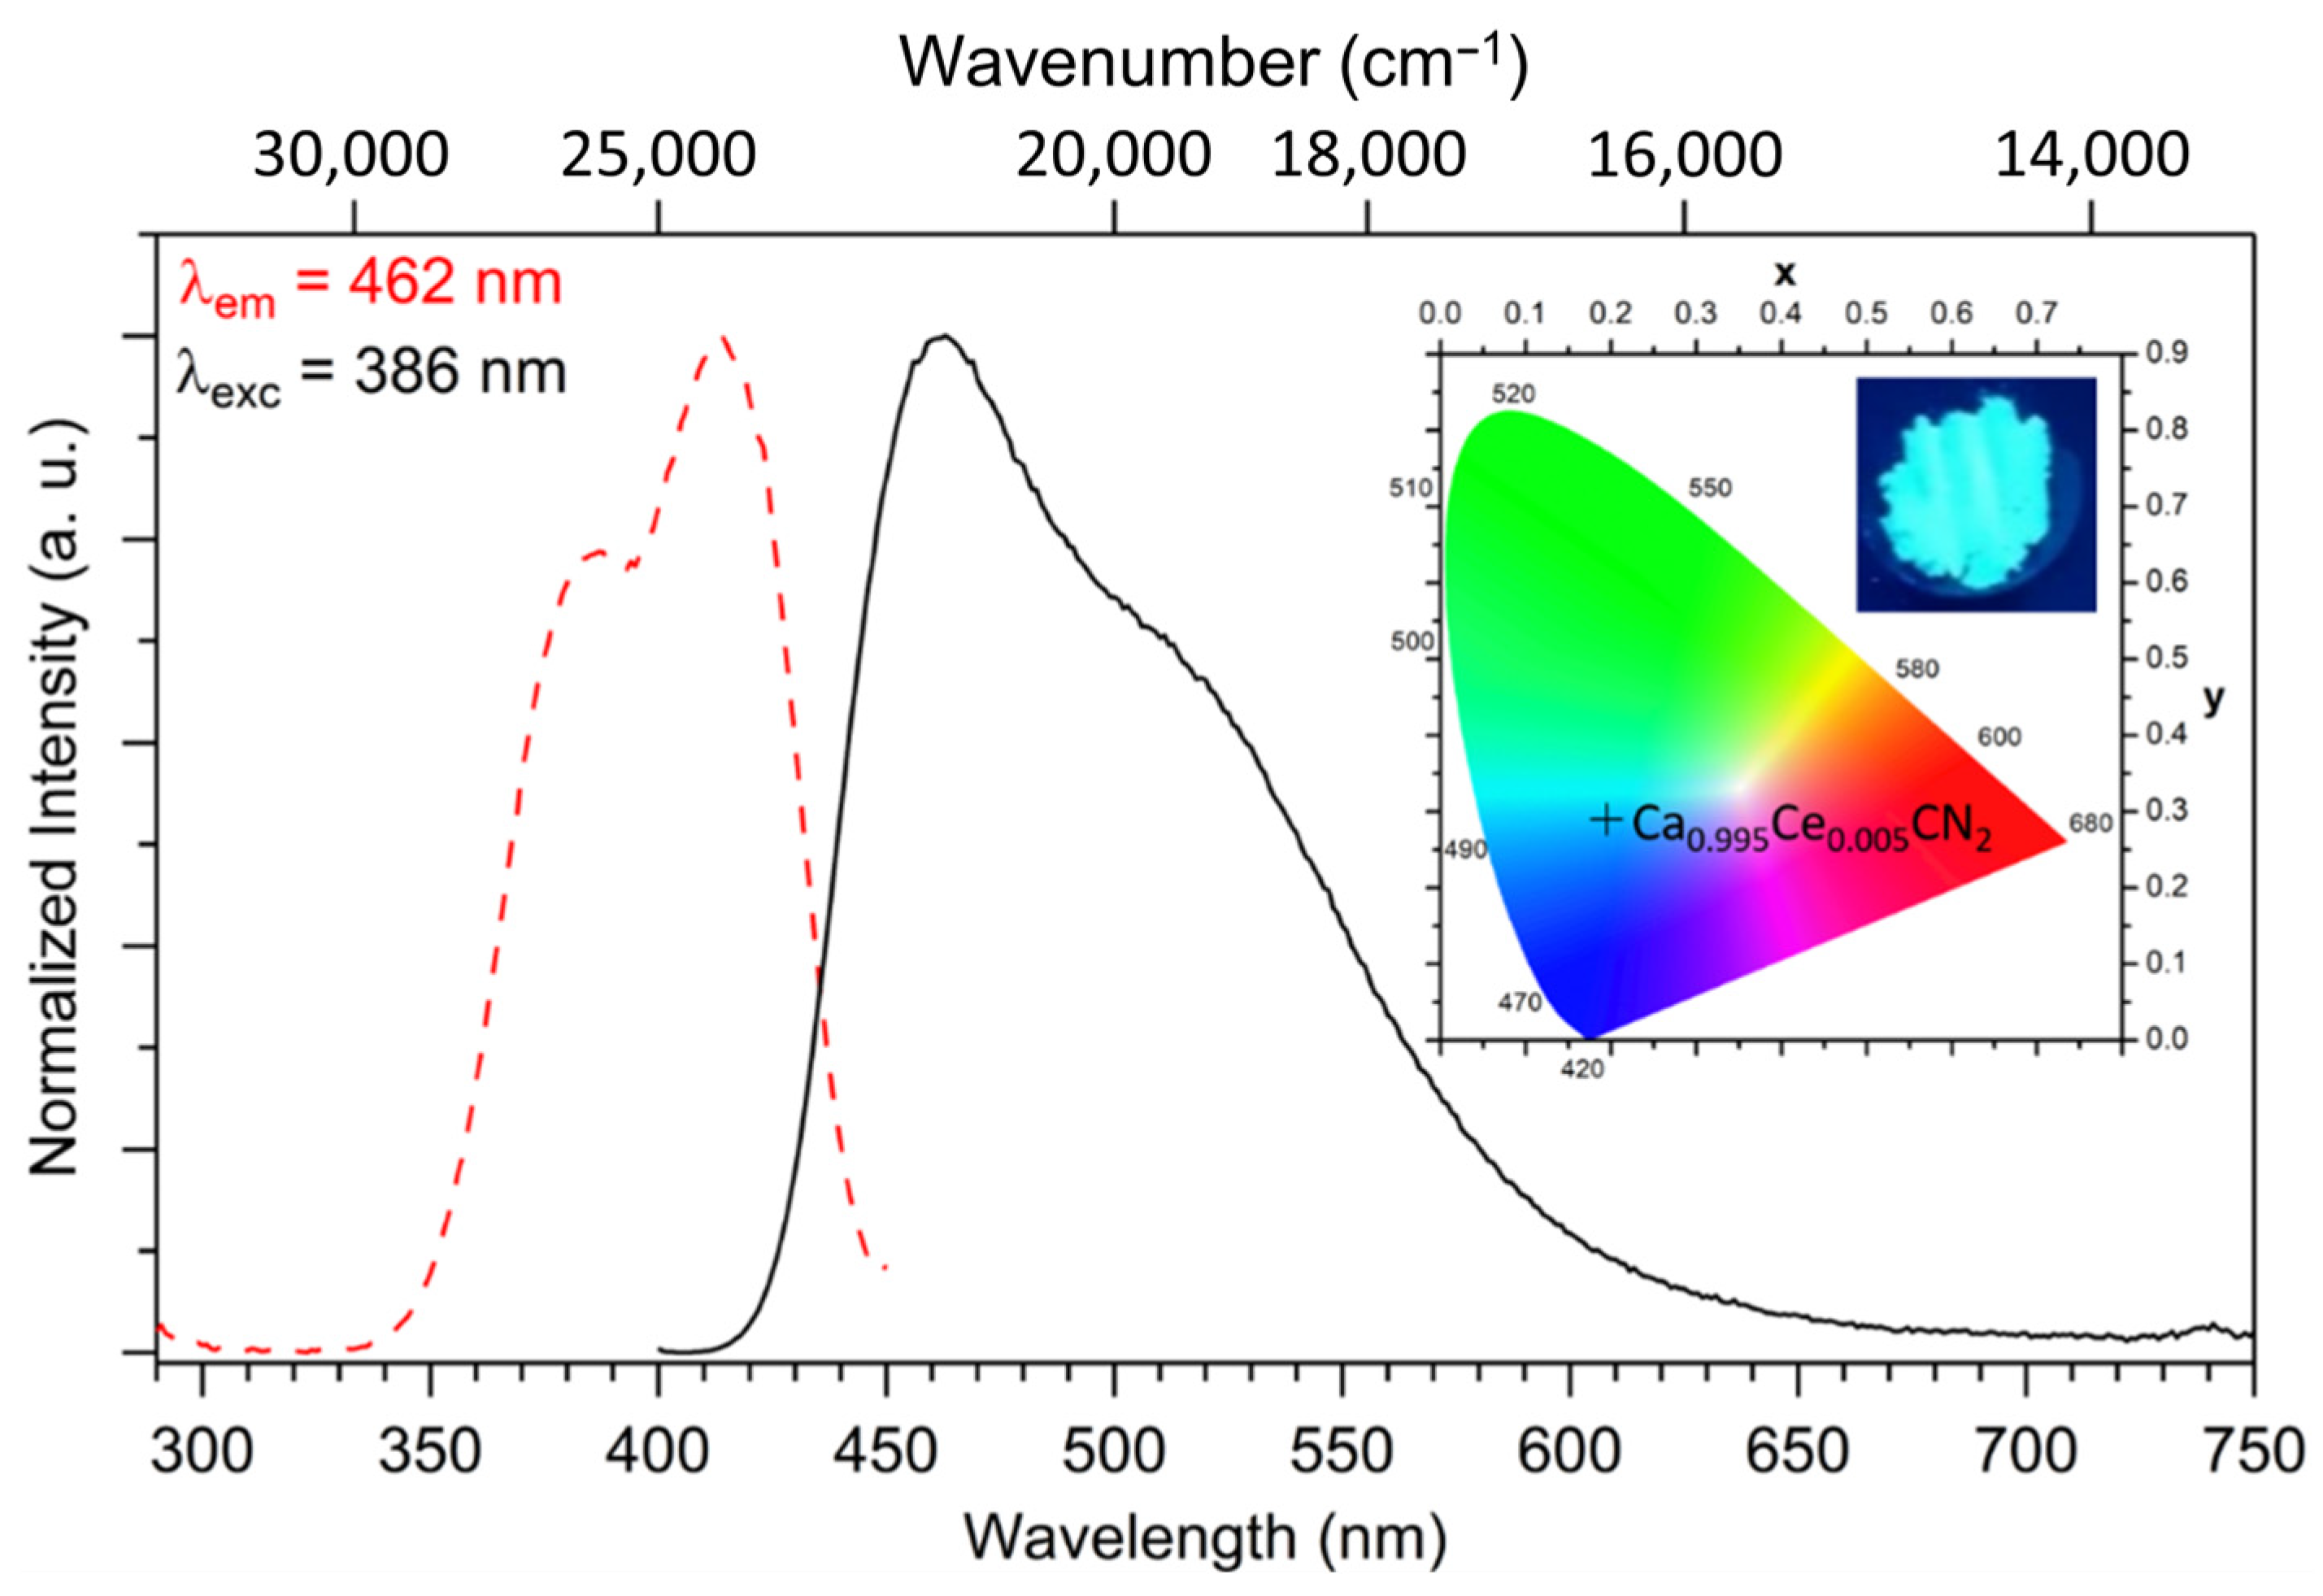
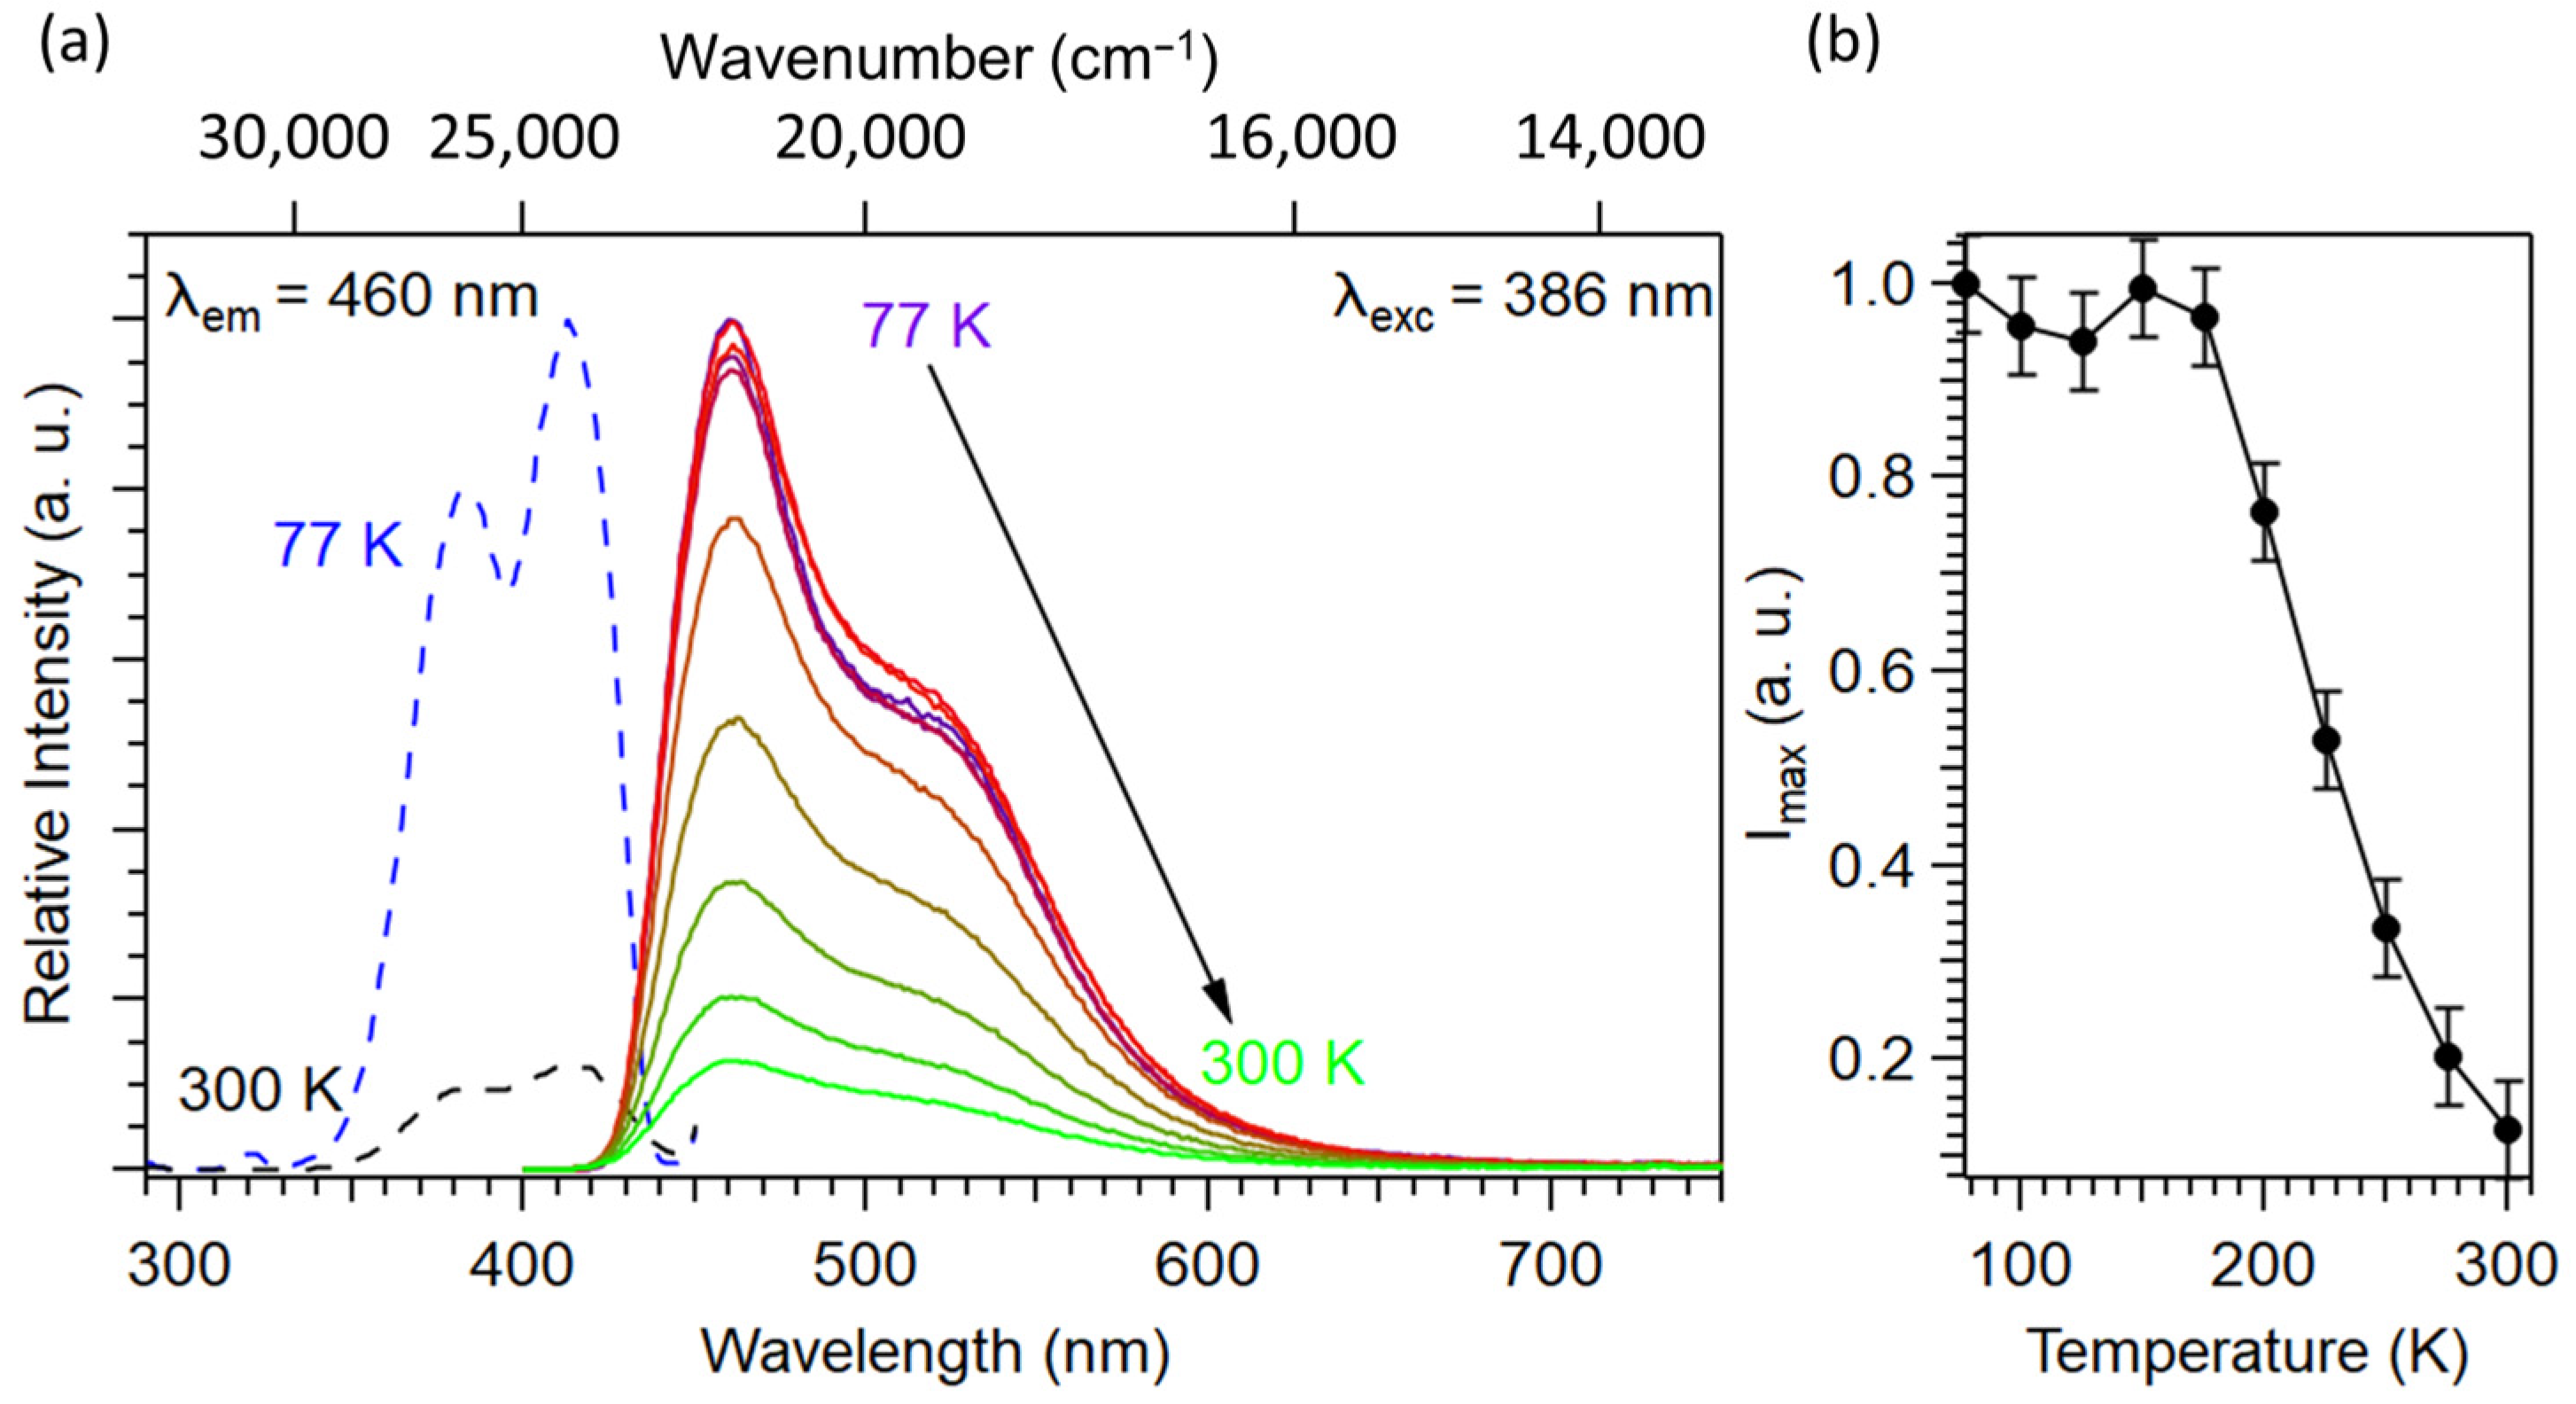
2.1.2. Optical Properties

The diffuse reflection spectra of the Ca1−xCexCN2 samples (0 ≤ x ≤ 0.04) are shown in Figure 4. The doped samples show an absorption edge located at 250 nm corresponding to the electronic transitions between the valence and conduction bands of the CaCN2 host lattice [20]. Two absorption bands whose intensities increase with the cerium doping rate are observed between 265–340 nm and 370–450 nm, respectively. As these bands are not visible in the undoped sample, they can only be attributed to the 4f → 5d transitions of the Ce3+ ion, thus indicating the effective reduction of cerium under the experimental conditions. Let us also note that samples with values of x ≥ 0.03 show an additional absorption band between 450–600 nm, which is attributed to the absorption of the Ce2O2CN2 impurity that is described as having a pale-yellow coloration according to its JCPDS data sheet (JCPDS no. 049-1164).
The normalized photoluminescence excitation (PLE) and emission (PL) spectra of the Ca0.995Ce0.005CN2 sample at room temperature, as well as Commission Internationale de l’Éclairage (CIE) coordinates and a picture of the emitting phosphor under 365 nm UV lamp illumination are presented in Figure 5. When monitored with emission wavelength at 462 nm, the PLE spectrum shows a partially overlapping double band with maxima at 384 and 414 nm, respectively. These bands, which extend over a wavelength range from 350 to 450 nm are characteristic of the 4f → 5d transitions of Ce3+ ion [26,27], in good agreement with the absorption bands observed on the diffuse reflection spectra. Under excitation at 386 nm, the emission spectrum of the sample consists of a broad asymmetric emission band from 400 to 650 nm whose maxima were estimated at 462 nm (main peak) and 510 nm by using a Gaussian fit which allows the deconvolution of the double band into two contributions (Figure S3). This gap of 48 nm (i.e., approximately 2040 cm−1 on an energy scale) between these two maxima is of the same order of magnitude as the theoretical value of 2000 cm−1 expected between the two 4f sublevels of trivalent cerium, and thus the double band can be ascribed to the 5d12F5/2 and 5d12F7/2 transitions [28]. The presence of a unique double band related to the cerium emission also indicates that the Ce3+ ion occupies only one site within the lattice, namely, the octahedrally coordinated Ca2+ site of the investigated host lattice. Such cyan emission is in good agreement with those already observed in sulfide and oxide matrices such as SrS:Ce3+, CaS:Ce3+ and CaO:Ce3+ where the Ce3+ ion is located at the octahedral site [29,30]. The CIE chromaticity coordinates are (x = 0.19, y = 0.29).
A study of the photoluminescence properties at room temperature as a function of the Ce3+ dopant concentration was carried out in order to determine the optimum cerium concentration. Figure 6 shows the emission spectra of Ca1−xCexCN2 (x = 0.003, 0.005, 0.01, 0.015, 0.02, 0.03 and 0.04) samples. While the profile of the emission peak does not vary with the Ce3+ content, the emission intensity of Ca1−xCexCN2 phosphors strongly depends on it. The optimized Ce3+ doping concentration in the CaCN2 host lattice is approximately 0.5 mol%. For higher content the emission intensity decreases continuously from 0.5 to 4 mol%. Several hypotheses could explain the observed decrease in emission intensity such as a concentration quenching effect, the formation of local distortions related to the charge difference between Ca2+ and Ce3+ increasing the probability of non-radiative relaxation or the presence of Ce2O2CN2 as a secondary phase for doping rate greater than 2 mol%.
In addition, the fluorescence decay time of Ce3+ in the Ca0.995Ce0.005CN2 sample as well as the quantum yield have been measured at room temperature under excitation at 394 and 386 nm, respectively. As shown in Figure 7, the decay curves can be well fitted by a bi-exponential function. The associated decay times τ1 and τ2 are 3.0(1) ns and 7.3(1) ns with very close amplitudes, in agreement with the two possible transitions from the excited state to the 2F5/2 and 2F7/2 levels. Moreover, the nanosecond magnitude is comparable to what is usually measured in Ce3+-doped phosphors [26,31,32]. The internal quantum yield (excitation via Ce3+) has been estimated at 11.5(1.4)% under 386 nm excitation wavelength which is quite low for application as a phosphor in LED lighting that generally requires the highest possible efficiency.
The effect of the temperature on the emission was investigated between 293 and 387 K under 386 nm excitation wavelength. As depicted in Figure 8, the emission intensity of Ca0.995Ce0.005CN2 is decreasing rapidly by approximatively 80% up to 387 K. The temperature at which the emission intensity is reduced by 50% (T1/2) is approximately 330 K. This phenomenon is completely reversible indicating that the loss of luminescence is not related to any degradation of the product under the measurement conditions as CaCN2 is stable up to approximately 600 °C [20]. In light of the rapid decrease in emission intensity with increasing temperature and the low quantum yield at room temperature, a low-temperature study between 77 and 300 K was carried out in order to assess more accurately the thermal stability of the emission. The resulting emission spectra recorded at 386 nm are shown in Figure 9. It can be seen that the emission intensity is relatively stable up to 150 K before dropping to approximately 80% up to 300 K. Thus, these results show that a strong quenching of the luminescence is already occurring at room temperature, which can be correlated to the low quantum yield observed above. The reduction in emission intensity is attributed to higher probability of non-radiative transitions at higher temperature.

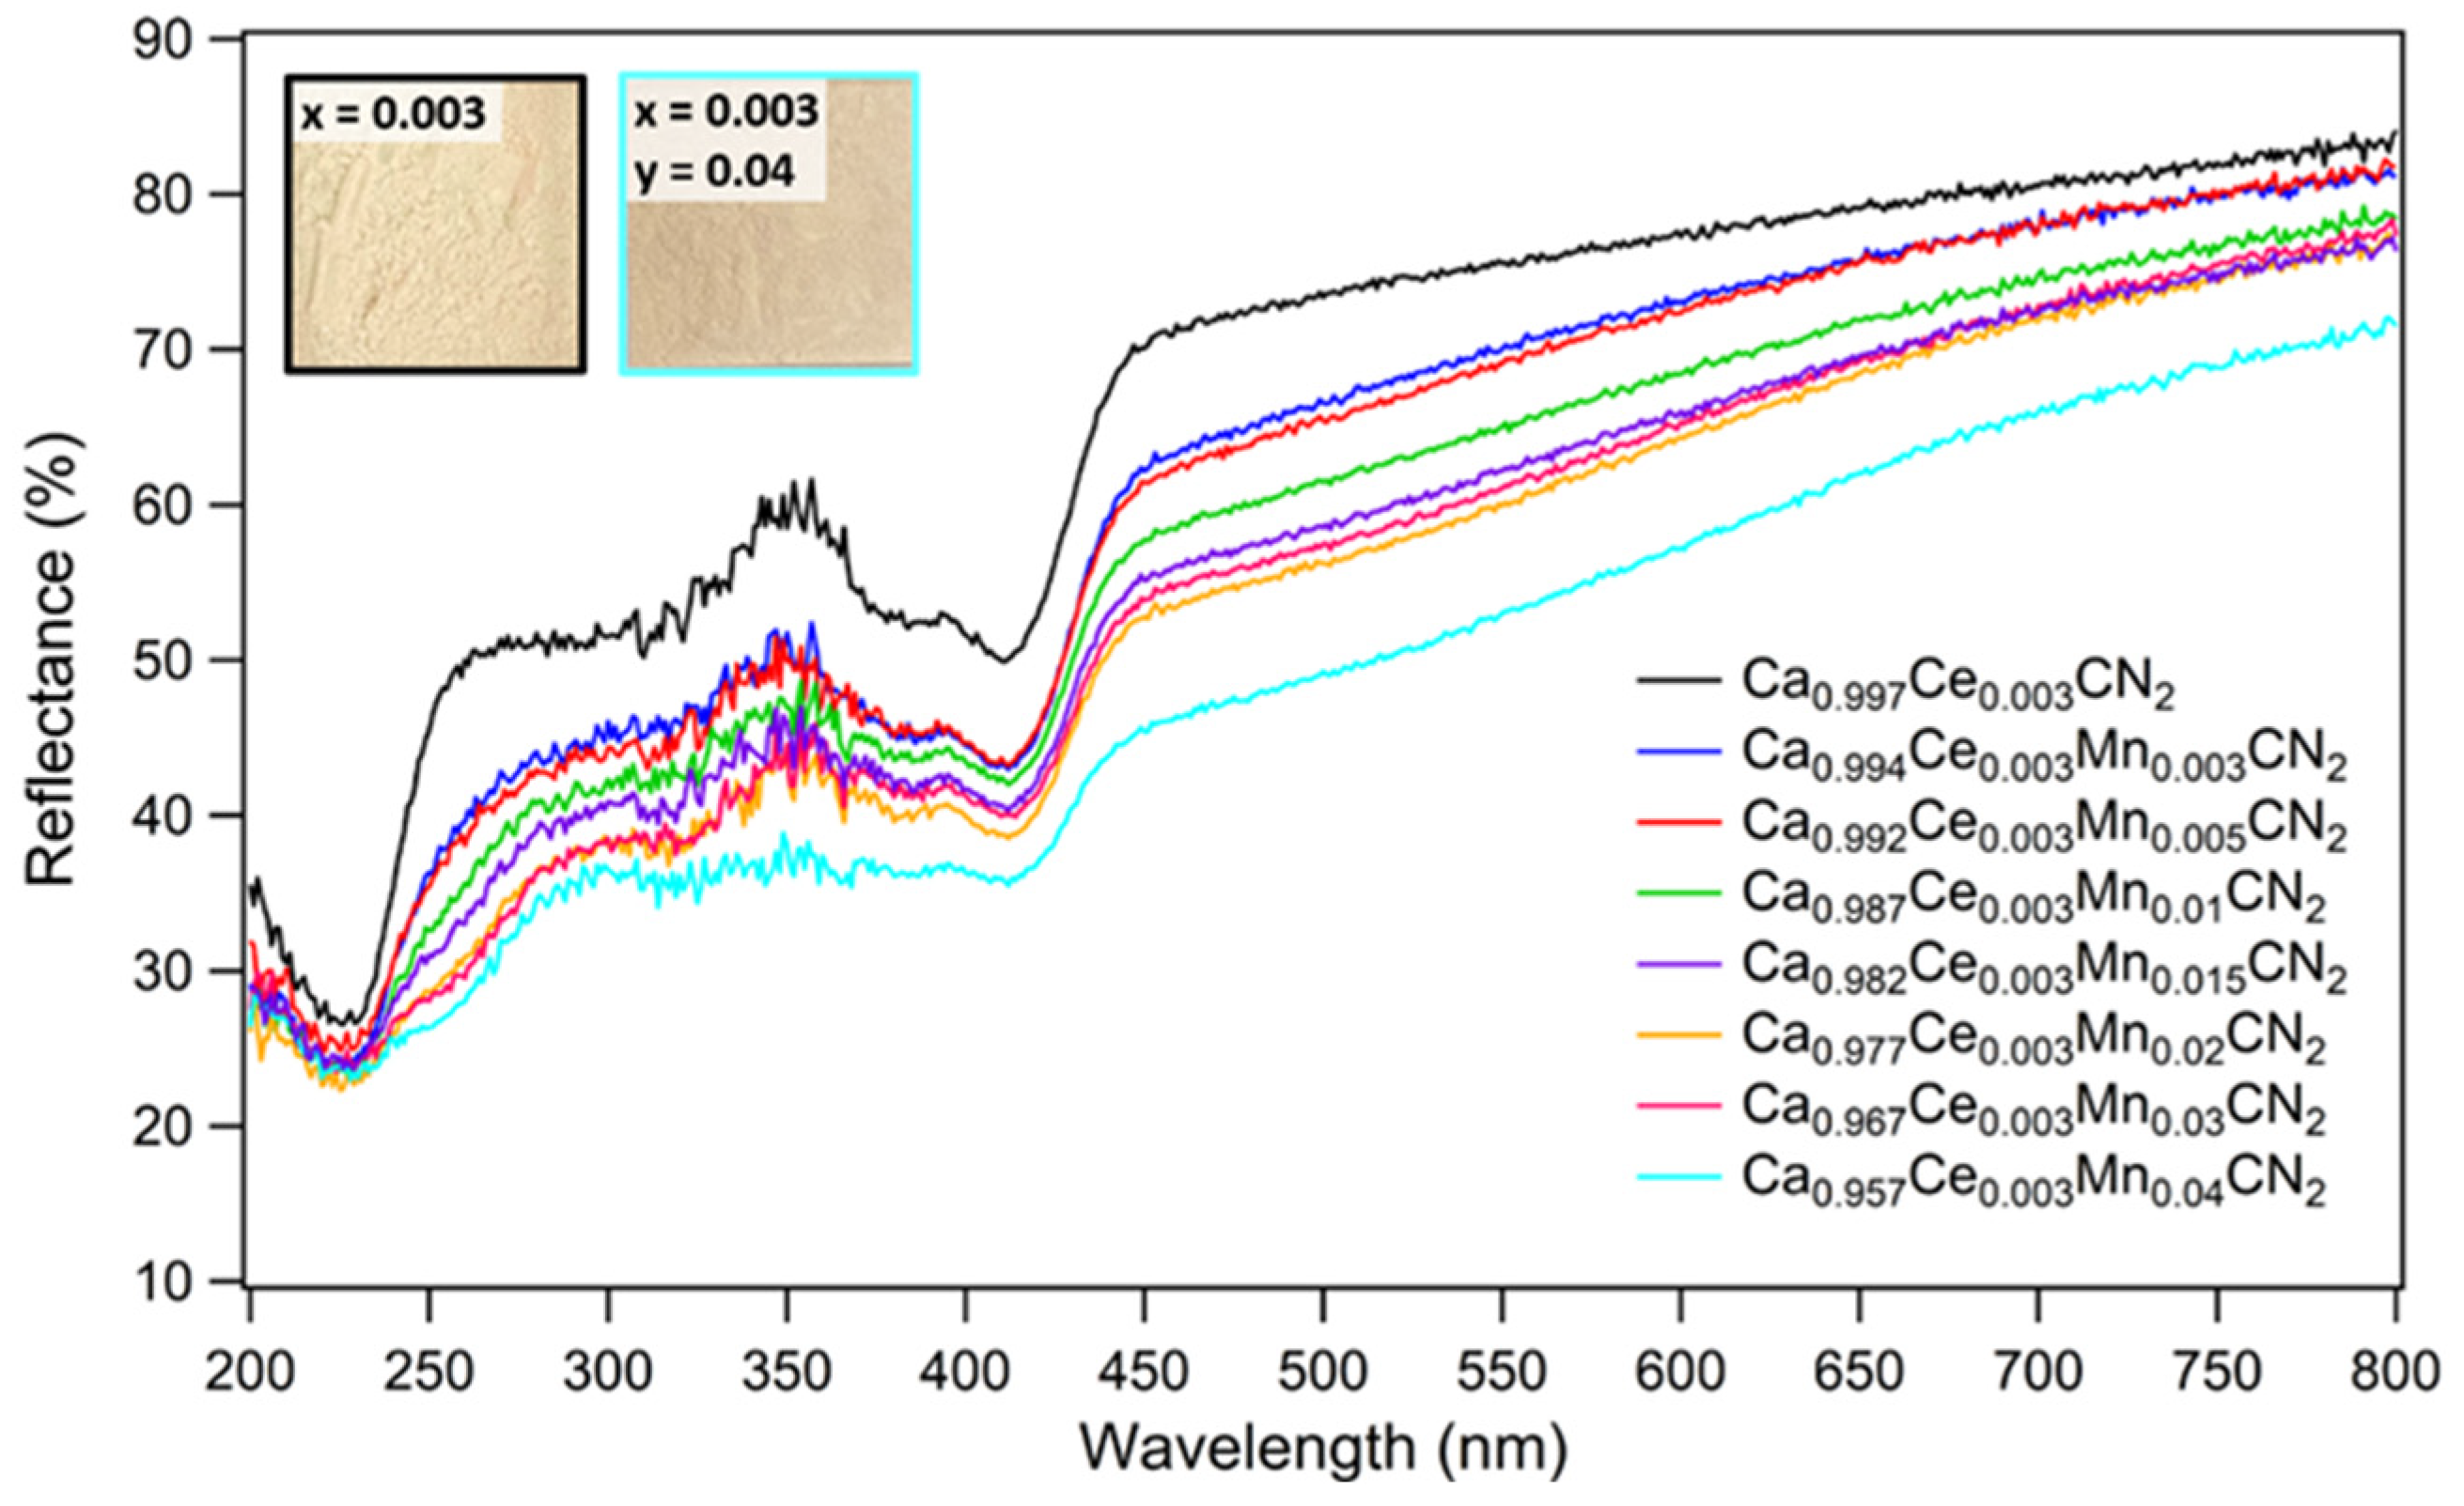
2.2. Optical Properties of Ca0.997−yCe0.003MnyCN2 (0.003 ≤ y ≤ 0.04)

The structural characterizations and elemental analyses for the Ca0.997−yCe0.003MnyCN2 (0.003 ≤ y ≤ 0.04) samples are gathered in Figures S4–S6 and Tables S3 and S4. The obtained results are similar to those obtained for the Ce3+ and Mn2+ single-doped CaCN2 samples and confirm the formation of single-phase compounds with the targeted Ce3+ and Mn2+ doping rates. Figure 10 shows the diffuse reflection spectra of Ca0.997−yCe0.003MnyCN2 (0.003 ≤ y ≤ 0.04) samples. One can find on the spectra of the co-doped samples the contributions of cerium and manganese previously observed on the series of samples single-doped with Mn2+ or Ce3+ [20]. First, the absorption edge located at 250 nm corresponds essentially to the electronic transitions between the valence and conduction bands of the CaCN2 host lattice. Additionally, an absorption band around 260–280 nm which shifts to longer wavelengths with increasing manganese content can be attributed to the presence of 3d(Mn) levels in the band gap of the CaCN2 matrix [20]. Finally, the two absorption bands between 265–340 nm and 370–450 nm are associated with the 4f → 5d transitions of the Ce3+ ion as discussed above. The daylight color of co-doped samples shows creamy-white to light-brown color depending on the Mn2+ doping rate as a result of the absorption in the visible range from electronic transitions between 3d(Mn) states.
The photoluminescence properties of the Ce3+/Mn2+ co-doped samples were then studied. The obtained photoluminescence spectra are shown in Figure 11a. The excitation spectra of the Ca0.987Ce0.003Mn0.01CN2 sample were recorded by fixing the emission wavelength at 462 nm and 680 nm, respectively, while the normalized emission spectra of the whole series were recorded at 386 nm. The evolution of luminescence intensity as a function of manganese concentration is presented in Figure 11b. By monitoring the emission at 680 nm, the PLE spectrum of Ca0.987Ce0.003Mn0.01CN2 shows two excitation bands. The first one, located around 270 nm, is attributed to the absorption of the host lattice as already discussed in our previous study on Mn2+-doped CaCN2 [20]. The second, consisting of a partially overlapping double band between 350 and 450 nm, corresponds to the 4f → 5d transitions of the cerium ion by analogy to the results obtained on the series of Ce3+-doped CaCN2 samples (see Figure 5). The presence of this absorption band on the excitation spectrum for the emission centered at 680 nm supports the occurrence of energy transfers from Ce3+ ions to Mn2+ ions, as single-doped CaCN2:Mn2+ exhibits such emission at 680 nm only when excited through the host lattice at high energy, i.e., λ ≤ 270 nm [20]. Under excitation at 386 nm, the emission spectrum of Ca0.987Ce0.003Mn0.01CN2 (green line) shows the characteristic emission bands of both Ce3+ and Mn2+ ions. The first emission band located between 400 and 580 nm is the double band associated with the 5d12F5/2 and 5d12F7/2 transitions of Ce3+ while the second one centered at approximately 680 nm corresponds to the 4T1g(4G) → 6A1g(6S) transitions of Mn2+ [20].
Under excitation at 386 nm, the evolution of the profile of the PL spectra as a function of the Mn2+ ion concentration shows a progressive decrease in the Ce3+ emission intensity to the benefit of the Mn2+ one, which increases continuously from 0.3 to 2 mol% (Mn). From 3 mol% (Mn), the emission intensity decreases due to the self-extinction of the luminescence by concentration quenching as previously observed for single-doped CaCN2:Mn2+ but at a lower Mn doping rate [20]. A similar behavior of the respective emission intensities associated with Ce3+ and Mn2+ ions has already been observed in other Ce3+/Mn2+ co-doped lattices such as CaO:Ce3+,Mn2+ or Sr3La(PO4)3:Ce3+,Mn2+ [29,33].
To quantify the optical characteristics of phosphors and to evaluate the impact of Mn2+ co-doping on the generated color, the chromaticity coordinates (x, y) of prepared materials have been determined. Numerical results are listed in Table S5, whereas the CIE chromaticity diagram as well as a picture of the emitting phosphors under 365 nm UV lamp exposure are presented in Figure 12. The chromaticity coordinates of the series of samples show that a color gradient is obtained, varying from cyan (y = 0, 0.003 and 0.005) to red (y = 0.03 and 0.04) through a shade of white (y = 0.01), as a function of the increase in manganese rate.
In order to further investigate the efficiency (ηT) of the energy transfers (ET) from Ce3+ to Mn2+, the lifetime and the ET efficiency are calculated from the decay curves of Ca0.997−yCe0.003MnyCN2 (0.003 ≤ y ≤ 0.04)-doped samples monitored at 394 nm (Figure 13). The decay curves can be well fitted by a bi-exponential function, owing to the splitting of the 4f ground state of Ce3+, 2F5/2 and 2F7/2 levels [34,35],
I = A 1 exp t τ 1 + A 2 exp t τ 2 ,
where I is the luminescence intensity, A1 and A2 are constants, t is the time, and τ1 and τ2 are the decay constant for the exponential component. The average decay time is calculated with the following formula [34,35],
τ = ( A 1 τ 1 2 + A 2 τ 2 2 ) / ( A 1 τ 1 + A 2 τ 2 ) ,
The decay time values τ are calculated to be 5.69 ns (y = 0), 5.30 ns (y = 0.003), 5.07 ns (y = 0.005), 5.15 ns (y = 0.01), 4.95 ns (y = 0.015), 4.79 ns (y = 0.02), 4.27 ns (y = 0.03) and 4.26 ns (y = 0.04), with an increase in Mn2+ content from 0% to 4%. It is clearly observed that the decay time tends to gradually decrease with increasing concentration of co-doped Mn2+, which strongly supports the energy transfers from Ce3+ to Mn2+. In addition, the ET efficiency from Ce3+ to Mn2+ was also investigated. Generally, the ET efficiency from sensitizer to activator can be calculated by using the following formula [36],
η T = 1 τ S τ S 0 ,
where τS0 and τS are the decay lifetimes of the sensitizer (Ce3+) in the absence and presence of the activator (Mn2+), respectively.
As shown in the inset of Figure 13, the efficiency is found to increase gradually with increasing Mn2+ content up to 3 mol% (Mn) and then remains more or less constant up to 4 mol% (Mn). However, the Mn2+ emission intensity gradually decreases from 2 to 4 mol% (Mn). This indicates that the quantity of energy that can transfer from Ce3+ to Mn2+ is gradually restricted for high Mn2+ concentration due to the fixed Ce3+ concentration and Mn2+ concentration quenching effect.
In general, non-radiative energy transfers from a sensitizer to an activator take place via exchange interaction or electric multipolar interaction [37,38]. If the energy transfers result from the exchange interaction, the critical distance between the sensitizer and activator should be shorter than 4 Å. The critical distance RC for energy transfers from Ce3+ to Mn2+ ions can be calculated from the following relationship given by Blasse [39],
R C = 2 3 V 4 π x c N 1 / 3 ,
where V is the volume of the unit cell, xc is the critical concentration, and N represents the number of sites that the doped ions can occupy in the unit cell.
The xc is defined as the total concentration of the Ce3+ and Mn2+ dopant ions, at which the emission intensity of Ce3+ in Ca0.997−yCe0.003MnyCN2 is half of that in Ca0.997Ce0.003CN2 phosphor. For the CaCN2 host lattice, N = 3, xc = 0.013, V = 174.6 Å3. Therefore, the critical distance RC (Ce3+-Mn2+) was calculated to be 20.45 Å. This value is much longer than 4 Å, indicating that the energy transfers between the Ce3+ and Mn2+ ions mainly take place via electric multipolar interactions.
On the basis of Dexter’s energy transfers formula of multipolar interaction and Reisfeld’s approximation, the following relation can be obtained [37,40]:
I S 0 I S C α / 3 ,
where IS0 and IS represent the luminescence intensities of the sensitizer Ce3+ ions without and with the presence of the Mn2+ ions, respectively. C is the total concentration of the Ce3+ and Mn2+ ions. α = 6, 8, and 10 correspond to dipole–dipole, dipole–quadrupole, and quadrupole–quadrupole interactions, respectively. The relationship between IS0/IS and Cα/3 when α = 6, 8, 10 is shown in Figure 14. A linear relation was observed only when α = 6, indicating that the mechanism of energy transfers from the Ce3+ to Mn2+ ions in CaCN2 host lattice are mainly due to a dipole–dipole interaction.
The thermal stability of phosphors is a key factor for their application in LEDs device. In general, under high-power operating conditions, the phosphors can reach temperatures up to 423 K [41]. Therefore, the effect of the temperature on the emission was investigated between 293 and 383 K under 386 nm excitation wavelength. As shown in Figure 15, the maximum emission intensity of Ca0.987Ce0.003Mn0.01CN2 decreases between 293 and 383 K by approximatively 80% and 67% for the Ce3+ (462 nm) and Mn2+ (680 nm) bands, respectively. This 80% diminution in intensity for the cerium band is comparable to that observed on the single-doped Ca0.995Ce0.005CN2 sample. However, the decrease in intensity of the manganese band is greater than that reported in our previous study for the single-doped Ca0.96Mn0.04CN2 sample for which only a 20% decrease in the emission intensity at 680 nm was observed in the same conditions [20]. It should also be noted that the decreases in cerium and manganese emission intensities with increasing temperature are not proportional, leading to a variation in emission color with temperature. Additionally, the large decrease in the intensity of the manganese emission suggests the deactivation of the Ce3+ excited state before the energy transfers towards Mn2+ occur. The reduction in emission intensity at higher temperature is induced by higher probability of non-radiative processes such as thermal ionization through the conduction band of the host lattice and/or excitation energy migration among the dopants to quenching sites (e.g., vacancies and substitutional impurity atoms). It should also be noted that, as in the case of the single-doped Ca0.995Ce0.005CN2 sample, the phenomenon is completely reversible.

3. Materials and Methods

3.1. Preparation of Ce3+, Mn2+ Co-Doped Calcium Carbodiimides

Powder samples of Ce3+-doped CaCN2 and Ce3+/Mn2+ co-doped CaCN2 were prepared by solid-state reactions from doped calcium carbonate and carbon nitride (C3N4) according to the synthesis route described in [16,20]. The nominal chemical compositions of the synthesized materials are Ca1−xCexCN2 (0 ≤ x ≤ 0.04) and Ca1−xyCexMnyCN2 (x = 0.003, 0.003 ≤ y ≤ 0.04), respectively. Typically, doped calcium carbonates were prepared by co-precipitation method using CaCl2·6H2O (Aldrich, 98%), Ce(NO3)3·6H2O (Alfa Aesar, 99.5%), MnCl2·4H2O (Alfa Aesar, 99%) and Na2CO3 (Acros Organics, 99.95%) as raw materials while carbon nitride was synthesized by heating melamine (C3H6N6–Alfa Aesar, 99%) at 550 °C for 5 h in a closed alumina crucible in a muffle furnace. Then, the as-synthesized precursors were thoroughly mixed in an agate mortar and calcined at 700 °C for 1 h under ammonia flow (NH3). Finally, the obtained powder was mixed again with C3N4 and annealed under similar conditions to guarantee the complete reaction between the carbonate and the carbon nitride. For more details on the synthesis of (co-doped) calcium carbonate, carbon nitride and (doped) carbodiimides, refer to our previous work [20].

3.2. Characterizations

X-ray powder diffraction (XRD) patterns were recorded at room temperature in the 10–90° 2θ range with a step size of 0.0261° and an effective scan time per step of 40 s using a PANalytical X’Pert Pro diffractometer (Cu-L2,L3 radiation, λ = 1.5418 Å, 40 kV,40 mA, PIXcel 1D detector). Data collector and HighScore Plus programs were used, respectively, for recording and analysis of the patterns. The XRD patterns for Rietveld refinements were collected at room temperature in the 5–120° 2θ range with a step size of 0.0131° and an effective scan time per step of 200 s. All calculations were carried out with Fullprof and WinPLOTR programs [42,43].
Nitrogen and oxygen contents were determined with a LECO TC-600 Analyzer using the inert gas fusion method in which nitrogen and oxygen contents were measured as N2 by thermal conductivity and as CO2 by infrared detection, respectively.
Powders morphology was examined by scanning electron microscopy (SEM) with a JEOL JSM 7100 F equipment operating at a 6 mm working distance, with an accelerating voltage of 20 kV. Energy dispersive X-ray spectroscopy (EDS) characterizations were performed using a JEOL IT300 microscope operating at a 10 mm working distance, with an accelerating voltage of 20 kV and a probe current of 7.45 nA. Sample preparation consisted in powder deposition on a carbon tape then metallization with gold.
Diffuse reflectance spectra were collected using a Varian Cary 100 Scan spectrometer equipped with a Varian WinUV software and a Labsphere DRA-CA-30I 70 mm integrating sphere. Experimental data were collected within the 200–800 nm range with a 1 nm step. Band gaps of the materials (Eg) were estimated using the Kubelka–Munk formalism [44].
Solid-state excitation and emission spectra were measured with a Horiba Jobin-Yvon Fluorolog-III fluorimeter equipped with a Xe lamp 450 W and a UV–Vis photomultiplier (Hamamatsu R928, sensitivity 190–860 nm). For the measurements recorded above room temperature, the samples were placed in an adequate solid holder then introduced in the F-3004 Jobin-Yvon heating Peltier module (293–383 K). Concerning the measurements recorded below room temperature (77–300 K), the luminescence has been measured on powder samples mounted directly onto copper plates using conductive silver glue and cooled with an optical cryostat (Oxford OptistatCF) coupled to a liquid nitrogen bath able to reach temperatures down to 77 K under nitrogen atmosphere. Luminescence decays were measured directly with the fluorescence spectrometer coupled with an additional TCSPC module (Time-Correlated-Single-Photon-Counting) and a 394 nm pulsed Delta-Diode. Quantum yields were measured using a G8 GMP integrating sphere according to Φ = (Ec − Ea)/(La − Lc), where Ec and Lc are the integrated emission spectrum and the absorption at the excitation wavelength of the sample and Ea and La are the integrated blank emission spectrum and blank absorption, respectively. Luminescence decays and quantum yields are the averages of three or five independent determinations. Appropriate filters were used to remove the laser light, the Rayleigh scattered light and associated harmonics from the emission spectra. All spectra were corrected for the instrumental response function. Colorimetric coordinates have been calculated on the basis of the emission spectra [45,46].

4. Conclusions

In summary, a series of Ce3+-doped CaCN2 and Ce3+/Mn2+ co-doped CaCN2 phosphors have been synthesized via a solid-state reaction using carbon nitride as a precursor. Investigations based on X-ray powder diffraction analysis attest the formation of high-purity and well-crystallized Ca1−xCexCN2 (0 ≤ x ≤ 0.04) and Ca0.997−yCe0.003MnyCN2 (0.003 ≤ y ≤ 0.04) samples. Structural analysis also revealed a maximum solubility of Ce3+ approximately 2 mol% within the investigated dopant concentration, with the insertion of Ce3+ within the host structure by substitution for the Ca2+. Under 386 nm excitation, Ce3+-doped phosphors exhibit a broad blue emission band centered around 462 nm, with a shoulder at 510 nm, at room temperature. The optimized Ce3+ concentration of CaCN2:Ce3+ is 0.5 mol%. With increasing temperature, the emission intensity of the Ca0.995Ce0.005CN2 sample decreases drastically on the order of 80% up to 387 K in a completely reversible manner. We also investigated the luminescence properties of CaCN2 co-doped with Ce3+ and Mn2+. The spectral characteristics and decay times indicate that efficient energy transfers occur between Ce3+ and Mn2+ via a non-radiative dipole–dipole mechanism. The critical energy transfer distance has also been calculated by the concentration quenching method. Under near-ultraviolet excitation, the emission color of the obtained phosphors can be modulated from blue to red through a shade of white by adjusting the doping content of the Mn2+ ions with a fixed Ce3+ content, but the poor thermal stability of both the Ce3+ and Mn2+ emissions in the co-doped samples compared to the single-doped CaCN2:Mn2+ hinders their application in emitting devices.

Supplementary Materials

The following supporting information can be downloaded at: https://www.mdpi.com/article/10.3390/inorganics11070291/s1, Figure S1: Crystal structure of CaCN2; Figure S2. Final Rietveld refinement pattern for Ca0.995Ce0.005CN2; Figure S3: Deconvolution of the double emission band of Ca0.995Ce0.005CN2; Figure S4: Powder X-ray diffraction diagrams of Ca0.997−yCe0.003MnyCN2 (0.003 ≤ y ≤ 0.04) samples; Figure S5. Final Rietveld refinement pattern for Ca0.995Ce0.003Mn0.010CN2; Figure S6: Evolution of the unit cell parameters (a, c) and cell volume (V) in Ca0.997−yCe0.003MnyCN2 (0.003 ≤ y ≤ 0.04) samples versus Ce3+ doping concentration; Table S1: Details of the Rietveld refinement of the XRD diagrams of the Ca1−xCexCN2 samples; Table S2: Occupied Wyckoff sites, refined atomic coordinates (in Å), isotropic atomic displacement parameters Biso (in Å2) and site occupancies of Ca1−xCexCN2 samples; Table S3: Details of the Rietveld refinement of the XRD diagrams of the Ca0.997−yCe0.003MnyCN2 (0.003 ≤ y ≤ 0.04) samples; Table S4: Chemical composition and Ce3+, Mn2+ contents of Ca0.997−yCe0.003MnyCN2 (0.003 ≤ y ≤ 0.04) samples obtained using EDS and the inert gas fusion technique; Table S5: Chromaticity coordinates (x, y) of the Ca0.997−yCe0.003MnyCN2 (0.003 ≤ y ≤ 0.04) samples.

Author Contributions

Conceptualization, E.L.d.R., O.M.-C. and F.C.; methodology, E.L.d.R. and Y.S.; formal analysis, F.G.; investigation, E.L.d.R., Y.S. and F.C.; writing—original draft preparation, E.L.d.R.; writing—review and editing, Y.S., O.M.-C., O.G. and F.C.; visualization, E.L.d.R.; supervision, O.M.-C. and F.C.; project administration, F.C.; All authors have read and agreed to the published version of the manuscript.

Funding

This research received no external funding.

Data Availability Statement

The datasets generated during and/or analysed during the current study are available from the corresponding author on reasonable request.

Acknowledgments

SEM and EDX experiments were performed on CMEBA platform (ScanMAT, UAR 2025 University of Rennes 1- CNRS).

Conflicts of Interest

The authors declare no conflict of interest.

References

  1. Li, K.; Shang, M.; Lian, H.; Lin, J. Recent Development in Phosphors with Different Emitting Colors via Energy Transfer. J. Mater. Chem. C 2016, 4, 5507–5530. [Google Scholar] [CrossRef]
  2. Liang, C.; You, H.; Fu, Y.; Teng, X.; Liu, K.; He, J. A Novel Tunable Blue-Green-Emitting CaGdGaAl2O7:Ce3+,Tb3+ Phosphor via Energy Transfer for UV-Excited White LEDs. Dalton Trans. 2015, 44, 8100–8106. [Google Scholar] [CrossRef]
  3. Zielinska-Dabkowska, K.M. Make Lighting Healthier. Nature 2018, 553, 274–276. [Google Scholar] [CrossRef] [PubMed] [Green Version]
  4. Downie, L.E.; Keller, P.R.; Busija, L.; Lawrenson, J.G.; Hull, C.C. Blue-light Filtering Spectacle Lenses for Visual Performance, Sleep, and Macular Health in Adults. Cochrane Database Syst. Rev. 2019, 1, 1–17. [Google Scholar] [CrossRef]
  5. Ci, Z.; Sun, Q.; Sun, M.; Jiang, X.; Qin, S.; Wang, Y. Structure, Photoluminescence and Thermal Properties of Ce3+, Mn2+ Co-Doped Phosphosilicate Sr7La3[(PO4)2.5(SiO4)3(BO4)0.5](BO2) Emission-Tunable Phosphor. J. Mater. Chem. C 2014, 2, 5850–5856. [Google Scholar] [CrossRef]
  6. Wang, Z.; Li, P.; Guo, Q.; Yang, Z. A Single-Phased Warm White-Light-Emitting Phosphor BaMg2(PO4)2:Eu2+,Mn2+,Tb3+ for White Light Emitting Diodes. Mater. Res. Bull. 2014, 52, 30–36. [Google Scholar] [CrossRef]
  7. Liu, W.-R.; Huang, C.-H.; Yeh, C.-W.; Tsai, J.-C.; Chiu, Y.-C.; Yeh, Y.-T.; Liu, R.-S. A Study on the Luminescence and Energy Transfer of Single-Phase and Color-Tunable KCaY(PO4)2:Eu2+,Mn2+ Phosphor for Application in White-Light LEDs. Inorg. Chem. 2012, 51, 9636–9641. [Google Scholar] [CrossRef]
  8. Zhang, J.; He, Y.; Qiu, Z.; Zhang, W.; Zhou, W.; Yu, L.; Lian, S. Site-Sensitive Energy Transfer Modes in Ca3Al2O6:Ce3+/Tb3+/Mn2+ Phosphors. Dalton Trans. 2014, 43, 18134–18145. [Google Scholar] [CrossRef]
  9. Shang, M.; Li, C.; Lin, J. How to Produce White Light in a Single-Phase Host? Chem. Soc. Rev. 2014, 5, 1372–1386. [Google Scholar] [CrossRef]
  10. Khan, S.A.; Khan, N.Z.; Sohail, M.; Ahmed, J.; Alhokbany, N.; Alshehri, S.M.; Xu, X.; Zhu, J.; Agathopoulos, S. Modern Aspects of Strategies for Developing Single-Phase Broadly Tunable White Light-Emitting Phosphors. J. Mater. Chem. C 2021, 9, 13041–13071. [Google Scholar] [CrossRef]
  11. Glaser, J.; Unverfehrt, L.; Bettentrup, H.; Heymann, G.; Huppertz, H.; Jüstel, T.; Meyer, H.-J. Crystal Structures, Phase-Transition, and Photoluminescence of Rare Earth Carbodiimides. Inorg. Chem. 2008, 47, 10455–10460. [Google Scholar] [CrossRef]
  12. Dutczak, D.; Ströbele, M.; Enseling, D.; Jüstel, T.; Meyer, H.-J. Eu2(CN2)3 and KEu[Si(CN2)4]: Missing Members of the Rare Earth Metal Carbodiimide and Tetracyanamidosilicate Series. Eur. J. Inorg. Chem. 2016, 2016, 4011–4016. [Google Scholar] [CrossRef]
  13. Dolabdjian, K.; Schedel, C.; Enseling, D.; Jüstel, T.; Meyer, H.-J. Synthesis, Luminescence and Nonlinear Optical Properties of Homoleptic Tetracyanamidogermanates ARE[Ge(CN2)4] (A = K, Cs, and RE = La, Ce, Pr, Nd, Sm, Eu, Gd). Z. Anorg. Allg. Chem. 2017, 643, 488–494. [Google Scholar] [CrossRef]
  14. Yuan, S.; Yang, Y.; Chevire, F.; Tessier, F.; Zhang, X.; Chen, G. Photoluminescence of Eu2+-Doped Strontium Cyanamide: A Novel Host Lattice for Eu2+. J. Am. Ceram. Soc. 2010, 93, 3052–3055. [Google Scholar] [CrossRef] [Green Version]
  15. Krings, M.; Montana, G.; Dronskowski, R.; Wickleder, C. α-SrNCN:Eu2+ − A Novel Efficient Orange-Emitting Phosphor. Chem. Mater. 2011, 23, 1694–1699. [Google Scholar] [CrossRef]
  16. Leysour de Rohello, E.; Suffren, Y.; Merdrignac-Conanec, O.; Guillou, O.; Cheviré, F. Effect of Cationic Substitutions on the Photoluminescence Properties of Eu2+ Doped SrCN2 Prepared by a Facile C3N4 Based Synthetic Approach. J. Eur. Ceram. Soc. 2020, 40, 6316–6321. [Google Scholar] [CrossRef]
  17. Masubuchi, Y.; Nishitani, S.; Hosono, A.; Kitagawa, Y.; Ueda, J.; Tanabe, S.; Yamane, H.; Higuchi, M.; Kikkawa, S. Red-Emission over a Wide Range of Wavelengths at Various Temperatures from Tetragonal BaCN2:Eu2+. J. Mater. Chem. C 2018, 6, 6370–6377. [Google Scholar] [CrossRef] [Green Version]
  18. Kubus, M.; Castro, C.; Enseling, D.; Jüstel, T. Room Temperature Red Emitting Carbodiimide Compound Ca(CN2):Mn2+. Opt. Mater. 2016, 59, 126–129. [Google Scholar] [CrossRef]
  19. Leysour de Rohello, E.; Bour, F.; Suffren, Y.; Merdrignac-Conanec, O.; Guillou, O.; Cheviré, F. Synthesis and Photoluminescence Properties of Mn2+ Doped ZnCN2 Phosphors. Open Ceram. 2021, 7, 100157. [Google Scholar] [CrossRef]
  20. Leysour de Rohello, E.; Suffren, Y.; Merdrignac-Conanec, O.; Guillou, O.; Calers, C.; Cheviré, F. Synthesis and Photoluminescence Properties of Mn2+ Doped Ca1−xSrxCN2 Phosphors Prepared by a Carbon Nitride Based Route. J. Solid State Chem. 2021, 300, 122240. [Google Scholar] [CrossRef]
  21. Schädler, H.D.; Jäger, L.; Senf, I. Pseudoelement Compounds. V. Pseudochalcogens—An Attempt of an Empirical and Theoretical Characterization. Z. Anorg. Allg. Chem. 1993, 619, 1115–1120. [Google Scholar] [CrossRef]
  22. Pauling, L. The Chemical Bond; Cornell University Press: Ithaca, NY, USA, 1967. [Google Scholar]
  23. Güthner, T.; Mertschenk, B. Cyanamides. In Ullmann’s Encyclopedia of Industrial Chemistry; Wiley-VCH Verlag: Weinheim, Germany, 2006. [Google Scholar] [CrossRef]
  24. Shannon, R.D. Revised Effective Ionic Radii and Systematic Studies of Interatomic Distances in Halides and Chalcogenides. Acta Crystallogr. A 1976, 32, 751–767. [Google Scholar] [CrossRef]
  25. Vannerberg, N.G. The Crystal Structure of Calcium Cyanamide. Acta Chem. Scand. 1962, 16, 2263–2266. [Google Scholar] [CrossRef]
  26. Zhu, Q.-Q.; Wang, L.; Hirosaki, N.; Hao, L.Y.; Xu, X.; Xie, R.-J. Extra-Broad Band Orange-Emitting Ce3+-Doped Y3Si5N9O Phosphor for Solid-State Lighting: Electronic, Crystal Structures and Luminescence Properties. Chem. Mater. 2016, 28, 4829–4839. [Google Scholar] [CrossRef]
  27. Ji, X.; Zhang, J.; Li, Y.; Liao, S.; Zhang, X.; Yang, Z.; Wang, Z.; Qiu, Z.; Zhou, W.; Yu, L.; et al. Improving Quantum Efficiency and Thermal Stability in Blue-Emitting Ba2−xSrxSiO4:Ce3+ Phosphor via Solid Solution. Chem. Mater. 2018, 30, 5137–5147. [Google Scholar] [CrossRef]
  28. Blasse, G.; Grabmaier, B.C. Luminescent Materials; Springer: Berlin/Heidelberg, Germany, 1994. [Google Scholar] [CrossRef]
  29. Liu, Q.; Yin, H.; Liu, T.; Wang, C.; Liu, R.; Lü, W.; You, H. Luminescent Properties and Energy Transfer of CaO:Ce3+,Mn2+ Phosphors for White LED. J. Lumin. 2016, 177, 349–353. [Google Scholar] [CrossRef]
  30. Game, D.N.; Ingale, N.B.; Omanwar, S.K. Converted White Light Emitting Diodes from Ce3+ Doping of Alkali Earth Sulfide Phosphors. Mater. Discov. 2016, 4, 1–7. [Google Scholar] [CrossRef]
  31. Yu, R.; Wang, J.; Zhang, M.; Zhang, J.; Yuan, H.; Su, Q. A New Blue-Emitting Phosphor of Ce3+-Activated CaLaGa3S6O for White-Light-Emitting Diodes. Chem. Phys. Lett. 2008, 453, 197–201. [Google Scholar] [CrossRef]
  32. Bachmann, V.; Ronda, C.; Meijerink, A. Temperature Quenching of Yellow Ce3+ Luminescence in YAG:Ce. Chem. Mater. 2009, 21, 2077–2084. [Google Scholar] [CrossRef]
  33. Wang, Z.; Lou, S.; Li, P. Enhanced Orange–Red Emission of Sr3La(PO4)3:Ce3+,Mn2+ via Energy Transfer. J. Lumin. 2014, 156, 87–90. [Google Scholar] [CrossRef]
  34. Liu, H.; Liao, L.; Xia, Z. Structure, Luminescence Property and Energy Transfer Behavior of Color-Adjustable La5Si2BO13:Ce3+,Mn2+ Phosphors. RSC Adv. 2014, 4, 7288–7295. [Google Scholar] [CrossRef]
  35. Si, J.; Wang, L.; Liu, L.; Yi, W.; Cai, G.; Takeda, T.; Funahashi, S.; Hirosaki, N.; Xie, R.-J. Structure, Luminescence and Energy Transfer in Ce3+ and Mn2+ Codoped γ-AlON Phosphors. J. Mater. Chem. C 2019, 7, 733–742. [Google Scholar] [CrossRef]
  36. Paulose, P.I.; Jose, G.; Thomas, V.; Unnikrishnan, N.V.; Warrier, M.K.R. Sensitized Fluorescence of Ce3+/Mn2+ System in Phosphate Glass. J. Phys. Chem. Solids 2003, 64, 841–846. [Google Scholar] [CrossRef]
  37. Reisfeld, R.; Greenberg, E.; Velapoldi, R.; Barnett, B. Luminescence Quantum Efficiency of Gd and Tb in Borate Glasses and the Mechanism of Energy Transfer between Them. J. Chem. Phys. 2003, 56, 1698. [Google Scholar] [CrossRef]
  38. Antipenko, B.M.; Batyaev, I.M.; Ermolaev, V.L.; Lyubimov, E.I.; Privalova, T.A. Radiationless Transfer of Electron Excitation Energy between Rare Earth Ions in POCl3-SnCl4. Opt. Spektrosk. 1970, 29, 335–338. [Google Scholar]
  39. Blasse, G. Energy Transfer in Oxidic Phosphors. Phys. Lett. A 1968, 28, 444–445. [Google Scholar] [CrossRef]
  40. Dexter, D.L. A Theory of Sensitized Luminescence in Solids. J. Chem. Phys. 1953, 21, 836–850. [Google Scholar] [CrossRef]
  41. Lin, Y.-C.; Bettinelli, M.; Karlsson, M. Unraveling the Mechanisms of Thermal Quenching of Luminescence in Ce3+-Doped Garnet Phosphors. Chem. Mater. 2019, 31, 3851–3862. [Google Scholar] [CrossRef]
  42. Rodríguez-Carvajal, J. Recent Advances in Magnetic Structure Determination by Neutron Powder Diffraction. Phys. B Condens. Matter 1993, 192, 55–69. [Google Scholar] [CrossRef]
  43. Roisnel, T.; Rodríguez-Carvajal, J. WinPLOTR: A Windows Tool for Powder Diffraction Pattern Analysis. Mater. Sci. Forum 2001, 378, 118–123. [Google Scholar] [CrossRef] [Green Version]
  44. Kubelka, D.; Munk, L. Ein Beitrag Zur Optik Der Farbanstriche. Z. Tech. Phys. 1931, 12, 593–601. [Google Scholar]
  45. Wyszecki, G. Colorimetry. In Handbook of Optics; Driscoll, W.G., Vaughan, W., Eds.; MacGraw-Hill Book Company: New York, NY, USA, 1978; pp. 1–15. [Google Scholar]
  46. [CIE] International Commission on Illumination. Method of Measuring and Specifying Colour Rendering Properties of Light Sources; Publication No. CIE 13.3-1995; CIE: Vienna, Austria, 1995; 16p. [Google Scholar]
Figure 1. Powder X-ray diffraction diagrams of Ca1−xCexCN2 (0 ≤ x ≤ 0.04) samples. Inset: Zoom on the X-ray diffraction diagrams of samples Ca0.97Ce0.03CN2 and Ca0.96Ce0.04CN2 between 8° and 40° (Inverted triangles (▼) indicate the main peaks of the Ce2O2CN2 impurity (JCPDS no. 049 1164)).
Inorganics 11 00291 g001
Figure 2. Evolution of the unit cell parameters (a, c) and cell volume (V) in Ca1−xCexCN2 (0 < x < 0.04) samples versus Ce3+ doping concentration.
Inorganics 11 00291 g002
Figure 3. SEM images of Ca0.995Ce0.005CN2 powder at various magnifications: (a) ×1500, (b) ×2500, (c) ×10,000 and (d) ×50,000.
Inorganics 11 00291 g003
Figure 4. Diffuse reflection spectra of undoped and Ce3+-doped CaCN2 samples at room temperature. In inset: Appearance of CaCN2 and Ca0.98Ce0.02CN2 powders in daylight.
Inorganics 11 00291 g004
Figure 5. PLE and PL spectra at room temperature of the Ca0.995Ce0.005CN2 sample. In inset: The CIE chromaticity diagram, chromaticity coordinates (x = 0.19, y = 0.29) and picture under 365 nm UV lamp.
Inorganics 11 00291 g005
Figure 6. (a) PL spectra at room temperature of CaCN2:Ce samples. (b) Maximum emission intensity (Imax) vs. mol% (Ce) for CaCN2:Ce. Uncertainty bars = ±0.05.
Inorganics 11 00291 g006
Figure 7. Luminescent decay measurement of Ca0.995Ce0.005CN2 at 300 K under photoexcitation at 394 nm (red circles), bi-exponential curve fit (black line) and calculated decay times τ1 and τ2.
Inorganics 11 00291 g007
Figure 8. (a) PL spectra (λexc = 386 nm) of Ca0.995Ce0.005CN2 at variable temperature (293–387 K). (b) Maximum emission intensity (Imax) vs. temperature (293–387 K) for Ca0.995Ce0.005CN2. Uncertainty bars = ±0.05.
Inorganics 11 00291 g008
Figure 9. (a) PL spectra (λexc = 386 nm) of Ca0.995Ce0.005CN2 at low temperature (77–300 K). (b) Maximum emission intensity (Imax) vs. temperature (77–300 K) for Ca0.995Ce0.005CN2. Uncertainty bars = ±0.05.
Inorganics 11 00291 g009
Figure 10. Diffuse reflection spectra of Ca0.997Ce0.003CN2 and Ca0.997−yCe0.003MnyCN2 (0.003 ≤ y ≤ 0.04) samples at room temperature. In inset: Appearance of Ca0.997Ce0.003CN2 and Ca0.957Ce0.003Mn0.04CN2 powders in daylight.
Inorganics 11 00291 g010
Figure 11. (a) PLE spectra monitored at 680 nm (red-dashed curve) and 462 nm (black-dashed curve) of Ca0.987Ce0.003Mn0.01CN2 and PL spectra (λexc = 386 nm) of Ca0.997−yCe0.003MnyCN2 (0.003 ≤ y ≤ 0.04) samples at room temperature. (b) Evolution of the maximum emission intensity of Ce3+ (462 nm) and Mn2+ (680 nm) as a function of mol% (Mn) for Ca0.997−yCe0.003MnyCN2 co-doped samples (0.003 ≤ y ≤ 0.04). Uncertainty bar = ±0.05.
Inorganics 11 00291 g011
Figure 12. The CIE chromaticity diagram, chromaticity coordinates, and picture under 365 nm UV lamp at room temperature of Ca0.997−yCe0.003MnyCN2 (0.003 ≤ y ≤ 0.04) samples.
Inorganics 11 00291 g012
Figure 13. (a) Photoluminescence decay curves of Ce3+ in Ca0.997−yCe0.003MnyCN2 (0.003 ≤ y ≤ 0.04) samples. (b) Energy transfers efficiency (ηT) vs. mol% (Mn) for Ca0.997−yCe0.003MnyCN2 (0.003 ≤ y ≤ 0.04).
Inorganics 11 00291 g013
Figure 14. Dependence of IS0/IS of Ce3+ on (a) C6/3, (b) C8/3 and (c) C10/3.
Inorganics 11 00291 g014
Figure 15. (a) PL spectra (λexc = 386 nm) of Ca0.987Ce0.003Mn0.01CN2 sample at variable temperature (293–383 K). (b) Maximum emission intensity (Imax) vs. temperature (293–387 K) for Ca0.987Ce0.003Mn0.01CN2. Uncertainty bars = ±0.05.
Inorganics 11 00291 g015
Table 1. Chemical composition and Ce3+ content of Ca1−xCexCN2 (0 < x < 0.04) samples.
Ca
at%
Ce
at% *
Na
at%
Nexp
wt%
Ncalc
wt%
ΔN
% **
O
wt%
Ca0.997Ce0.003CN298.830.45 (0.45)0.7234.4534.831.090.51
Ca0.995Ce0.005CN298.110.59 (0.60)1.3034.1934.751.640.41
Ca0.99Ce0.01CN296.471.28 (1.31)2.2535.3434.532.340.78
Ca0.985Ce0.015CN295.751.61 (1.65)2.6434.3534.320.090.55
Ca0.98Ce0.02CN295.192.17 (2.23)2.6433.2334.112.580.41
Ca0.97Ce0.03CN294.863.35 (3.41)1.7932.2233.704.391.36
Ca0.96Ce0.04CN291.864.76 (4.93)3.3831.7733.304.591.22
* Values without brackets represent Ce3+ rates taking into account Na; the values in brackets are the Ce3+ rates recalculated without considering Na. ** Deviation of the experimental nitrogen rate from the theoretical value.
Disclaimer/Publisher’s Note: The statements, opinions and data contained in all publications are solely those of the individual author(s) and contributor(s) and not of MDPI and/or the editor(s). MDPI and/or the editor(s) disclaim responsibility for any injury to people or property resulting from any ideas, methods, instructions or products referred to in the content.

