Article

Preparation and Study of Photocatalytic Properties of (M(M=Pt, Ag and Au)-TiO2)@MoS2 Nanocomposites

1
School of Physical and Electronic Science, Zunyi Normal College, Zunyi 563006, China
2
School of Materials and Metallurgy, Guizhou University, Guiyang 550025, China
*
Author to whom correspondence should be addressed.
These authors contributed equally to this work.
Inorganics 2023, 11(6), 258; https://doi.org/10.3390/inorganics11060258
Submission received: 26 February 2023 / Revised: 26 May 2023 / Accepted: 29 May 2023 / Published: 15 June 2023
(This article belongs to the Special Issue Optoelectronic Properties of Metal Oxide Semiconductors)

Abstract

:
There have been many articles on the degradation of pollutants by binary and ternary nanocomposites in the field of photocatalysis. However, there has been no research comparing the photocatalytic performance of Rhodamine B (Rh B) between (M(M=Pt, Ag and Au)-TiO2)@MoS2 nanocomposites and binary nanocomposites. To this end, we prepared and studied (M(M=Pt, Ag and Au)-TiO2)@MoS2 nanocomposites and compared their photocatalytic degradation efficiency with binary composites and parent materials for Rhodamine B. We concluded that the best ternary polymer nanocomposite for degrading Rhodamine B is (Pt(5 wt%)-TiO2(15 wt%))@MoS2. In this work, a series of MoS2, TiO2@MoS2, and (M(M=Pt, Ag and Au)-TiO2)@MoS2 nanocomposites with various compositions were synthesized by the hydrothermal and deposition–precipitation methods, and their photocatalytic characteristics were studied in depth using X-ray diffraction (XRD), scanning electron microscopy (SEM), transmission electron microscopy (TEM), X-ray photoelectron spectroscopy (XPS) photoluminescence spectra (PL), FTIR spectra, UV–Vis DRS spectra, and BET analyzer. The results confirmed that TiO2 and M(Pt, Ag and Au) nanoparticles (NPs) were evenly distributed on MoS2 nanosheets (NSs) to form (M(M=Pt, Ag and Au)-TiO2)@MoS2 nanocomposite heterojunction. The UV–Vis absorption spectrum test results indicated that (Pt(5 wt%)-TiO2(15 wt%))@MoS2 ternary heterojunction nanocomposites exhibited the highest photocatalysis activity, with the maximum value of 99.0% compared to 93% for TiO2(15 wt%)@MoS2, 96.5% for (Ag(5 wt%)-TiO2(15 wt%))@MoS2, and 97.8% for (Au(5 wt%)-TiO2(15 wt%))@MoS2 within 9 min. The advanced structure of (Pt-TiO2)@MoS2 improved both light harvesting and electron transfer in the photocatalytic composites, contributing to remarkable catalytic effectiveness and extended durability for the photodegradation of Rhodamine B (Rh B). In-depth discussions of the potential growth and photocatalytic mechanism, which will help improve the energy and environmental fields, are included.

1. Introduction

Currently, the concern regarding natural contamination has increased overall research interests in the photocatalysis process, which is by and large viewed as one of the best high-level oxidation processes [1,2]. Organic contaminants can be degraded using photocatalytic degradation technology into non-toxic carbon dioxide and water directly via solar energy, which is a non-polluting green wastewater treatment technology [1,2,3]. MoS2, as a two-dimensional nanomaterial, has a band gap of its nanostructure of around 1.78 eV and has photocatalysis activity under ultraviolet and visible light, so is considered to be a promising candidate [4]. Therefore, a type of MoS2 nanocomposite catalytic material could be developed and achieve excellent photocatalysis results.
In the last few decades, studies have shown that MoS2 composites loaded with precious metals or oxidized metals can dramatically enhance the separated efficiency of electron hole pairs in semiconductor materials, inhibit their recombination, and thus greatly improve their photocatalytic efficiency [5,6,7,8,9,10]. Layered dichalcogenide using TiO2 as a photoactive material has great application value in terms of photocatalytic performance and supercapacitors [11,12]. Due to its electronic structure and narrow bandgap [13,14], TiO2 can act as a photocatalyst, but its electron–hole pairs tend to recombine [15]. TiO2 can only absorb UV radiation because of its bandgap energy of 3.2 eV. However, MoS2 has a compatible energy band structure with TiO2. By creating a heterostructure, TiO2–MoS2, it is possible to take advantage of MoS2’s narrow bandgap characteristics to widen the light absorption radius and increase the light absorption intensity. Furthermore, by forming an internal electric field, the photogenerated current carrier recombination can be effectively inhibited [16,17,18,19,20,21,22,23,24,25,26,27,28].
Furthermore, noble metals such as platinum (Pt), silver (Ag), and gold (Au) can also be incorporated into titanium oxide, because precious metal nanoparticles can decrease the rapid recombination of photogenerated charge carriers, thus enabling the use of visible light [29,30,31]. By lowering photogenerated charge carriers, electrons of TiO2 are transferred from the CB to the noble metal nanoparticles [32], increasing UV activity. Surface plasmon resonance effect and charge separation, which transmit photoexcited electrons from metal nanoparticles to TiO2 CB, can explain photoactivity in the visible region of the electromagnetic spectrum [33]. Acquiring heterostructures by coupling two or more materials with distinct qualities makes it possible to enhance the photocatalytic activity of the system [34,35].
Based on the above analysis, it is possible that the components of this ternary structure may have synergetic advantages and improve visible light activation [36,37,38,39]. Herein, in this paper, a series of (M(M=Pt, Ag and Au)-TiO2)@MoS2 ternary heterojunction nanocomposites were prepared by the hydrothermal and deposition–precipitation methods, and the catalytic activity of the nanomaterials was investigated systematically under visible light irradiation with Rh B as the target contaminant. The experimental results showed that Pt (5 wt%) and TiO2 (15 wt%) co-modified MoS2 ternary heterojunction nanocomposites achieved the highest photocatalytic activity, with the maximum value of 99.0%, compared to 93% for TiO2@MoS2, 96.5% for (Ag-TiO2)@MoS2, and 97.8% for (Au-TiO2) @MoS2 within 9 min. The (Pt-TiO2)@MoS2 ternary heterojunction nanocomposites provided an effective path of photoexcited electrons from TiO2 to surface-decorated Pt NPs using MoS2 and internal Pt NPs as bridges, which greatly promoted electron transfer, reduced system overpotential, and led to more reactive areas being activated. The advanced structure of (Pt-TiO2)@MoS2 improved both light harvesting and electron transfer in photocatalytic composites, contributing to remarkable catalytic effectiveness and extended durability for the photodegradation of Rhodamine B (Rh B). In-depth discussions of the potential growth and photocatalytic mechanism, which will help improve the energy and environmental fields, are included.

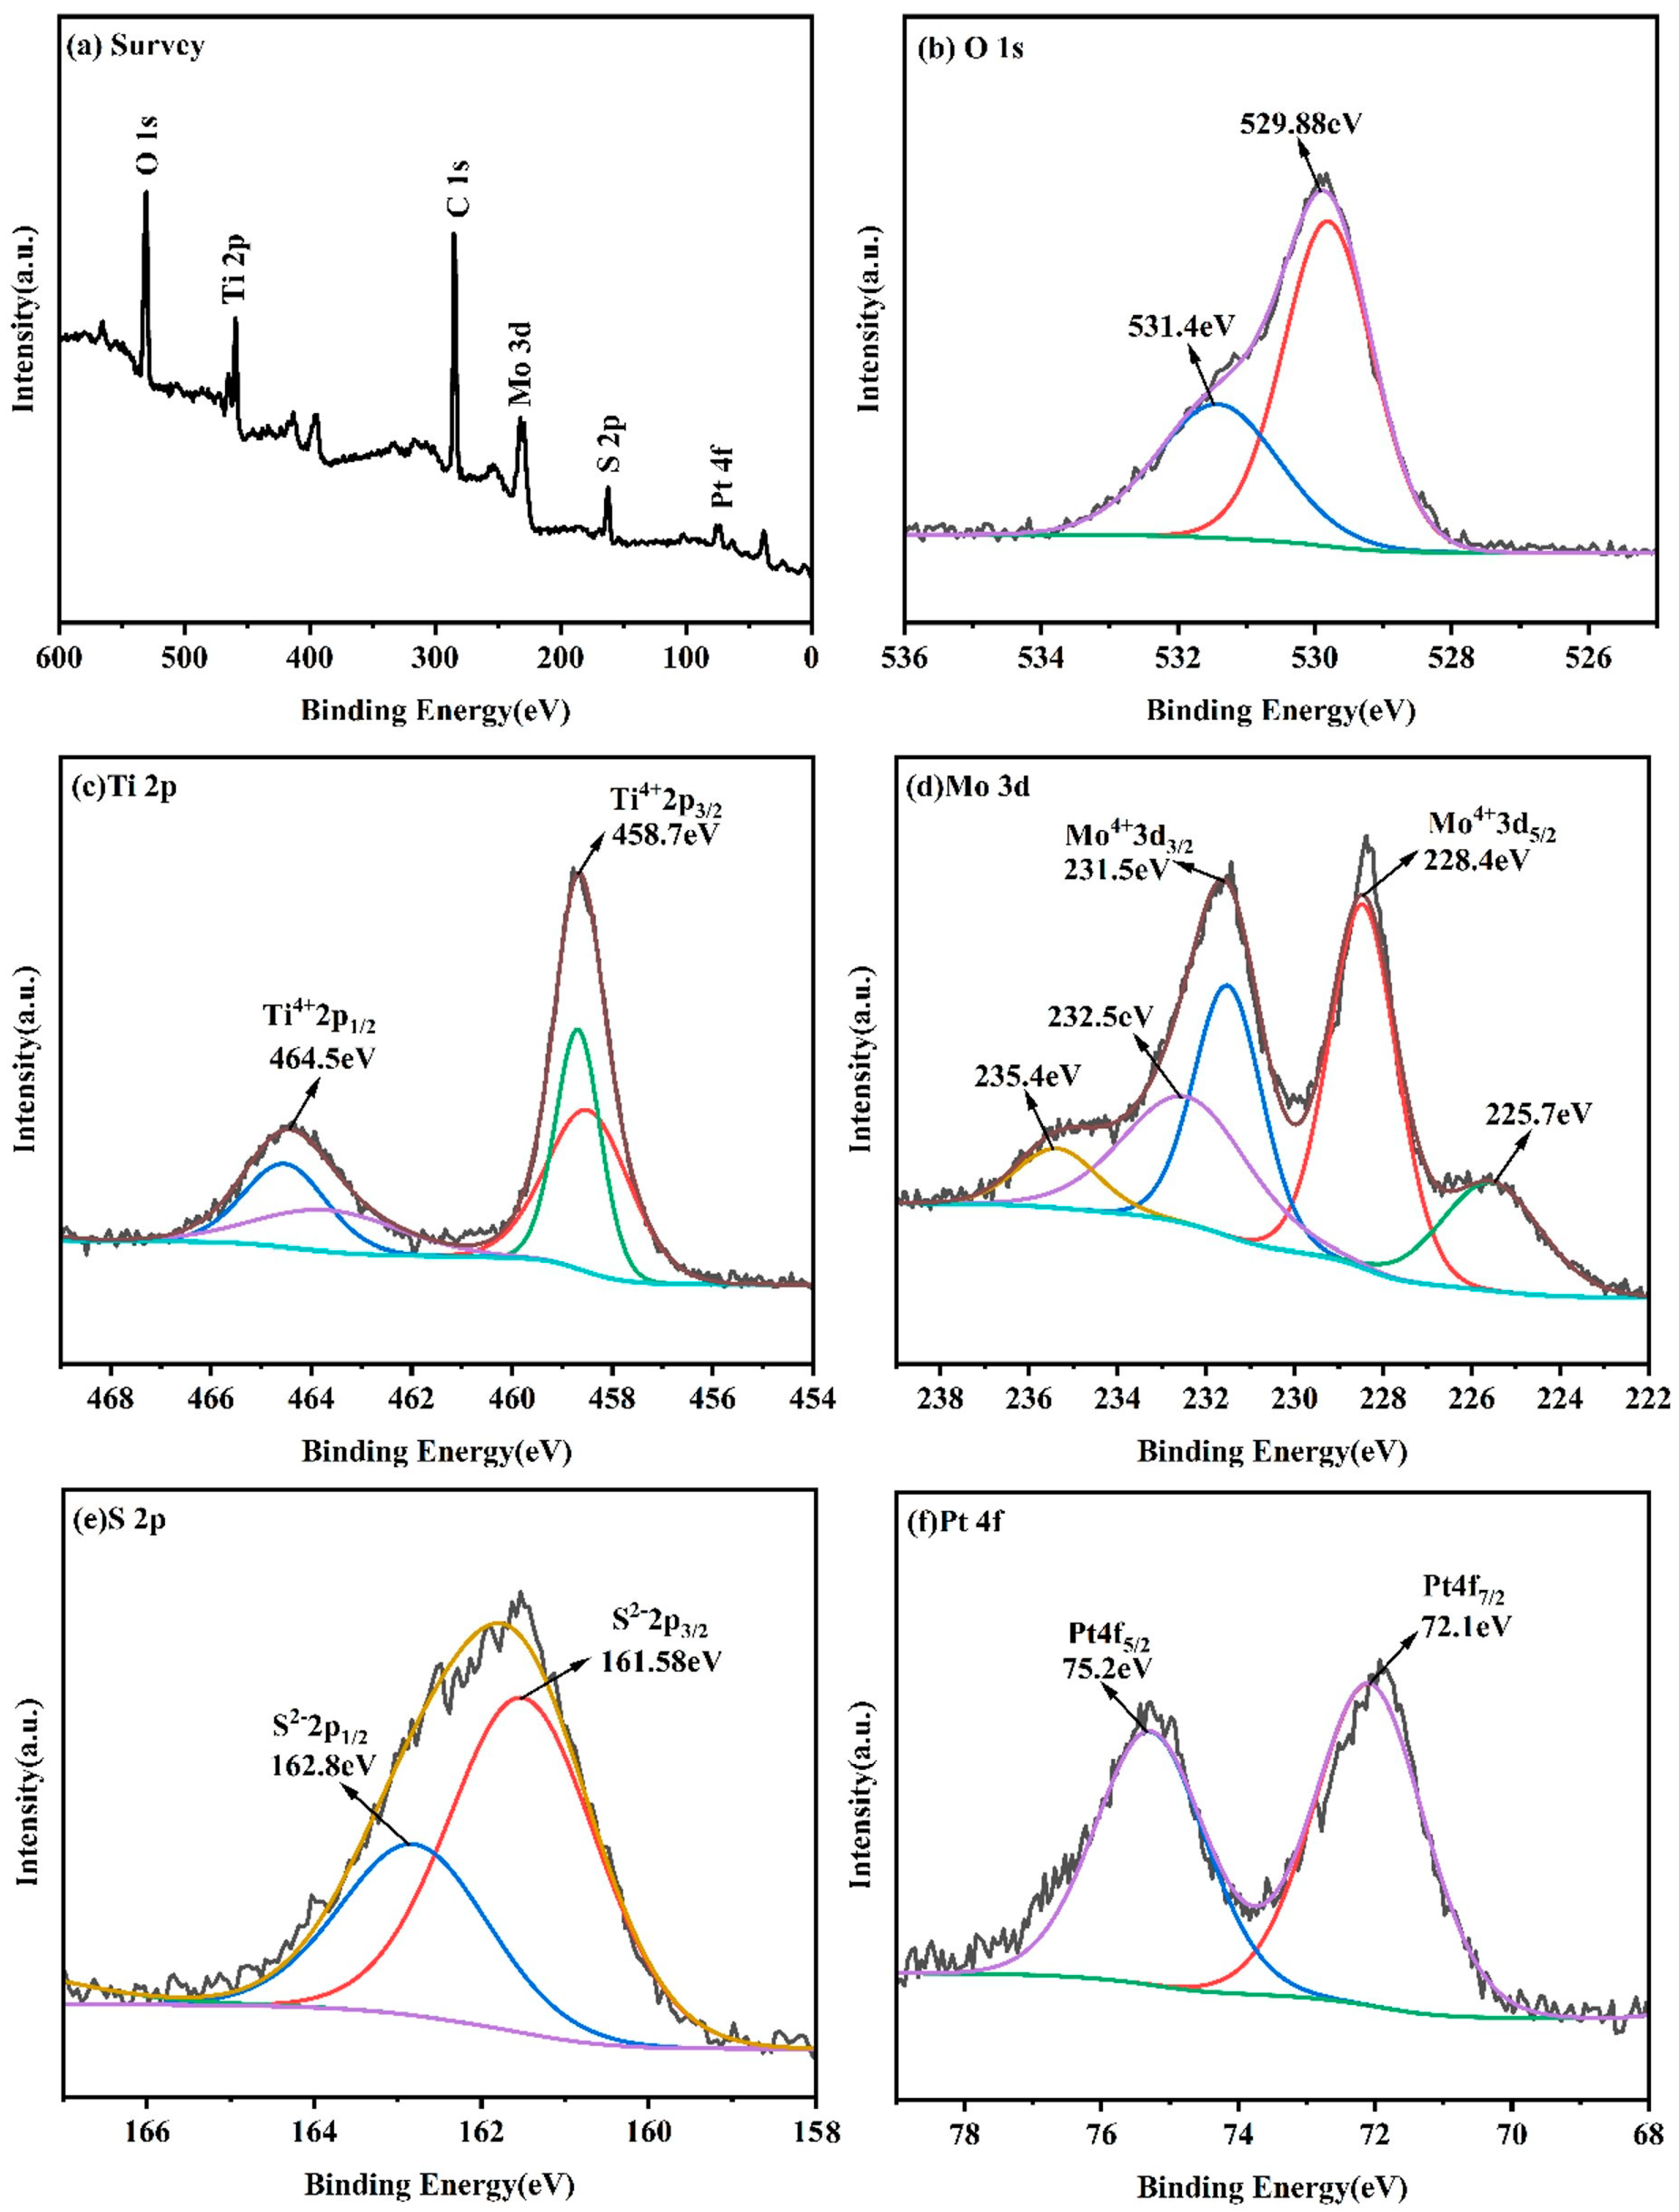
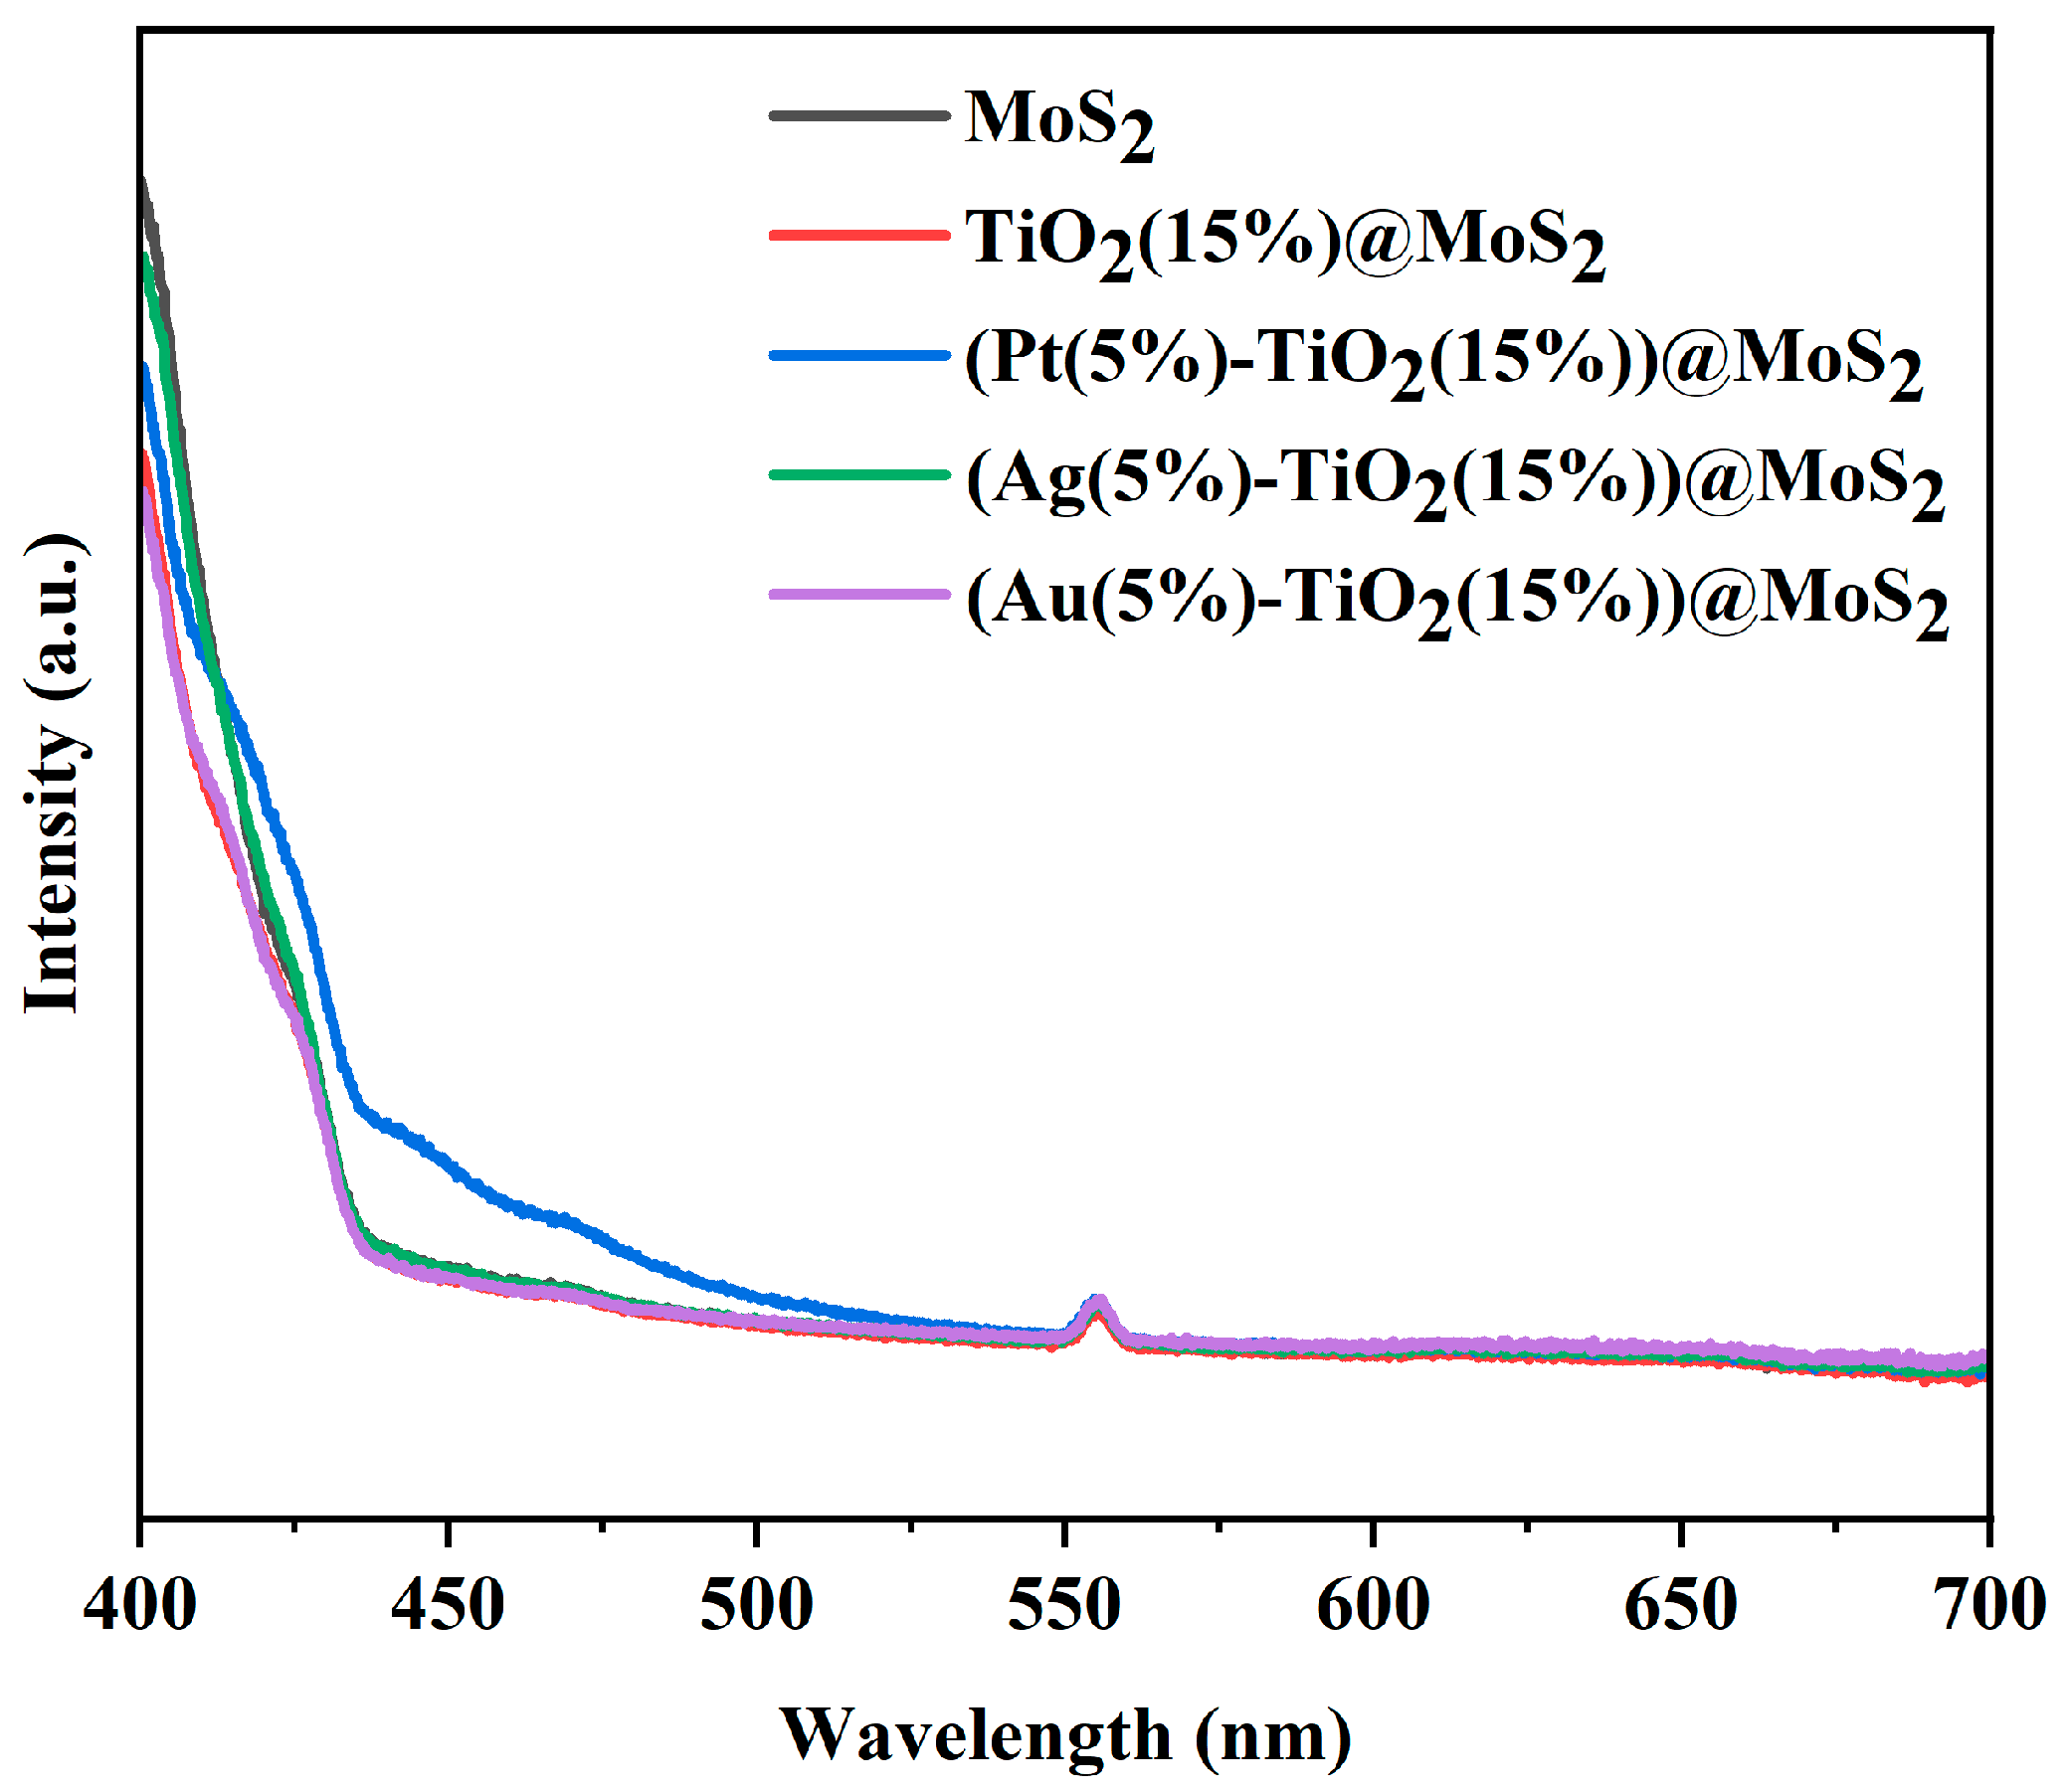
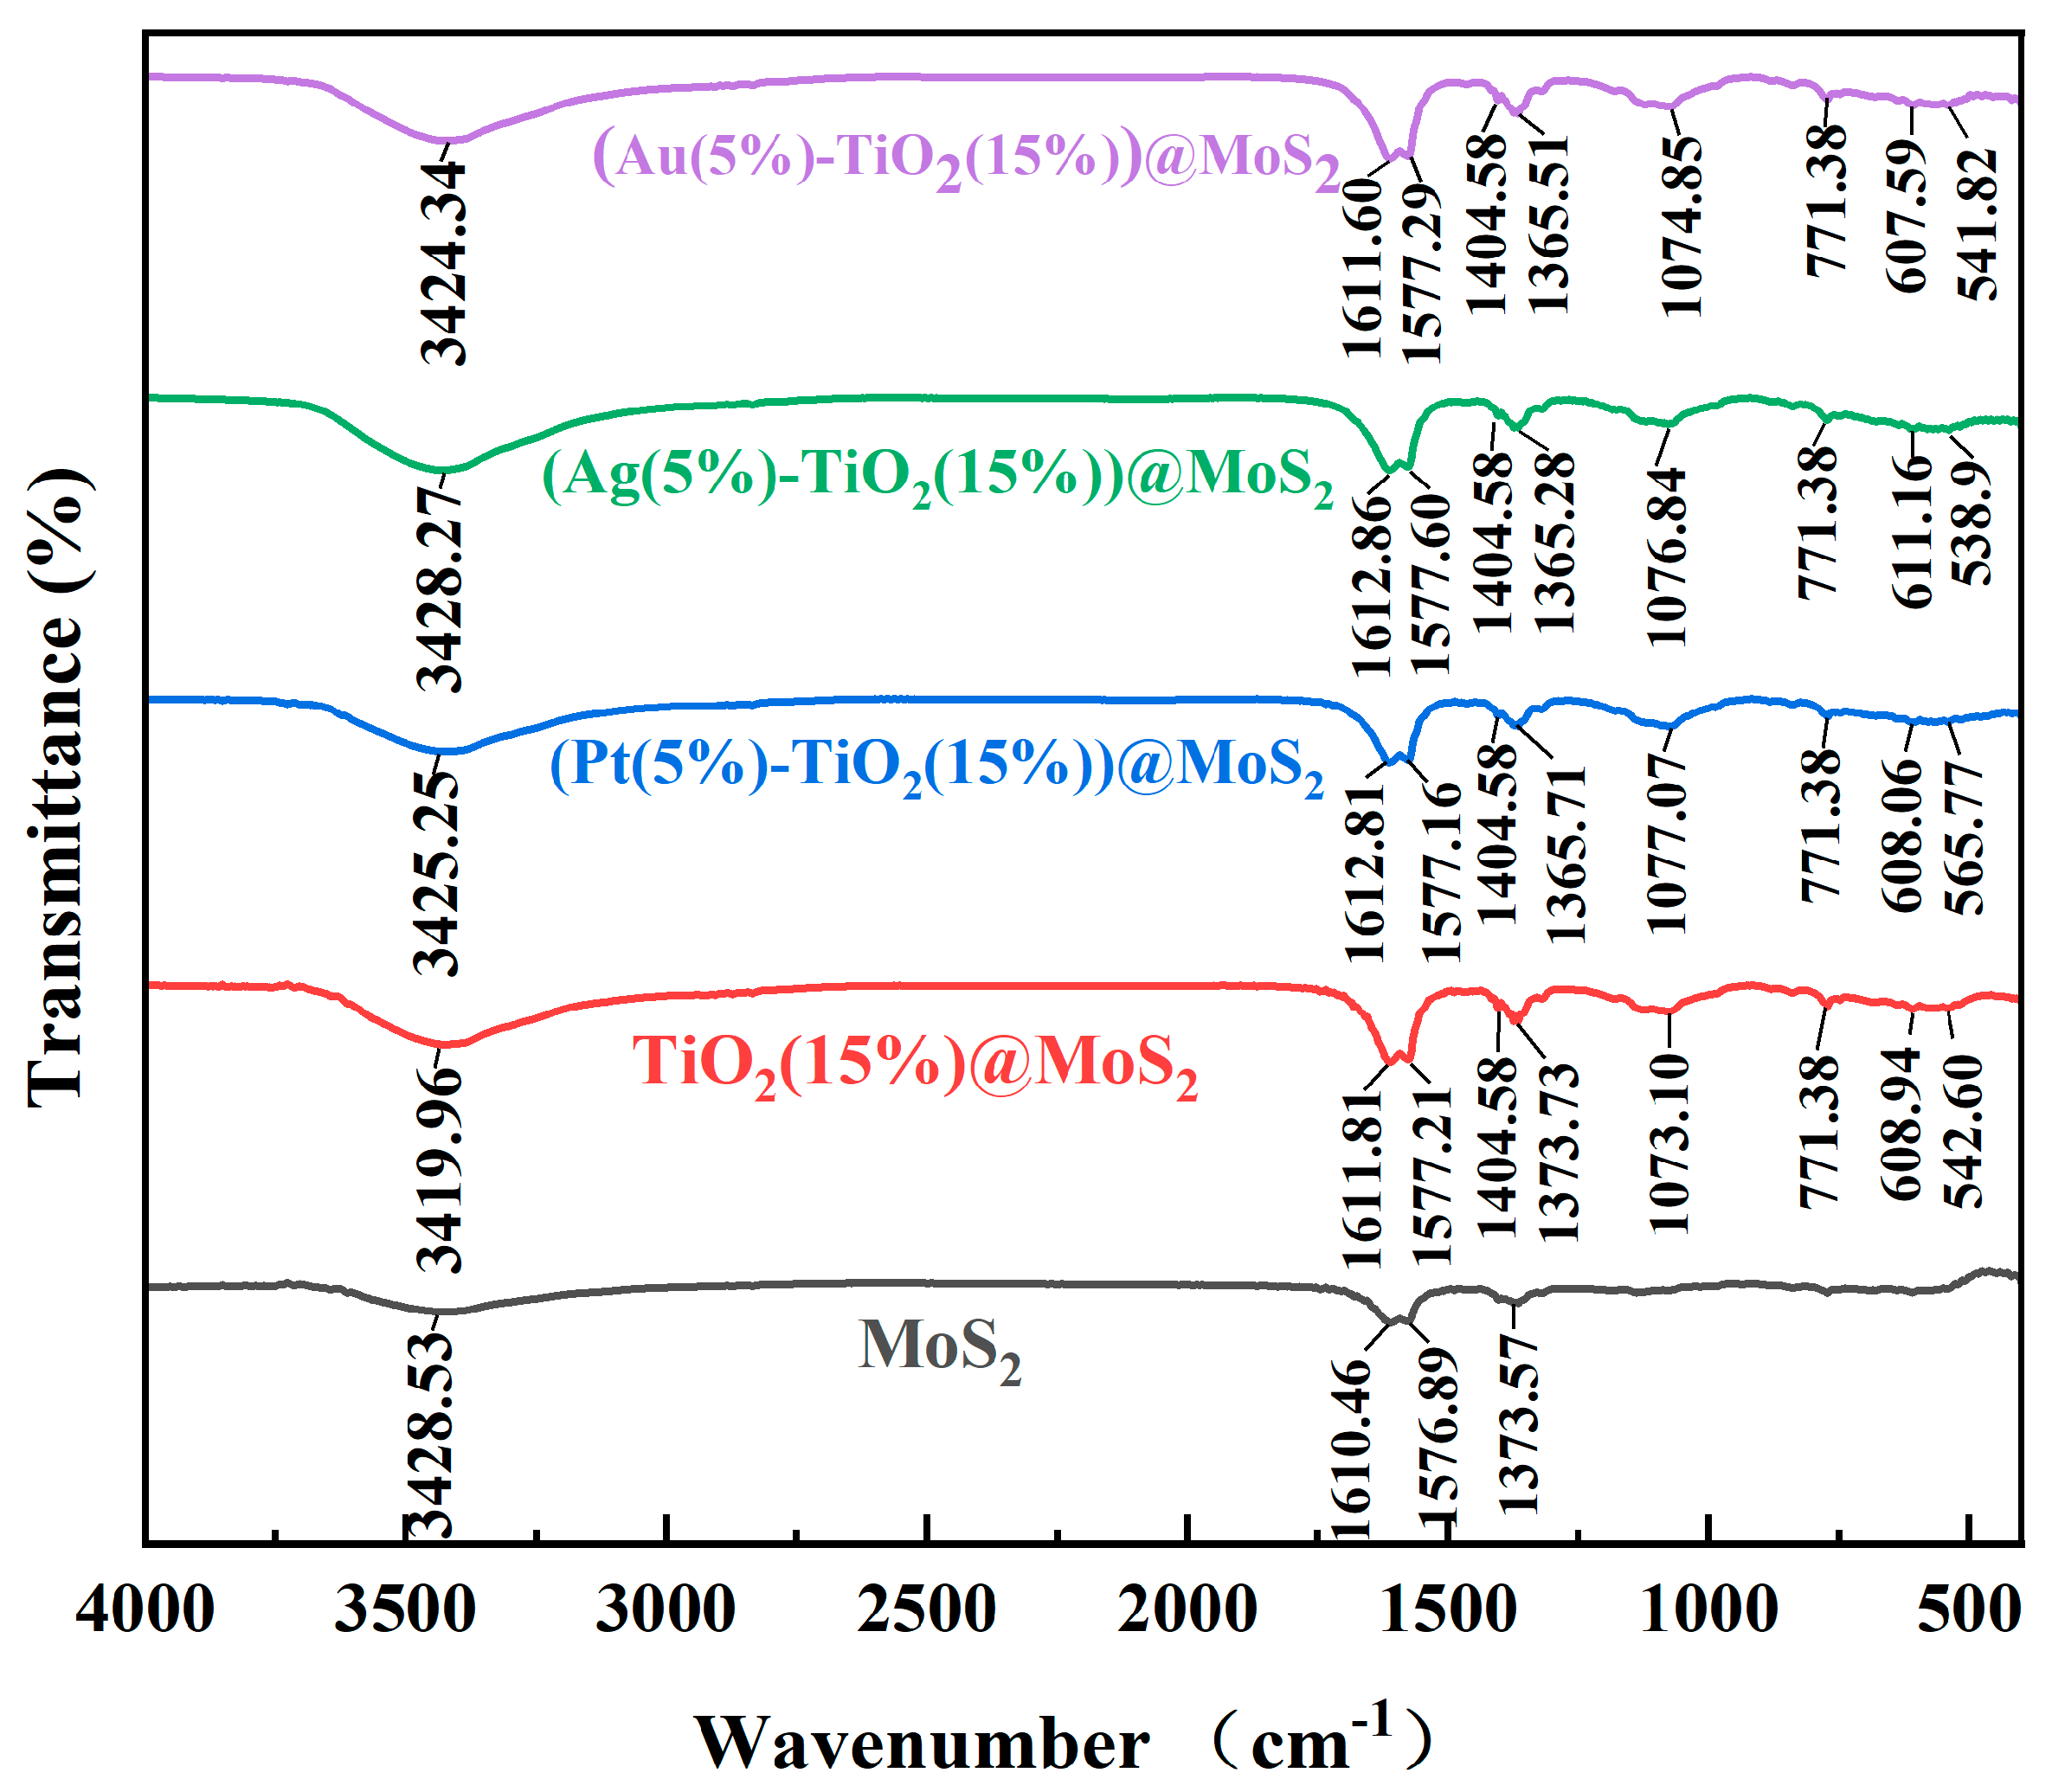
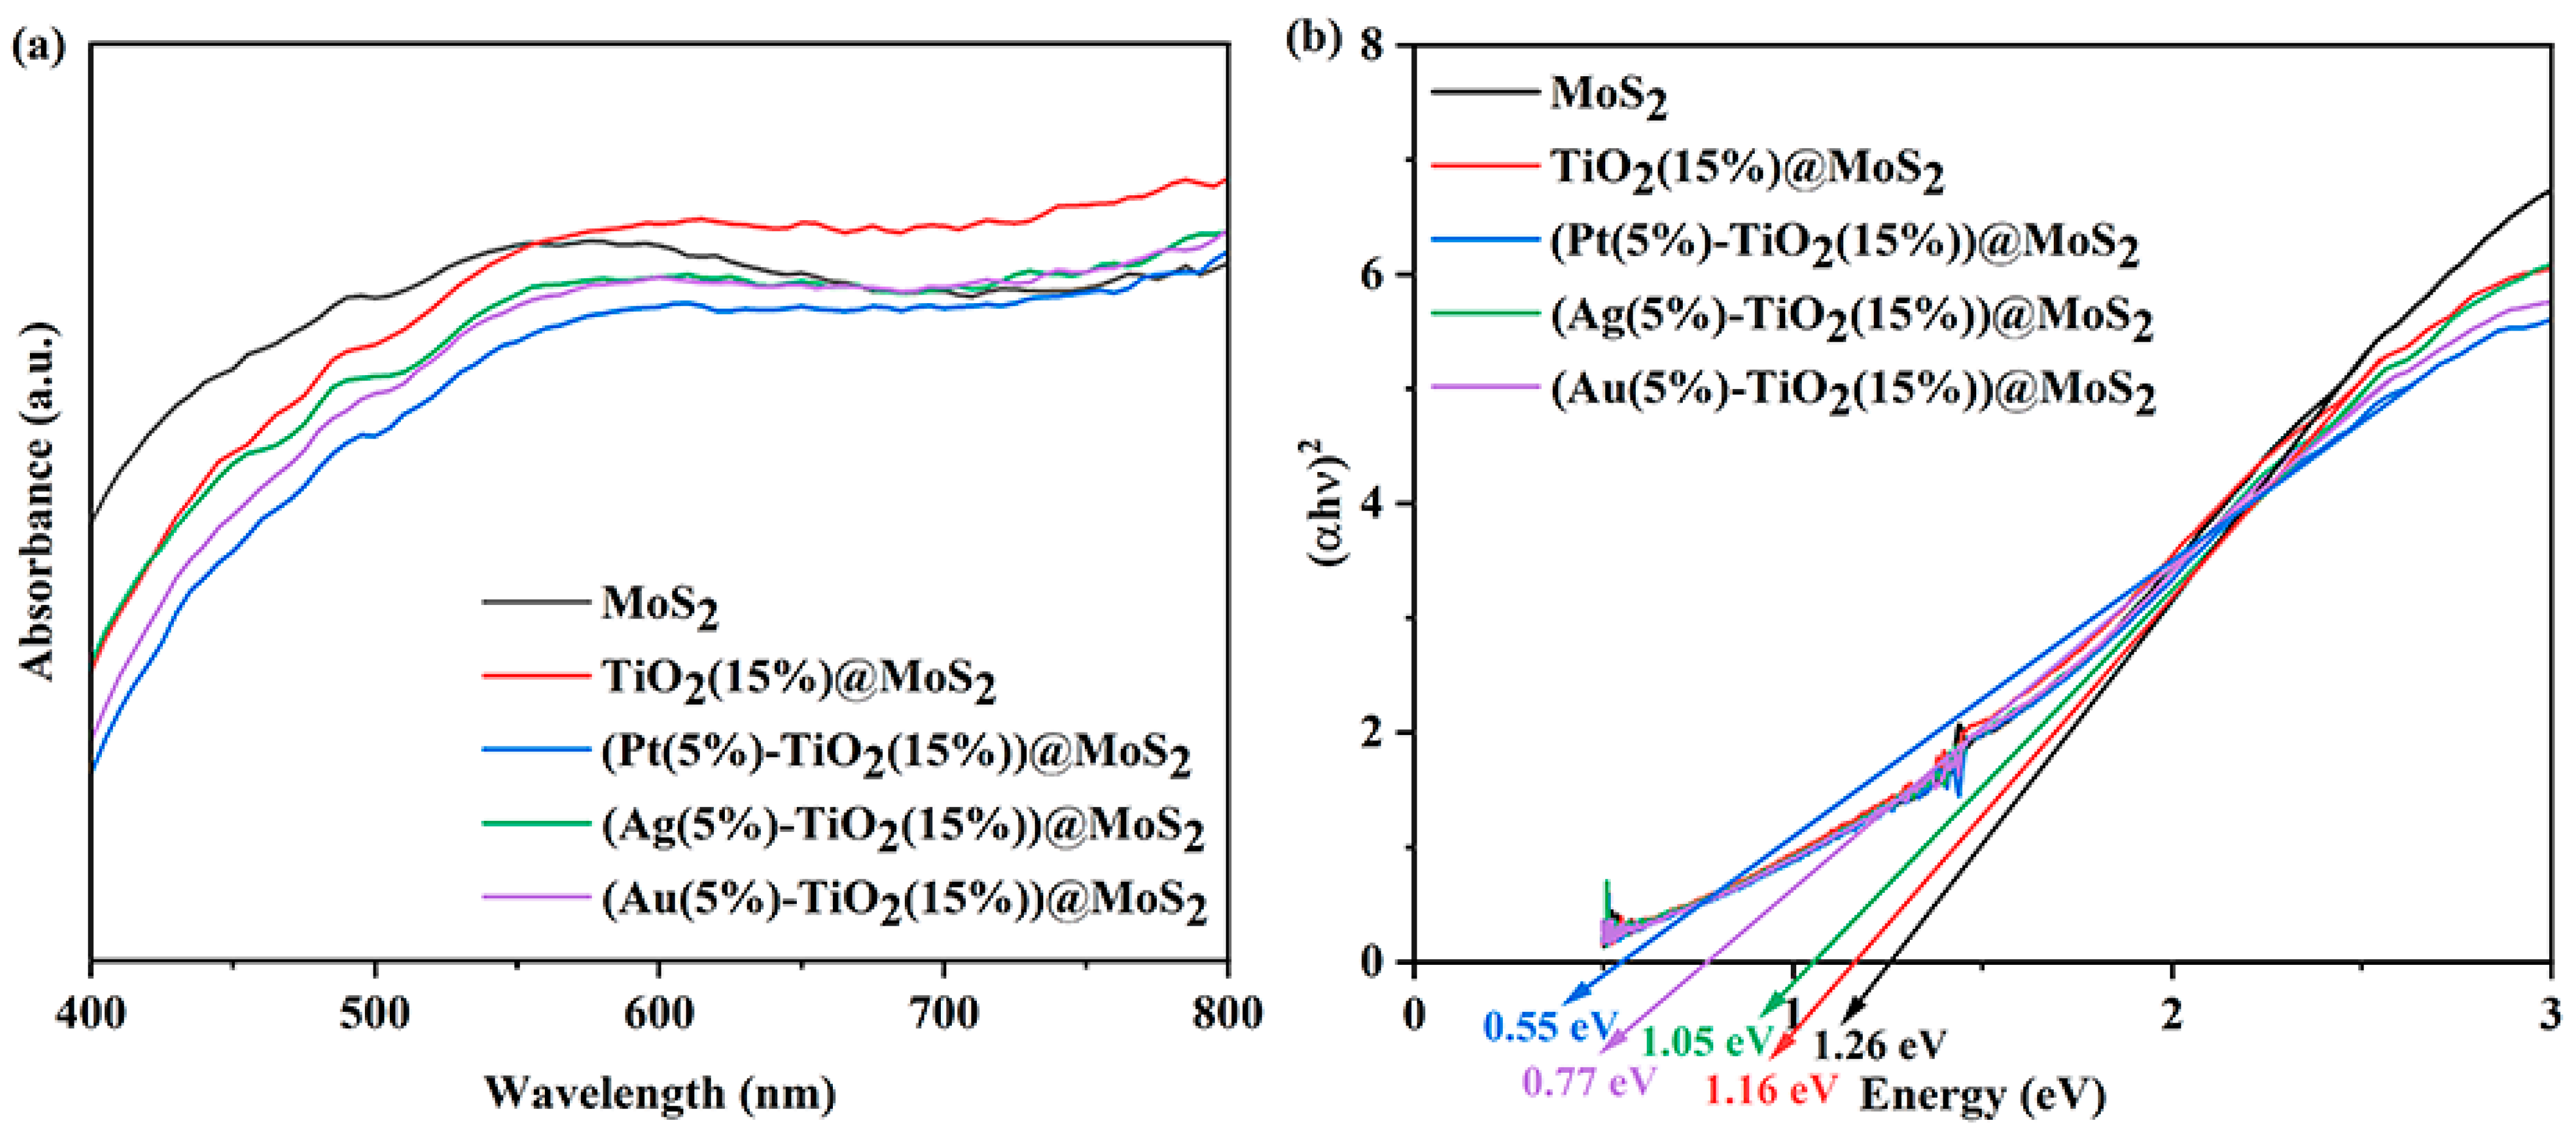
2. Results and Discussion

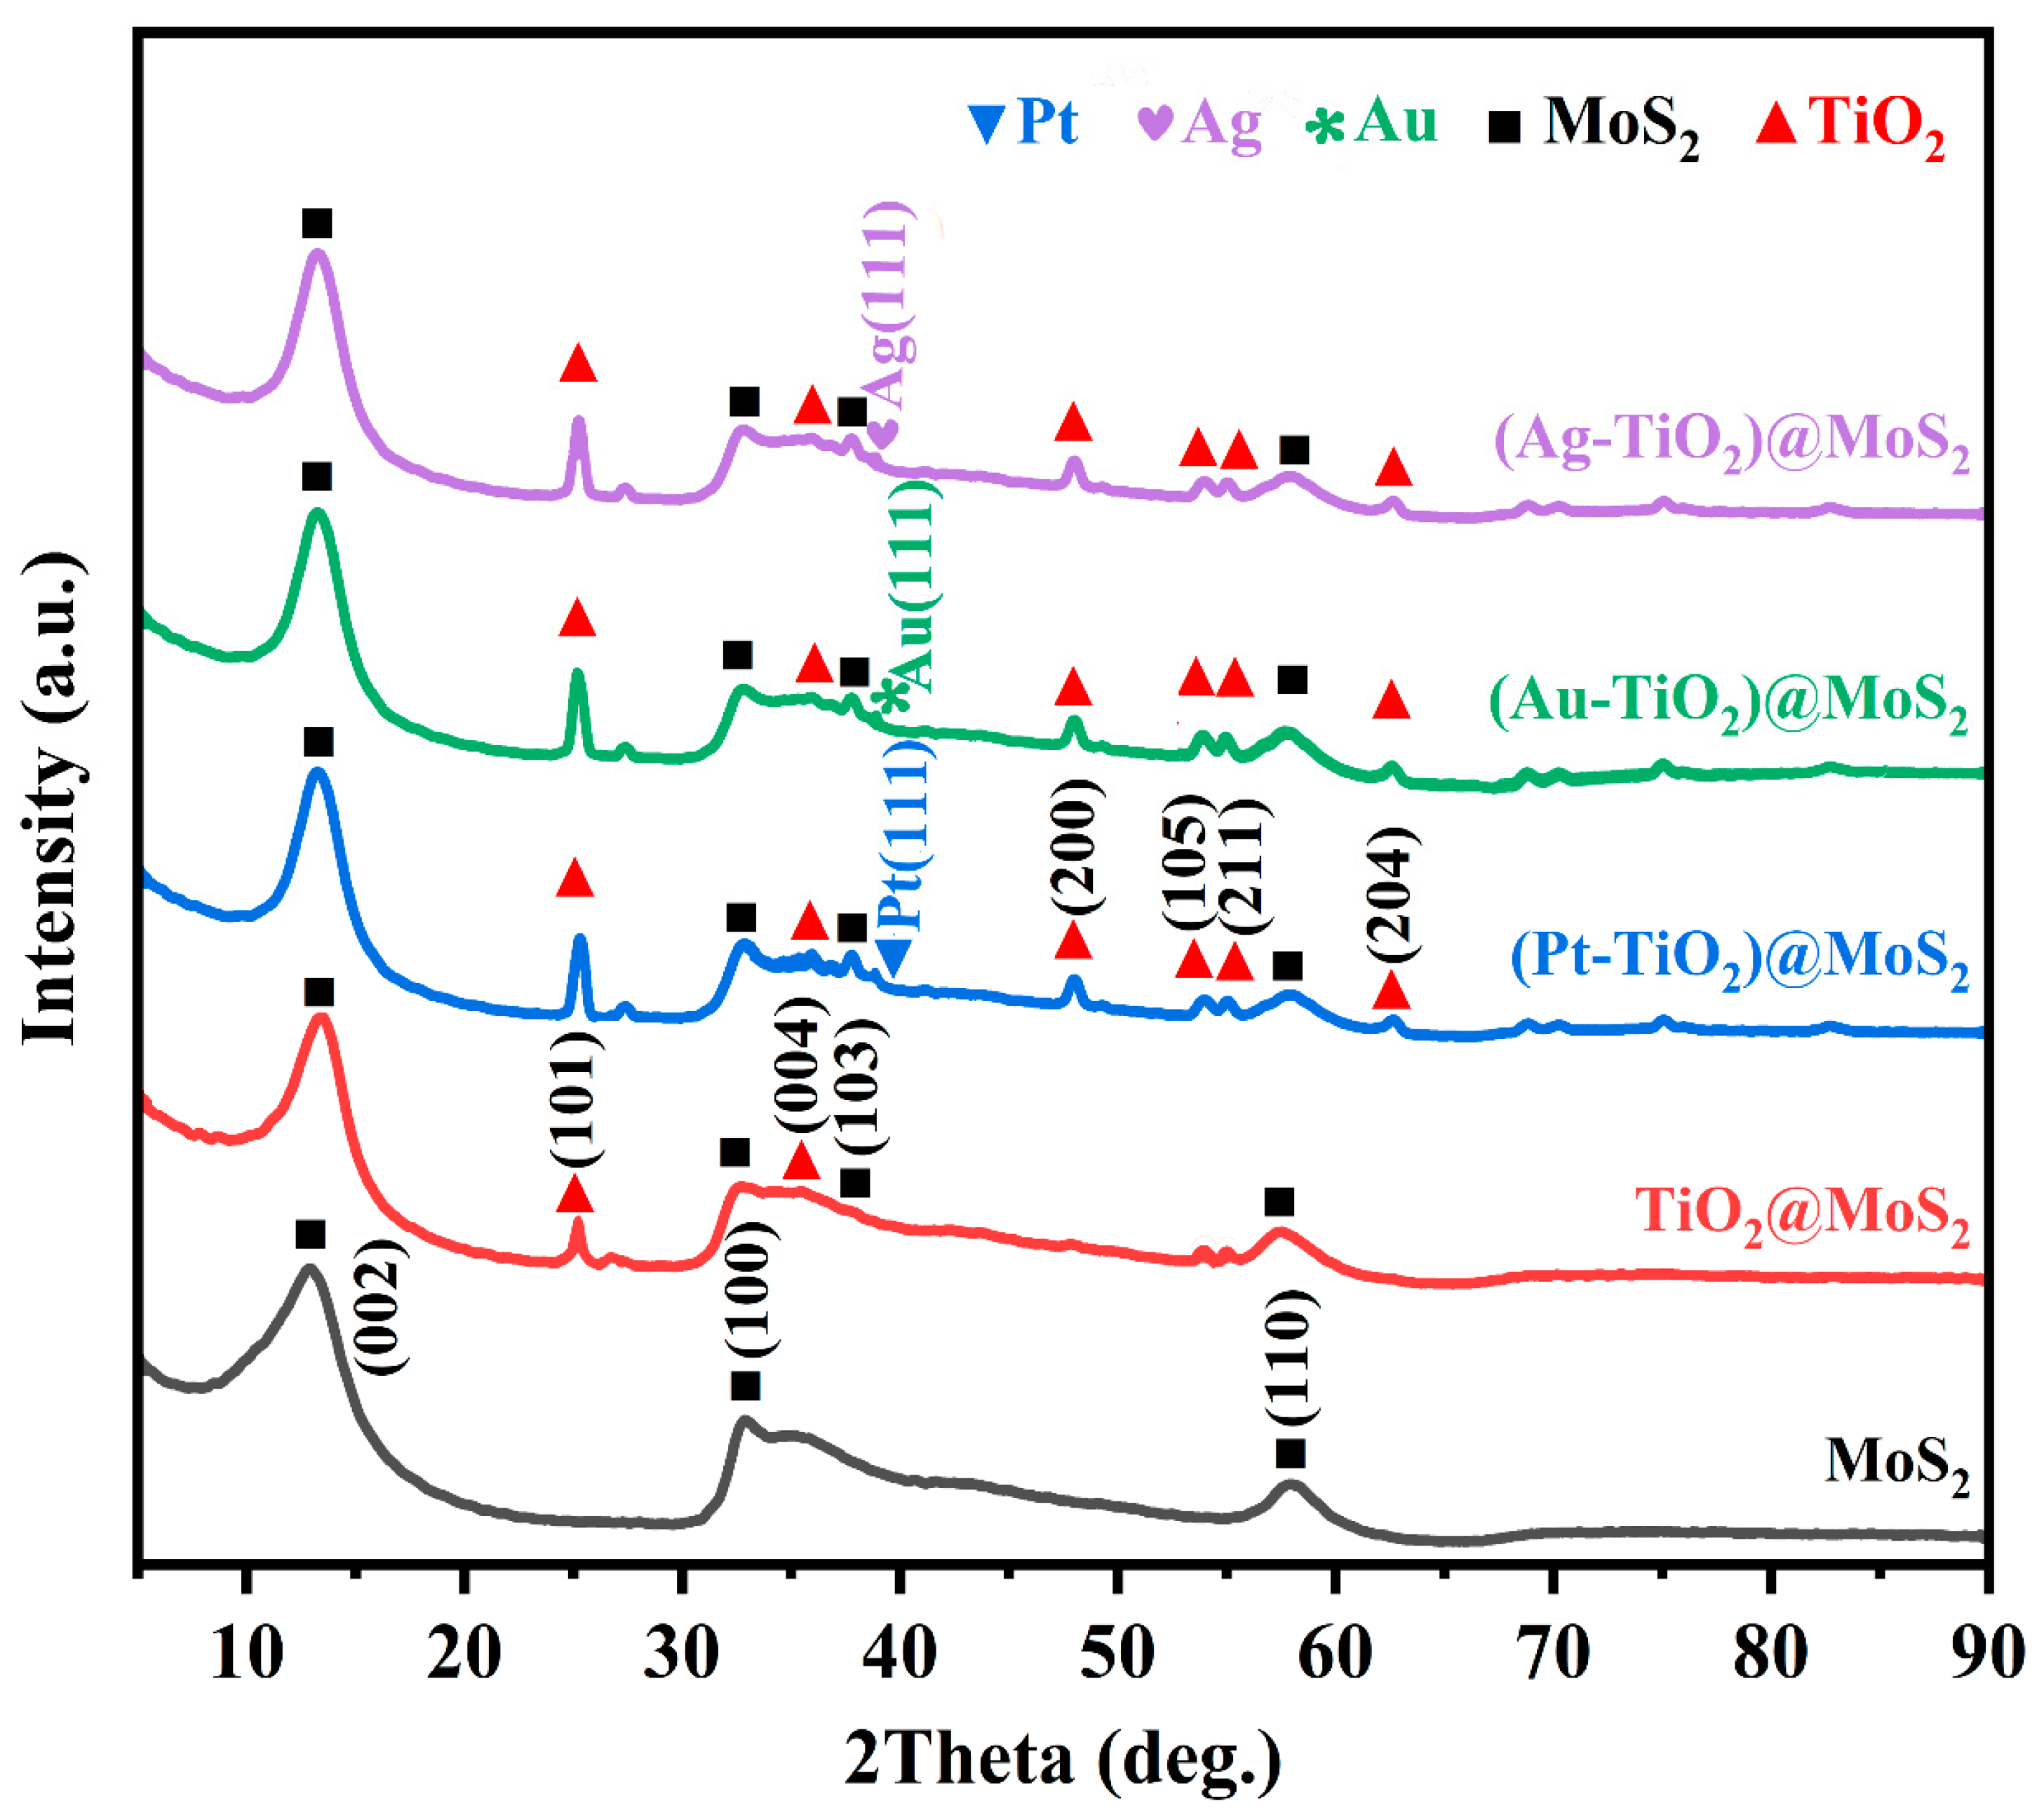
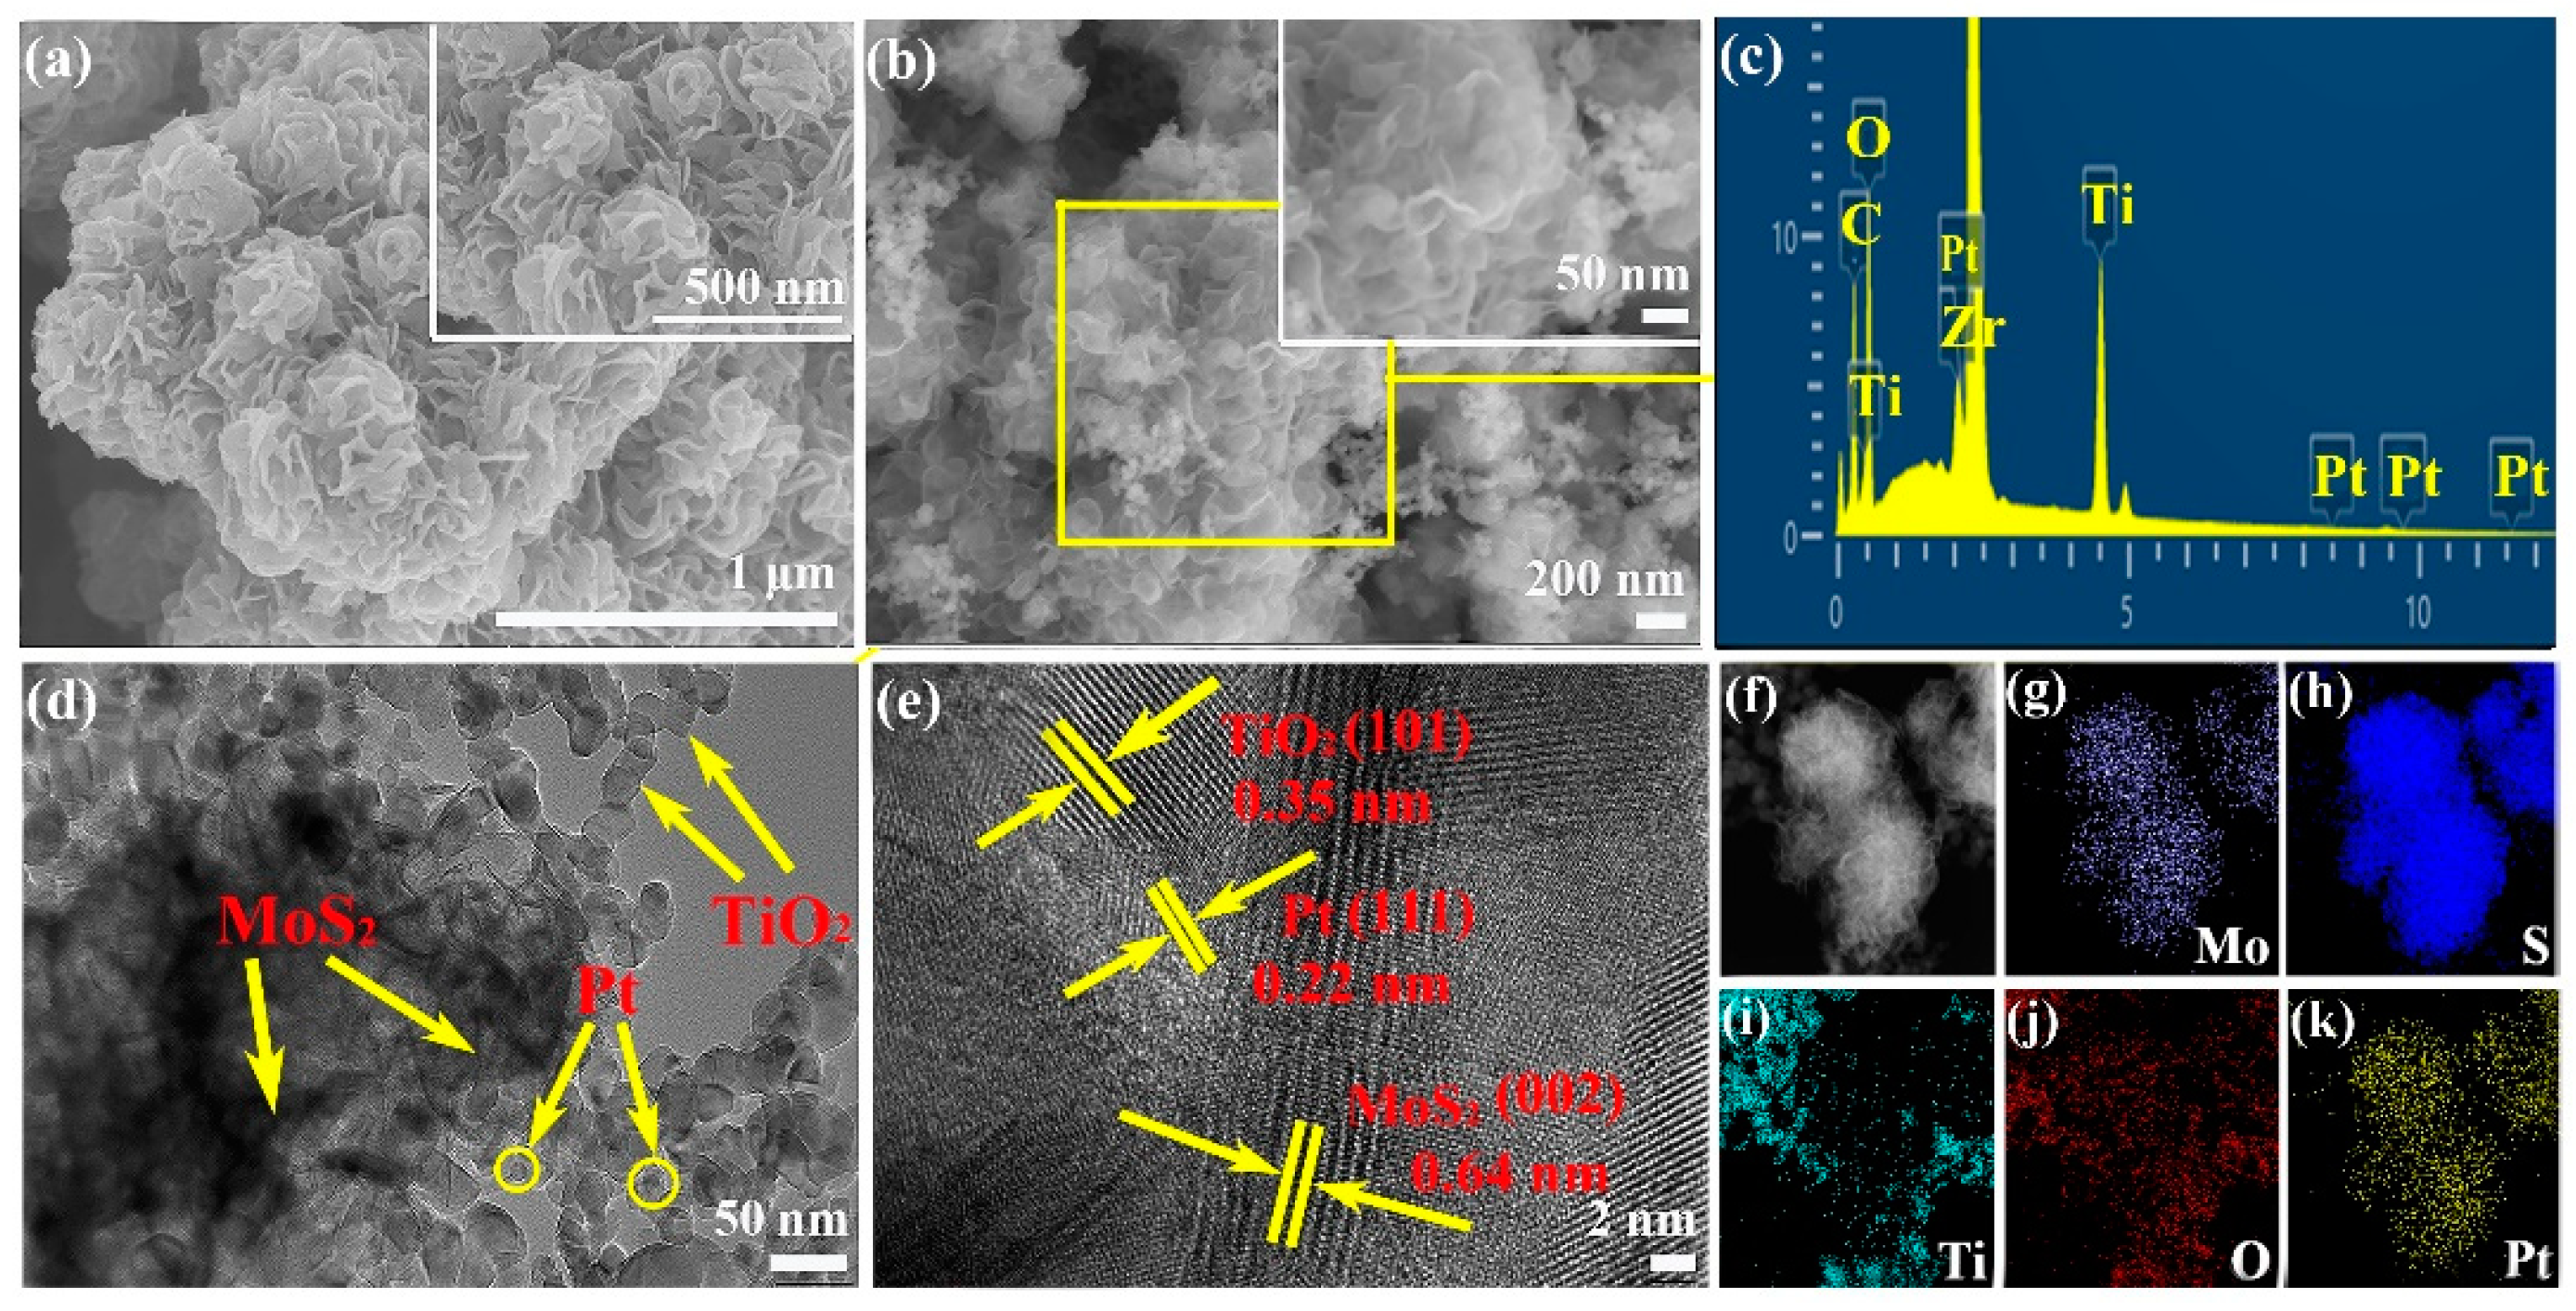
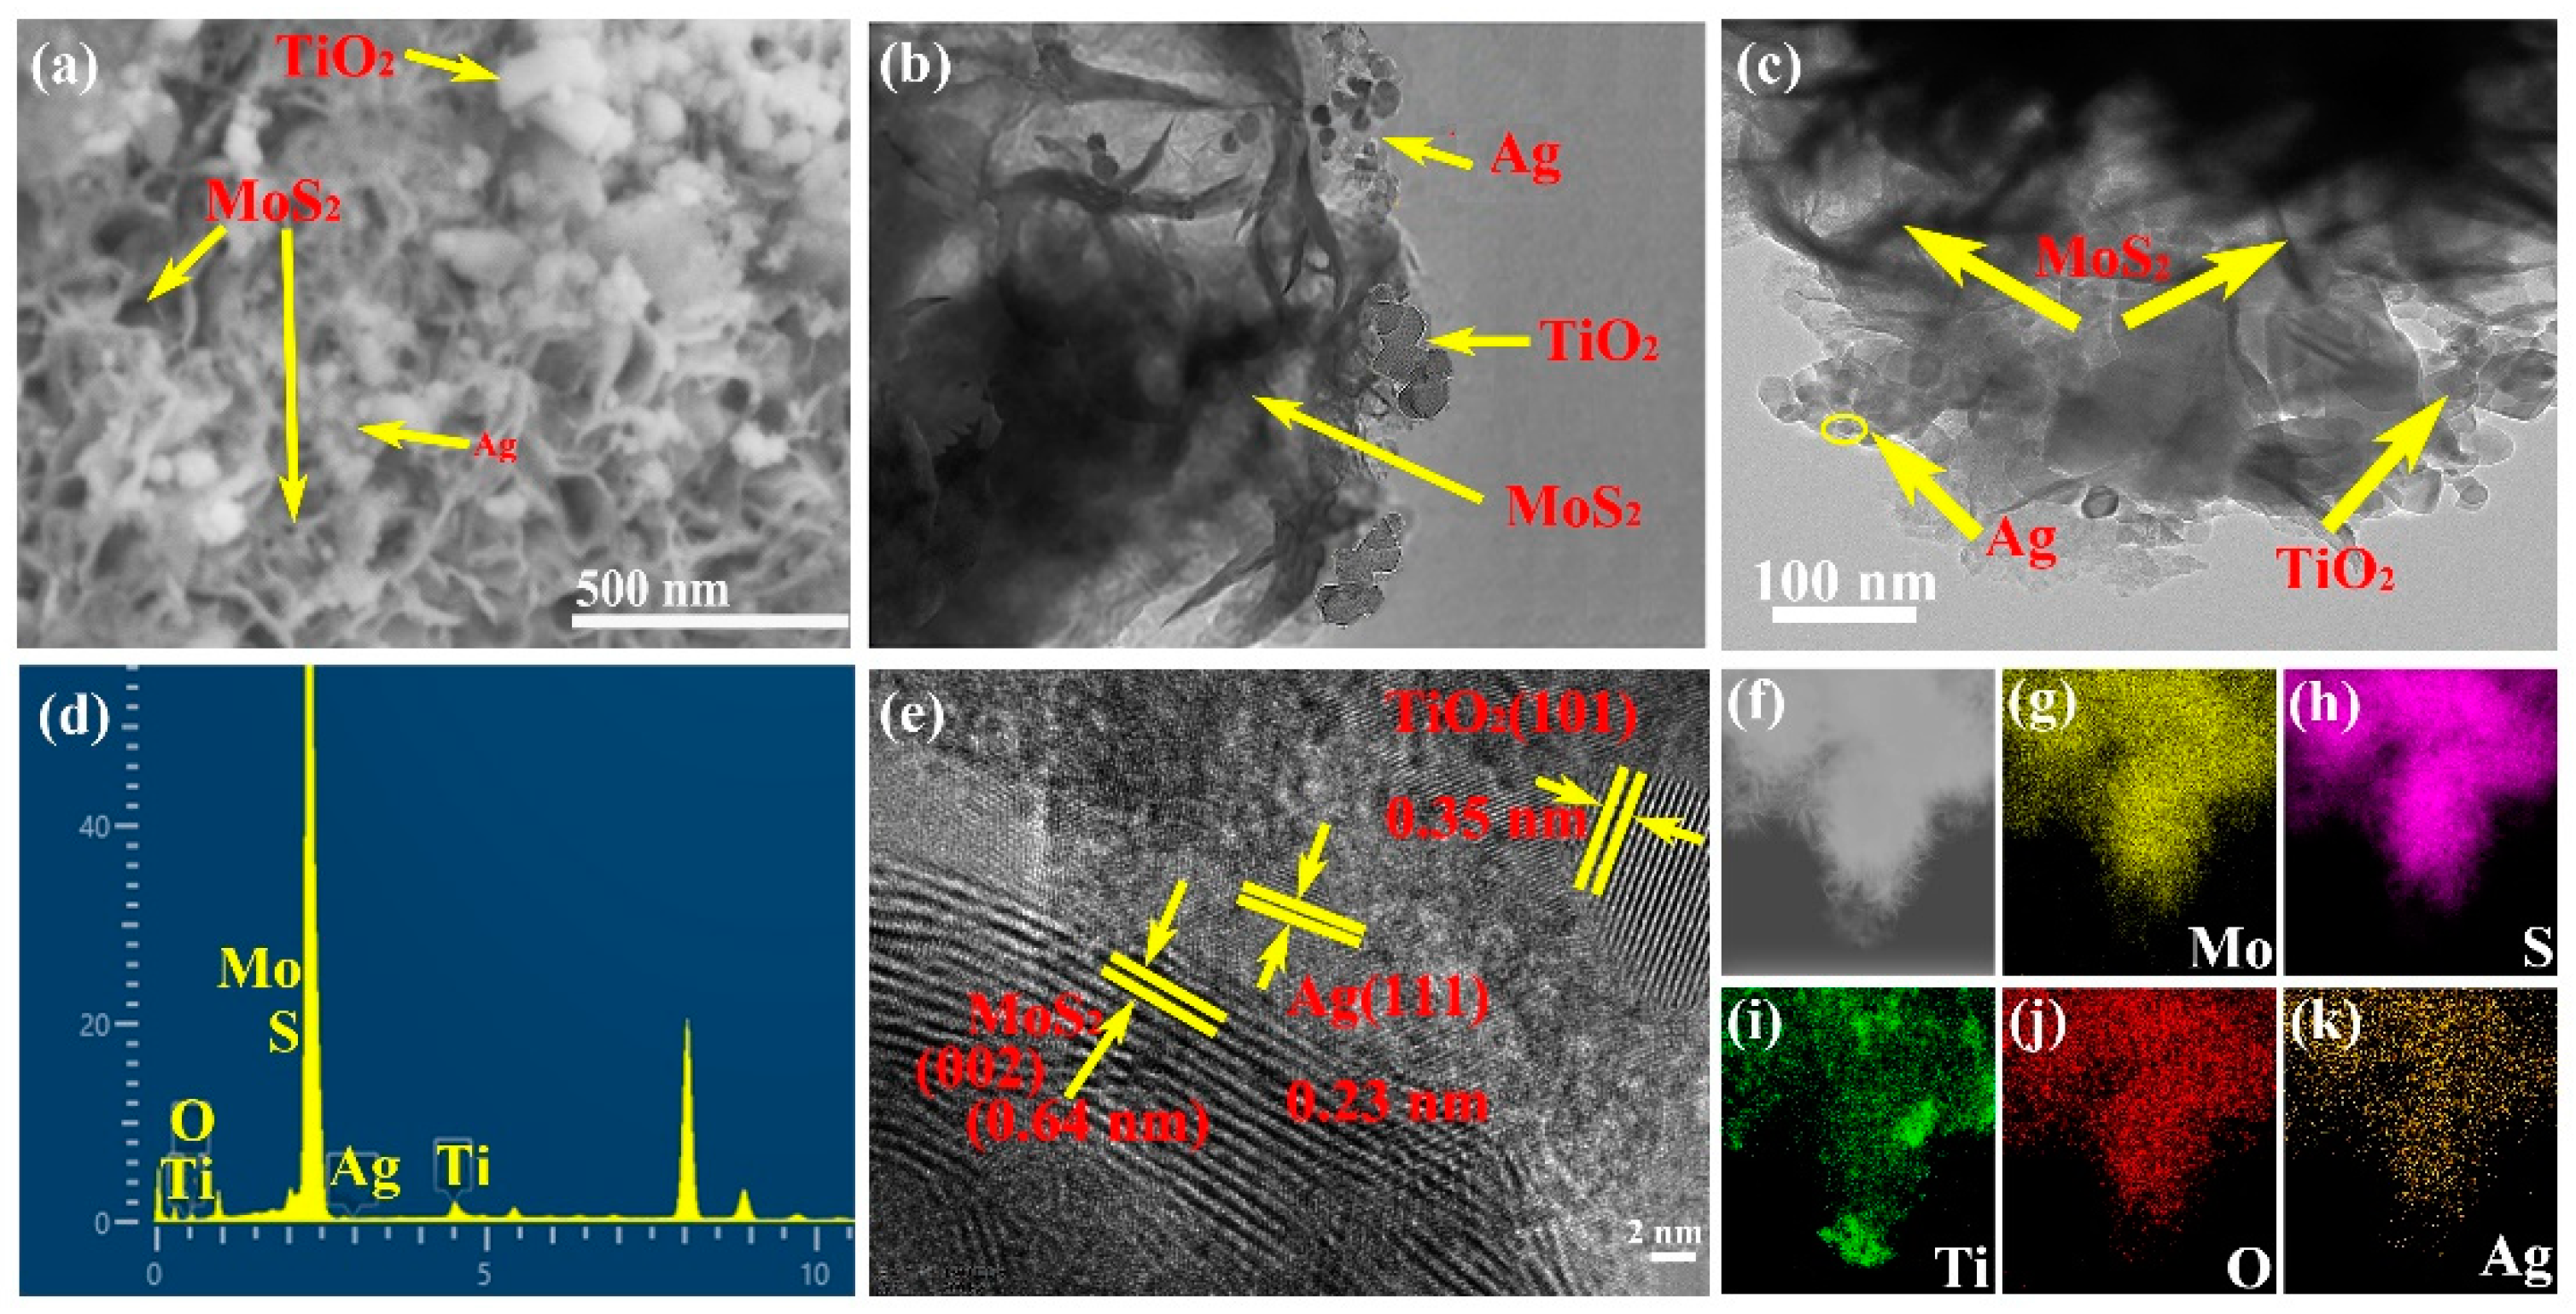
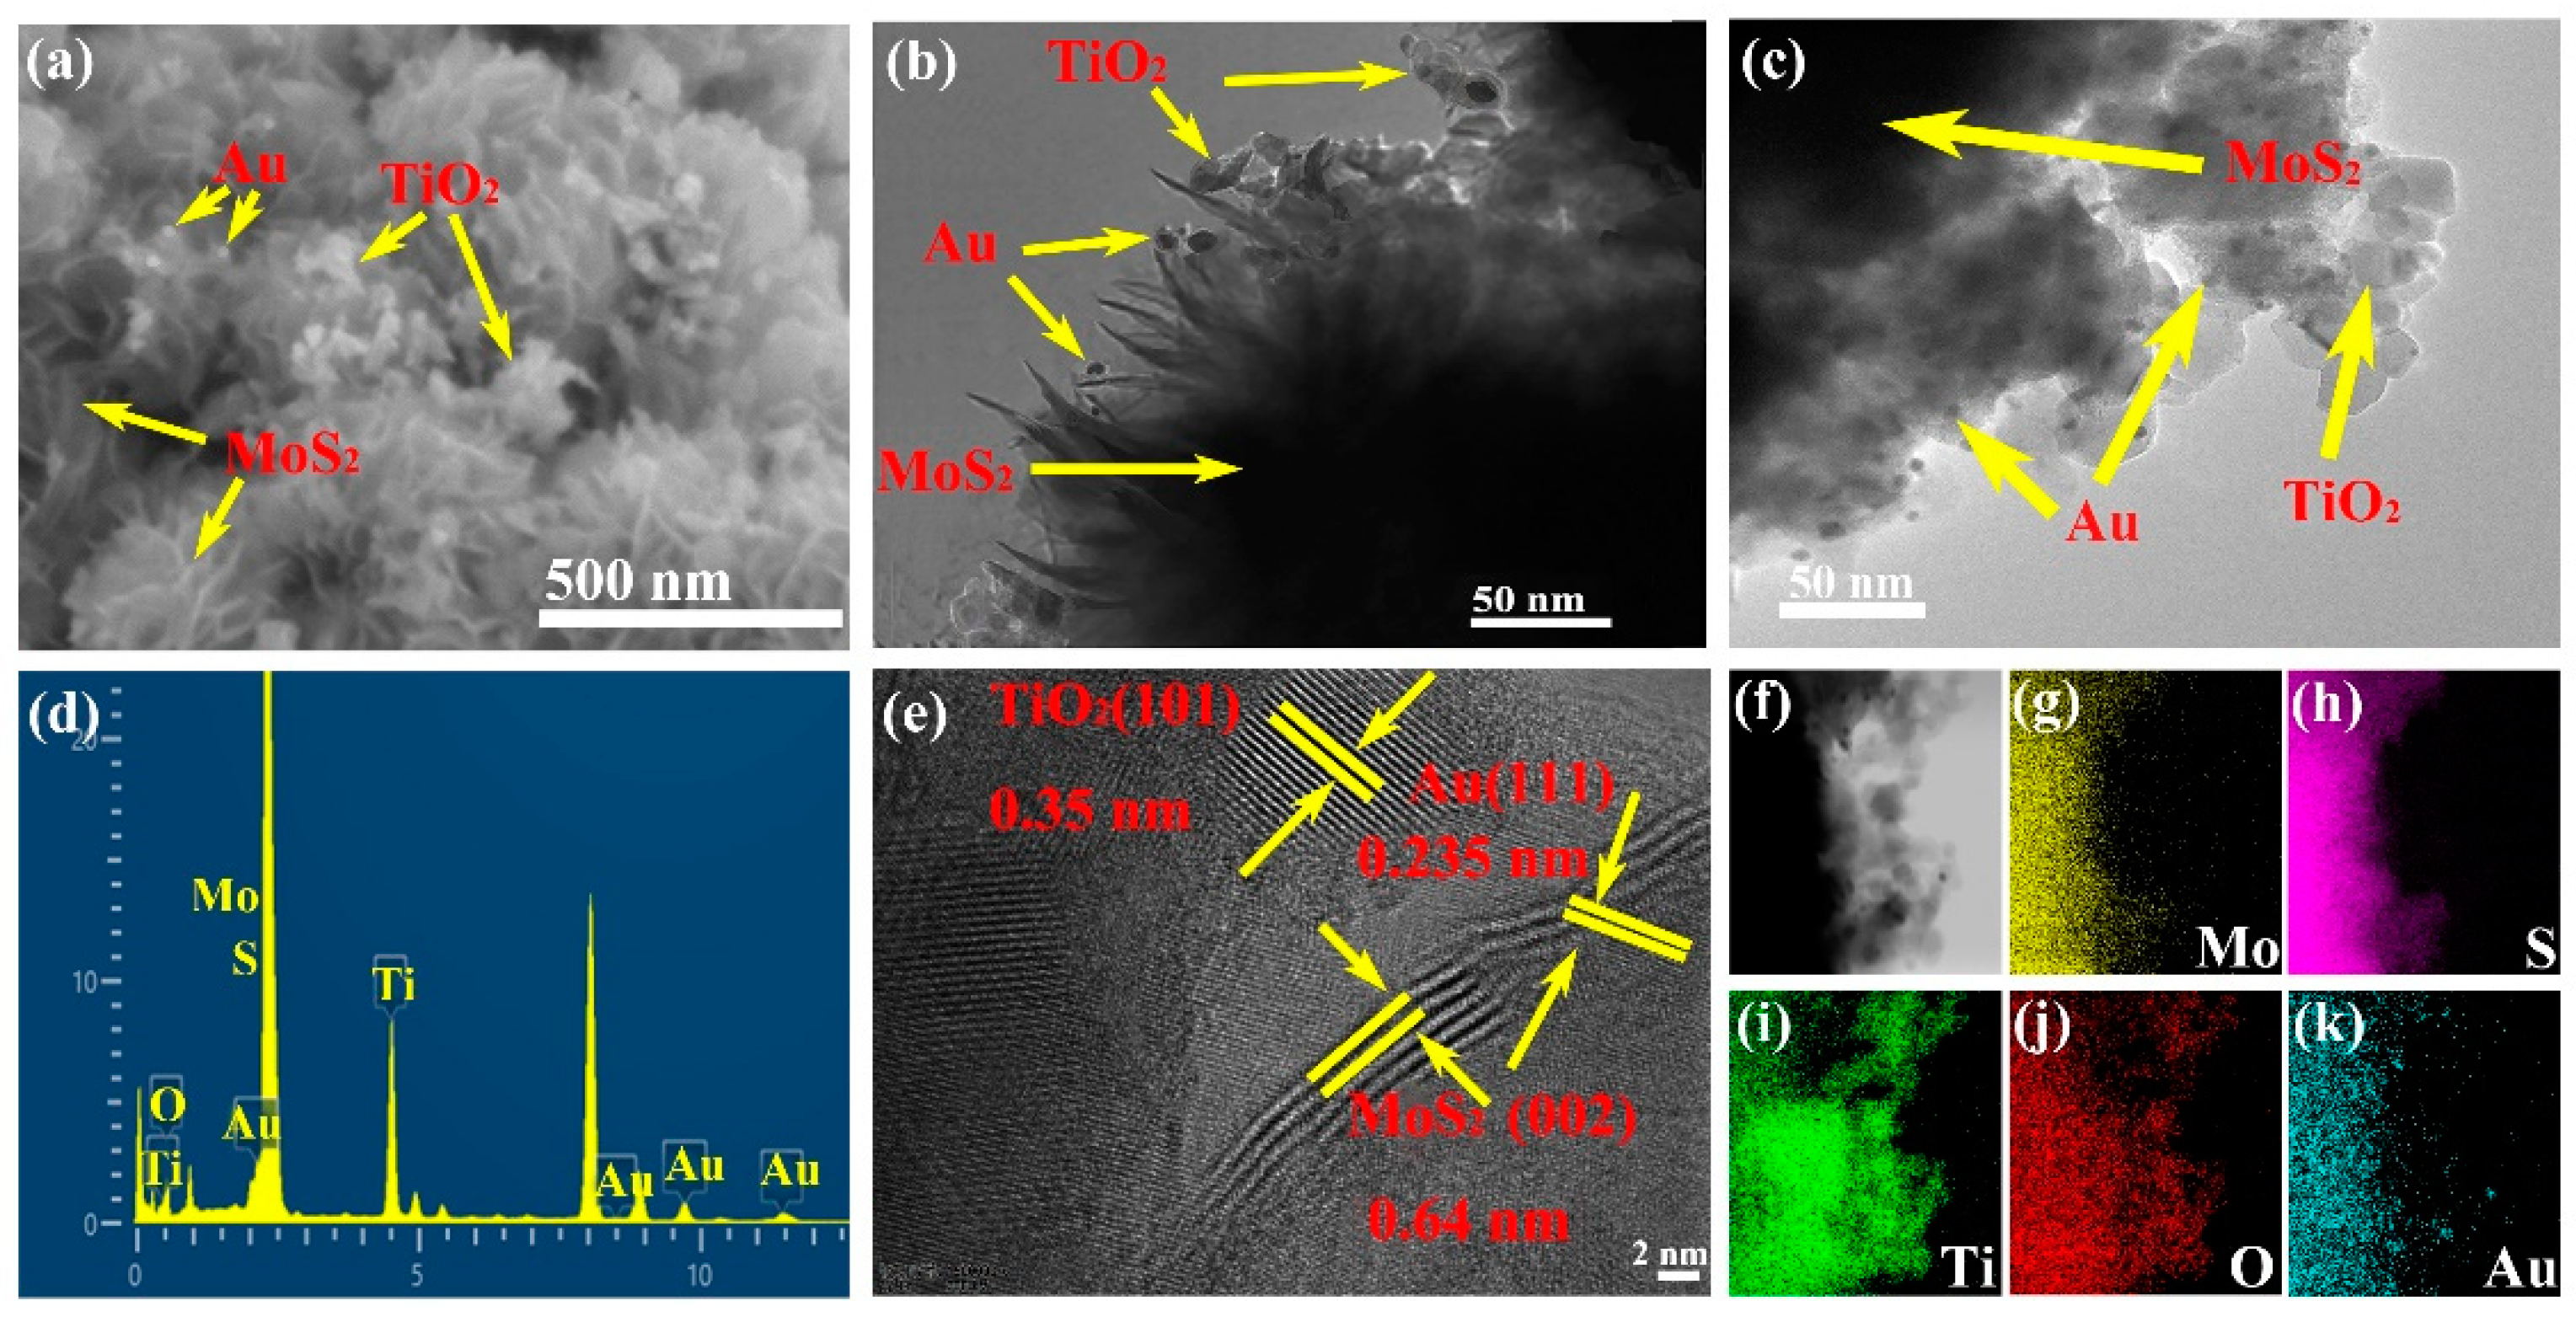
Characterization of the Synthesized Materials

Using X-ray diffractometry, the crystallographic structures of MoS2, TiO2, (Pt-TiO2)@MoS2, (Ag-TiO2)@MoS2, and (Au-TiO2)@MoS2 samples were examined, and the characterization results are shown in Figure 1. MoS2 has crystal planes (002), (100), (103), and (110), and in the diffractogram, it can be seen that (002), (100), (110), and (103) of MoS2 have diffraction peaks at 13.03, 32.86, 37.78, and 58.04, respectively, which are consistent with the standard card (PDF 73-1508) [40]. Likewise, (200), (105), (211), (204), (101), and (004), and planes of TiO2 were observed. The primary diffraction peaks of TiO2 at 25.25, 35.99, 48.02, 53.94, 55.07, and 62.66 are indexed to the (200), (105), (211), (204), (101), and (004) planes of TiO2, respectively [41]. They were in agreement with the TiO2 anatase phase (PDF 99-0008). The presence of Pt, Ag, and Au, which are represented by a modest intensity peak at ca. 38° [42], corresponded to Pt(111), Ag(111), and Au (111), respectively. The XRD patterns of (Pt-TiO2)@MoS2, (Ag-TiO2)@MoS2, and (Au-TiO2)@MoS2 samples proved the obvious peaks corresponding to the existence of MoS2, TiO2, and Pt, Ag, and Au, which showed that (Pt-TiO2)@MoS2, (Ag-TiO2)@MoS2, and (Au-TiO2)@MoS2 nanocomposites were successfully prepared.
SEM and TEM were used to study the morphology of diverse samples.
Figure 2b,d shows that (Pt (5 wt%)-TiO2(15 wt%))@MoS2 is composed of dense sheets of MoS2, P25 NPs, and Pt NPs, with disordered dispersion and no obvious change in morphology compared with pure MoS2 (Figure 2a). Specifically, P25 NPs and Pt NPs are evenly distributed on the surface of MoS2. A proportion of the P25 and Pt are completely encased in nanosheets, and the surface heterojunctions of MoS2, P25, and Pt are achieved. This structure is conducive to photogenerated electron transfer among MoS2, P25, and Pt, and it is convenient to separate the charge during the photocatalytic process.
As shown in Figure 2e, the HRTEM image of (Pt (5 wt%)-TiO2(15 wt%))@MoS2 indicates that the lattice fringes with d-spacing of 0.64, 0.35, and 0.22 nm correspond to the (002) lattice plane of MoS2, (101) lattice plane of TiO2 [43], and (111) lattice plane of Pt, respectively. Moreover, due to the beneficial contact between MoS2, TiO2, and Pt, photoinduced electrons on MoS2 can be transferred quickly to Pt NPs via the TiO2 nanocrystal bridge, so that the charge transfer distance is reduced and the electrons and holes are separated, which can increase the photocatalysis efficiency [36]. In addition, the element mapping images in Figure 2f–k prove the even dispersion and coexistence of Mo, S, Ti, O, and Pt.
As shown in Figure 3e, HRTEM images of (Ag (5 wt%)-TiO2(15 wt%))@MoS2 indicate that the lattice fringes with d-spacing of 0.64, 0.35, and 0.23 nm correspond to the (002) lattice plane of MoS2, (101) lattice plane of TiO2 [43], and (111) lattice plane of Ag, respectively. Figure 3a shows the SEM image of (Ag (5 wt%)-TiO2(15 wt%))@MoS2, which shows a good dispersion. In addition, the element mapping images in Figure 3f–k prove the uniform distribution and coexistence of Mo, S, Ti, O, and Ag.
In Figure 4e, HRTEM images of (Au (5 wt%)-TiO2(15 wt%))@MoS2 indicate that the lattice fringes with d-spacing of 0.64, 0.35, and 0.235 nm correspond to the (002) lattice plane of MoS2, (101) lattice plane of TiO2 [43], and (111) lattice plane of Au, respectively. Figure 4a shows the SEM image of (Au (5 wt%)-TiO2(15 wt%))@MoS2, which shows a good dispersion. In addition, the element mapping images in Figure 4f–k prove the uniform distribution and coexistence of Mo, S, Ti, O, and Au.
XPS measurement was used to analyze the valence and surface composition of the (Pt (5 wt%)-TiO2 (15 wt%))@MoS2 photocatalyst. The elements of O, Ti, Mo, S, and Pt were discovered in the survey spectra (see Figure 5a). TiO2 peaks were seen at about 464.5 eV (Ti 2p1/2), 458.7 eV (Ti 2p3/2) (Figure 5a) and 529.88 eV, and 531.4 eV (O 1s) (see Figure 5b). As the flawed state, Ti3+ can curb photogenerated electron–hole pair recombination and speed up separation of charge [36]. Figure 5c shows the peaks at binging energies of 231.5 eV and 228.4 eV that can be ascribed to Mo 3d3/2 and Mo 3d5/2 of Mo4+, respectively. As can be seen from Figure 5d, S 2p1/2 and S 2p3/2 spectra of MoS2 have two peaks at 162.8 eV and 161.58 eV [44,45]. The major peaks in Figure 5f, which correspond to core electrons of Pt 4f7/2 and Pt 4f5/2 with binding energies of 71.7 and 74.9 eV (difference VE 3.2 eV), respectively [46], indicate that the formed Pt is in a metallic state. Therefore, TiO2 and Pt were successfully incorporated into MoS2, as further demonstrated by the XPS spectra.
In order to understand the capture, migration, and separation of carriers in the samples, photoluminescence (PL) spectra of all samples were measured at room temperature at the simulation wavelength of 328 nm, and the outcomes are depicted in Figure 6. As seen in Figure 6, PL spectral line peaks of the five samples were similar, but with different intensities. In the PL line, the excitation peak at 400 nm can be ascribed to band emission from free exciton recombination. The photoluminescence spectra can reveal the recombination efficiency between photoelectrons and holes to a certain extent, because the secondary recombination between them will be accompanied by fluorescence emission. The stronger the fluorescence intensity that is produced, the more recombination between the electrons and holes that are produced and the shorter the carrier lifetime and vice versa. As can be seen from Figure 6, pure MoS2 had a strong fluorescence emission, while the fluorescence intensities of TiO2(15 wt%)@MoS2, (Pt(5 wt%)-TiO2(15 wt%))@MoS2, (Ag(5 wt%)-TiO2(15 wt%))@MoS2, and (Au (5 wt%)-TiO2(15 wt%)))@MoS2 were significantly reduced. The results indicated that when TiO2, Pt, Ag, and Au NPs are supported on the surface of MoS2, the separation rate of the photoelectron–hole pairs of MoS2 is significantly improved, which is obviously beneficial to improving the photocatalytic performance. However, compared with the luminescence intensity of TiO2(15 wt%)@MoS2, (Pt(5 wt%)-TiO2(15 wt%))@MoS2 had stronger luminescence intensity, which may have been due to the stronger excitonic PL signal and the higher surface oxygen vacancy and defect concentration. Furthermore, during photocatalytic activity, oxygen vacancies and defects can act as centers to capture photoinduced electrons, therefore inhibiting photoinduced electrons and holes from recombining. Additionally, oxygen vacancies can facilitate oxygen adsorption, resulting in a strong interaction between photoinduced electrons bound by oxygen vacancies and adsorbed oxygen. This suggests that the binding of photoinduced electrons of oxygen vacancies can result in the capture of photoinduced electrons of adsorbed oxygen and oxygen radical groups at the same time. As a result, oxygen vacancies and defects are in favor of photocatalytic processes, because oxygen is active in promoting the oxidation of organic substances [47].
The FT-IR of MoS2, TiO2(15 wt%))@MoS2, (Pt(5 wt%)-TiO2(15 wt%))@MoS2, (Ag(5 wt%)-TiO2(15 wt%))@MoS2, and (Au(5 wt%)-TiO2(15 wt%))@MoS2 are shown in Figure 7. Compared to pure MoS2, the chemical skeleton of the other samples was similar to TiO2(15 wt%))@MoS2. In addition, the peak strengths of TiO2(15 wt%))@MoS2, (Pt(5 wt%)-TiO2(15 wt%))@MoS2, (Ag(5 wt%)-TiO2(15 wt%))@MoS2, and (Au(5 wt%)-TiO2(15 wt%))@MoS2 nanocomposites were significantly enhanced compared with MoS2, indicating that Ti-O was successfully doped into MoS2, which was consistent with the results of XPS. In the infrared spectrum, the absorption peak was wide and gentle at the wavelength of 3000–3500 cm−1, which corresponded to the stretching vibration peak of the H2O molecule adsorped on the surface of the nanoparticles. The absorption peak at 1700–1200 cm−1 represented the stretching vibration absorption of C=S and C-H. The wide absorption band of 500–900 cm−1 was caused by the bending vibration of Ti−O−Ti bonds in TiO2 NPs [48]. The results of FT-IR showed that (M (M=Pt, Ag, Au)-TiO2)@MoS2 had no other chemical structure.
Figure 8a displays the UV–Vis DRS spectra of MoS2, TiO2(15 wt%))@MoS2, (Pt(5 wt%)-TiO2(15 wt%))@MoS2, (Ag (5 wt%)-TiO2(15 wt%))@MoS2, and (Au (5 wt%)-TiO2(15 wt%))@MoS2. As can be seen from Figure 8, pure MoS2 had strong absorption in both the ultraviolet and visible spectra. In comparison to pure MoS2, when TiO2, Pt, Ag, and Au nanoparticles were loaded, the absorption of TiO2(15 wt%))@MoS2, (Pt(5 wt%)-TiO2(15 wt%))@MoS2, (Ag(5 wt%)-TiO2 (15 wt%))@MoS2, and (Au (5 wt%)-TiO2(15 wt%))@MoS2 became stronger in the visible region and the absorption edge was obviously redshifted, which increased the utilization rate of visible light and indicated that more electron–hole pairs would be generated under the excitation of visible light. This would obviously be beneficial to photocatalysis. Figure 8b shows the MoS2, TiO2(15 wt%))@MoS2, (Pt(5 wt%)-TiO2(15 wt%))@MoS2, (Ag(5 wt%)-TiO2(15 wt%))@MoS2, and (Au(5 wt%)-TiO2(15 wt%))@MoS2 band gap diagram. It can be seen in Figure 8 that the band gap widths of MoS2, TiO2(15 wt%))@MoS2, (Pt(5 wt%)-TiO2(15 wt%))@MoS2, (Ag(5 wt%)-TiO2(15 wt%))@MoS2, and (Au(5 wt%)-TiO2(15 wt%))@MoS2 were 1.26 eV, 1.16 eV, 0.55 eV, 1.05 eV, and 0.77 eV, respectively. Compared with MoS2, TiO2(15 wt%))@MoS2, (Ag(5 wt%)-TiO2(15 wt%))@MoS2, and (Au(5 wt%)-TiO2(15 wt%))@MoS2, the (Pt(5 wt%)-TiO2(15 wt%))@MoS2 had the smallest band gap, which clearly demonstrated the activity of (Pt(5 wt%)-TiO2(15 wt%))@MoS2 under visible light irradiation. This corresponded to the catalytic results of five samples in the photocatalytic degradation of Rh B, which are described later.
The result is shown in Figure 9. Under chopped light illumination, the corresponding responses (I-t) cycles were recorded at 0.6 V vs. Ag/AgCl. The photocurrent density also increased with the increase of Pt-content loading on the TiO2@MoS2 surface, demonstrating that the presence of more active points (Pt-TiO2 heterojunctions) is conducive to reducing the recombination rate of photogenerated electron–hole pairs and promoting the transfer of photo-generated carriers. Nevertheless, the photocurrent densities of (Pt (2 wt%)-TiO2(15 wt%))@MoS2, (Au (5 wt%)-TiO2(15 wt%))@MoS2, and (Ag (5 wt%)-TiO2(15 wt%))@MoS2 were lower than that of (Pt (5 wt%)-TiO2(15 wt%))@MoS2. The optimum (Pt(5 wt%)-TiO2(15 wt%))@MoS2 nanocomposite had a higher photocurrent intensity than the pure MoS2 sample. For all the electrodes tested, a rapid and even photocurrent response was observed for each opening–closure event, indicating that the test samples were well recycled. The photocurrent is largely dependent on the photo-separation efficiency of the electron–hole pairs at the electrode [49]. At the photocatalyst/electrolyte interface, photogenerated holes were transferred, and photogenerated electrons were simultaneously transferred to the back contact [50]. The higher photocurrent response indicated that (Pt (5 wt%)-TiO2 (15 wt%)@MoS2 was the best option for the separation of charge and transfer to the electrolyte.
The nitrogen adsorption–desorption isotherms of (Pt(5 wt%)-TiO2(15 wt%))@MoS2, (Ag(5 wt%)-TiO2(15 wt%))@MoS2, (Au(5 wt%)-TiO2(15 wt%))@MoS2, TiO2(15 wt%))@MoS2, and MoS2 showed stepwise adsorption behavior, as demonstrated in Figure 10. N2 adsorption–desorption isothermal curves of the five samples were typical type IV adsorption–desorption curves. The specific surface areas of MoS2, TiO2@MoS2 (Pt (5 wt%)-TiO2(15 wt%))@MoS2, (Ag(5 wt%)-TiO2(15 wt%))@MoS2, and (Au(5 wt%)-TiO2(15 wt%))@MoS2 were 12.62, 26.78, 32.85, 32.72, and 23.84 m2/g, respectively. The specific surface area of (Pt(5 wt%)-TiO2(15 wt%))@MoS2 composite material was noticeably higher than those of (Ag(5 wt%)-TiO2(15 wt%))@MoS2, (Au(5 wt%)-TiO2(15 wt%))@MoS2, TiO2(15 wt%))@MoS2, and MoS2, suggesting that the addition of Pt and MoS2 contributed to the dispersion of TiO2 nanoparticles and reduced agglomeration. These results matched the SEM image information, and the specific surface area was improved. The photocatalysis of the nanocomposite was enhanced by increasing the active sites of the reaction.
According to the pore size analysis, the average pore size of (Pt(5 wt%)-TiO2(15 wt%))@MoS2 was 12.61 nm (see Table 1), which was smaller than (Au(5 wt%)-TiO2(15 wt%))@MoS2 (20.05 nm), TiO2(15 wt%))@MoS2 (21.78 nm), and MoS2 (19.39 nm) and bigger than (Ag(5 wt%)-TiO2(15 wt%))@MoS2 (10.83 nm). The (Pt(5 wt%)-TiO2(15 wt%))@MoS2 nanocomposites were formed by the coupling of nano-TiO2 and Pt NPs on the surface of MoS2, which may have resulted in adhesion and aggregation of TiO2 NPs and produced more mesopores or macropores, resulting in an increase in the average pore size of the (Pt(5 wt%)-TiO2(15 wt%))@MoS2 composites.
The degradation of Rh B was photo-catalyzed by a series of MoS2, TiO2@MoS2, and (M(M=Pt, Ag and Au)-TiO2)@MoS2 in the presence of simulated solar light. The photocatalytic degradation rate and kinetics of Pt (5 wt%)-TiO2 (15 wt%)@MoS2 photocatalyst were compared to those of Ag (5 wt%)-TiO2 (15 wt%)@MoS2, Au (5 wt%)-TiO2 (15 wt%)@MoS2, TiO2@MoS2, P25, and pure MoS2 in Figure 11. Figure 11a shows that the TiO2(15 wt%)@MoS2 composite performed best of the eight samples, and Figure 11c shows that the Pt (5 wt%)-TiO2(15 wt%)@MoS2 composite performed best of the eight samples. The results of the UV visible absorption spectra test showed that Pt (5 wt%) and TiO2 (15 wt%) co-modified MoS2 ternary heterojunction nanocomposites exhibited the highest photocatalytic activity, with the maximum value of 99.0% compared to 93% with TiO2@MoS2, 96.5% with (Ag-TiO2)@MoS2, and 97.8% with (Au-TiO2)@MoS2 within 9 min. Others exhibited varying degrees of C/C0 fluctuation for Rh B degradation. The following conclusions can be drawn from this result: Rh B was absorbed onto the surface of (Pt-TiO2)@MoS2 nanocomposite materials, and with an increase in the loading amount of Pt-TiO2, the degradation rate was higher, providing more active sites for the degradation of Rh B [51]. P25, with its mixture of anatase and rutile phases, has been commonly applied as a reference photocatalyst for evaluating photocatalysis activity. From Figure 11b,d, (Pt (5 wt%)-TiO2(15 wt%))@MoS2 possessed the highest kapp (0.50470 min−1) for Rh B as compared to (Ag(5 wt%)-TiO2(15 wt%))@MoS2 (0.32706 min−1), (Au(5 wt%)-TiO2(15 wt%))@MoS2 (0.35668 min−1), TiO2(15 wt%)@MoS2 (0.29247 min−1), P25 (0.27312 min−1), and MoS2 (0.20109 min−1), which showed that the photocatalytic activity of (Pt (5 wt%)-TiO2(15 wt%))@MoS2 exceeded that of (Ag (5 wt%)-TiO2(15 wt%))@MoS2, (Au (5 wt%)-TiO2(15 wt%))@MoS2, TiO2(15 wt%)@MoS2, P25, and pure MoS2 for the degradation of Rh B. Moreover, degradation of Rh B by pure MoS2 was low, and the reaction rate constant was very low. This showed that the degradation of Rh B is mainly caused by the adsorption of MoS2. Following Pt deposition, the above graph indicates that the particles absorbed more visible light [52], which is a typical optical characteristic of Pt-TiO2 [53,54]. In conclusion, it is suggested that the ternary structure may have synergistic effects and reduce the rate of recombination and/or enhance the activation of visible light [36,37,38,39]. To study the optical absorption characteristics of photocatalysts, the UV–visible absorption spectra of MoS2, TiO2@MoS2, (Pt-TiO2)@MoS2, (Ag-TiO2)@MoS2, and (Au-TiO2)@MoS2 with various mass ratios were examined (Figure 11b). Pure MoS2 had absorption bands clearly showing the edges at 680 nm, whereas MoS2 did not generate charges when activated by UV light [55]. Due to the visible light response of MoS2, the absorption characteristics of (Pt-TiO2)@MoS2 nanocomposites redshifted progressively as the MoS2 content increased [56]. According to the findings, the existence of MoS2 in the visible light area effectively extended the TiO2 nanoparticles’ visible light absorption [57,58].
The photocatalysis mechanism of (Pt-TiO2)@ MoS2 (Figure 12) was considered. Generally, MoS2 has a lower conduction band (CB) and Fermi level than P25 [37]. When MoS2 contacts P25 in (Pt-TiO2)@MoS2 nanocomposites, the upward shifting of the Fermi level of MoS2 and the downward shifting of the Fermi level of P25 will result in an equilibrium state [37]. Consequently, MoS2 has a higher CB than P25. The following is a potential mechanism for the separation and transfer of charge in (Pt-TiO2)@MoS2: when the system is illuminated, electrons are rapidly simulated from the valence band (VB) of MoS2 to the charge band (CB), leaving holes in the VB. Because P25 has a lower CB than MoS2, it is possible to quickly transfer the excited electrons to P25. After being transported to the catalyst’s surface, the electrons are captured by the oxygen molecules in the aqueous solution to form active free radicals, such as superoxide radical anions (∙O2−) and hydroxyl radicals (∙OH), which eliminate organic contaminants. At the same time, the remaining holes in the VB can oxidize water to form ∙OH, which reacts with organic species [59]. As illustrated in Figure 12, photogenerated electrons and holes separately accumulate in the CB of MoS2 and the VB of TiO2. The EBCB (BCB: bottom of the conduction band) of MoS2 has a more negative redox potential than O2/∙O2−. Photogenerated electrons in the CB of MoS2 can decrease the absorbed O2 into ∙O2−. In addition, the ETVB of TiO2 (TVB: the top of the valence band) has a more positive oxidation potential than OH/∙OH. This indicates that the formation of ·OH in the VB of TiO2 is easy. Nevertheless, visible light is the primary energy of the available photons when simulating solar radiation, which implies that only a small number of photons can be used efficiently. Hence, TiO2 produces few ∙OH, which is consistent with experiments. In brief, the photogenerated electrons on TiO2 migrate quickly and collect on MoS2. The hydroxyl groups on MoS2 are oxidized by holes to form ∙OH, the essential oxidant for dye removal. At the same time, h+ can also straight oxidize Rh B to form small, nontoxic molecules of H2O and CO2.

3. Experiments

3.1. Materials

Titanium dioxide (TiO2), hydrated sodium molybdate (Na2MoO4∙2H2O, >99%), thiourea (CH4N2S, >99%), oxalic acid (H2C2O4, >99%), sodium borohydride (NaBH4, >99%), chloroplatinic acid (H2PtCl6∙6H2O, >99%), silver nitrate (AgNO3, >99%), HAuCl4·3H2O (>49%), L-ascorbic acid (C6H8O6), and rhodamine B (Rh B) were acquired from Sinopharm Chemical Reagent Co., Ltd. (Shandong, China). All chemicals were of analytical grade and required no further purification for use. The water used in the experiment was deionized water.

3.2. Preparation of a Series of MoS2, TiO2@MoS2, and (Pt-TiO2)@MoS2 Nanocomposites

3.2.1. Preparation of MoS2 Matrix Materials

MoS2 was synthesized by the hydrothermal method [60,61,62]. Firstly, CH4N2S (3.5 g), Na2MoO4∙2H2O (2.5 g), and H2C2O4 (2.0 g) were successively dissolved in 350 mL DI water, followed by magnetic stirring for 0.5 h at room temperature. Next, the above solution was placed in an ultrasonic cleaner for 0.5 h. Moreover, the mixed solution was moved to a 500 mL Teflon stainless-steel autoclave and heated at 200 °C for 24 h. After that reaction and cooling at room temperature, the black product was centrifuged and washed six times alternatively with DI water and ethanol absolute through repeated re-dispersion and filtering. Finally, the material was dried at 85 °C for 12 h.

3.2.2. Preparation of TiO2@MoS2 Nanocomposites

TiO2@MoS2 nanocomposites were obtained by the deposition–precipitation method. Using traditional synthesis, MoS2 (0.170 g) and TiO2 (0.030 g) were placed in two separate 100 mL beakers [21]. After adding 25 mL of ethanol absolute to each container, the mixture was sonicated for 30 min. Next, the MoS2 solution and TiO2 solution in the ultrasonic treated ethanol absolute were stirred by magnetic force, and the ultrasonic MoS2 solution was slowly added to the dispersed TiO2 solution at a speed of 5 mL∙min−1 with a syringe and stirred continuously until the dripping was finished. The grayish-black product was centrifuged after the reaction and washed six times with DI water and ethanol absolute through repeated re-dispersion and filtering. Finally, the material was dried for 12 h at 85 °C.

3.2.3. Preparation of (Pt-TiO2)@MoS2, (Ag-TiO2)@MoS2, and (Au-TiO2)@MoS2 Nanocomposites

(Pt-TiO2)@MoS2 nanocomposites were obtained by the deposition–precipitation method [63]. TiO2@MoS2 nanocomposites (0.192 g) and H2PtCl6∙6H2O (8 mg) were poured into 50 mL ethanol absolute. The mixed solution was uniformly stirred for 1 h at room temperature. C6H8O6 (15 mg) was mixed with the above solution with stirring for 2 h at 80 °C. Then, the acquired solution was centrifuged and washed six times alternatively with DI water and ethanol absolute through repeated redispersion and filtering. Finally, the material was dried for 12 h at 60 °C. The preparation of (Au-TiO2)@MoS2 nanocomposites was similar to that of (Pt-TiO2)@MoS2.
The (Ag-TiO2)@MoS2 nanocomposites were obtained by deposition–precipitation of Ag on the surface of TiO2@MoS2, on the basis of the method described by Naldoni group [64,65]. Using traditional synthesis, 500 mg of TiO2@MoS2 was scattered in water and stirred for 30 min. Then, the required amount of AgNO3 was mixed with the above solution and stirred for 10 min. Next, NaBH4 (aq) (10 mg in 10 mL of water) was added dropwise to the solution and left to react for 30 min. Finally, the acquired solution was centrifuged and washed six times alternatively with DI water and ethanol absolute through repeated redispersion and filtering and dried over night at 60 °C.

3.3. Characterization

The X-ray diffractometer (D8 Advance, Bruker, Billerica, MA, USA) was equipped with a Cu tube for producing Cu radiation (k = 1.5418 Å) and used to examine the crystal forms of the composite photocatalyst. A Phi X-tool instrument was used to carry out the X-ray photoelectron spectroscopy (XPS) measurements. A scanning electron microscope (SEM) was used to examine the prepared photocatalyst morphology, internal structure, and composition. The transmission electron microscope (TEM, JEOL, JEM-2100F, Japan) and GeminiSEM300 were both from Germany. Using a TU-1810PC UV Vis spectrophotometer, diffuse reflectance spectra in the UV–Vis range were recorded. A surface area analyzer (BK112T) was used to characterize a specific area of the obtained samples. A 3H-2000PS1 isothermal nitrogen sorption analyzer from Beishide, China, produced the samples’ nitrogen adsorption isotherms.

3.4. Photocatalytic Measurement

To investigate the photocatalysis properties of the obtained samples, 20 mg/L Rh B solution was used as the pollutant. The 20 mg nanocomposites tested were immersed in 100 mL of Rh B (20 mg/L−1) aqueous solution to form a suspension. Magnetic stirring of the suspension was performed for 30 min in the dark to establish an adsorption–desorption equilibrium. A 300 W Xe lamp with a 420 nm UV-cut filter was then used as the light source. During irradiation, samples were taken at specified intervals and withdrawn from the mixture with a 0.22 µm syringe filter. The strength of the solution was measured at 554 nm by a TU-1810PC UV-visible spectrophotometer. Finally, the photocatalysis efficiency was calculated on the basis of C/C0 × 100%, in which C and C0 were the final and initial concentrations of the dyes.

4. Conclusions

Using XRD, SEM, TEM, XPS, PL, FTIR, UV–Vis DRS, and BET analyzer, the results confirmed that TiO2 and M(Pt, Ag and Au) (NPs) were evenly distributed on MoS2 nanosheets (NSs) to form (M(M=Pt, Ag and Au)-TiO2)@MoS2 nanocomposite heterojunctions. The photocatalytic degradation efficiency of Rh B was contrasted between a series of MoS2, TiO2@MoS2, and (M(M=Pt, Ag and Au)-TiO2)@MoS2 nanocomposites with different compositions using a UV–Vis absorption spectrometer. The results showed that the (Pt(5 wt%)-TiO2(15 wt%))@MoS2 ternary heterojunction nanocomposites exhibited the highest photocatalysis activity, with the maximum value of 99.0%, compared to 93% for TiO2(15 wt%)@MoS2, 96.5% for (Ag(5 wt%)-TiO2(15 wt%))@MoS2, and 97.8% for (Au(5 wt%)-TiO2(15 wt%))@MoS2 within 9 min. The experiments showed that (Pt(5 wt%)-TiO2(15 wt%))@MoS2 surpassed TiO2(15 wt%)@MoS2, (Ag(5 wt%)-TiO2(15 wt%))@MoS2, and (Au(5 wt%)-TiO2(15 wt%))@MoS2 in photocatalytic degradation, and the (Pt(5 wt%)-TiO2(15 wt%))@MoS2 ternary heterojunction nanocomposites exhibited the highest photocatalytic activity of all of the samples. The advanced structure of (Pt-TiO2)@MoS2 improved both light harvesting and electron transfer in the photocatalytic composites, contributing to the remarkable catalytic effectiveness and extended durability in the photodegradation of Rh B. In-depth discussions of the potential growth and photocatalytic mechanism, which will help improve the energy and environmental fields, are included.

Author Contributions

Conceptualization, L.J., D.H., X.Y. (Xiude Yang) and X.Y. (Xiang Yang); Methodology, L.J., X.J., L.N., W.Z., Y.W. and X.Y. (Xiang Yang); Software, L.J., D.H., L.N., W.Z. and Y.W.; Validation, L.J., L.N., Y.W. and X.Y. (Xiang Yang); Formal analysis, L.J.; Investigation, L.J., L.N., W.Z., Y.W. and X.Y. (Xiang Yang); Resources, D.H., X.J., H.L., X.Y. (Xiude Yang), Q.L. and Z.G.; Data curation, L.J., Y.W. and X.Y. (Xiang Yang); Writing—original draft, L.J.; Writing—review & editing, L.J., D.H., X.J., H.L. and X.Y. (Xiude Yang); Supervision, D.H., X.J., H.L., Q.L. and Z.G.; Project administration, D.H., X.J., H.L., X.Y. (Xiude Yang), Q.L. and Z.G.; Funding acquisition, D.H. All authors have read and agreed to the published version of the manuscript.

Funding

This work was supported by the Scientific Research Foundation of Guizhou Province (ZSKH [2020] 1Y048, Key Field Project of Guizhou Province Education Ministry ([2020] 048) and Doctor Foun-dation of Zunyi Normal College (ZSBS [2018] 10), Innovation and Entrepreneurship Training Pro-gram for College Students in Guizhou Province (S202210664006). This work was also supported by the Key Laboratory of Zunyi City (SSKH [2015] 55).

Acknowledgments

This work was supported by the Scientific Research Foundation of Guizhou Province (ZSKH [2020] 1Y048, Key Field Project of Guizhou Province Education Ministry ([2020] 048) and Doctor Foundation of Zunyi Normal College (ZSBS [2018] 10), Innovation and Entrepreneurship Training Program for College Students in Guizhou Province (S202210664006). This work was also supported by the Key Laboratory of Zunyi City (SSKH [2015] 55).

Conflicts of Interest

The authors declare no conflict of interest.

References

  1. Boczkaj, G.; Fernandes, A. Wastewater treatment by means of advanced oxidation processes at basic pH conditions: A review. Chem. Eng. J. 2017, 320, 608–633. [Google Scholar] [CrossRef]
  2. Wang, M.; Ioccozia, J.; Sun, L.; Lin, C.; Lin, Z. Inorganic-modified semiconductor TiO2 nanotube arrays for photocatalysis. Energy Environ. Sci. 2014, 7, 2182–2202. [Google Scholar] [CrossRef]
  3. Li, W.; Yang, J.; Wu, Z.; Wang, J.; Li, B.; Feng, S.; Deng, Y.; Zhang, F.; Zhao, D. A versatile kinetics-controlled coating method to construct uniform porous TiO2 shells for multifunctional core-shell structures. J. Am. Chem. Soc. 2012, 134, 11864–11867. [Google Scholar] [CrossRef] [PubMed]
  4. Ganatra, R.; Zhang, Q. Few-layer MoS2: A promising layered semiconductor. ACS Nano 2014, 8, 4074–4099. [Google Scholar] [CrossRef] [PubMed]
  5. Portillo-Vélez, N.; Zanella, R. Comparative study of transition metal (Mn, Fe or Co) catalysts supported on titania: Effect of Au nanoparticles addition towards CO oxidation and soot combustion reactions. Chem. Eng. J. 2020, 385, 123848. [Google Scholar] [CrossRef]
  6. Gogoi, D.; Namdeo, A.; Kumar, A. Ag-doped TiO2 photocatalysts with effective charge transfer for highly efficient hydrogen production through water splitting. Int. J. Hydrog. Energy 2019, 45, 2729–2744. [Google Scholar] [CrossRef]
  7. Sun, M.; Zhang, Z.; Shi, Q.; Yang, J.; Xie, M.; Han, W. Toward photocatalytic hydrogen generation over BiVO4 by controlling particle size. Chin. Chem. Lett. 2021, 32, 2419–2422. [Google Scholar] [CrossRef]
  8. Suarez-Escobar, A.F.; Conde-Rivera, L.R.; Lopez-Suarez, F.E.; Illán-Gómez, M.J.; Gonzalez-Hernandez, K.S.; Chalapud-Morales, J.S. Heterogeneous Photocatalytic Degradation of Ibuprofen over TiO2–Ag Supported on Activated Carbon from Waste Tire Rubber. Top. Catal. 2021, 64, 51–64. [Google Scholar] [CrossRef]
  9. Isari, A.A.; Hayati, F.; Kakavandi, B.; Rostami, M.; Motevassel, M.; Dehghanifard, E. N, Cu co-doped TiO2@functionalized SWCNT photocatalyst coupled with ultrasound and visible-light: An effective sono-photocatalysis process for pharmaceutical wastewaters treatment. Chem. Eng. J. 2020, 392, 123685. [Google Scholar] [CrossRef]
  10. Basavarajappa, P.S.; Patil, S.B.; Ganganagappa, N.; Reddy, K.R.; Raghu, A.V.; Reddy, C.V. Recent progress in metal-doped TiO2, non-metal doped/codoped TiO2 and TiO2 nanostructured hybrids for enhanced photocatalysis. Int. J. Hydrog. Energy 2020, 45, 7764–7778. [Google Scholar] [CrossRef]
  11. Nada, E.A.; El-Maghrabi, H.H.; Raynaud, P.; Ali, H.R.; Abd El-Wahab, S.; Sabry, D.Y.; Moustafa, Y.M.; Nada, A.A. Enhanced Photocatalytic Activity of WS2/TiO2 Nanofibers for Degradation of Phenol under Visible Light Irradiation. Inorganics 2022, 10, 54. [Google Scholar]
  12. Nwankwo, U.; Bucher, R.; Ekwealor, A.B.C.; Maaza, M.; Ezema, F.I. Synthesis and characterizations of rutile-TiO2 nanoparticles derived from chitin for potential photocatalytic applications. Vacuum 2018, 161, 49–54. [Google Scholar] [CrossRef]
  13. Bisaria, K.; Sinha, S.; Singh, R.; Iqbal, H.M.N. Recent Advances in Structural Modifications of Photo-Catalysts for Organic Pollutants Degradation—A Comprehensive Review. Chemosphere 2021, 284, 131263. [Google Scholar] [CrossRef]
  14. Duan, X.; Yang, J.; Hu, G.; Yang, C.; Chen, Y.; Liu, Q.; Ren, S.; Li, J. Optimization of TiO2/ZSM-5 Photocatalysts: Energy Band Engineering by Solid State Diffusion Method with Calcination. J. Environ. Chem. Eng. 2021, 9, 105563. [Google Scholar] [CrossRef]
  15. Xia, C.; Nguyen, T.H.C.; Nguyen, X.C.; Kim, S.Y.; Nguyen, D.L.T.; Raizada, P.; Singh, P.; Nguyen, V.-H.; Nguyen, C.C.; Hoang, V.C.; et al. Emerging Cocatalysts in TiO2-Based Photocatalysts for Light-Driven Catalytic Hydrogen Evolution: Progress and Perspectives. Fuel 2022, 307, 121745. [Google Scholar] [CrossRef]
  16. Xu, F.; Zhu, B.; Cheng, B.; Yu, J.; Xu, J. 1D/2D TiO2/MoS2 hybrid nanostructures for enhanced photocatalytic CO2 reduction. Adv. Opt. Mater. 2018, 6, 1800911. [Google Scholar] [CrossRef] [Green Version]
  17. Hu, X.; Lu, S.; Tian, J.; Wei, N.; Song, X.; Wang, X.; Cui, H. The selective deposition of MoS2 nanosheets onto (101) facets of TiO2 nanosheets with exposed (001) facets and their enhanced photocatalytic H2 production. Appl. Catal. B Environ. 2019, 241, 329–337. [Google Scholar] [CrossRef]
  18. Li, X.; Li, Y.; Wang, H.; Miao, H.; Zhu, H.; Liu, X.; Lin, H.; Shi, G. Fabrication of a three-dimensional bionic Si/TiO2/MoS2 photoelectrode for efficient solar water splitting. ACS Appl. Energy Mater. 2020, 4, 730–736. [Google Scholar] [CrossRef]
  19. Liang, H.; Bai, J.; Xu, T.; Li, C. Controllable growth of foxtail-like MoS2 on one-dimensional carbon nanofibers with enhanced photocatalytic activity. Vacuum 2020, 172, 109059. [Google Scholar] [CrossRef]
  20. Liu, Y.; Li, Y.; Peng, F.; Lin, Y.; Yang, S.; Zhang, S.; Wang, H.; Cao, Y.; Yu, H. 2H-and 1T-mixed phase few-layer MoS2 as a superior to Pt cocatalyst coated on TiO2 nanorod arrays for photocatalytic hydrogen evolution. Appl. Catal. B Environ. 2019, 241, 236–245. [Google Scholar] [CrossRef]
  21. Lathe, A.; Ansari, A.; Badhe, R.; Palve, A.M.; Garje, S.S. Single-Step Production of a TiO2@MoS2 Heterostructure and Its Applications as a Supercapacitor Electrode and Photocatalyst for Reduction of Cr(VI) to Cr(III). ACS Omega 2021, 6, 13008–13014. [Google Scholar] [CrossRef]
  22. Nkele, A.C.; Chime, U.K.; Asogwa, L.; Nwanya, A.C.; Nwankwo, U.; Ukoba, K.; Jen, T.; Maaza, M.; Ezema, F.I. A study on titanium dioxide nanoparticles synthesized from titanium isopropoxide under SILAR-induced gel method: Transition from anatase to rutile structure. Inorg. Chem. Commun. 2020, 112, 107705. [Google Scholar] [CrossRef]
  23. Chandrabose, G.; Dey, A.; Gaur, S.S.; Pitchaimuthu, S.; Jagadeesan, H.; Braithwaite, N.S.J.; Selvaraj, V.; Kumar, V.; Krishnamurthy, S. Removal and degradation of mixed dye pollutants by integrated adsorption-photocatalysis technique using 2-D MoS2/TiO2 nanocomposite. Chemosphere 2021, 279, 130467. [Google Scholar] [CrossRef] [PubMed]
  24. Sajan, C.P.; Wageh, S.; Al-Ghamdi, A.A.; Yu, J.; Cao, S. TiO2 nanosheets with exposed {001} facets for photocatalytic applications. Nano Res. 2016, 9, 3–27. [Google Scholar] [CrossRef]
  25. Ho, V.T.T.; Chau, D.H.; Bui, K.Q.; Nguyen, N.T.T.; Tran, T.K.N.; Bach, L.G.; Truong, S.N. A High-Performing Nanostructured Ir Doped-TiO2 for Efficient Photocatalytic Degradation of Gaseous Toluene. Inorganics 2022, 10, 29. [Google Scholar] [CrossRef]
  26. Zhou, W.; Sun, F.; Pan, K.; Tian, G.; Jiang, B.; Ren, Z.; Tian, C.; Fu, H. Well-Ordered Large-Pore Mesoporous Anatase TiO2 with Remarkably High Thermal Stability and Improved Crystallinity: Preparation, Characterization, and Photocatalytic Performance. Adv. Funct. Mater. 2011, 21, 1922–1930. [Google Scholar] [CrossRef]
  27. Yuan, Y.-J.; Chen, D.-Q.; Huang, Y.-W.; Yu, Z.-T.; Zhong, J.-S.; Chen, T.-T.; Tu, W.-G.; Guan, Z.-J.; Cao, D.-P.; Zou, Z.-G. MoS2 Nanosheet-Modified CuInS2 Photocatalyst for Visible-Light-Driven Hydrogen Production from Water. ChemSusChem 2016, 9, 1003–1009. [Google Scholar] [CrossRef]
  28. Radisavljevic, B.; Radenovic, A.; Brivio, J.; Giacometti, V.; Kis, A. Single-layer MoS2 transistors. Nat. Nanotechnol. 2011, 6, 147–150. [Google Scholar] [CrossRef]
  29. Machín, A.; Soto-Vázquez, L.; Colón-Cruz, C.; Valentín-Cruz, C.A.; Claudio-Serrano, G.J.; Fontánez, K.; Resto, E.; Petrescu, F.I.; Morant, C.; Márquez, F. Photocatalytic Activity of Silver-Based Biomimetics Composites. Biomimetics 2021, 6, 4. [Google Scholar] [CrossRef]
  30. Limón-Rocha, I.; Marizcal-Barba, A.; Guzmán-González, C.A.; Anaya-Esparza, L.M.; Ghotekar, S.; González-Vargas, O.A.; Pérez-Larios, A. Co, Cu, Fe, and Ni Deposited over TiO2 and Their Photocatalytic Activity in the Degradation of 2,4-Dichlorophenol and 2,4-Dichlorophenoxyacetic Acid. Inorganics 2022, 10, 157. [Google Scholar] [CrossRef]
  31. Uddin, A.S.M.I.; Phan, D.T.; Chung, G.S. Low temperature acetylene gas sensor based on Ag nanoparticles-loaded ZnO-reduced graphene oxide hybrid. Sens. Actuators B Chem. 2015, 207, 362–369. [Google Scholar] [CrossRef]
  32. Al Jitan, S.; Li, Y.; Bahamon, D.; Žerjav, G.; Tatiparthi, V.S.; Aubry, C.; Sinnokrot, M.; Matouk, Z.; Rajput, N.; Gutierrez, M.; et al. Unprecedented Photocatalytic Conversion of Gaseous and Liquid CO2 on Graphene-Impregnated Pt/Cu-TiO2. SSRN J. 2022, 11, 109485. [Google Scholar] [CrossRef]
  33. Li, B.; Ding, Y.; Li, Q.; Guan, Z.; Zhang, M.; Yang, J. The Photothermal Effect Enhance Visible Light-Driven Hydrogen Evolution Using Urchin-like Hollow RuO2/TiO2/Pt/C Nanomaterial. J. Alloy. Compd. 2022, 890, 161722. [Google Scholar] [CrossRef]
  34. Rashid, M.M.; Simoňcǐc, B.; Tomšǐc, B. Recent Advances in TiO2 -Functionalized Textile Surfaces. Surf. Interfaces 2021, 22, 100890. [Google Scholar] [CrossRef]
  35. Nguyen, T.T.; Cao, T.M.; Balayeva, N.O.; Pham, V.V. Thermal Treatment of Polyvinyl Alcohol for Coupling MoS2 and TiO2 Nanotube Arrays toward Enhancing Photoelectrochemical Water Splitting Performance. Catalysts 2021, 11, 857. [Google Scholar] [CrossRef]
  36. Li, S.; Pu, T.; Wang, J.; Fang, X.; Liu, Y.; Kang, S.; Cui, L. Efficient visible-light-driven hydrogen evolution over ternary MoS2/Pt-TiO2 photocatalysts with low overpotential. Int. J. Hydrog. Energy 2018, 43, 16534–16542. [Google Scholar] [CrossRef]
  37. Ceballos-Chuc, M.C.; Ramos-Castillo, C.M.; Rodríguez-Pérez, M.; Ruiz-Gómez, M.Á.; Rodríguez-Gattorno, G.; Villanueva-Cab, J. Synergistic Correlation in the Colloidal Properties of TiO2 Nanoparticles and Its Impact on the Photocatalytic Activity. Inorganics 2022, 10, 125. [Google Scholar] [CrossRef]
  38. Abdolvahabpour, N.L.; Michael, S.; Minoo, T. Photocatalytic Degradation of Phenol Using Photodeposited Pt Nanoparticles on Titania. J. Nanosci. Nanotechnol. 2020, 20, 1056–1065. [Google Scholar]
  39. Fan, G.; Huang, X.; Li, D.; Li, A. TiO-Graphene 3D Hydrogel Supported on Ni Foam for Photoelectrocatalysis Removal of Organic Contaminants. J. Nanosci. Nanotechnol. 2020, 20, 2645–2649. [Google Scholar] [CrossRef]
  40. Zhang, X.; Huang, X.; Xue, M.; Ye, X.; Lei, W.; Tang, H.; Li, C. Hydrothermal synthesis and characterization of 3D flower-like MoS2 microspheres. Mater. Lett. 2015, 148, 67–70. [Google Scholar] [CrossRef]
  41. Neri, G.; Leonardi, S.G.; Latino, M.; Donato, N.; Baek, S.; Conte, D.E.; Russo, P.A.; Pinna, N. Sensing behavior of SnO2/reduced graphene oxide nanocomposites toward NO2. Sens. Actuators B Chem. 2013, 179, 61–68. [Google Scholar] [CrossRef]
  42. The International Center for Diffraction Data (ICDD) No. 00-004-0784; ICDD: Newtown Square, PA, USA, 2008.
  43. Zhou, W.; Yin, Z.; Du, Y.; Huang, X.; Zeng, Z.; Fan, Z.; Liu, H.; Wang, J.; Zhang, H. Synthesis of Few-Layer MoS2 Nanosheet-Coated TiO2 Nanobelt Heterostructures for Enhanced Photocatalytic Activities. Small 2013, 9, 140–147. [Google Scholar] [CrossRef] [PubMed]
  44. Lang, D.; Shen, T.; Xiang, Q. Roles of MoS2 and Graphene as Cocatalysts in the Enhanced Visible-Light Photocatalytic H2 Production Activity of Multiarmed CdS Nanorods. ChemCatChem 2015, 7, 943–951. [Google Scholar] [CrossRef]
  45. Zheng, X.; Xu, J.; Yan, K.; Wang, H.; Wang, Z.; Yang, S. Space-Confined Growth of MoS2 Nanosheets within Graphite: The Layered Hybrid of MoS2 and Graphene as an Active Catalyst for Hydrogen Evolution Reaction. Chem. Mater. A Publ. Am. Chem. Soc. 2014, 26, 2344–2353. [Google Scholar] [CrossRef]
  46. Drmosh, Q.; Yamani, Z. Yamani. Hydrogen sensing properties of sputtered ZnO films decorated with Pt nanoparticles. Ceram. Int. 2016, 42, 12378–12384. [Google Scholar] [CrossRef]
  47. Jung, W.Y.; Lee, G.D.; Park, S.S.; Lim, K.T.; Hong, S.-S. Photocatalytic decomposition of methylene blue over yttrium ion doped Ti-SBA-15 catalysts. Catal. Today 2011, 164, 395–398. [Google Scholar] [CrossRef]
  48. Deghiche, A.; Haddaoui, N.; Zerriouh, A.; Fenni, S.E.; Cavallo, D.; Erto, A.; Benguerba, Y. Effect of the stearic acid-modified TiO2 on PLA nanocomposites: Morphological and thermal properties at the microscopic scale. J. Environ. Chem. Eng. 2021, 9, 106541. [Google Scholar] [CrossRef]
  49. Li, X.; Tang, C.; Zheng, Q.; Shao, Y.; Li, D. Amorphous MoSx on CdS nanorods for highly efficient photocatalytic hydrogen evolution. J. Solid State Chem. 2017, 246, 230–236. [Google Scholar] [CrossRef]
  50. Zheng, L.; Han, S.; Liu, H.; Yu, P.; Fang, X. Hierarchical MoS2 Nanosheet@TiO2 Nanotube Array Composites with Enhanced Photocatalytic and Photocurrent Performances. Small 2016, 12, 1527.e36. [Google Scholar] [CrossRef]
  51. Zhang, W.; Xiao, X.; Zheng, L.; Wan, C. Fabrication of TiO2/MoS2@zeolite photocatalyst and its photocatalytic activity for degradation of methyl orange under visible light. Appl. Surf. Sci. A J. Devoted Prop. Interfaces Relat. Synth. Behav. Mater. 2015, 358, 468–478. [Google Scholar] [CrossRef]
  52. Xu, H.; Tao, X.; Wang, D.-T.; Zheng, Y.-Z.; Chen, J.-F. Enhanced efficiency in dye-sensitized solar cells based on TiO2 nanocrystal/nanotube double-layered films. Electrochim. Acta 2009, 55, 2280–2285. [Google Scholar] [CrossRef]
  53. Jang, J.S.; Choi, S.H.; Kim, H.G.; Lee, J.S. Location and State of Pt in Platinized CdS/TiO2 Photocatalysts for Hydrogen Production from Water under Visible Light. J. Phys. Chem. C Nanomater. Interfaces 2008, 112, 17200–17205. [Google Scholar] [CrossRef]
  54. Zhang, C.; Yu, H.; Li, Y.; Fu, L.; Gao, Y.; Song, W.; Shao, Z.; Yi, B. Simple synthesis of Pt/TiO2 nanotube arrays with high activity and stability. J. Electroanal. Chem. 2013, 701, 14–19. [Google Scholar] [CrossRef]
  55. Zhu, Y.; Ling, Q.; Liu, Y.; Wang, H.; Zhu, Y. Photocatalytic H2 evolution on MoS2-TiO2 catalysts synthesized via mechanochemistry. Phys. Chem. Chem. Phys. 2015, 17, 933–940. [Google Scholar] [CrossRef]
  56. Lu, Z.; Zhu, W.; Yu, X.; Zhang, H.; Li, Y.; Sun, X.; Wang, X.; Wang, H.; Wang, J.; Luo, J.; et al. Ultrahigh hydrogen evolution performance of under-water “superaerophobic” MoS2 nanostructured electrodes. Adv. Mater. 2014, 26, 2683–2687. [Google Scholar] [CrossRef]
  57. Bai, S.; Wang, L.; Chen, X.; Du, J.; Xiong, Y. Chemically exfoliated metallic MoS2 nanosheets: A promising supporting co-catalyst for enhancing the photocatalytic performance of TiO2 nanocrystals. Nano Res. 2015, 8, 175–183. [Google Scholar] [CrossRef]
  58. Wang, B.; Xia, Y.; Wang, G.; Zhou, Y.; Wang, H. Core shell MoS2/C nanospheres embedded in foam-like carbon sheets composite with an interconnected macroporous structure as stable and high-capacity anodes for sodium ion batteries. Chem. Eng. J. 2017, 309, 417–425. [Google Scholar] [CrossRef]
  59. Yan, X.; Bao, R.; Yu, S.; Li, Q.; Jing, Q. The roles of hydroxyl radicals, photo-generated holes and oxygen in the photocatalytic degradation of humic acid. Russ. J. Phys. Chem. 2012, 86, 1479–1485. [Google Scholar] [CrossRef]
  60. Yan, H.; Song, P.; Zhang, S.; Yang, Z.; Wang, Q. Facile synthesis, characterization and gas sensing performance of ZnO nanoparticles-coated MoS2 nanosheets. J. Alloy. Compd. 2016, 662, 118–125. [Google Scholar] [CrossRef]
  61. Li, H.; Yu, K.; Lei, X.; Guo, B.; Li, C.; Fua, H.; Zhu, Z. Synthesis of MoS2@CuO Heterogeneous Structure with Improved Photocatalysis Performance and H2O Adsorption Analysis. Dalton Trans. 2015, 44, 10438. [Google Scholar] [CrossRef]
  62. Hong, D.; Cao, G.; Qu, J.; Deng, Y.; Tang, J. Antibacterial activity of Cu2O and Ag co-modified rice grains-like ZnO nanocomposites. J. Mater. Sci. Technol. 2018, 34, 2359–2367. [Google Scholar] [CrossRef]
  63. Zhang, D.; Pang, M.; Wu, J.; Cao, Y. Experimental and density functional theory investigation of Pt-loaded titanium dioxide/molybdenum disulfide nanohybrid for SO2 gas sensing. New J. Chem. 2019, 43, 4900–4907. [Google Scholar] [CrossRef]
  64. Abniel, M.; Kenneth, F.; Diego, G.; Paola, S.; Carla, C.; Gerardo, C.J.; Loraine, S.; Edgard, R.; Florian, P.I.; Carmen, M.; et al. Hydrogen Production and Degradation of Ciprofloxacin by Ag@TiO2-MoS2 Photocatalysts. Catalysts 2022, 12, 267. [Google Scholar]
  65. Naldoni, A.; D’Arienzo, M.; Altomare, M.; Marelli, M.; Scotti, R.; Morazzoni, F.; Selli, E.; Dal Santo, V. Pt and Au/TiO2 photocatalysts for methanol reforming: Role of metal nanoparticles in tuning charge trapping properties and photoefficiency. Appl. Catal. B Environ. 2013, 130–131, 239–248. [Google Scholar] [CrossRef]
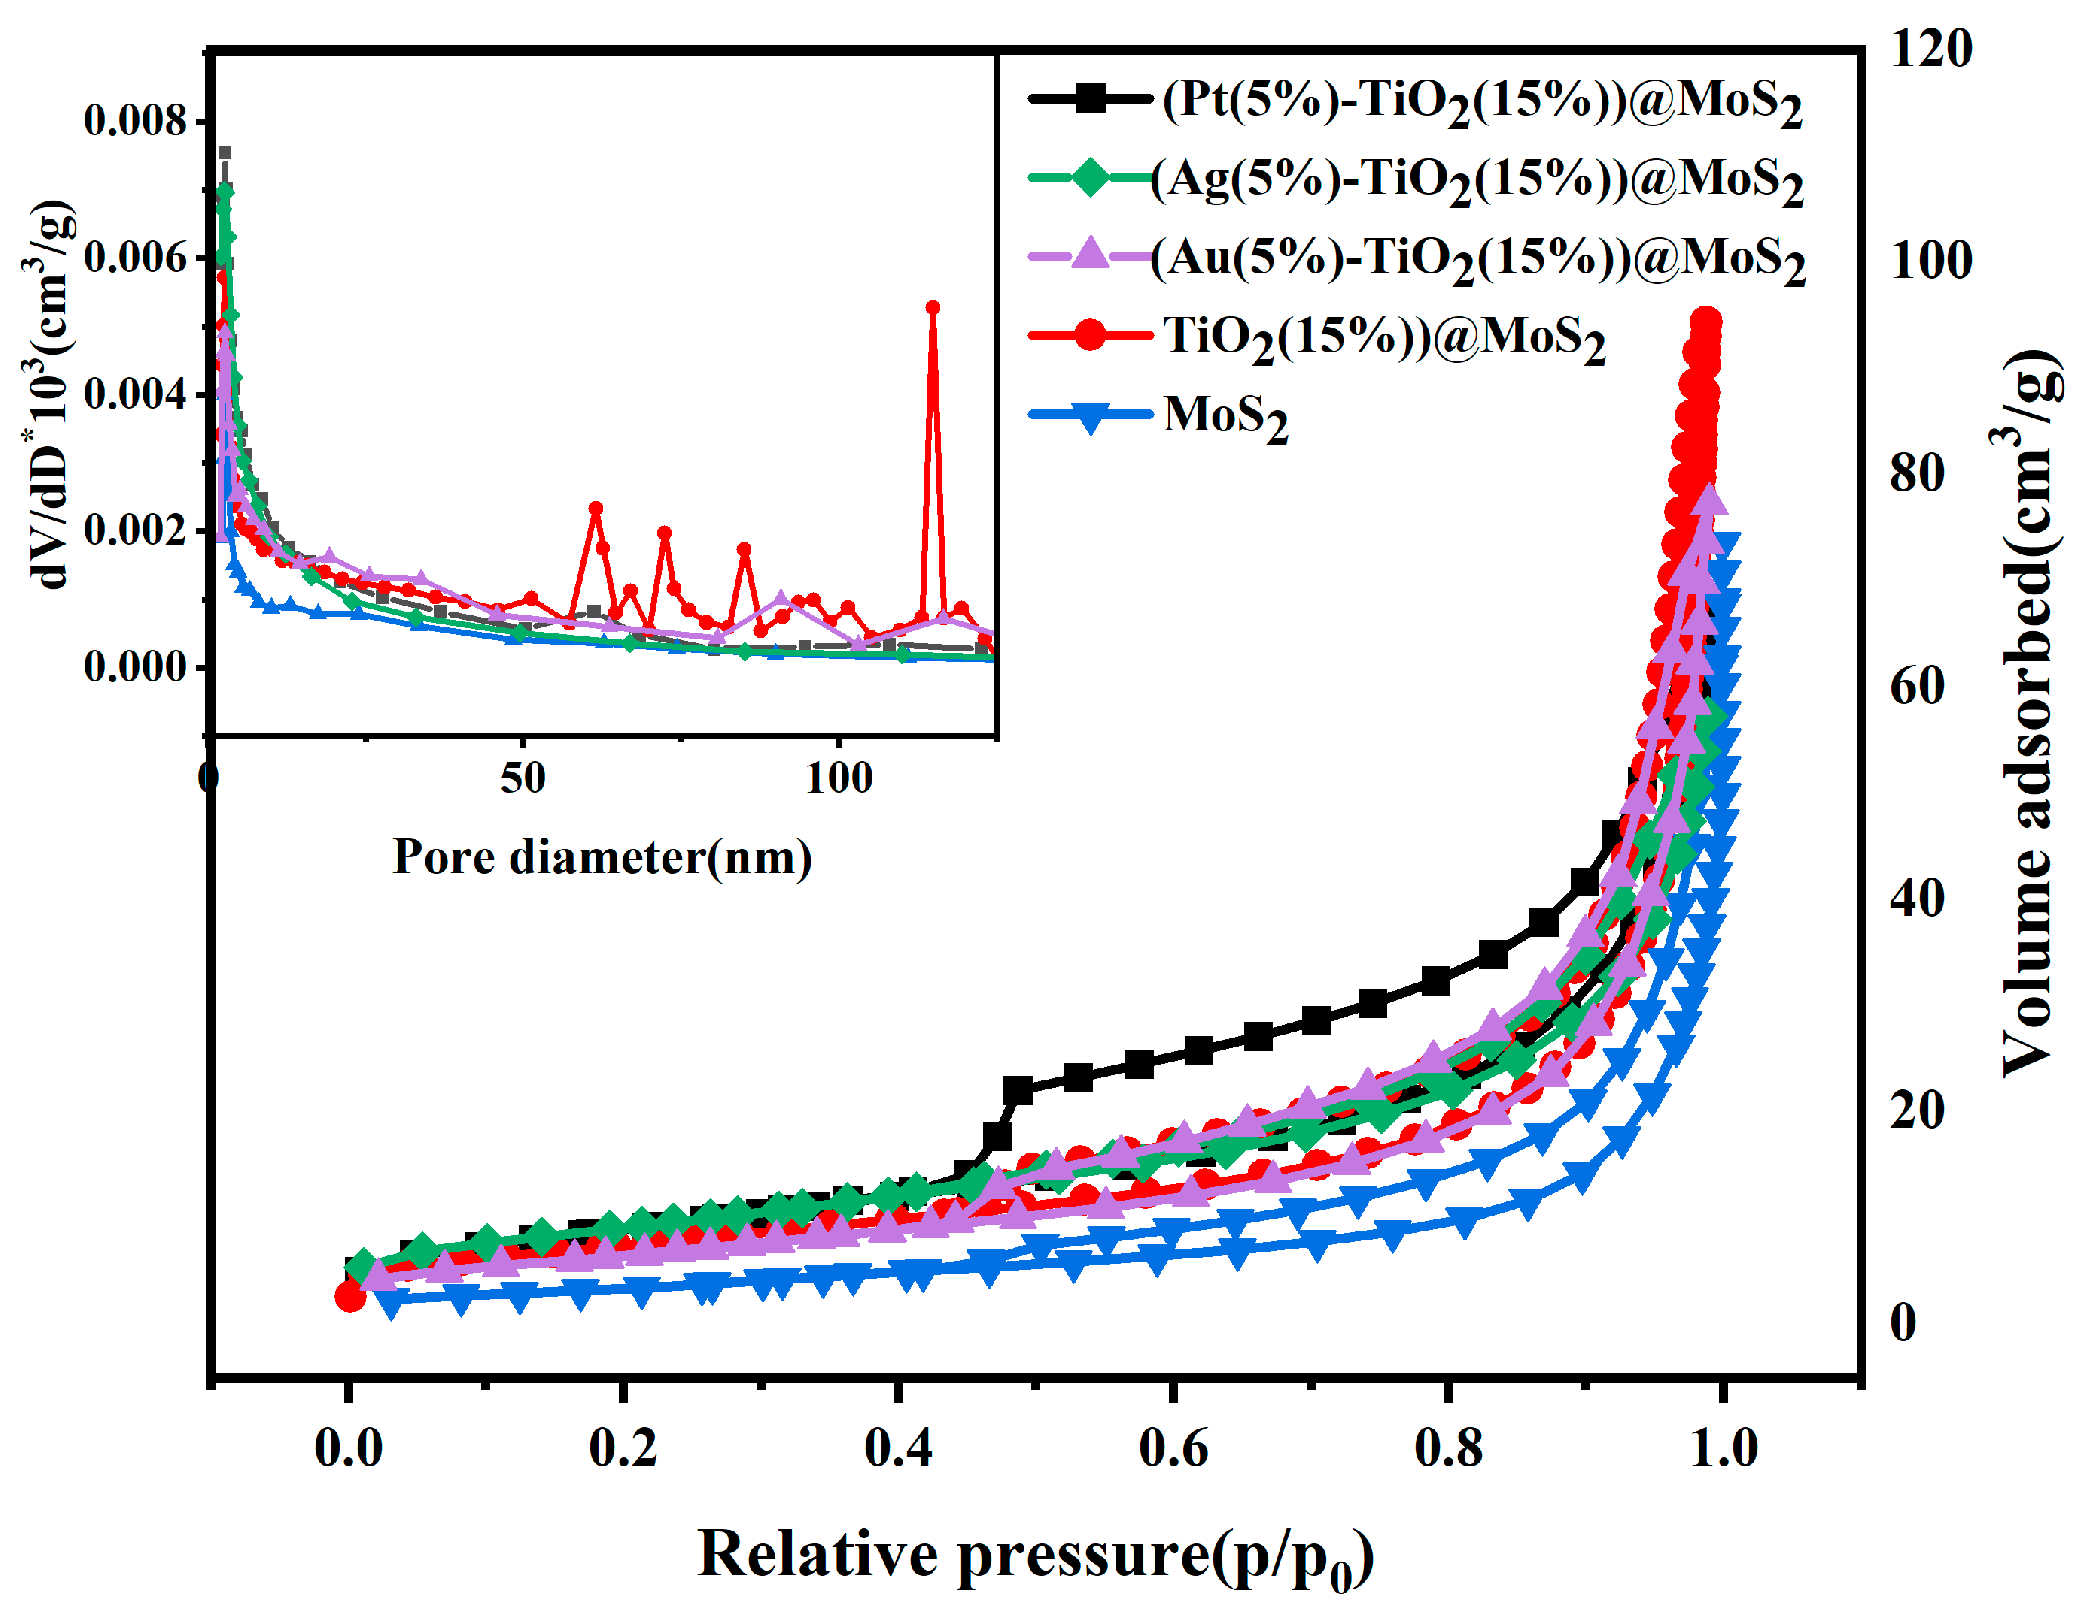
Figure 1. XRD patterns of MoS2, TiO2(15 wt%)@MoS2, (Pt (5 wt%)-TiO2(15 wt%))@MoS2, (Ag (5 wt%)-TiO2(15 wt%))@MoS2, and (Au (5 wt%)-TiO2(15 wt%))@MoS2.
Inorganics 11 00258 g001
Figure 2. SEM images of (a) MoS2 and (b) (Pt (5 wt%)-TiO2(15 wt%))@MoS2 and EDS patterns (c) corresponding to the SEM images of (b); TEM images of (d) (Pt (5 wt%)-TiO2(15 wt%))@MoS2. HRTEM image of (e) (Pt (5 wt%)-TiO2(15 wt%))@MoS2; (fk) corresponding elemental mapping images of Mo, S, Ti, O, and Pt.
Inorganics 11 00258 g002
Figure 3. SEM images of (a) (Ag (5 wt%)-TiO2(15 wt%))@MoS2 and EDS pattern (d) corresponding to the SEM image of (a); TEM images of (Ag (5 wt%)-TiO2(15 wt%))@MoS2 (b,c) HRTEM image of (e) (Ag (5 wt%)-TiO2(15 wt%))@MoS2; (fk) corresponding elemental mapping images of Mo, S, Ti, O, and Ag.
Inorganics 11 00258 g003
Figure 4. SEM images of (a) (Au (5 wt%)-TiO2(15 wt%))@MoS2 and EDS pattern (d) corresponding to the SEM image of (a); TEM images of (Au (5 wt%)-TiO2(15 wt%))@MoS2 (b,c); HRTEM image of (e) (Au (5 wt%)-TiO2(15 wt%))@MoS2; (fk) corresponding elemental mapping images of Mo, S, Ti, O, and Au.
Inorganics 11 00258 g004
Figure 5. XPS spectra of (Pt (5 wt%)-TiO2(15 wt%))@MoS2: (a) survey spectrum, (b) O1s, (c) Ti2p, (d) Mo 3d, (e) S 2p, and (f) Pt 4f.
Inorganics 11 00258 g005
Figure 6. PL emission spectra of MoS2, TiO2(15 wt%)@MoS2, (Pt (5 wt%)-TiO2(15 wt%))@MoS2, (Ag (5 wt%)-TiO2(15 wt%))@MoS2, and (Au (5 wt%)-TiO2(15 wt%))@MoS2.
Inorganics 11 00258 g006
Figure 7. FT-IR spectra of MoS2, TiO2(15 wt%))@MoS2, (Pt (5 wt%)-TiO2(15 wt%))@MoS2, (Ag (5 wt%)-TiO2(15 wt%))@MoS2, and (Au (5 wt%)-TiO2(15 wt%))@MoS2.
Inorganics 11 00258 g007
Figure 8. (a) UV–Vis DRS spectra and (b) the corresponding plot analysis of the optical band gap of MoS2, TiO2(15 wt%))@MoS2, (Pt (5 wt%)-TiO2(15 wt%))@MoS2, (Ag (5 wt%)-TiO2(15 wt%))@MoS2, and (Au (5 wt%)-TiO2(15 wt%))@MoS2.
Inorganics 11 00258 g008
Figure 9. Chopped photocurrent response with light OFF/ON every 50 s of samples of pure MoS2, TiO2 (15 wt%)@MoS2, (Pt (2 wt%)-TiO2(15 wt%))@MoS2, (Pt (5 wt%)-TiO2(15 wt%))@MoS2, (Au (5 wt%)-TiO2(15 wt%))@MoS2, and (Ag (5 wt%)-TiO2(15 wt%))@MoS2.
Inorganics 11 00258 g009
Figure 10. Nitrogen adsorption–desorption isotherms of (Pt(5 wt%)-TiO2(15 wt%))@MoS2, (Ag(5 wt%)-TiO2(15 wt%))@MoS2, (Au(5 wt%)-TiO2(15 wt%))@MoS2, TiO2(15 wt%))@MoS2, and MoS2. The insert curve shows the pore size distribution.
Inorganics 11 00258 g010
Figure 11. (a) Photocatalytic degradation of pure MoS2 and TiO2(2 wt%, 5 wt%, 10 wt%, 15 wt%, and 20 wt%) modified MoS2 nanocomposites; (b) reaction kinetics corresponding to Figure 6a; (c) TiO2(15 wt%)-MoS2 and Pt(1 wt%, 2 wt%, 3 wt%, 4 wt%, and 5 wt%), Ag(5 wt%), Au(5 wt%) photocatalytic degradation of TiO2@MoS2 nanocomposites; (d) reaction kinetics corresponding to Figure 6c.
Inorganics 11 00258 g011
Figure 12. Schematic diagram of the energy band structure of (Pt-TiO2)@MoS2 nanocomposites and the proposed charge transfer mechanism.
Inorganics 11 00258 g012
Table 1. BET specific surface areas and average pore sizes of (Pt(5 wt%)-TiO2(15 wt%))@MoS2, (Ag(5 wt%)-TiO2(15 wt%))@MoS2, (Au(5 wt%)-TiO2(15 wt%))@MoS2, TiO2(15 wt%))@MoS2, and MoS2.
Sample(Pt(5 wt%)-TiO2(15 wt%))@MoS2(Ag(5 wt%)-TiO2(15 wt%))@MoS2(Au(5 wt%)-TiO2(15 wt%)) @MoS2TiO2(15 wt%))@MoS2MoS2
SBET (m2 × g−1)32.8532.7223.8526.7812.62
Average pore size (nm)12.6110.8320.0521.7819.39
Disclaimer/Publisher’s Note: The statements, opinions and data contained in all publications are solely those of the individual author(s) and contributor(s) and not of MDPI and/or the editor(s). MDPI and/or the editor(s) disclaim responsibility for any injury to people or property resulting from any ideas, methods, instructions or products referred to in the content.

