


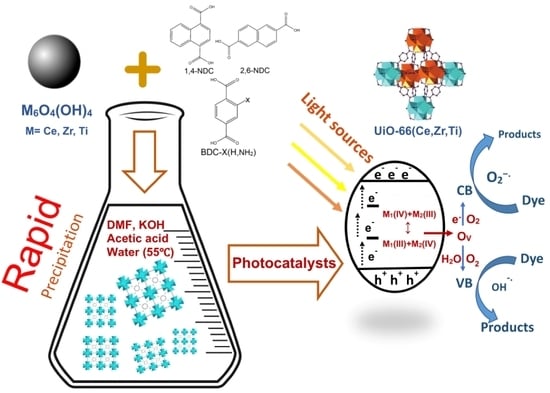
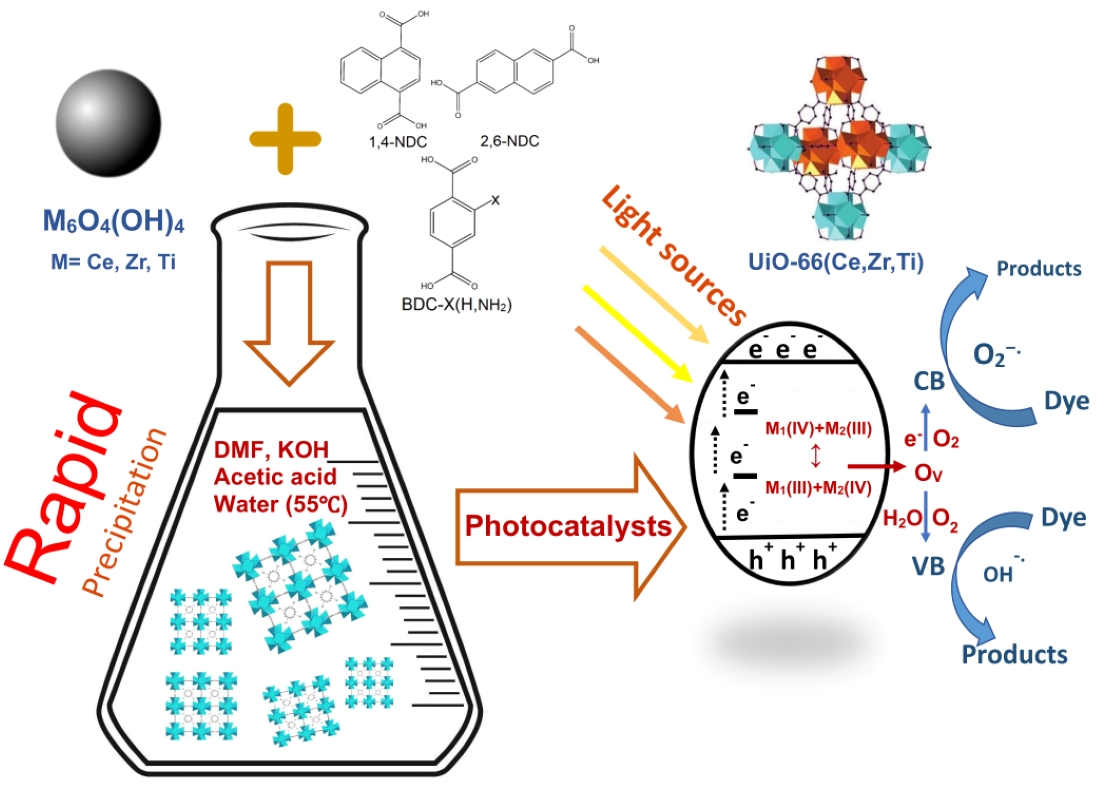
The Use of Rapid Precipitation to Synthesise Multivariate UiO-66 Metal–Organic Frameworks for Photocatalysis


Abstract
:
1. Introduction
2. Results
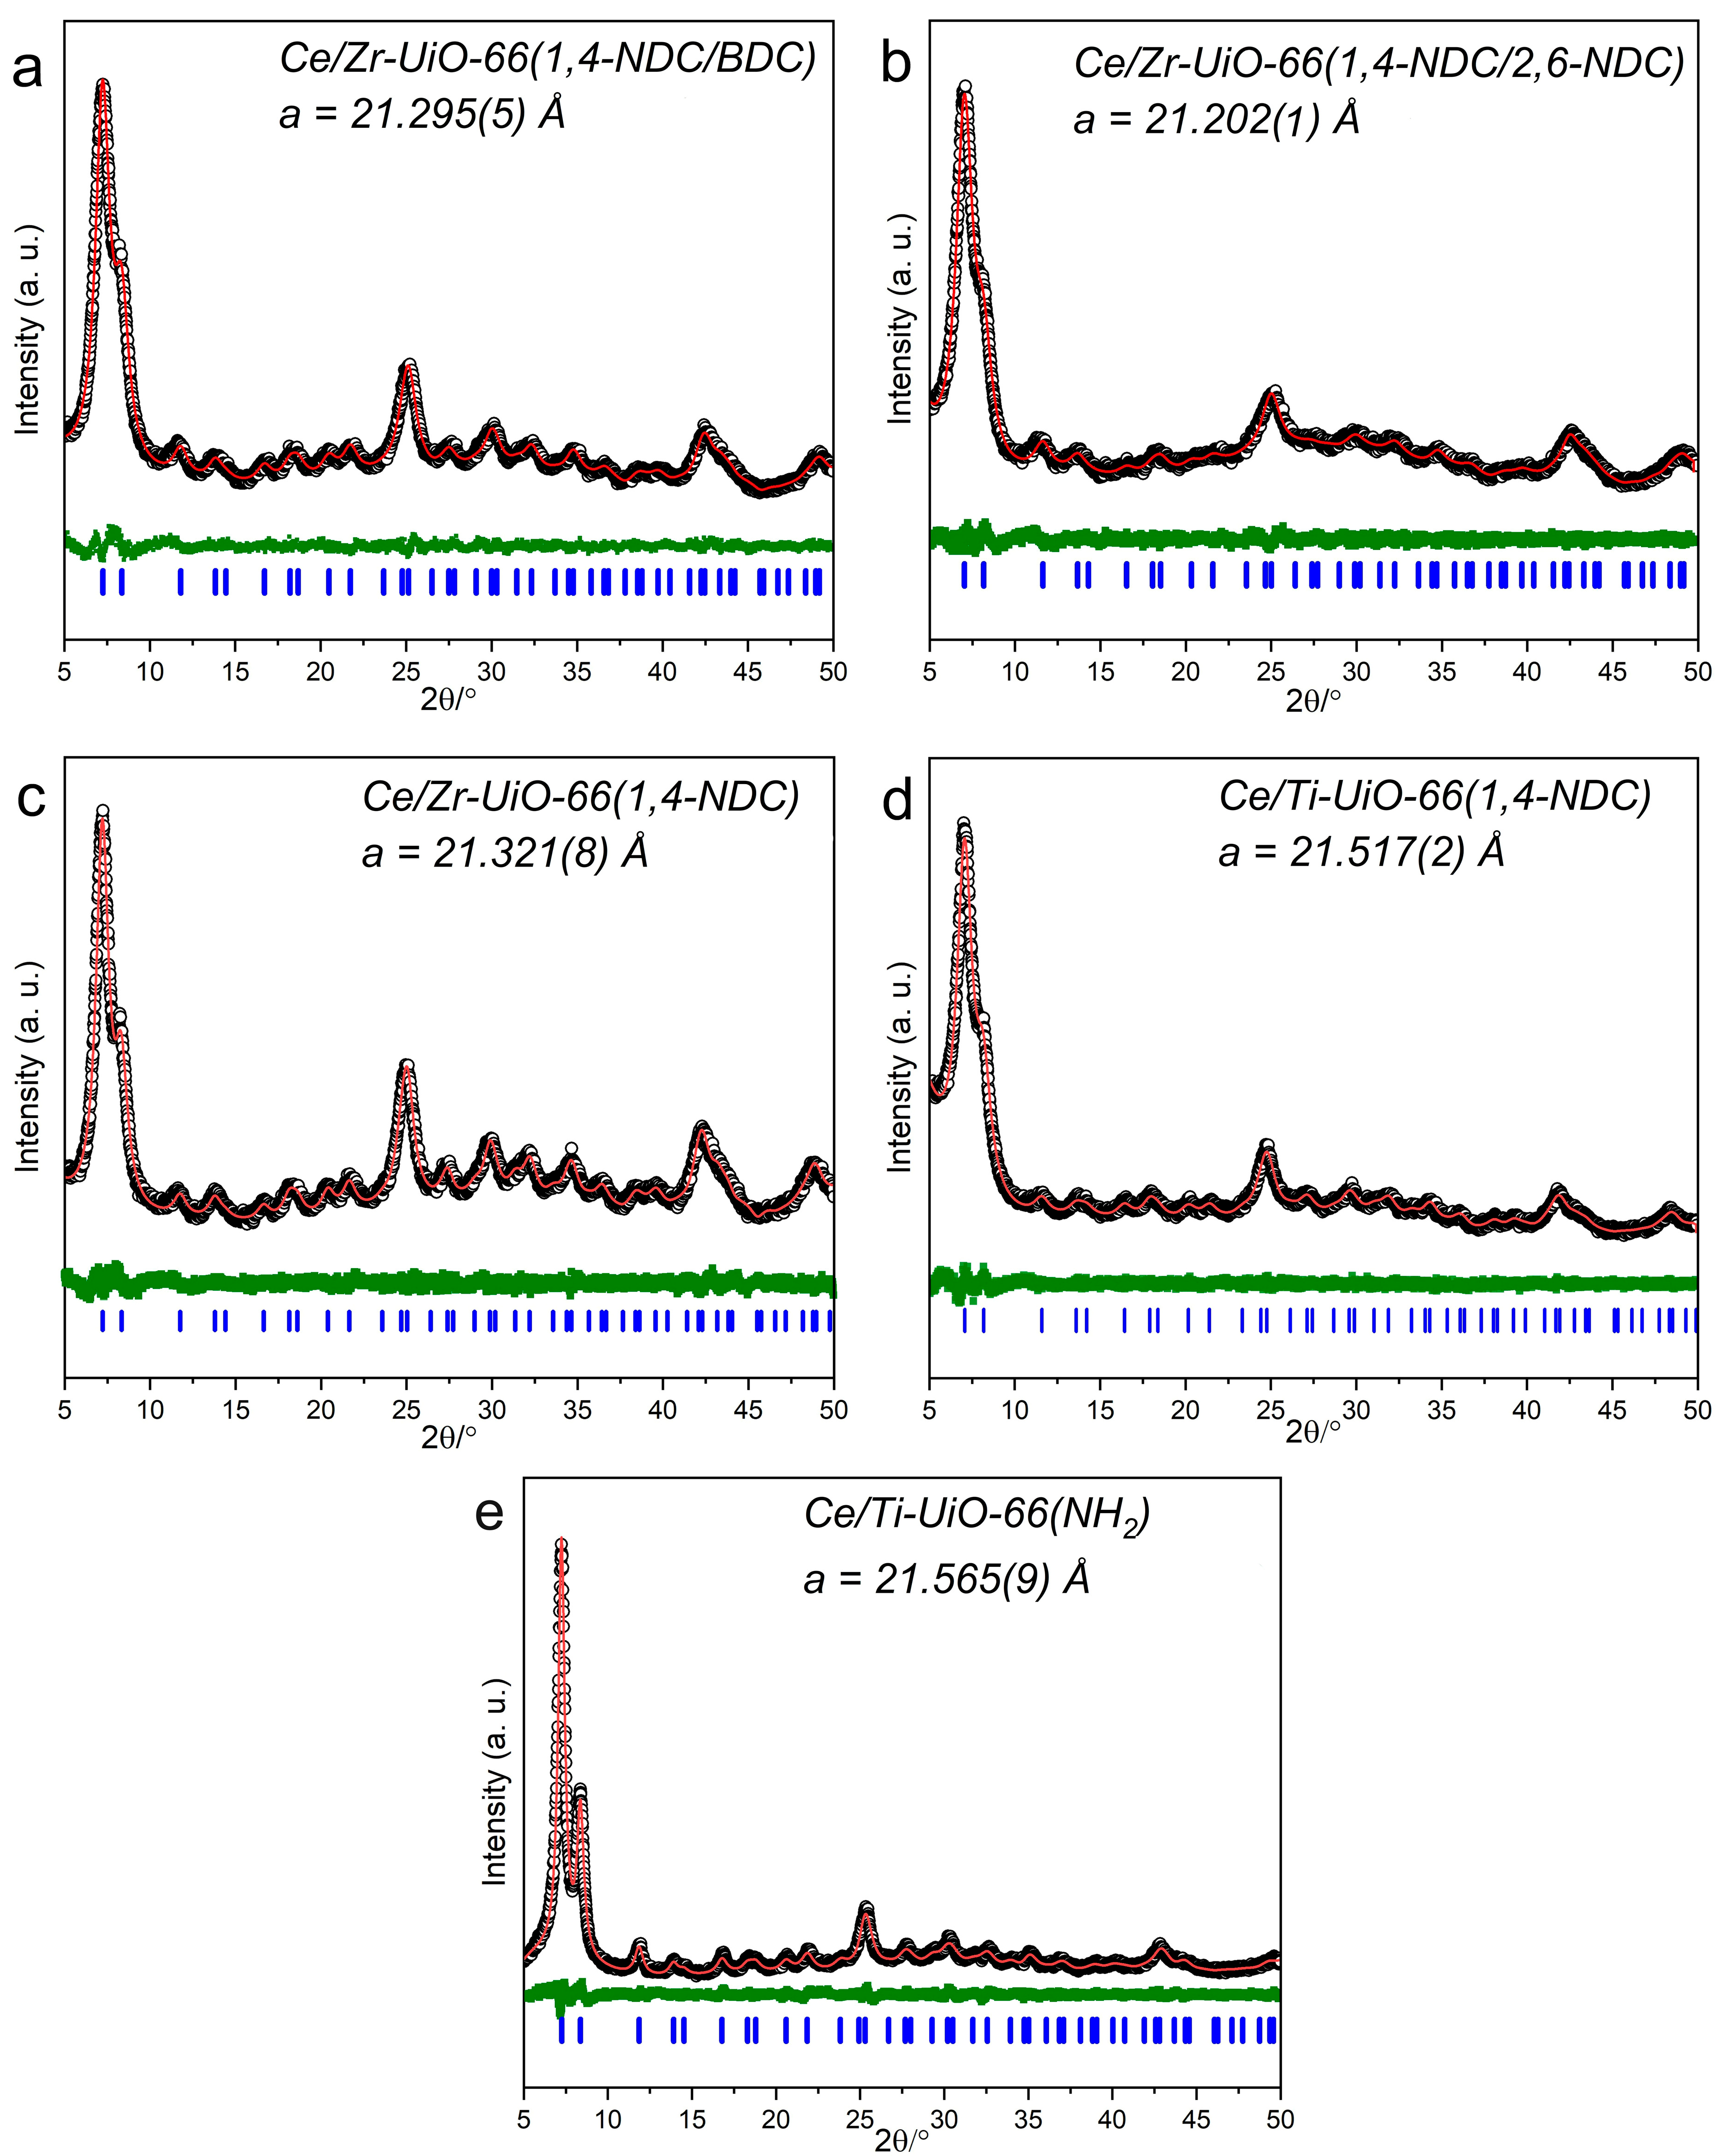
2.1. Analysis of Powder XRD
2.2. TGA
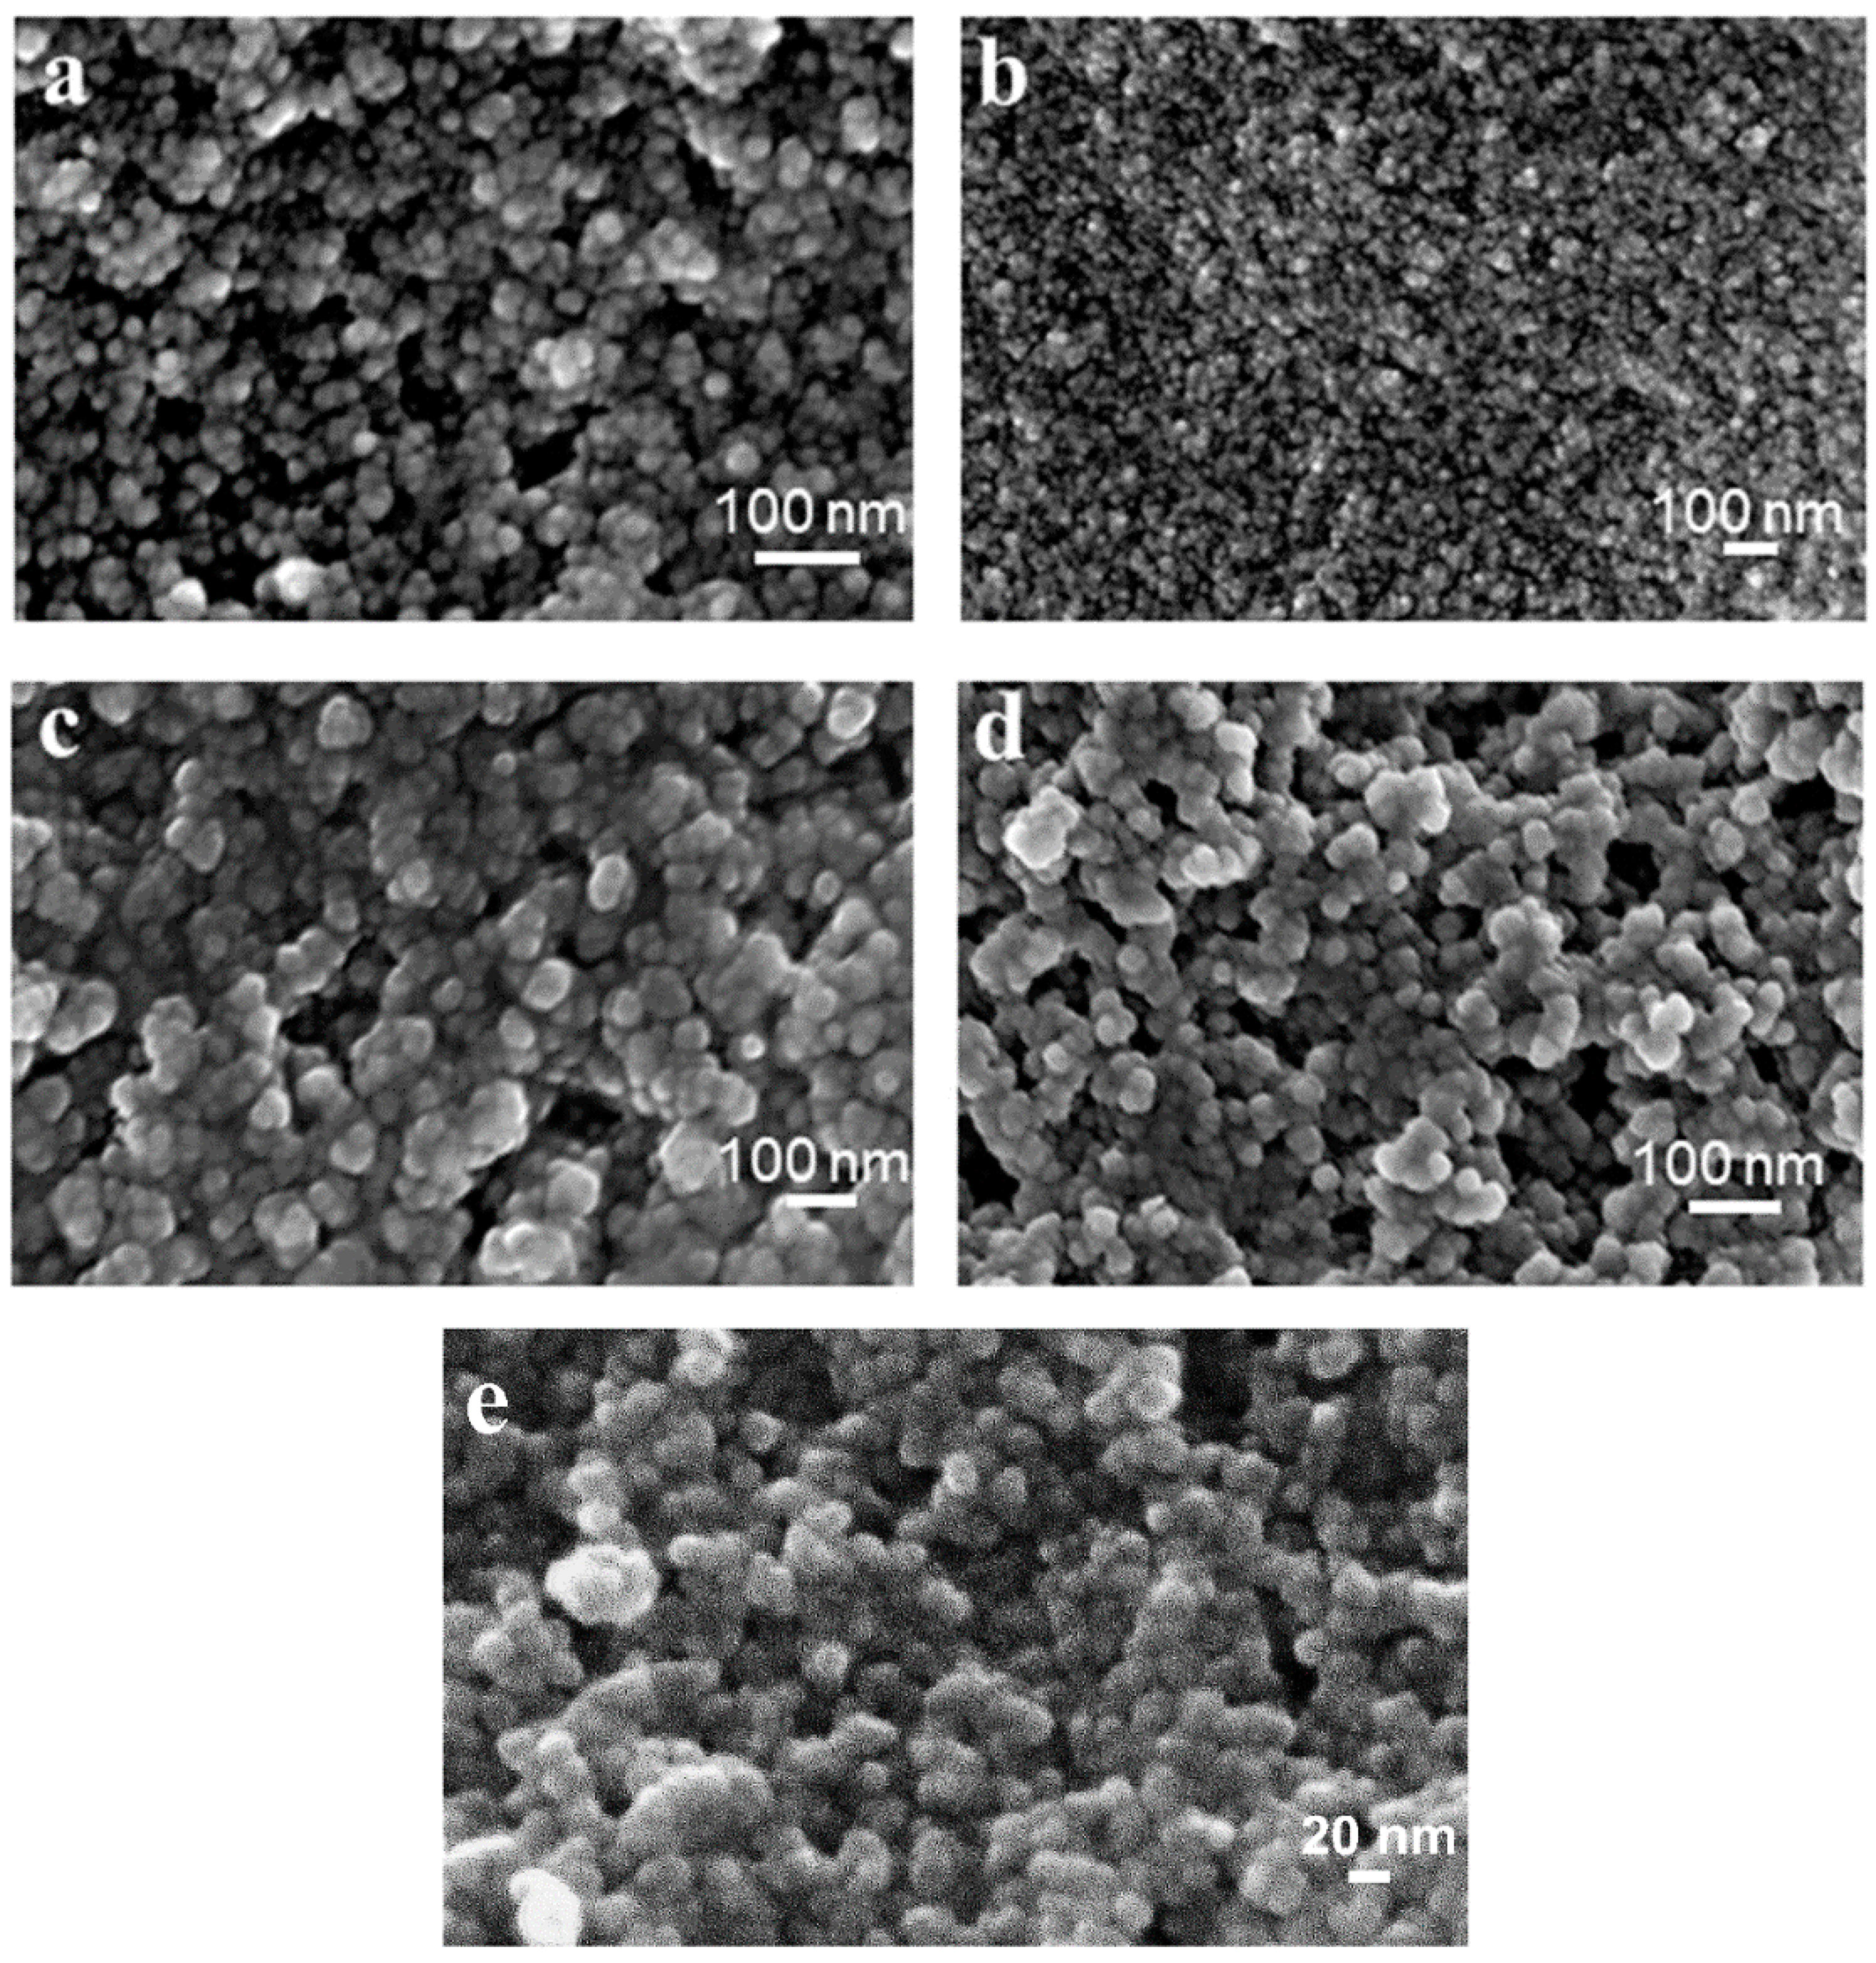
2.3. SEM Images
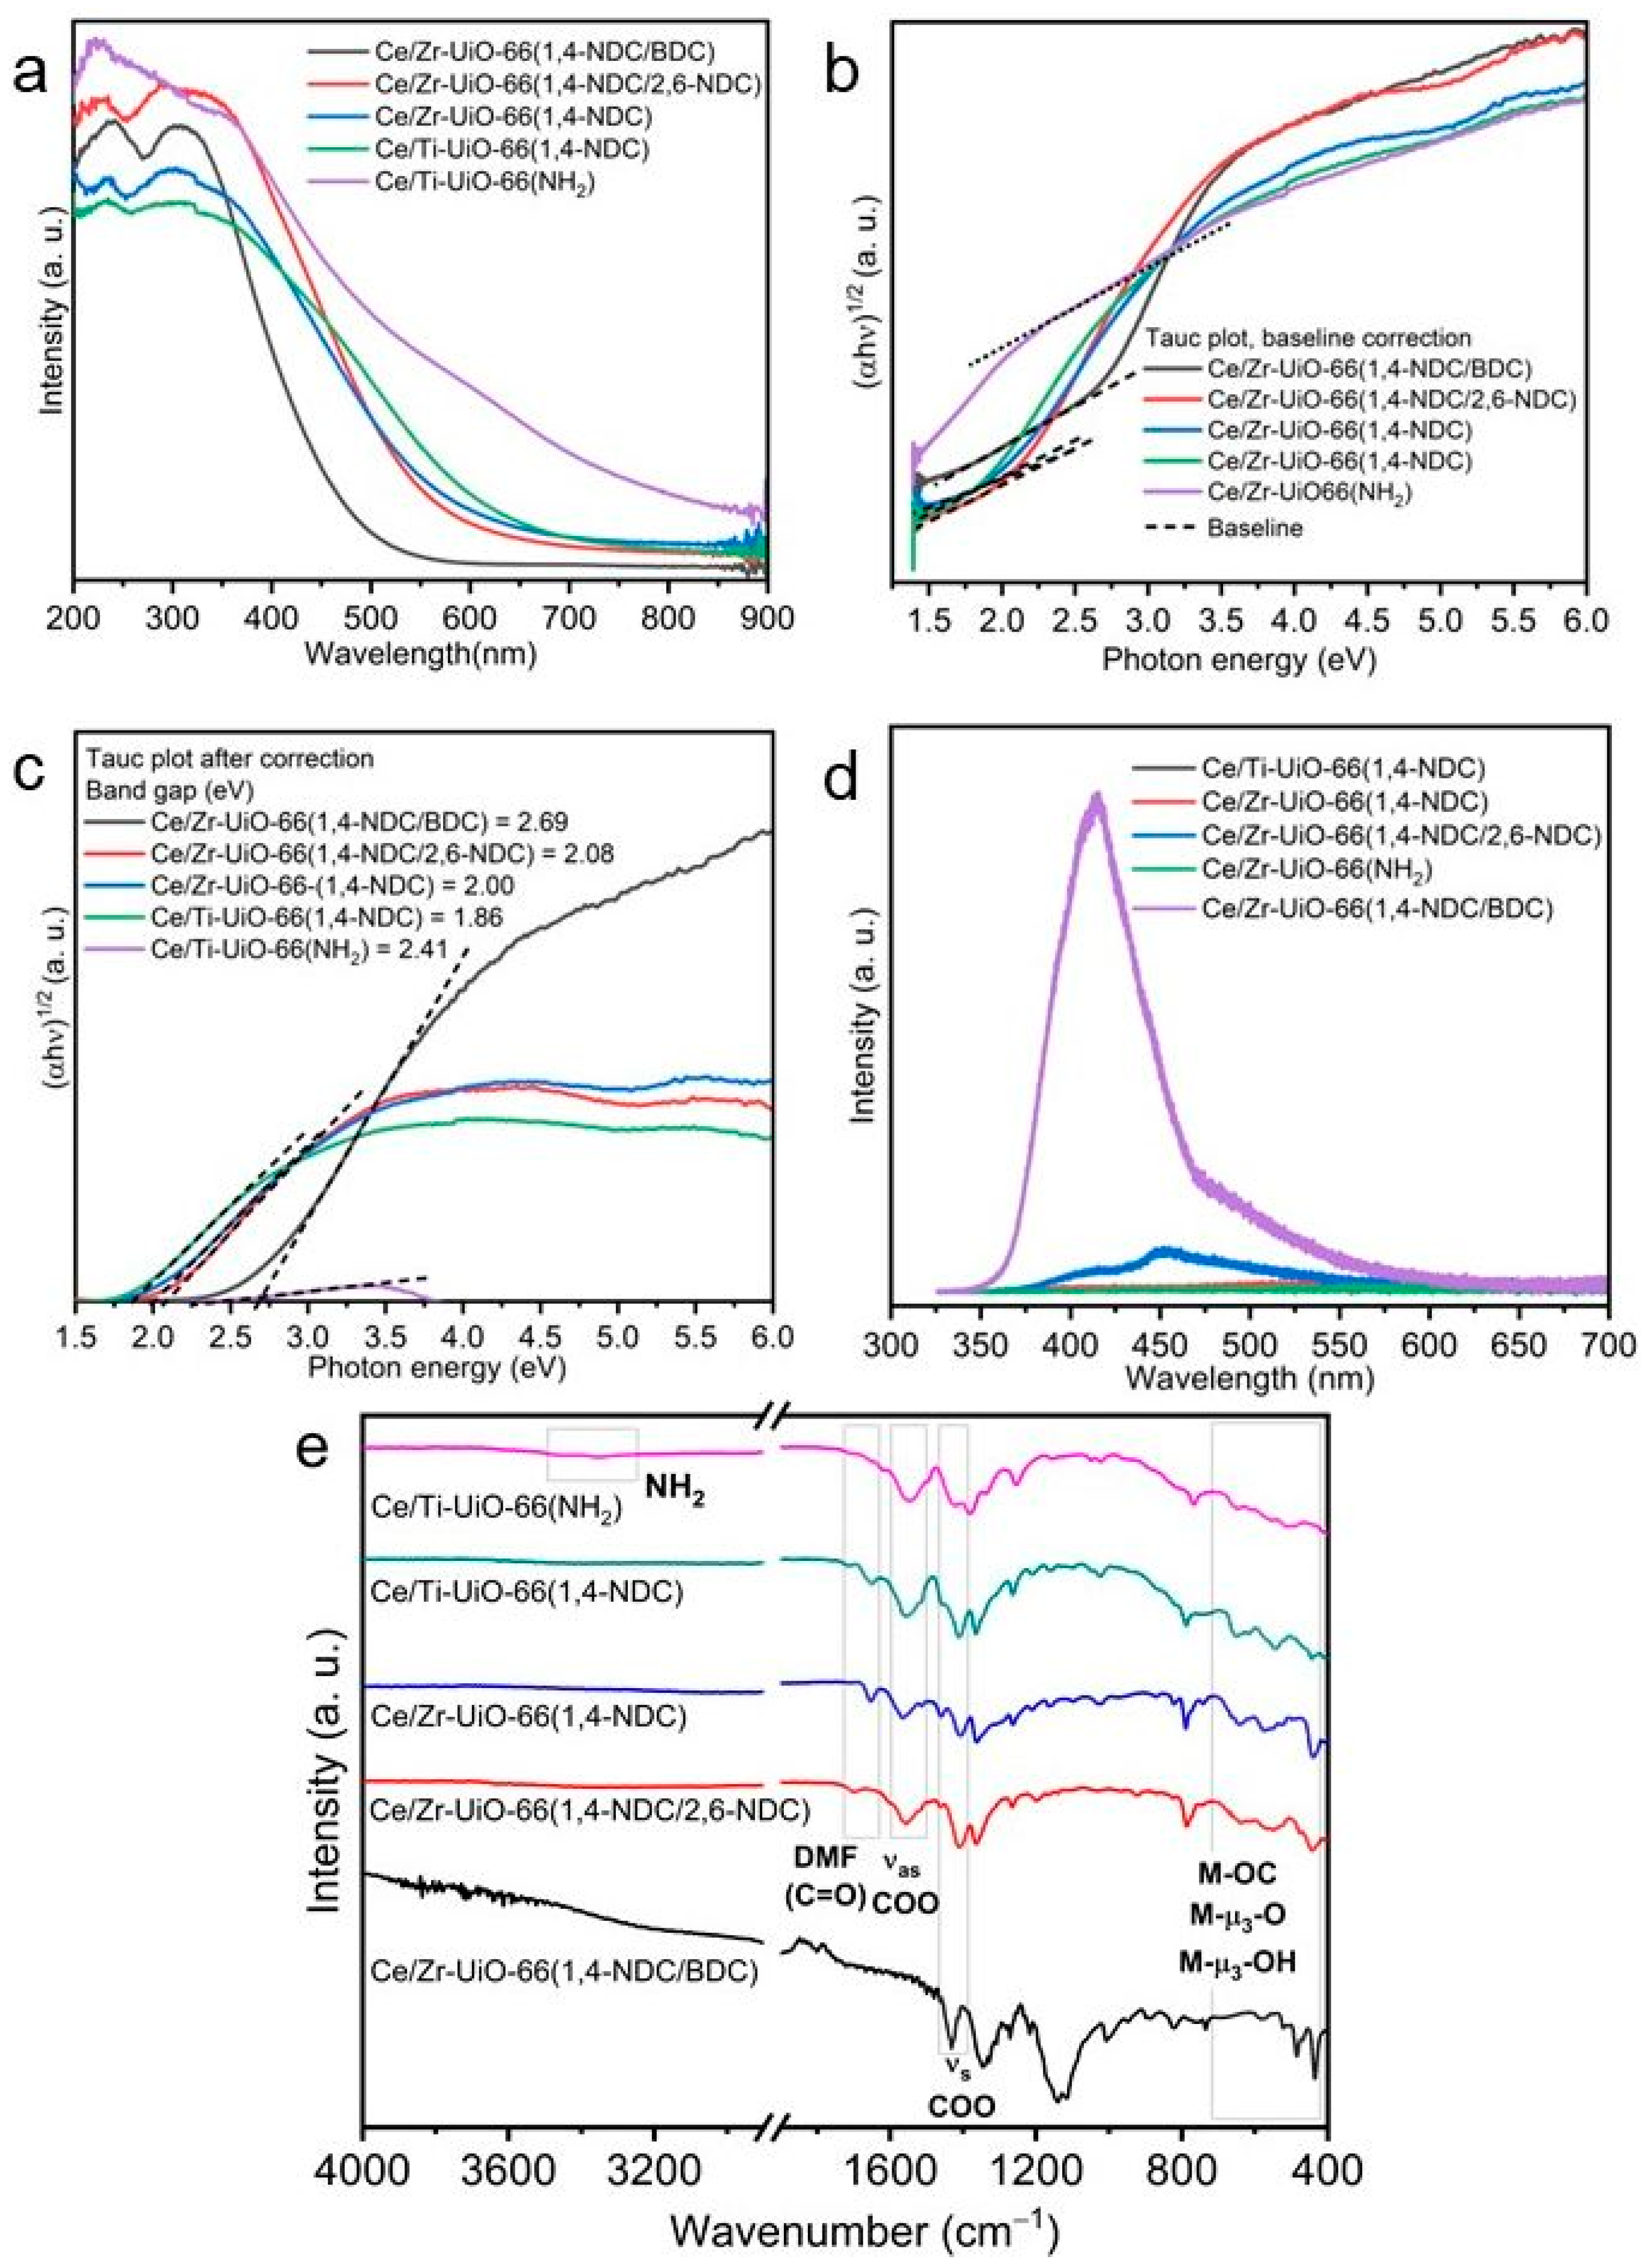
2.4. Optical Properties
2.4.1. DR/UV-Vis Spectroscopy
2.4.2. Estimating the Band Gap from the Tauc Plot
2.4.3. PL Spectroscopy
2.5. FT-IR Spectroscopy
2.6. Surface Area
2.7. Surface Analysis of Electronic Structure of MTV-MOFs
2.8. Adsorption
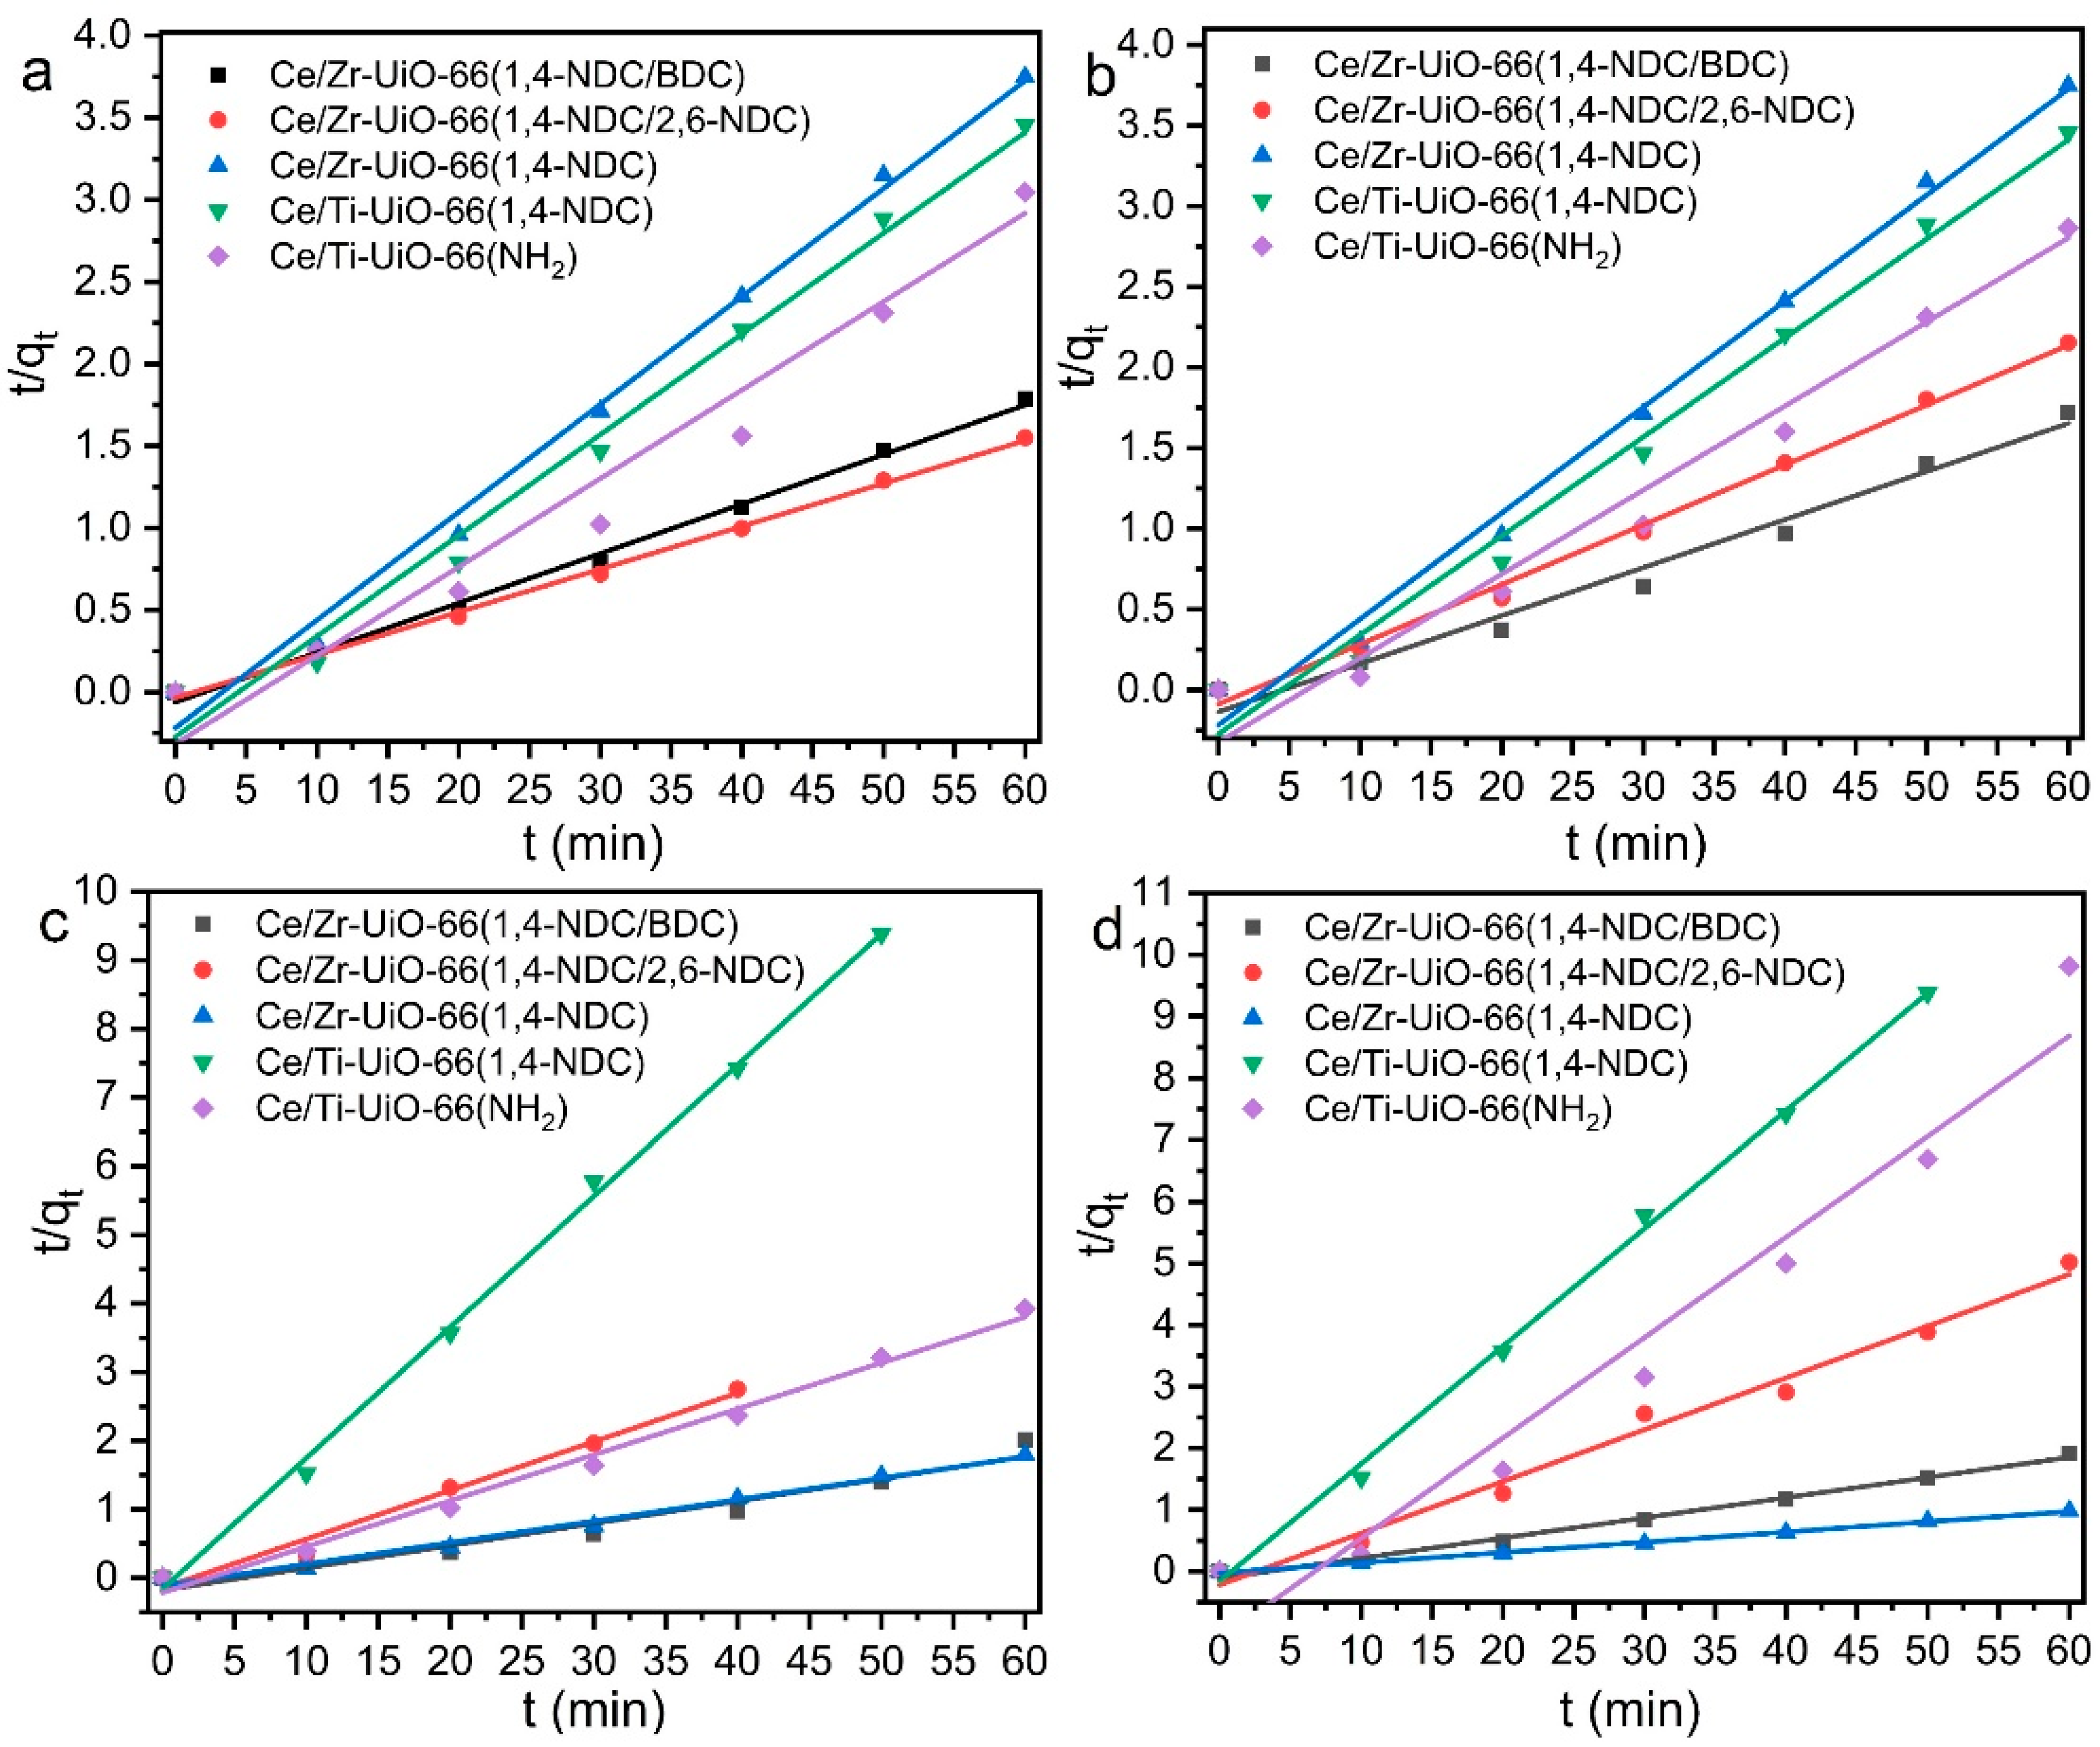
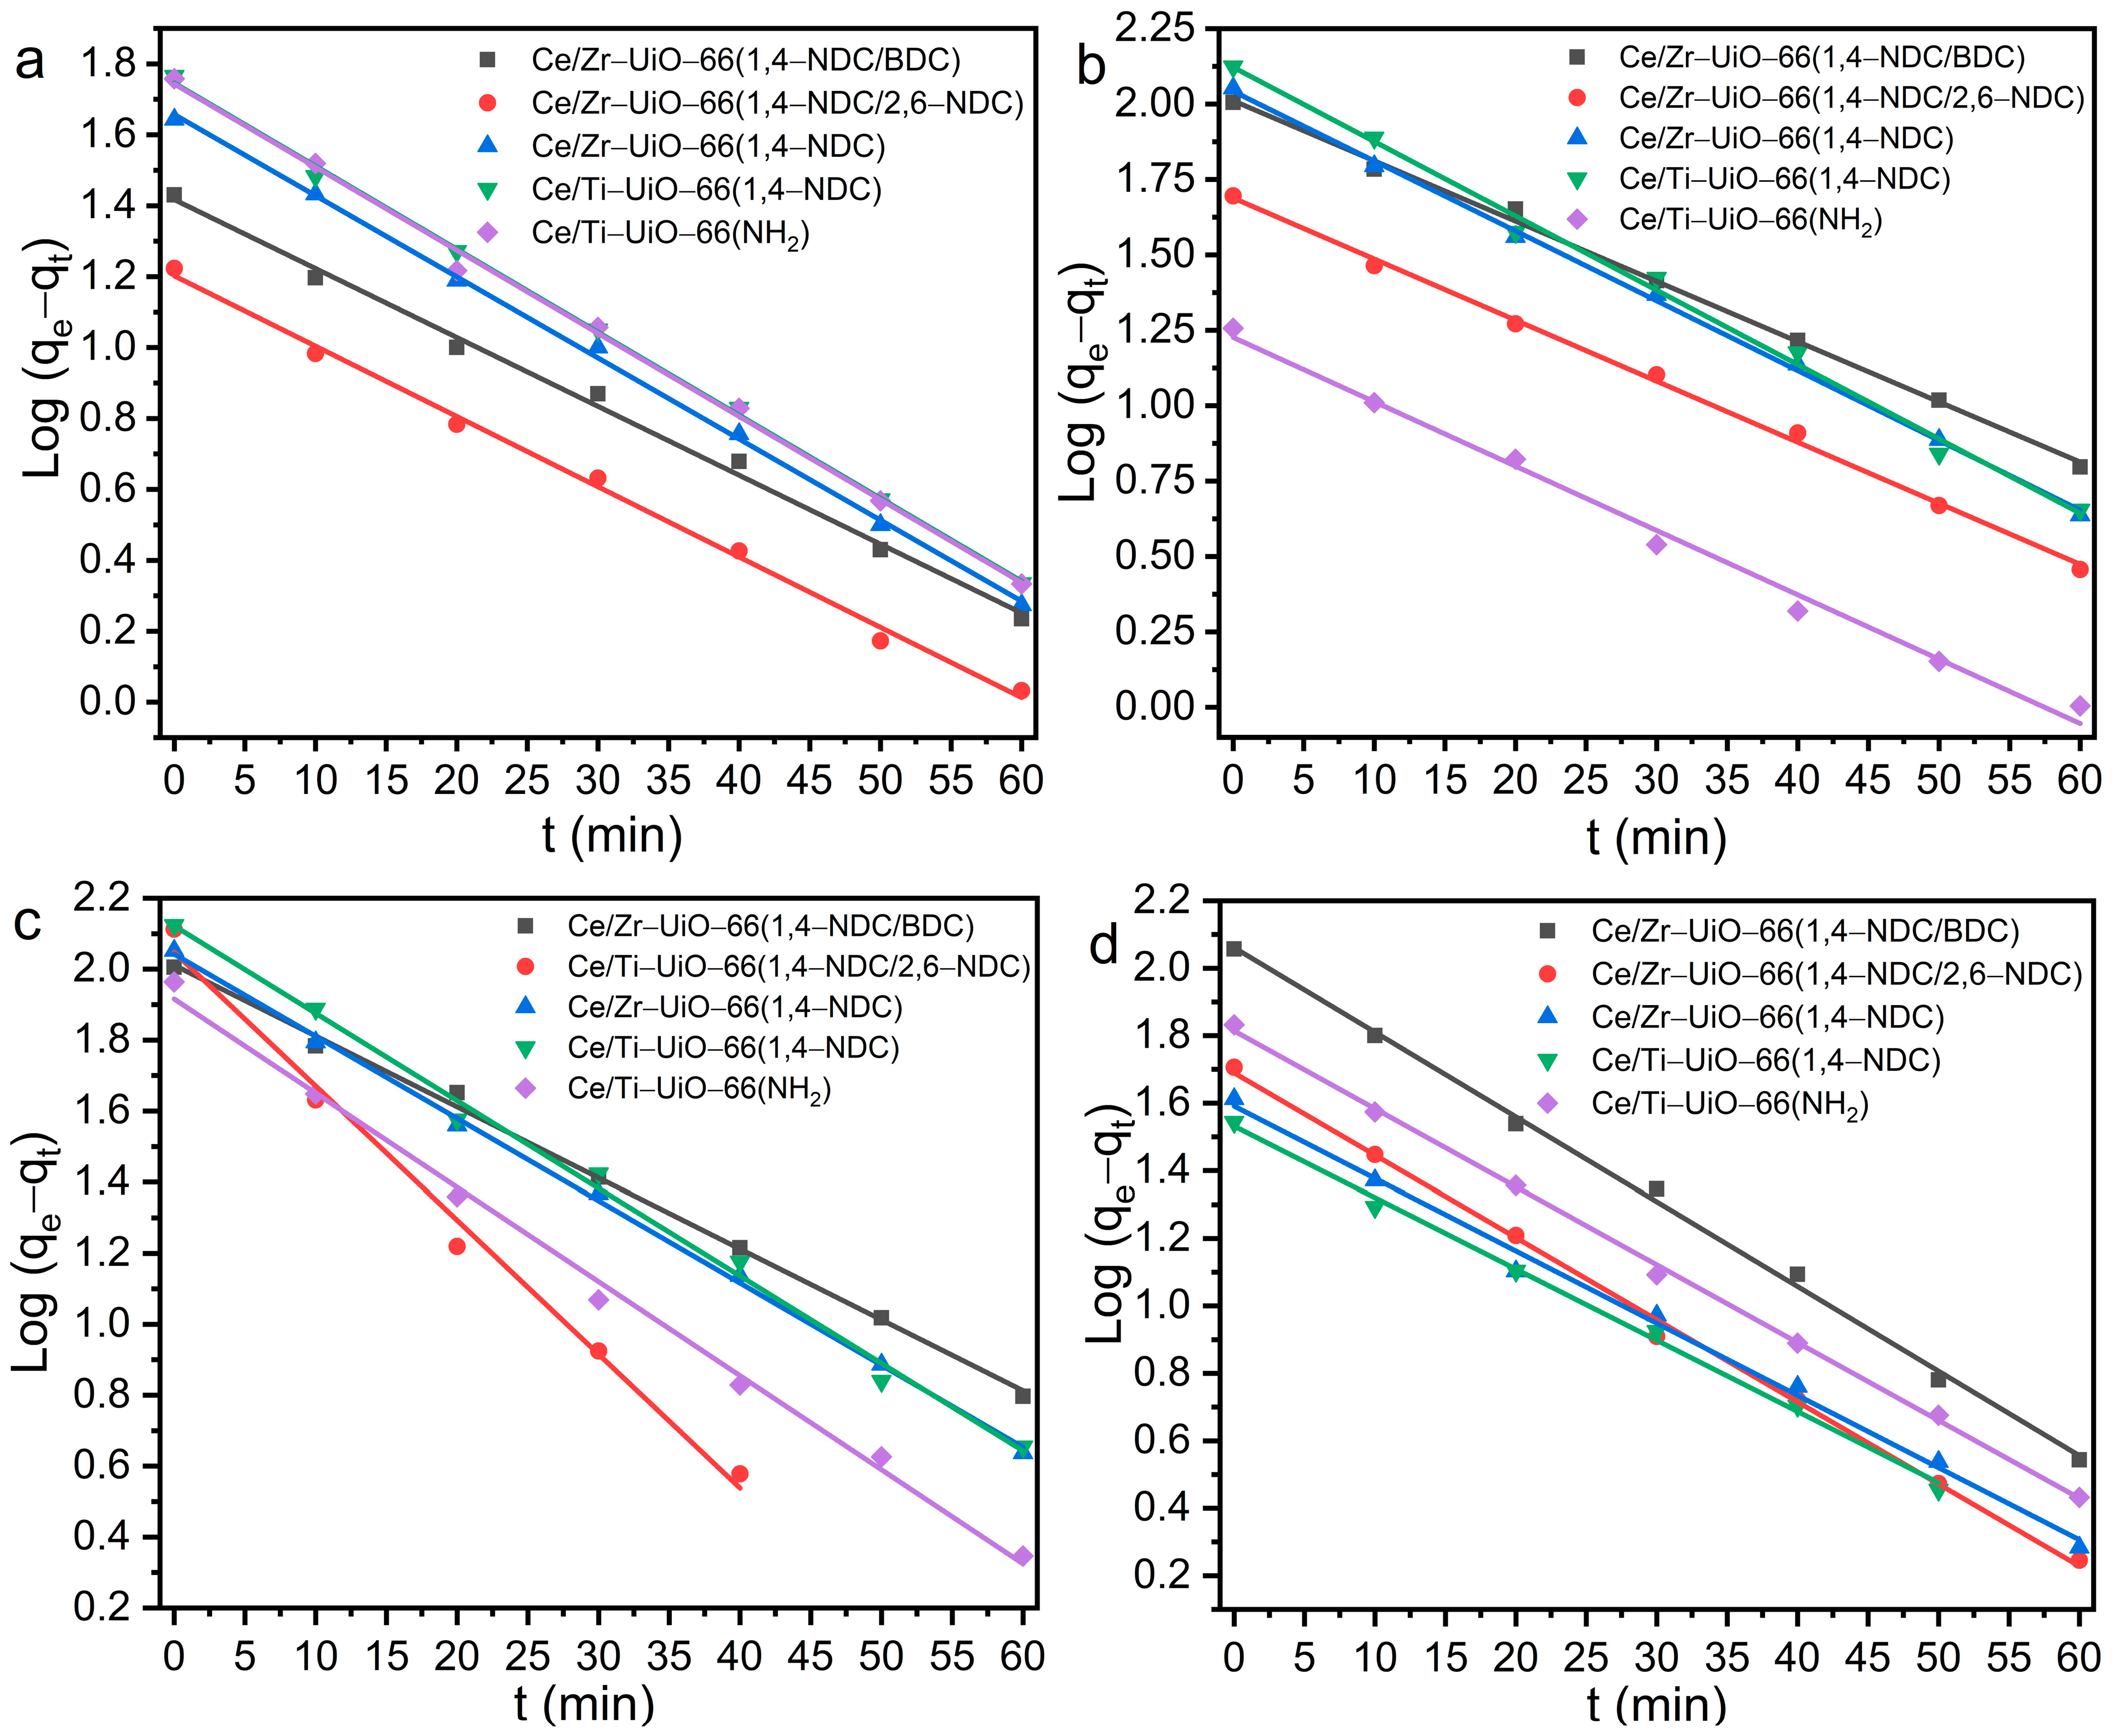
2.9. Kinetic Modeling of Adsorption
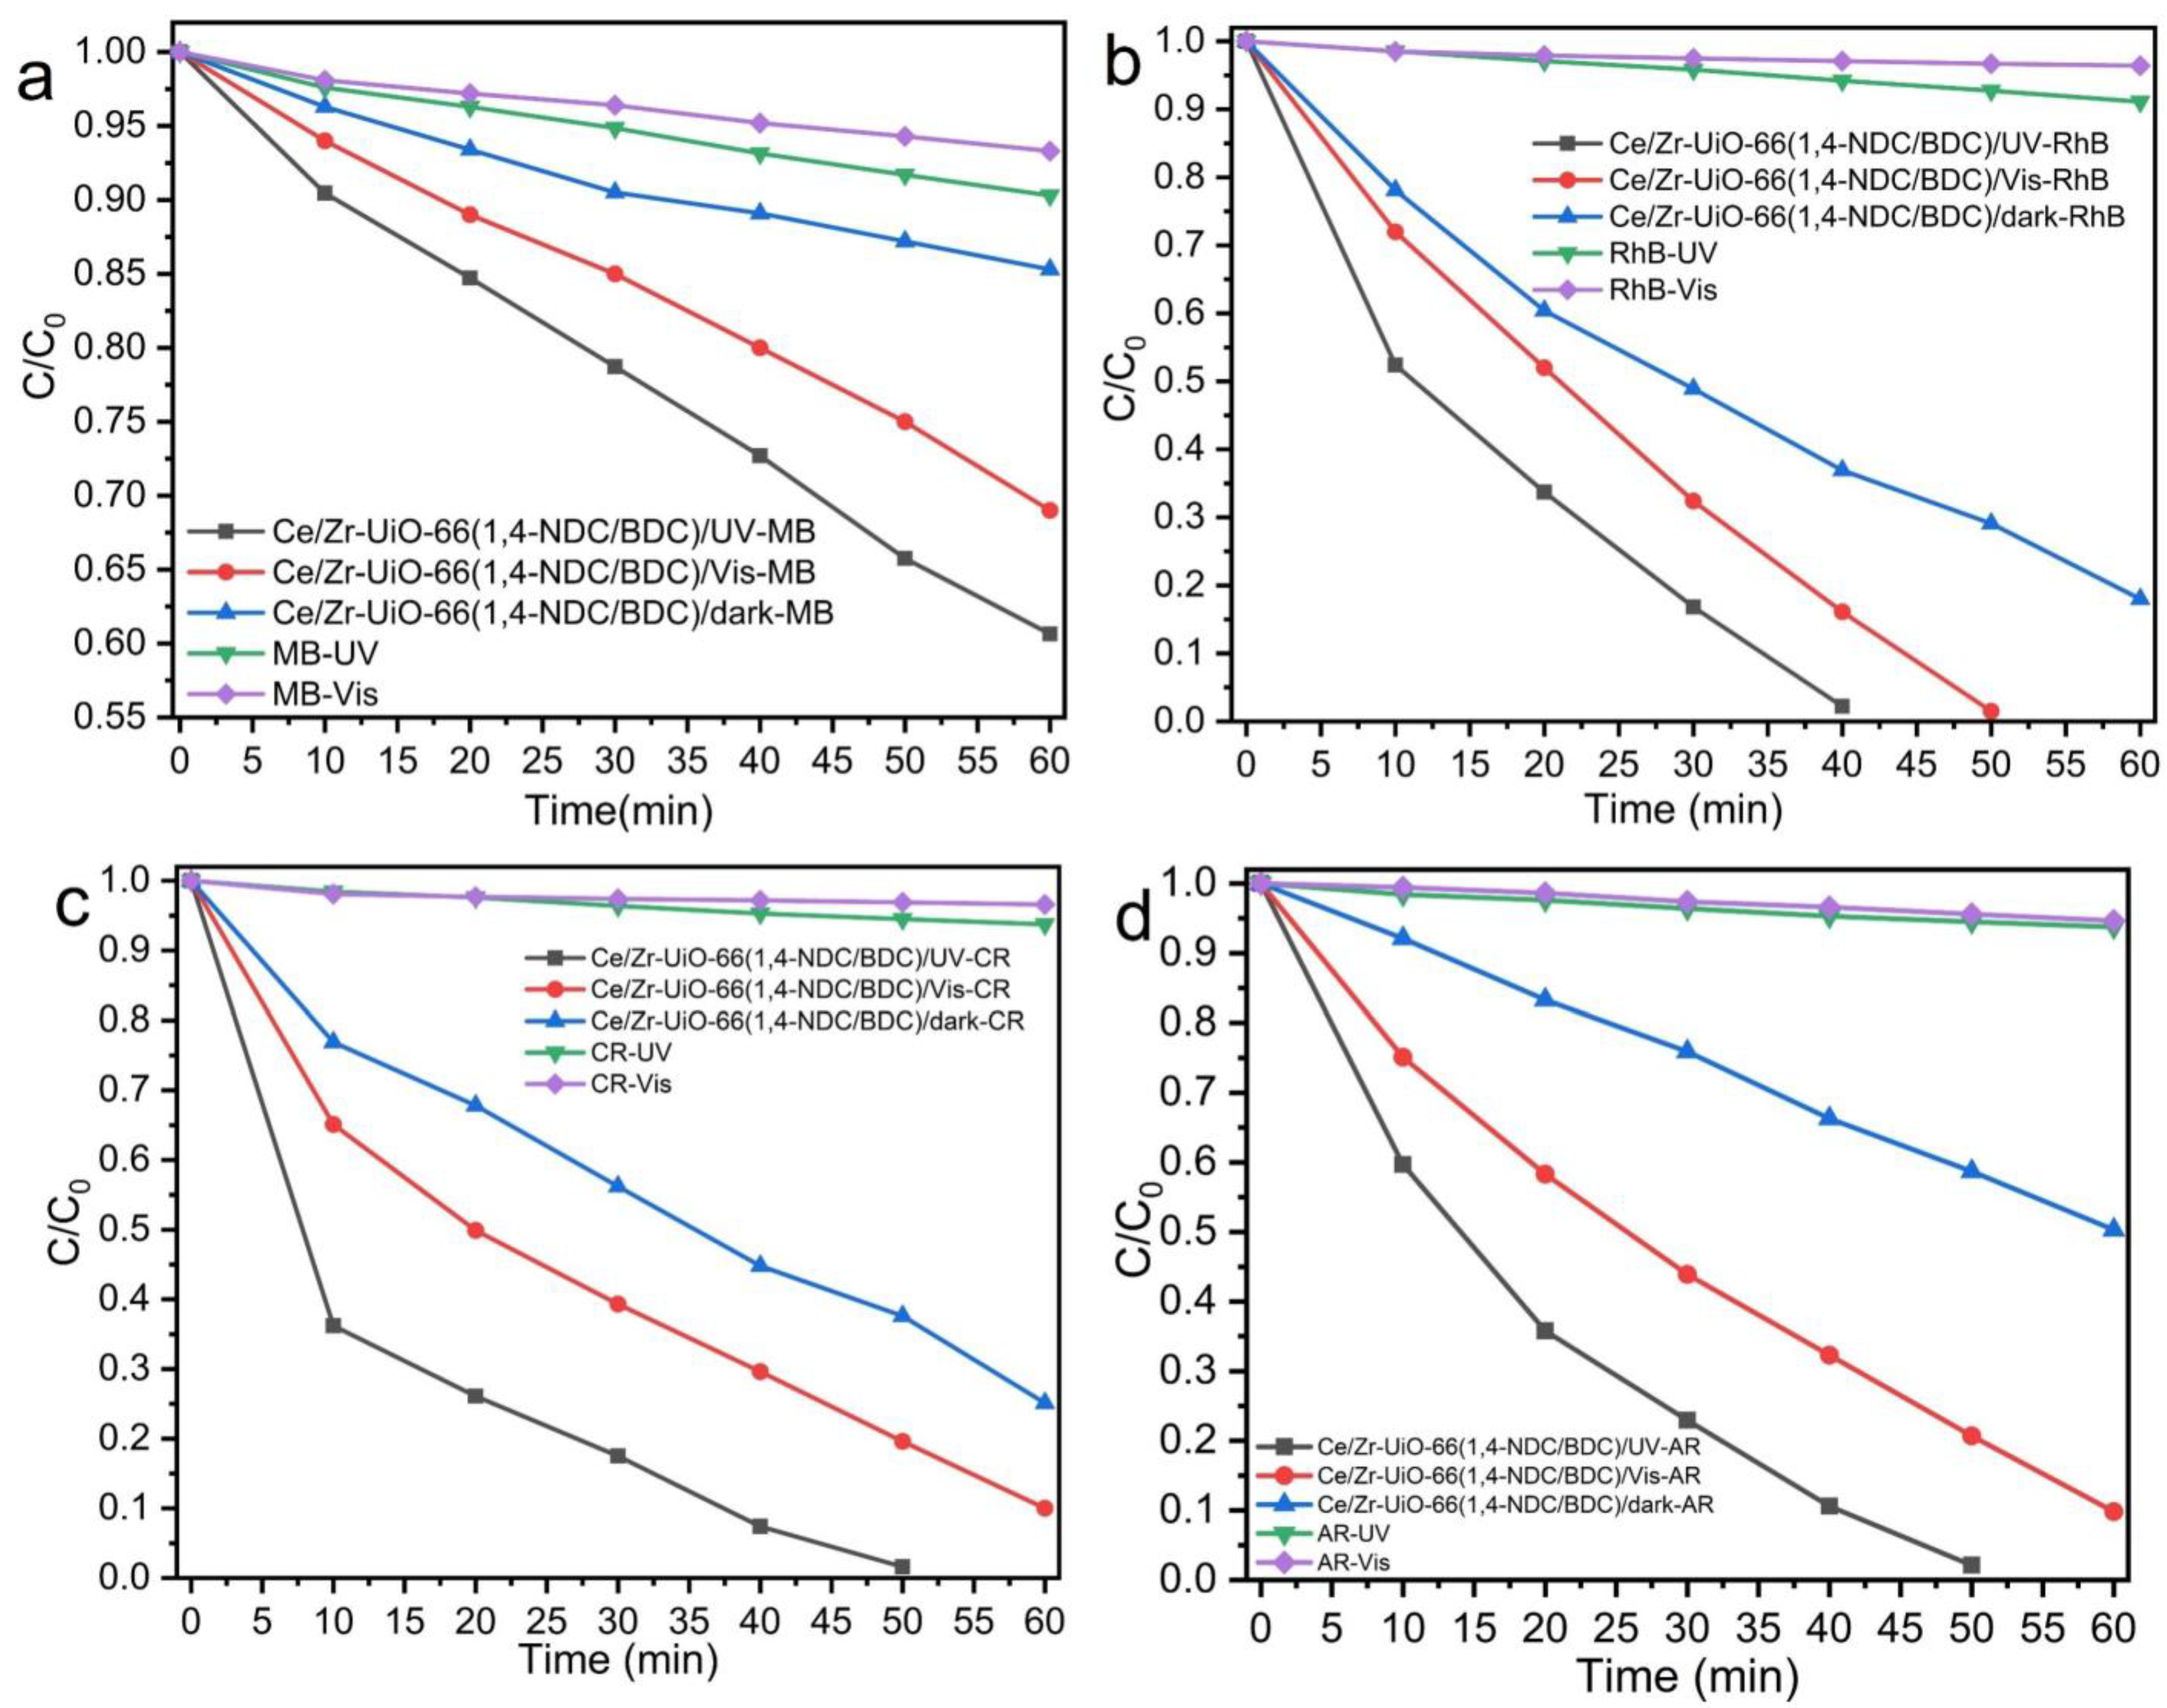
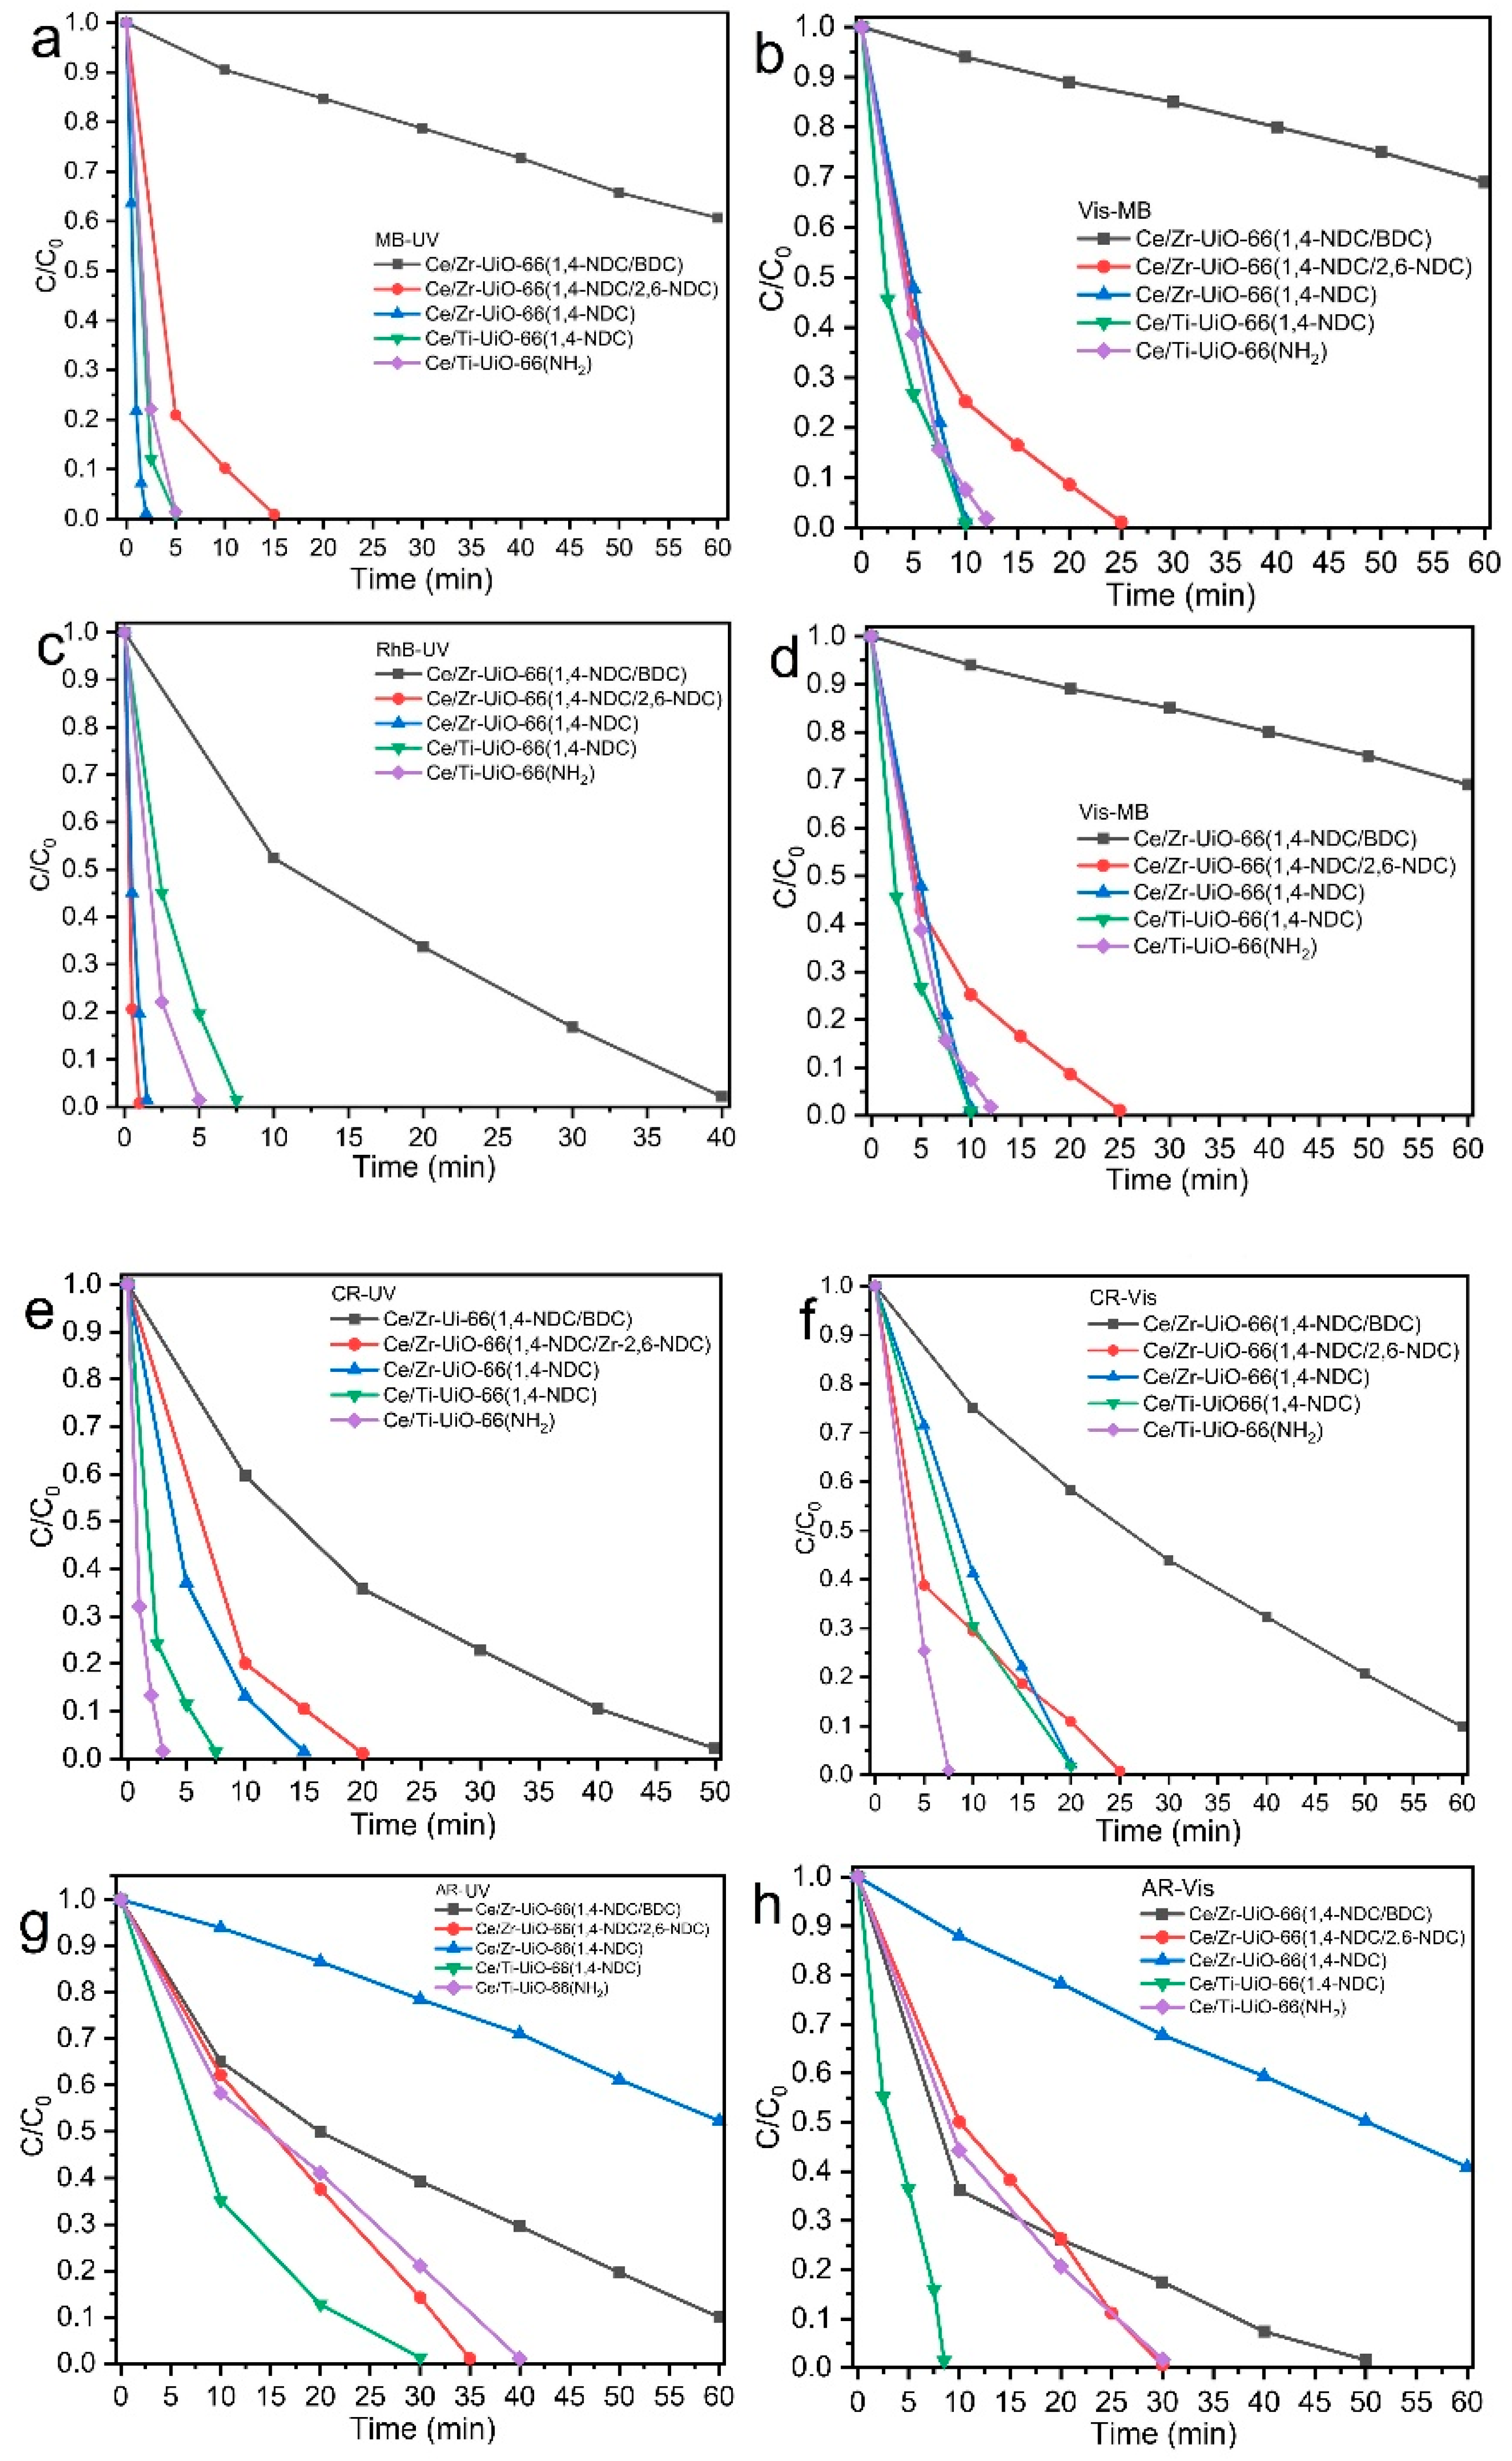
2.10. Photocatalytic Activities
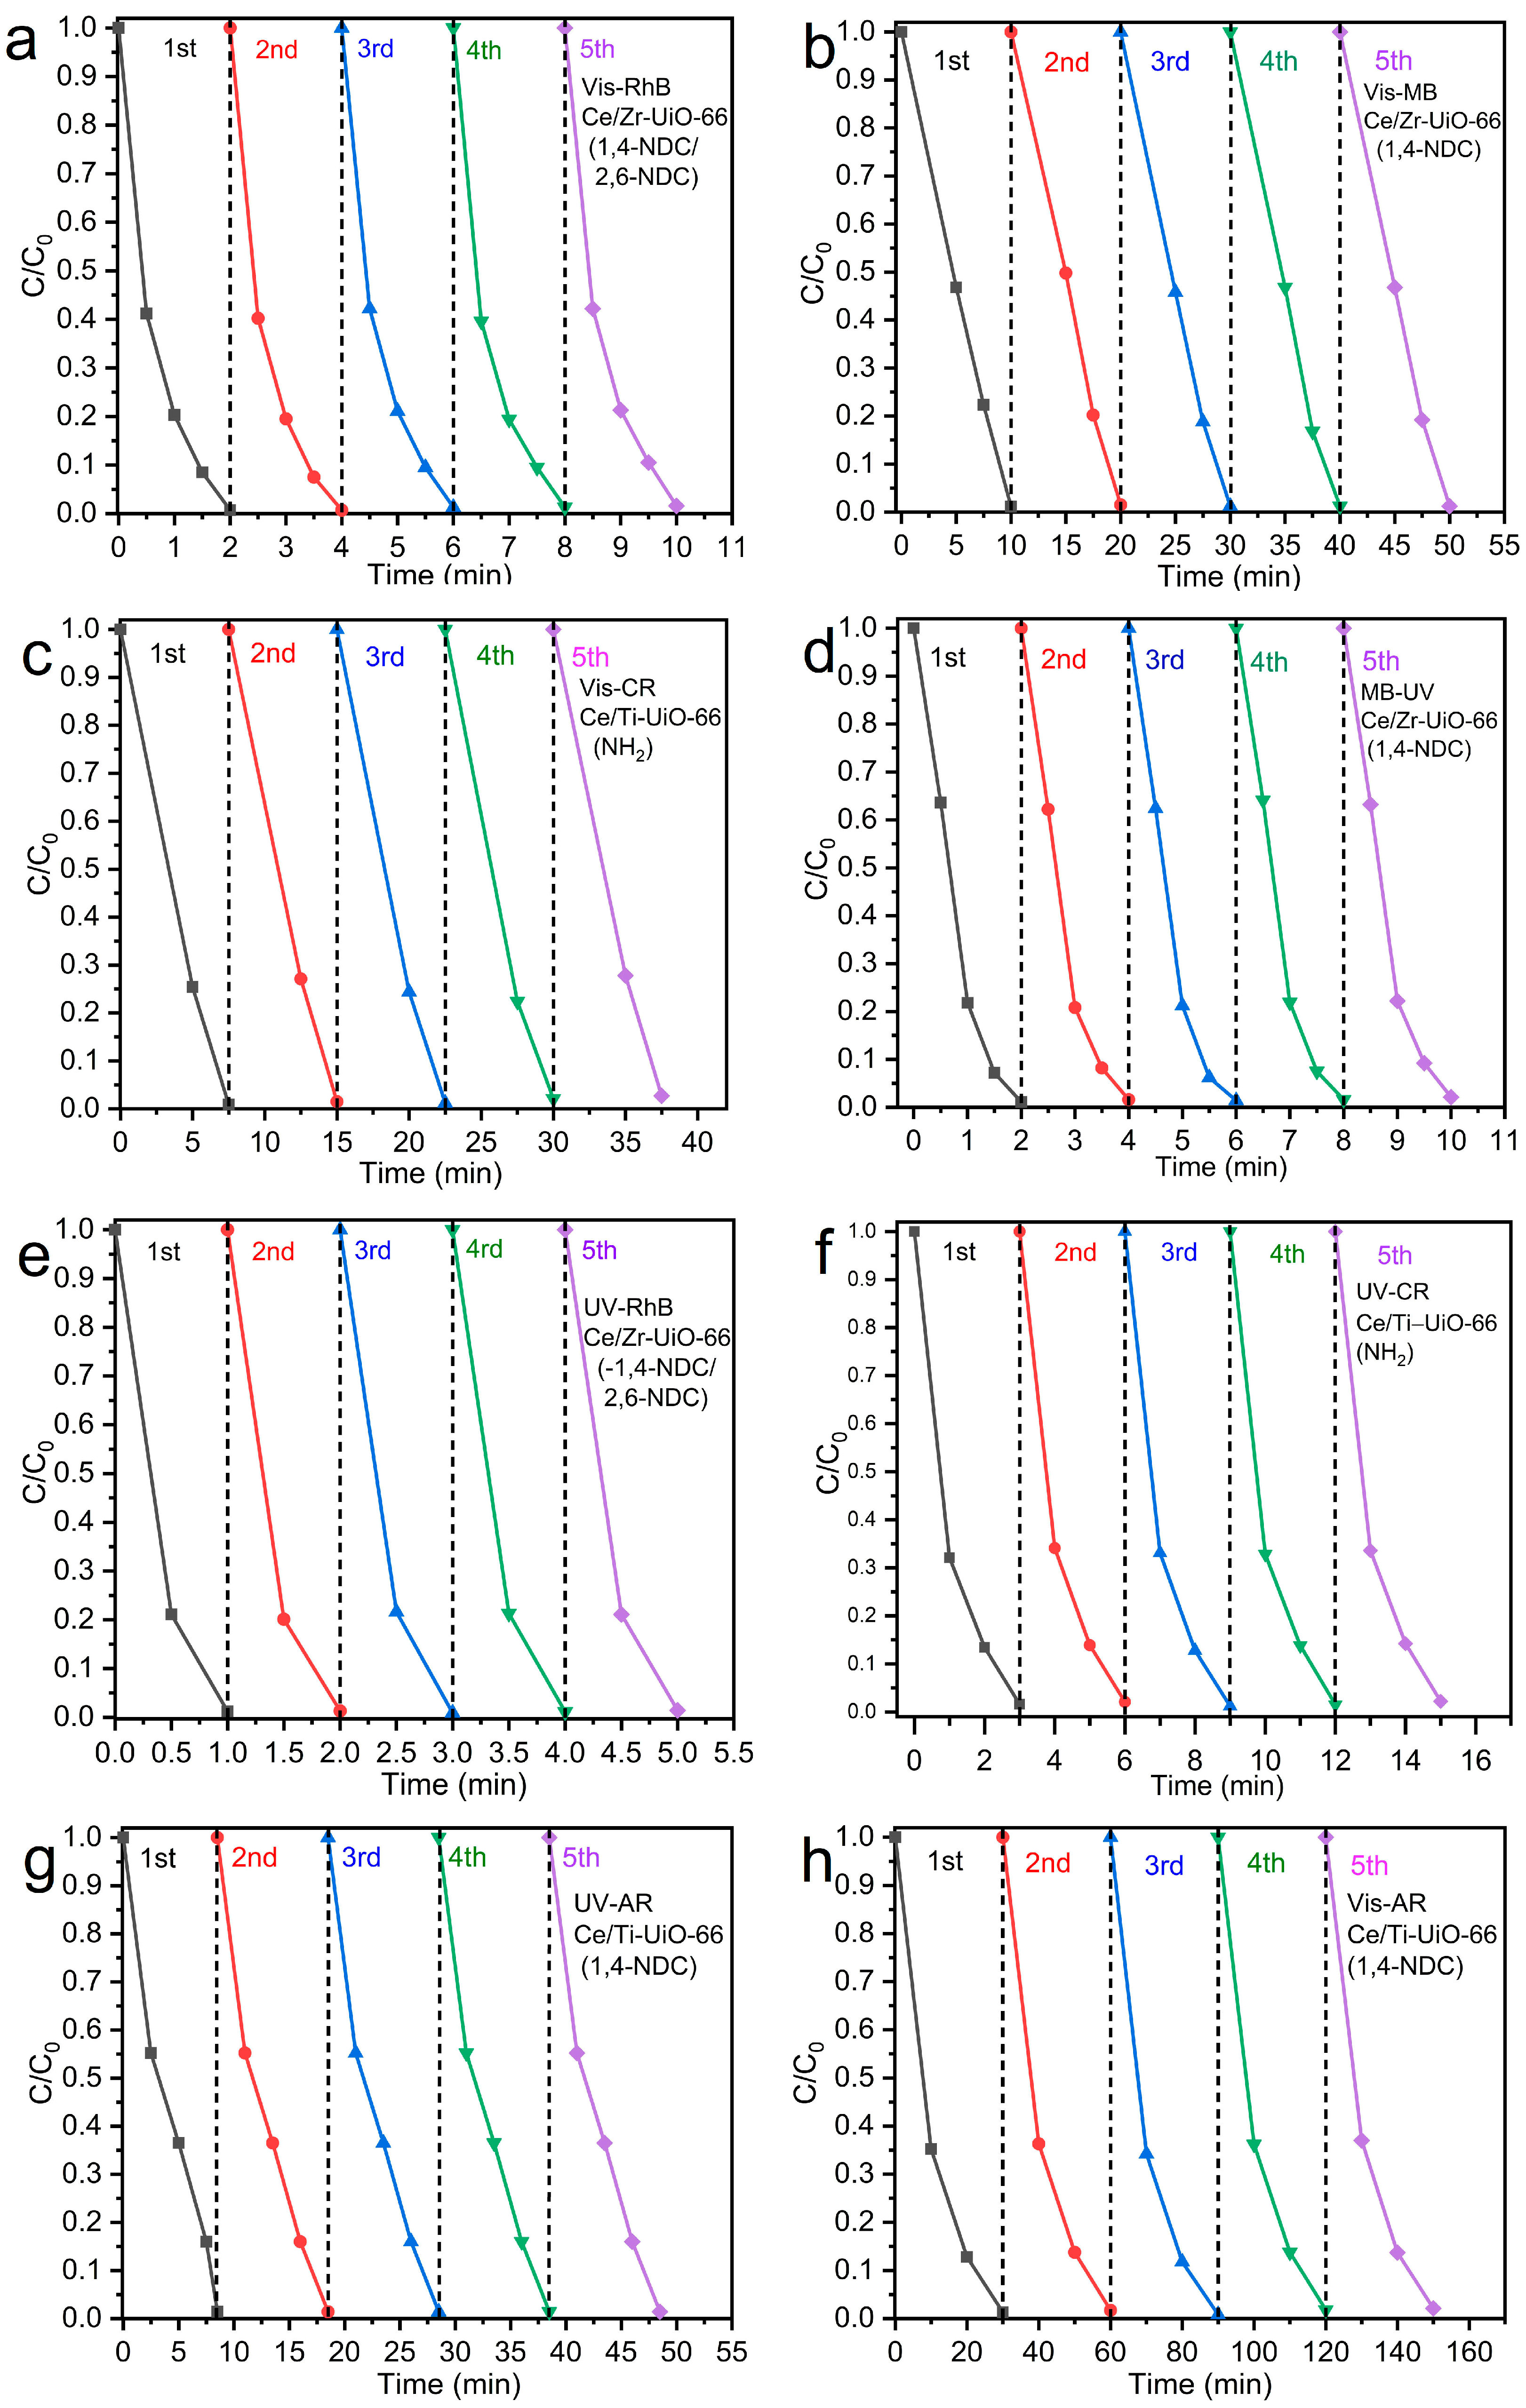
2.11. Recyclability
3. Materials and Methods
3.1. Sample Preparation
3.1.1. Materials
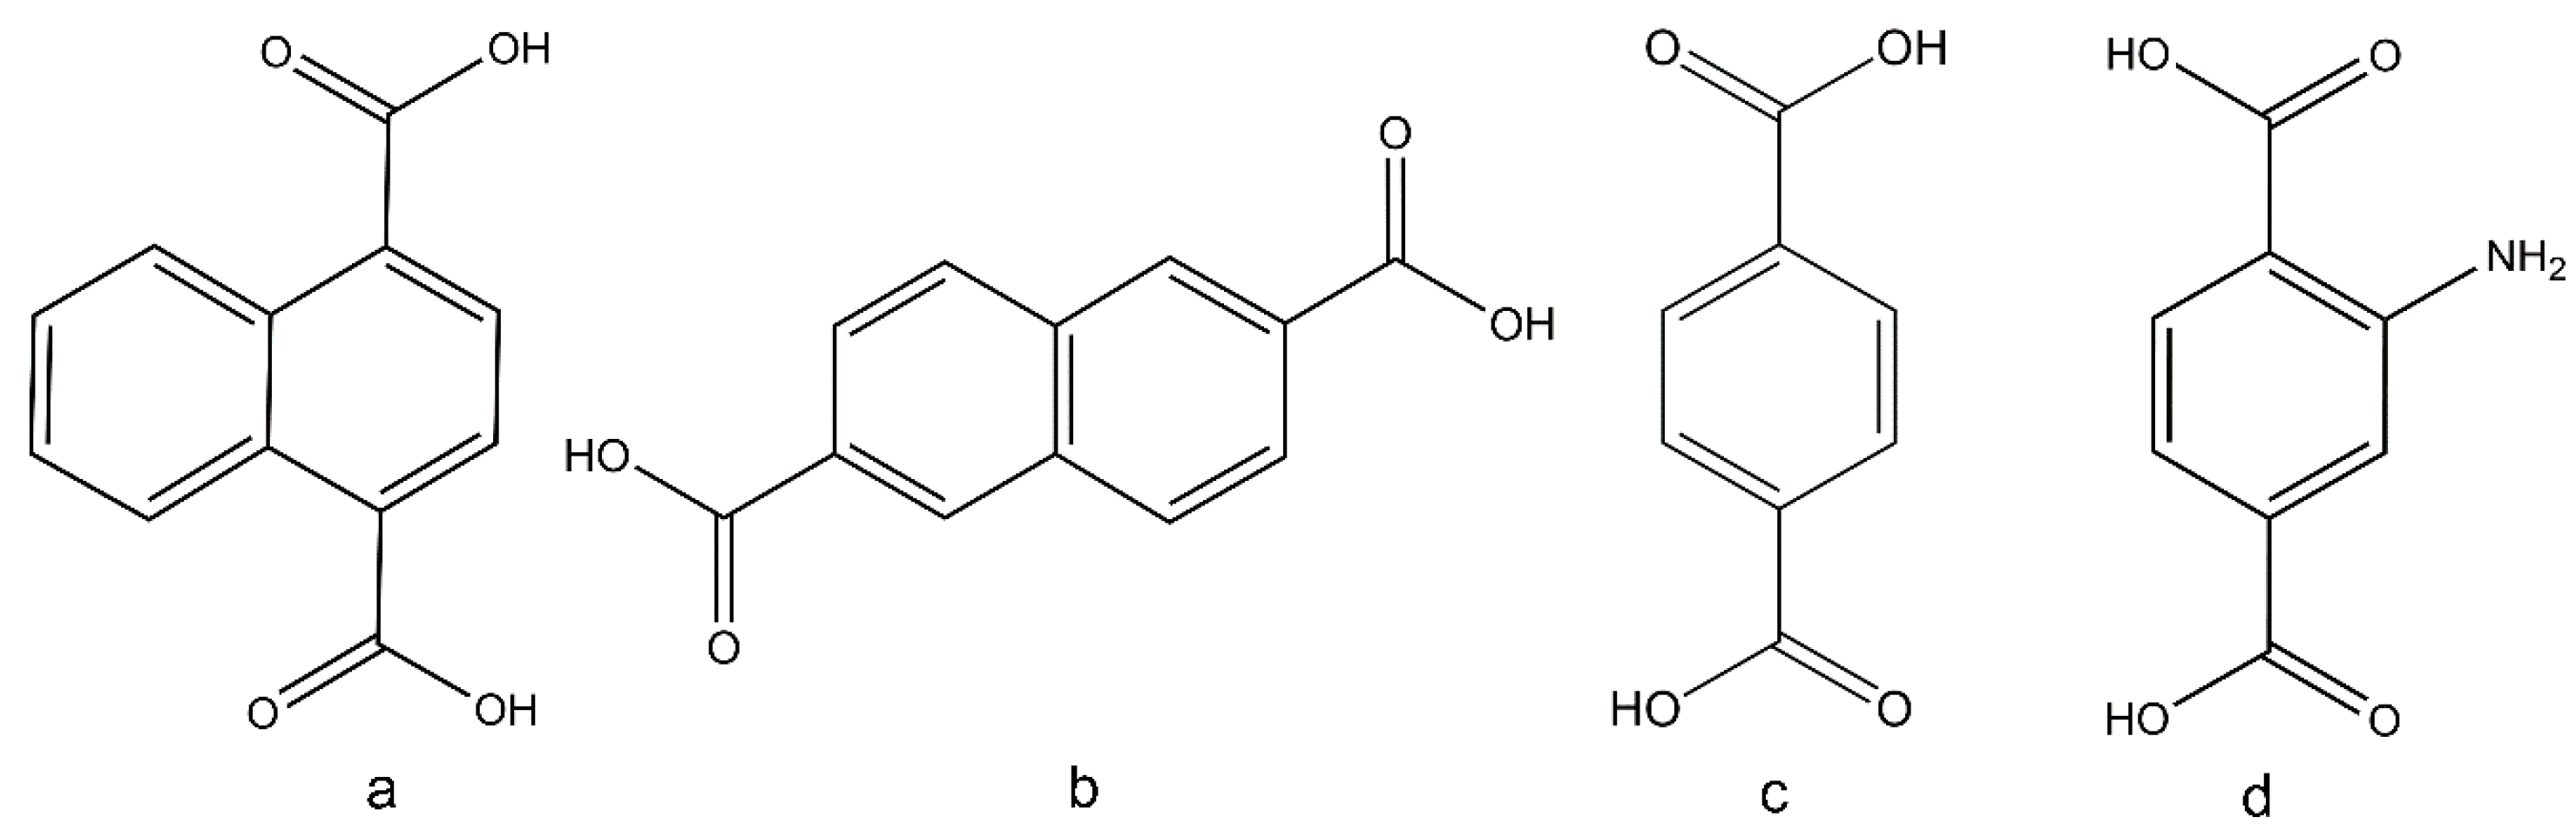
3.1.2. Preparation of MTV-MOFs
- Ce/Zr-UiO-66(1,4-NDC/BDC)
- Ce/Zr-UiO-66(1,4-NDC/2,6-NDC)
- Ce/Zr-UiO-66(1,4-NDC)
- Ce/Ti-UiO-66(1,4-NDC)
- Ce/Ti-UiO-66(BDC-NH2)
3.2. Experimental Methods
3.2.1. Characterization and Analysis
3.2.2. Photodegradation Studies
4. Conclusions
Supplementary Materials
Author Contributions
Funding
Data Availability Statement
Acknowledgments
Conflicts of Interest
References
- Zhe, J.; Tong, L.; Yaghi, O.M. Sequencing of Metals in Multivariate Metal-organic Frameworks. Science 2020, 369, 674–680. [Google Scholar]
- Patial, S.; Raizada, P.; Hasija, V.P.; Thakur Singh, V.K.; Nguyen, V.H. Recent Advances in Photocatalytic Multivariate Metal-organic Frameworks-Based Nanostructures toward Renewable Energy and The Removal of Environmental Pollutants. Mater. Today Energy 2021, 19, 100589. [Google Scholar] [CrossRef]
- Helal, A.; Yamani, Z.H.; Cordova, K.E.; Yaghi, O.M. Multivariate Metal-Organic Frameworks. Natl. Sci. Rev. 2017, 4, 296–298. [Google Scholar] [CrossRef]
- Feng, X.; Hajek, J.; Jena, H.S.; Wang, G.; Veerapandian, S.K.P.; Morent, R.; De Geyter, N.; Leyssens, K.; Hoffman, A.E.J.; Meynen, V.; et al. Engineering a Highly Defective Stable UiO-66 with Tunable Lewis- Brønsted Acidity: The Role of the Hemilabile Linker. J. Am. Chem. Soc. 2020, 142, 3174–3183. [Google Scholar] [CrossRef]
- Wu, X.P.; Gagliardi, L.; Truhlar, D.G.; Truhlar, D.G. Cerium Metal–organic Framework for Photocatalysis. J. Am. Chem. Soc. 2018, 140, 7904–7912. [Google Scholar] [CrossRef]
- Schelter, E.J. Cerium under the Lens. Nat. Chem. 2013, 5, 348. [Google Scholar] [CrossRef]
- Wu, X.P.; Gagliardi, L.; Truhlar, D.G.; Truhlar, D.G. Metal Doping in Cerium Metal-Organic Frameworks for Visible-Response Water Splitting Photocatalysts. Chem. Phys. 2018, 150, 041701. [Google Scholar] [CrossRef]
- Santiago Portillo, A.; Baldoví, H.G.; García Fernandez, M.T.; Navalón, S.; Atienzar, P.; Ferrer, B.; Alvaro, M.; Garcia, H.; Li, Z. Ti as Mediator in the Photoinduced Electron Transfer of Mixed-Metal NH2–UiO-66(Zr/Ti): Transient Absorption Spectroscopy Study and Application in Photovoltaic Cell. J. Phys. Chem. C 2017, 121, 7015–7024. [Google Scholar] [CrossRef]
- Hou, W.; Chen, C.; Xie, D.; Xu, Y. Substituted Ti(IV) in Ce-UiO-66-NH2 Metal–Organic Frameworks Increases H2 and O2 Evolution under Visible Light. ACS Appl. Mater. Interfaces 2023, 15, 2911–2921. [Google Scholar] [CrossRef]
- Bůžek, D.; Demel, J.; Lang, K. Zirconium Metal–Organic Framework UiO-66: Stability in an Aqueous Environment and Its Relevance for Organophosphate Degradation. Inorg. Chem. 2018, 57, 14290–14297. [Google Scholar] [CrossRef]
- Zhang, T.; Lin, W. Metal–Organic Frameworks for Artificial Photosynthesis and Photocatalysis. Chem. Soc. Rev. 2014, 43, 5982–5993. [Google Scholar] [CrossRef]
- Gómez-Avilés, A.; Solís, R.R.; García-Frutos, E.M.; Bedia, J.; Belver, C. Novel Isoreticular UiO-66-NH2 Frameworks by N-Cycloalkyl Functionalization of the 2-Aminoterephtalate Linker with Enhanced Solar Photocatalytic Degradation of Acetaminophen. J. Chem. Eng. 2023, 461, 141889-02. [Google Scholar] [CrossRef]
- Yu, F.; Chen, L.; Shen, X.; Li, X.; Duan, C. NH2-UiO-66/G-C3N4/CdTe Composites for Photocatalytic Reduction under Visible Light. APL Mater. 2019, 7, 101101. [Google Scholar] [CrossRef]
- Chatenever, A.R.K.; Ehlke, B.; Le Maguerès, P.; Reinheimer, E.W.; Song, X.; Fei, H.; Oliver, S.R.J. Structural Diversity of Four Lanthanide Metal–Organic Frameworks Based on 2,6-Naphthalenedicarboxylate: Synthesis, Structures and Photoluminescent Properties. Cryst. Eng. Comm. 2021, 23, 1388–1397. [Google Scholar] [CrossRef]
- Ying, C. Metal-Organic Framework as a New Photocatalyst for Environmental Pollutant Treatment. Conf. Ser. Earth Environ. 2021, 631, 012021-29. [Google Scholar] [CrossRef]
- Zango, Z.U.; Jumbri, K.; Sambudi, N.S.; Ramli, A.; Abu Bakar, N.H.; Saad, B.; Rozaini, M.N.; Isiyaka, H.A.; Jagaba, A.H.; Aldaghri, O.; et al. A Critical Review on Metal-Organic Frameworks and Their Composites as Advanced Materials for Adsorption and Photocatalytic Degradation of Emerging Organic Pollutants from Wastewater. Polymers 2020, 11, 2648. [Google Scholar] [CrossRef]
- Son, F.A.; Atilgan, A.; Idrees, K.B.; Islamoglu, T.; Farha, O.K. Solvent-Assisted Linker Exchange Enabled Preparation of Cerium-Based Metal–Organic Frameworks Constructed from Redox Active Linkers. Inorg. Chem. Front. 2020, 7, 984–990. [Google Scholar] [CrossRef]
- Stawowy, M.; Róziewicz, M.; Szczepańska, E.; Silvestre-Albero, J.; Zawadzki, M.; Musioł, M.; Łuzny, R.; Kaczmarczyk, J.; Trawczyński, J.; Łamacz, A. The Impact of Synthesis Method on the Properties and CO2 Sorption Capacity of UiO-66(Ce). Catalysts 2019, 4, 309. [Google Scholar] [CrossRef]
- Yang, S.; Shen, H.; Cheng, F.; Wu, C.; Cao, Y.; Zhuo, S.; Zhang, Q.; Zhang, H. Organometallic Precursor Induced Defect-Enriched Mesoporous CeO2 with High Specific Surface Area: Preparation and Catalytic Performance. J. Mater. Chem. A 2020, 8, 14006–14014. [Google Scholar] [CrossRef]
- Lammert, M.; Wharmby, M.T.; Bueken Smolders, B.; Lieb, A.; Lomachenko, K.A.; Vos, D.D.; Stock, N. Cerium-Based Metal Organic Frameworks with UiO-66 Architecture: Synthesis, Properties and Redox Catalytic Activity. Chem. Commun. 2015, 51, 12578–12581. [Google Scholar] [CrossRef]
- Taddei, M.; Dau, P.V.; Cohen, S.M.; Ranocchiari, M.; Van Bokhoven, J.A.; Costantino, F.; Vivani Sabatini, R. Efficient Microwave Assisted Synthesis of Metal–Organic Framework UiO-66: Optimization and Scale Up. Dalton Trans. 2015, 44, 14019–14026. [Google Scholar] [CrossRef]
- Ezzatpour Ghadim, E.; Walker, M.; Walton, R.I. Rapid Synthesis of Cerium-UiO-66 MOF Nanoparticles for Photocatalytic Dye Degradation. Dalton Trans. 2023, 52, 11143–11157. [Google Scholar] [CrossRef]
- Lammert, M.; Glißmann, C.; Stock, N. Tuning the Stability of Bimetallic Ce(IV)/Zr(IV)-Based MOFs with UiO-66 and MOF-808 Structures. Dalton Trans. 2017, 46, 2425–2429. [Google Scholar] [CrossRef]
- Parnicka, P.; Lisowski, W.; Klimczuk, T.; Mikolajczyk, A.; Zaleska-Medynska, A. A Novel (Ti/Ce)UiO-X MOFs@TiO2 Heterojunction for Enhanced Photocatalytic Performance: Boosting Via Ce4+/Ce3+ and Ti4+/Ti3+ Redox Mediators. Appl. Catal. B 2022, 310, 121349. [Google Scholar] [CrossRef]
- Kim, H.; Kim, D.; Moon, D.; Choi, Y.N.; Baek, S.B.; Lah, M.S. Symmetry-Guided Syntheses of Mixed-Linker Zr Metal–Organic Frameworks with Precise Linker Locations. Chem. Sci. 2019, 10, 5801–5806. [Google Scholar] [CrossRef]
- Butova, V.V.; Budnyk, A.P.; Charykov, K.M.; Vetlitsyna-Novikova, K.S.; Bugaev, A.L.; Guda, A.A.; Damin, A.; Chavan, S.M.; Øien-Ødegaard, S.; Lillerud, K.P.; et al. Partial and Complete Substitution of the 1,4-Benzenedicarboxylate Linker in UiO-66 with 1,4-Naphthalenedicarboxylate: Synthesis, Characterization, and H2-Adsorption Properties. Inorg. Chem. 2019, 58, 1607–1620. [Google Scholar] [CrossRef]
- Butova, V.V.; Burachevskaya, O.A.; Ozhogin, I.V.; Borodkin, G.S.; Starikov, A.G.; Bordiga, S.; Damin, A.; Lillerud, K.P.; Soldatov, A.V. UiO-66 Type MOFs with Mixed-Linkers 1,4-Benzenedicarboxylate and 1,4-Naphthalenedicarboxylate: Effect of the Modulator and Post-Synthetic Exchange. Microporous Mesoporous Mater. 2020, 305, 110324. [Google Scholar] [CrossRef]
- Wang, A.; Zhou, Y.; Wang, Z.; Chen, M.; Sun, L.; Liu, X. Titanium Incorporated with UiO-66(Zr)-Type Metal–Organic Framework (MOF) for Photocatalytic Application. RSC Adv. 2016, 6, 3671–3679. [Google Scholar] [CrossRef]
- Xia, H.-L.; Zhou, K.; Guo, J.; Zhang, J.; Huang, X.; Luo, D.; Liu, X.-Y.; Li, J. Amino Group Induced Structural Diversity and near-Infrared Emission of Yttrium-Tetracarboxylate Frameworks. Chem. Sci. 2020, 13, 9321–9328. [Google Scholar] [CrossRef]
- Nasalevich, M.A.; Hendon, C.H.; Santaclara, J.G.; Svane, K.; van der Linden, B.; Veber, S.L.; Fedin, M.V.; Houtepen, A.J.; van der Veen, M.A.; Kapteijn, F.; et al. Electronic Origins of Photocatalytic Activity in D0 Metal Organic Frameworks. Sci. Rep. 2016, 6, 23676. [Google Scholar] [CrossRef]
- Makuła, P.; Pacia, M.; Macyk, W. How to Correctly Determine the Band Gap Energy of Modified Semiconductor Photocatalysts Based on UV–Vis Spectra. J. Phys. Chem. Lett. 2018, 9, 6814–6817. [Google Scholar] [CrossRef]
- Flage−Larsen, E.; Røyset, A.; Cavka, J.H.; Thorshaug, K. Band Gap Modulations in UiO Metal–Organic Frameworks. J. Phys. Chem. C 2013, 117, 20610–20616. [Google Scholar] [CrossRef]
- Yasin, A.S.; Li, J.; Wu, N.; Musho, T. Study of the Inorganic Substitution in a Functionalized UiO-66 Metal–Organic Framework. Phys. Chem. Chem. Phys. 2016, 18, 12748–12754. [Google Scholar] [CrossRef]
- Hou, W.; Chen, C.; Wang, Y.; Xu, Y. Cerium Versus Zirconium UiO-66 Metal–Organic Frameworks Coupled with CdS for H2 Evolution under Visible Light. Catal. Sci. Technol. 2022, 12, 4012–4019. [Google Scholar] [CrossRef]
- Nasalevich, M.A.; Goesten, M.G.; Savenije, T.J.; Kapteijn, F.; Gascon, J. Enhancing Optical Absorption of Metal–Organic Frameworks for Improved Visible Light Photocatalysis. Chem. Commun. 2013, 49, 10575–10577. [Google Scholar] [CrossRef]
- Wasson, M.C.; Xie, H.; Wang, X.; Duncan, J.S.; Farha, O.K. Structural Transformation of Metal Oxo Species within UiO-66 Type Metal–Organic Frameworks. Cryst. Eng. Comm. 2022, 24, 5135–5140. [Google Scholar] [CrossRef]
- Shearer, G.C.; Chavan, S.; Ethiraj, J.; Vitillo, J.G.; Svelle, S.; Lamberti, C.; Olsbye, U.; Bordiga, S.; Lillerud, K.P. Tuned to Perfection: Ironing out the Defects in Metal–Organic Framework UiO-66. Chem. Mater. 2014, 26, 4068–4071. [Google Scholar] [CrossRef]
- Tan, K.; Pandey, H.; Wang, H.; Velasco, E.; Wang, K.-Y.; Zhou, H.-C.; Li, J.; Thonhauser, T. Defect Termination in the UiO-66 Family of Metal–Organic Frameworks: The Role of Water and Modulator. J. Am. Chem. Soc. 2021, 143, 6328–6332. [Google Scholar] [CrossRef]
- Atzori, C.; Shearer, G.C.; Maschio, L.; Civalleri, B.; Bonino, F.; Lamberti, C.; Svelle, S.; Lillerud, K.P.; Bordiga, S. Effect of Benzoic Acid as a Modulator in the Structure of UiO-66: An Experimental and Computational Study. J. Phys. Chem. C 2017, 121, 9312–9324. [Google Scholar] [CrossRef]
- Zhang, Y.; Chen, H.; Pan, Y.; Zeng, X.; Jiang, X.; Long, Z.; Hou, X. Cerium-Based UiO-66 Metal–Organic Frameworks Explored as Efficient Redox Catalysts: Titanium Incorporation and Generation of Abundant Oxygen Vacancies. Chem. Commun. 2019, 55, 13959–13962. [Google Scholar] [CrossRef]
- Valenzano, L.; Civalleri, B.; Chavan, S.; Bordiga, S.; Nilsen, M.H.; Jakobsen, S.; Lillerud, K.P.; Lamberti, C. Disclosing the Complex Structure of UiO-66 Metal Organic Framework: A Synergic Combination of Experiment and Theory. Chem. Mater. 2011, 23, 1700–1718. [Google Scholar] [CrossRef]
- Han, Y.; Liu, M.; Li, K.; Sun, Q.; Zhang, W.; Song, C.; Zhang, G.; Zhang, Z.C.; Guo, X. In Situ Synthesis of Titanium Doped Hybrid Metal–Organic Framework UiO-66 with Enhanced Adsorption Capacity for Organic Dyes. Inorg. Chem. Front. 2017, 4, 1870–1880. [Google Scholar] [CrossRef]
- Huo, L.; Wang, L.; Li, J.; Pu, Y.; Xuan, K.; Qiao, C.; Yang, H. Cerium Doped Zr-Based Metal-Organic Framework as Catalyst for Direct Synthesis of Dimethyl Carbonate from CO2 and Methanol. J. CO2 Util. 2023, 68, 102352. [Google Scholar] [CrossRef]
- Han, Y.; Liu, M.; Li, K.; Zuo, Y.; Wei, Y.; Xu, S.; Zhang, G.; Song, C.; Zhang, Z.; Guo, X. Facile Synthesis of Morphology and Size-Controlled Zirconium Metal–Organic Framework UiO-66: The Role of Hydrofluoric Acid in Crystallization. Cryst. Eng. Comm. 2015, 17, 6434–6440. [Google Scholar] [CrossRef]
- Jin, L.; Liu, H.; Xu, A.; Wu, Y.; Lu, J.; Liu, J.; Xie, S.; Yao, Y.; Dong, L.; Zhang, M.; et al. Defective UiO-66-NH2 (Zr/Ce) Catalyses the Synthesis of Propylene Carbonate under Mild Conditions. Microporous Mesoporous Mater. 2021, 317, 110997. [Google Scholar] [CrossRef]
- Jiao, Y.; Liu, Y.; Zhu, G.; Hungerford, J.T.; Bhattacharyya, S.; Lively, R.P.; Sholl, D.S.; Walton, K.S. Heat-Treatment of Defective UiO-66 from Modulated Synthesis: Adsorption and Stability Studies. J. Phys. Chem. C 2017, 121, 23471–23479. [Google Scholar] [CrossRef]
- Mu, X.; Jiang, J.; Chao, F.; Lou, Y.; Chen, J. Ligand Modification of UiO-66 with an Unusual Visible Light Photocatalytic Behavior for RhB Degradation. Dalton Trans. 2018, 46, 1895–1902. [Google Scholar] [CrossRef]
- Piscopo, C.G.; Trapani, F.; Polyzoidis, A.; Schwarzer, M.; Pace, A.; Loebbecke, S. Positive Effect of the Fluorine Moiety on the Oxygen Storage Capacity of UiO-66 Metal–Organic Frameworks. New J. Chem. 2016, 46, 8220–8224. [Google Scholar] [CrossRef]
- Caruso, T.; Bedini, E.; De Castro, C.; Parrilli, M. Brønsted Acidity of Ceric Ammonium Nitrate in Anhydrous DMF. The Role of Salt and Solvent in Sucrose Cleavage. Tetrahedron 2006, 62, 2350–2356. [Google Scholar] [CrossRef]
- Hong, D.; Murakami, M.; Yamada, Y.; Fukuzumi, S. Efficient Water Oxidation by Cerium Ammonium Nitrate with [Ir III(CP*)(4,4′-Bishydroxy-2,2′-Bipyridine)(H2O)]2+ as a Precatalyst. Energy. Environ. Sci. 2012, 5, 5708–5716. [Google Scholar] [CrossRef]
- Tu, J.; Zeng, X.; Xu, F.; Wu, X.; Tian, Y.; Hou, X.; Long, Z. Microwave-Induced Fast Incorporation of Titanium into UiO-66 Metal–Organic Frameworks for Enhanced Photocatalytic Properties. Chem. Commun. 2017, 53, 3361–3364. [Google Scholar] [CrossRef] [PubMed]
- Fang, X.; Wu, S.; Wu, Y.; Yang, W.; Li, Y.; He, J.; Hong, P.; Nie, M.; Xie, C.; Wu, Z.; et al. High-efficiency adsorption of norfloxacin using octahedral UiO-66-NH2 nanomaterials: Dynamics, thermodynamics, and mechanism. Appl. Surf. Sci. 2020, 518, 146226. [Google Scholar] [CrossRef]
- Chen, H.; Liu, C.; Guo, W.; Wang, Z.; Shi, Y.; Yu, Y.; Wu, L. Functionalized UiO-66(Ce) for photocatalytic organic transformation: The role of active sites modulated by ligand functionalization. Catal. Sci. Technol. 2022, 12, 1812–1823. [Google Scholar] [CrossRef]
- Wang, F.; Xue, R.; Yujie, M.; Ge, Y.; Wang, Z.; Qiao, X.; Zhou, P. Study on the Performance of a MOF-808-Based Photocatalyst Prepared by a Microwave-Assisted Method for the Degradation of Antibiotics. RSC Adv. 2021, 11, 32955–32964. [Google Scholar] [CrossRef] [PubMed]
- Ibrahim, A.H.; El-Mehalmey, W.A.; Haikal, R.R.; Safy, M.E.A.; Amin, M.; Shatla, H.R.; Karakalos, S.G.; Alkordi, M.H. Tuning the Chemical Environment within the UiO-66-NH2 Nanocages for Charge-Dependent Contaminant Uptake and Selectivity. Inorg. Chem. 2019, 58, 15078–15087. [Google Scholar] [CrossRef] [PubMed]
- Feng, L.; Yuan, S.; Zhang, L.; Tan, K.; Li, J.-L.; Kirchon, A.; Liu, L.-M.; Zhang, P.; Han, Y.; Chabal, Y.J.; et al. Creating Hierarchical Pores by Controlled Linker Thermolysis in Multivariate Metal–Organic Frameworks. J. Am. Chem. Soc. 2018, 140, 2363–2372. [Google Scholar] [CrossRef] [PubMed]
- Zhao, D.; Cai, C. Cerium-Based UiO-66 Metal-Organic Framework for Synergistic Dye Adsorption and Photodegradation: A Discussion of the Mechanism. Dyes Pigm. 2021, 185, 108957. [Google Scholar] [CrossRef]
- Rego, R.M.; Sriram, G.; Ajeya, K.V.; Jung, H.-Y.; Kurkuri, M.D.; Kigga, M. Cerium Based UiO-66 MOF as a Multipollutant Adsorbent for Universal Water Purification. J. Hazard. Mater. 2021, 416, 125941. [Google Scholar] [CrossRef]
- Sun, D.; Liu, W.; Qiu, M.; Zhang, Y.; Li, Z. Introduction of a Mediator for Enhancing Photocatalytic Performance Via Post-Synthetic Metal Exchange in Metal–Organic Frameworks (MOFs). Chem. Commun. 2015, 51, 2056–2059. [Google Scholar] [CrossRef]
- DeStefano, M.R.; Islamoglu, T.; Garibay, S.J.; Hupp, J.T.; Farha, O.K. Room-Temperature Synthesis of UiO-66 and Thermal Modulation of Densities of Defect Sites. Chem. Mater. 2017, 29, 1357–1361. [Google Scholar] [CrossRef]
- Xia, Q.; Yu, X.; Zhao, H.; Wang, S.; Wang, H.; Guo, Z.; Xing, H. Syntheses of Novel Lanthanide Metal–Organic Frameworks for Highly Efficient Visible-Light-Driven Dye Degradation. Cryst. Growth Des. 2017, 17, 4189–4195. [Google Scholar] [CrossRef]
- Li, Y.; Lin, B.; Ge, L.; Guo, H.; Chen, X.; Lu, M. Real-Time Spectroscopic Monitoring of Photocatalytic Activity Promoted by Graphene in a Microfluidic Reactor. Sci. Rep. 2016, 6, 28803. [Google Scholar] [CrossRef] [PubMed]
- Bhoi, Y.P.; Pradhan, S.R.; Behera, C.; Mishra, B.G. Visible Light Driven Efficient Photocatalytic Degradation of Congo Red Dye Catalyzed by Hierarchical CuS–Bi2CuXW1−XO6−2X Nanocomposite System. RSC Adv. 2016, 46, 35589–35601. [Google Scholar] [CrossRef]
- Sood, S.; Mehta, S.K.; Umar, A.; Kansal, S.K. The Visible Light-Driven Photocatalytic Degradation of Alizarin Red S Using Bi-Doped TiO2 Nanoparticles. New J. Chem. 2014, 46, 3127–3136. [Google Scholar] [CrossRef]
- Toby, B.H.; Von Dreele, R.B. GSAS-II: The Genesis of a Modern Open-Source All Purpose Crystallography Software Package. J. Appl. Crystallogr. 2013, 46, 544–549. [Google Scholar] [CrossRef]
- Fairley, N.; Fernandez, V.; Richard-Plouet, M.; Guillot-Deudon, C.; Walton, J.; Smith, E.; Greiner Flahaut, M.; Biesinger, M.; Tougaard, S.; Morgan, D. Baltrusaitis. Appl. Surf. Sci. 2021, 5, 100112. [Google Scholar] [CrossRef]
- Zhang, J.; Li, F.; Sun, Q. Rapid and Selective Adsorption of Cationic Dyes by a Unique Metal-Organic Framework with Decorated Pore Surface. Appl. Surf. Sci. 2018, 440, 1219–1226. [Google Scholar] [CrossRef]
- Revellame, E.D.; Fortela, D.L.; Sharp, W.; Hernandez, R.; Zappi, M.E. Adsorption Kinetic Modelling Using Pseudo-First Order and Pseudo-Second Order Rate Laws: A Review. Clean. Eng. Technol. 2020, 1, 100032. [Google Scholar] [CrossRef]


| Material | Crystallite Size (nm) | a (Å) | Zeta Potential (mV) | Surface Area (m2g−1) | Band Gap (eV) |
|---|---|---|---|---|---|
| Ce3Zr3(O)4(OH)4(1,4-NDC)2.98(BDC)2.98 (H2O)0.08 | 9.01 (±0.1) | 21.295(5) | +18.33 | 250.23 | 2.69 ± 0.027 |
| Ce3Zr3(O)4(OH)4(1,4-NDC)3(2,6-NDC)2 (H2O)0.5 | 8.90 (±0.5) | 21.202(1) | +5.50 | 303.61 | 2.08 ± 0.014 |
| Ce3Zr3(O)4(OH)4(1,4-NDC)5.34(H2O)0.33 | 9.75 (±0.1) | 21.321(8) | 10.56 | 212.32 | 2.00 ± 0.018 |
| Ce2.2Ti3.8(O)4(OH)4(1,4-NDC)4.51(H2O)0.745 | 8.67 (±0.1) | 21.517(2) | −4.25 | 136.47 | 1.86 ± 0.017 |
| Ce4.5Ti1.5(O)4(OH)4(BDC-NH2)4.33(H2O)0.835 | 15.12 (±0.1) | 21.565(9) | 4.09 | 144.08 | 2.41 ± 0.031 |
| Sample | Elemental Composition and Oxidation State (Atomic %) | |||||||||
|---|---|---|---|---|---|---|---|---|---|---|
| Ce | N | Zr | Ti | Ce(III) | Ce(IV) | Ce(III)/Ce(IV) | Ti(III) | Ti(IV) | Ti(III)/Ti(IV) | |
| Ce/Zr-UiO-66(1,4-NDC/BDC) | 1.3 | 1.8 | 65.3 | 34.7 | 1.9 | - | - | - | ||
| Ce/Zr-UiO-66(1,4-NDC/2,6-NDC) | 2.1 | - | 2.6 | - | 63.2 | 36.8 | 1.7 | - | - | - |
| Ce/Zr-UiO-66(1,4-NDC) | 2.1 | - | 2.3 | - | 71.4 | 28.6 | 2.5 | - | - | - |
| Ce/Ti-UiO-66(1,4-NDC) | 2.4 | - | - | 3.9 | 66.3 | 33.7 | 2.0 | 47.1 | 52.9 | 1.2 |
| Ce/Ti-UiO-66(BDC-NH2) | 2.0 | 1.1 | - | 1.1 | 61.2 | 38.8 | 1.6 | 72 | 28 | 2.6 |
| Pseudo-First Order | Pseudo-Second Order | ||||||
|---|---|---|---|---|---|---|---|
| MOF | Dye | k1 (min−1) | qe (mg·g−1) | R2 | k2 (g⋅mg−1min− 1) | qe (mg·g−1) | R2 |
| Ce/Zr-UiO-66(1,4-NDC/BDC) | MB | 5.6 × 10⁻² | 26.13 | 0.995 | 1.3 × 10⁻² | 33.11 | 0.998 |
| Ce/Zr-UiO-66(1,4-NDC/2,6-NDC) | MB | 5.2 × 10⁻² | 15.93 | 0.996 | 4.8 × 10⁻² | 38.31 | 0.998 |
| Ce/Zr-UiO-66(1,4-NDC) | MB | 6.0 × 10⁻² | 45.40 | 0.998 | 1.9 × 10⁻² | 15.22 | 0.991 |
| Ce/Ti-UiO-66(1,4-NDC) | MB | 6.2 × 10⁻² | 55.74 | 0.998 | 0.26 | 15.36 | 0.991 |
| Ce/Ti-UiO-66(BDC-NH2) | MB | 6.2 × 10⁻² | 44.61 | 0.995 | 5.6 × 10⁻³ | 17.06 | 0.991 |
| Ce/Zr-UiO-66(1,4-NDC/BDC) | RhB | 5.9 × 10⁻² | 72.31 | 0.994 | 4.3 × 10⁻³ | 96.15 | 0.993 |
| Ce/Zr-UiO-66(1,4-NDC-2,6-NDC) | RhB | 2.3 × 10⁻² | 48.8 | 0.997 | 3.5 × 10⁻² | 26.95 | 0.995 |
| Ce/Zr-UiO-66(1,4-NDC) | RhB | 4.3 × 10⁻² | 110.91 | 0.998 | 2.6 × 10⁻³ | 37.82 | 0.993 |
| Ce/Ti-UiO-66(1,4-NDC) | RhB | 5.0× 10⁻² | 91.89 | 0.995 | 1.7 × 10⁻² | 10.52 | 0.996 |
| Ce/Ti-UiO-66(BDC-NH2) | RhB | 6.1 × 10⁻² | 55.37 | 0.997 | 1.4 × 10⁻² | 30.211 | 0.995 |
| Ce/Zr-UiO-66(1,4-NDC/BDC) | CR | 4.9 × 10⁻² | 109.04 | 0.995 | 9.1 × 10⁻³ | 31.25 | 0.991 |
| Ce/Zr-UiO-66(1,4-NDC/2,6-NDC) | CR | 2.8 × 10⁻² | 105.74 | 0.999 | 3.3 × 10⁻² | 14.28 | 0.986 |
| Ce/Zr-UiO-66(1,4-NDC) | CR | 5.4 × 10⁻² | 110.91 | 0.998 | 1.0 × 10⁻² | 29.69 | 0.990 |
| Ce/Ti-UiO-66(1,4-NDC) | CR | 7.5 × 10⁻² | 132.49 | 0.995 | 1.6 × 10⁻² | 16.28 | 0.984 |
| Ce/Ti-UiO-66 (BDC-NH2) | CR | 4.9 × 10⁻² | 82.39 | 0.995 | 1.0 × 10⁻² | 30.41 | 0.990 |
| Ce/Zr-UiO-66(1,4-NDC/BDC) | AR | 2.4 × 10⁻² | 115.10 | 0.997 | 2.3 × 10⁻² | 22.75 | 0.961 |
| Ce/Zr-UiO-66(1,4-NDC/2,6-NDC) | AR | 6.4 × 10⁻² | 96.58 | 0.992 | 4.1× 10⁻² | 11.89 | 0.986 |
| Ce/Zr-UiO-66(1,4-NDC) | AR | 5. 3 × 10⁻² | 34.01 | 0.996 | 1.3 × 10⁻² | 60.20 | 0.998 |
| Ce/Ti-UiO-66(1,4-NDC) | AR | 4.1 × 10⁻² | 71.82 | 0.998 | 3.2 × 10⁻² | 76.05 | 0.998 |
| Ce/Ti-UiO-66(BDC-NH2) | AR | 9.3 × 10⁻² | 67.27 | 0.990 | 3.8 × 10⁻² | 12.58 | 0.954 |
Disclaimer/Publisher’s Note: The statements, opinions and data contained in all publications are solely those of the individual author(s) and contributor(s) and not of MDPI and/or the editor(s). MDPI and/or the editor(s) disclaim responsibility for any injury to people or property resulting from any ideas, methods, instructions or products referred to in the content. |
© 2023 by the authors. Licensee MDPI, Basel, Switzerland. This article is an open access article distributed under the terms and conditions of the Creative Commons Attribution (CC BY) license (https://creativecommons.org/licenses/by/4.0/).
Share and Cite
Ezzatpour Ghadim, E.; Walker, M.; Walton, R.I. The Use of Rapid Precipitation to Synthesise Multivariate UiO-66 Metal–Organic Frameworks for Photocatalysis. Inorganics 2023, 11, 455. https://doi.org/10.3390/inorganics11120455
Ezzatpour Ghadim E, Walker M, Walton RI. The Use of Rapid Precipitation to Synthesise Multivariate UiO-66 Metal–Organic Frameworks for Photocatalysis. Inorganics. 2023; 11(12):455. https://doi.org/10.3390/inorganics11120455
Chicago/Turabian StyleEzzatpour Ghadim, Ehsan, Marc Walker, and Richard I. Walton. 2023. "The Use of Rapid Precipitation to Synthesise Multivariate UiO-66 Metal–Organic Frameworks for Photocatalysis" Inorganics 11, no. 12: 455. https://doi.org/10.3390/inorganics11120455
APA StyleEzzatpour Ghadim, E., Walker, M., & Walton, R. I. (2023). The Use of Rapid Precipitation to Synthesise Multivariate UiO-66 Metal–Organic Frameworks for Photocatalysis. Inorganics, 11(12), 455. https://doi.org/10.3390/inorganics11120455