


Heteroleptic Copper(II) Complexes Containing an Anthraquinone and a Phenanthroline as Synthetic Nucleases and Potential Anticancer Agents


 , , ,
, , ,  and
and 
Abstract
:
1. Introduction
2. Results
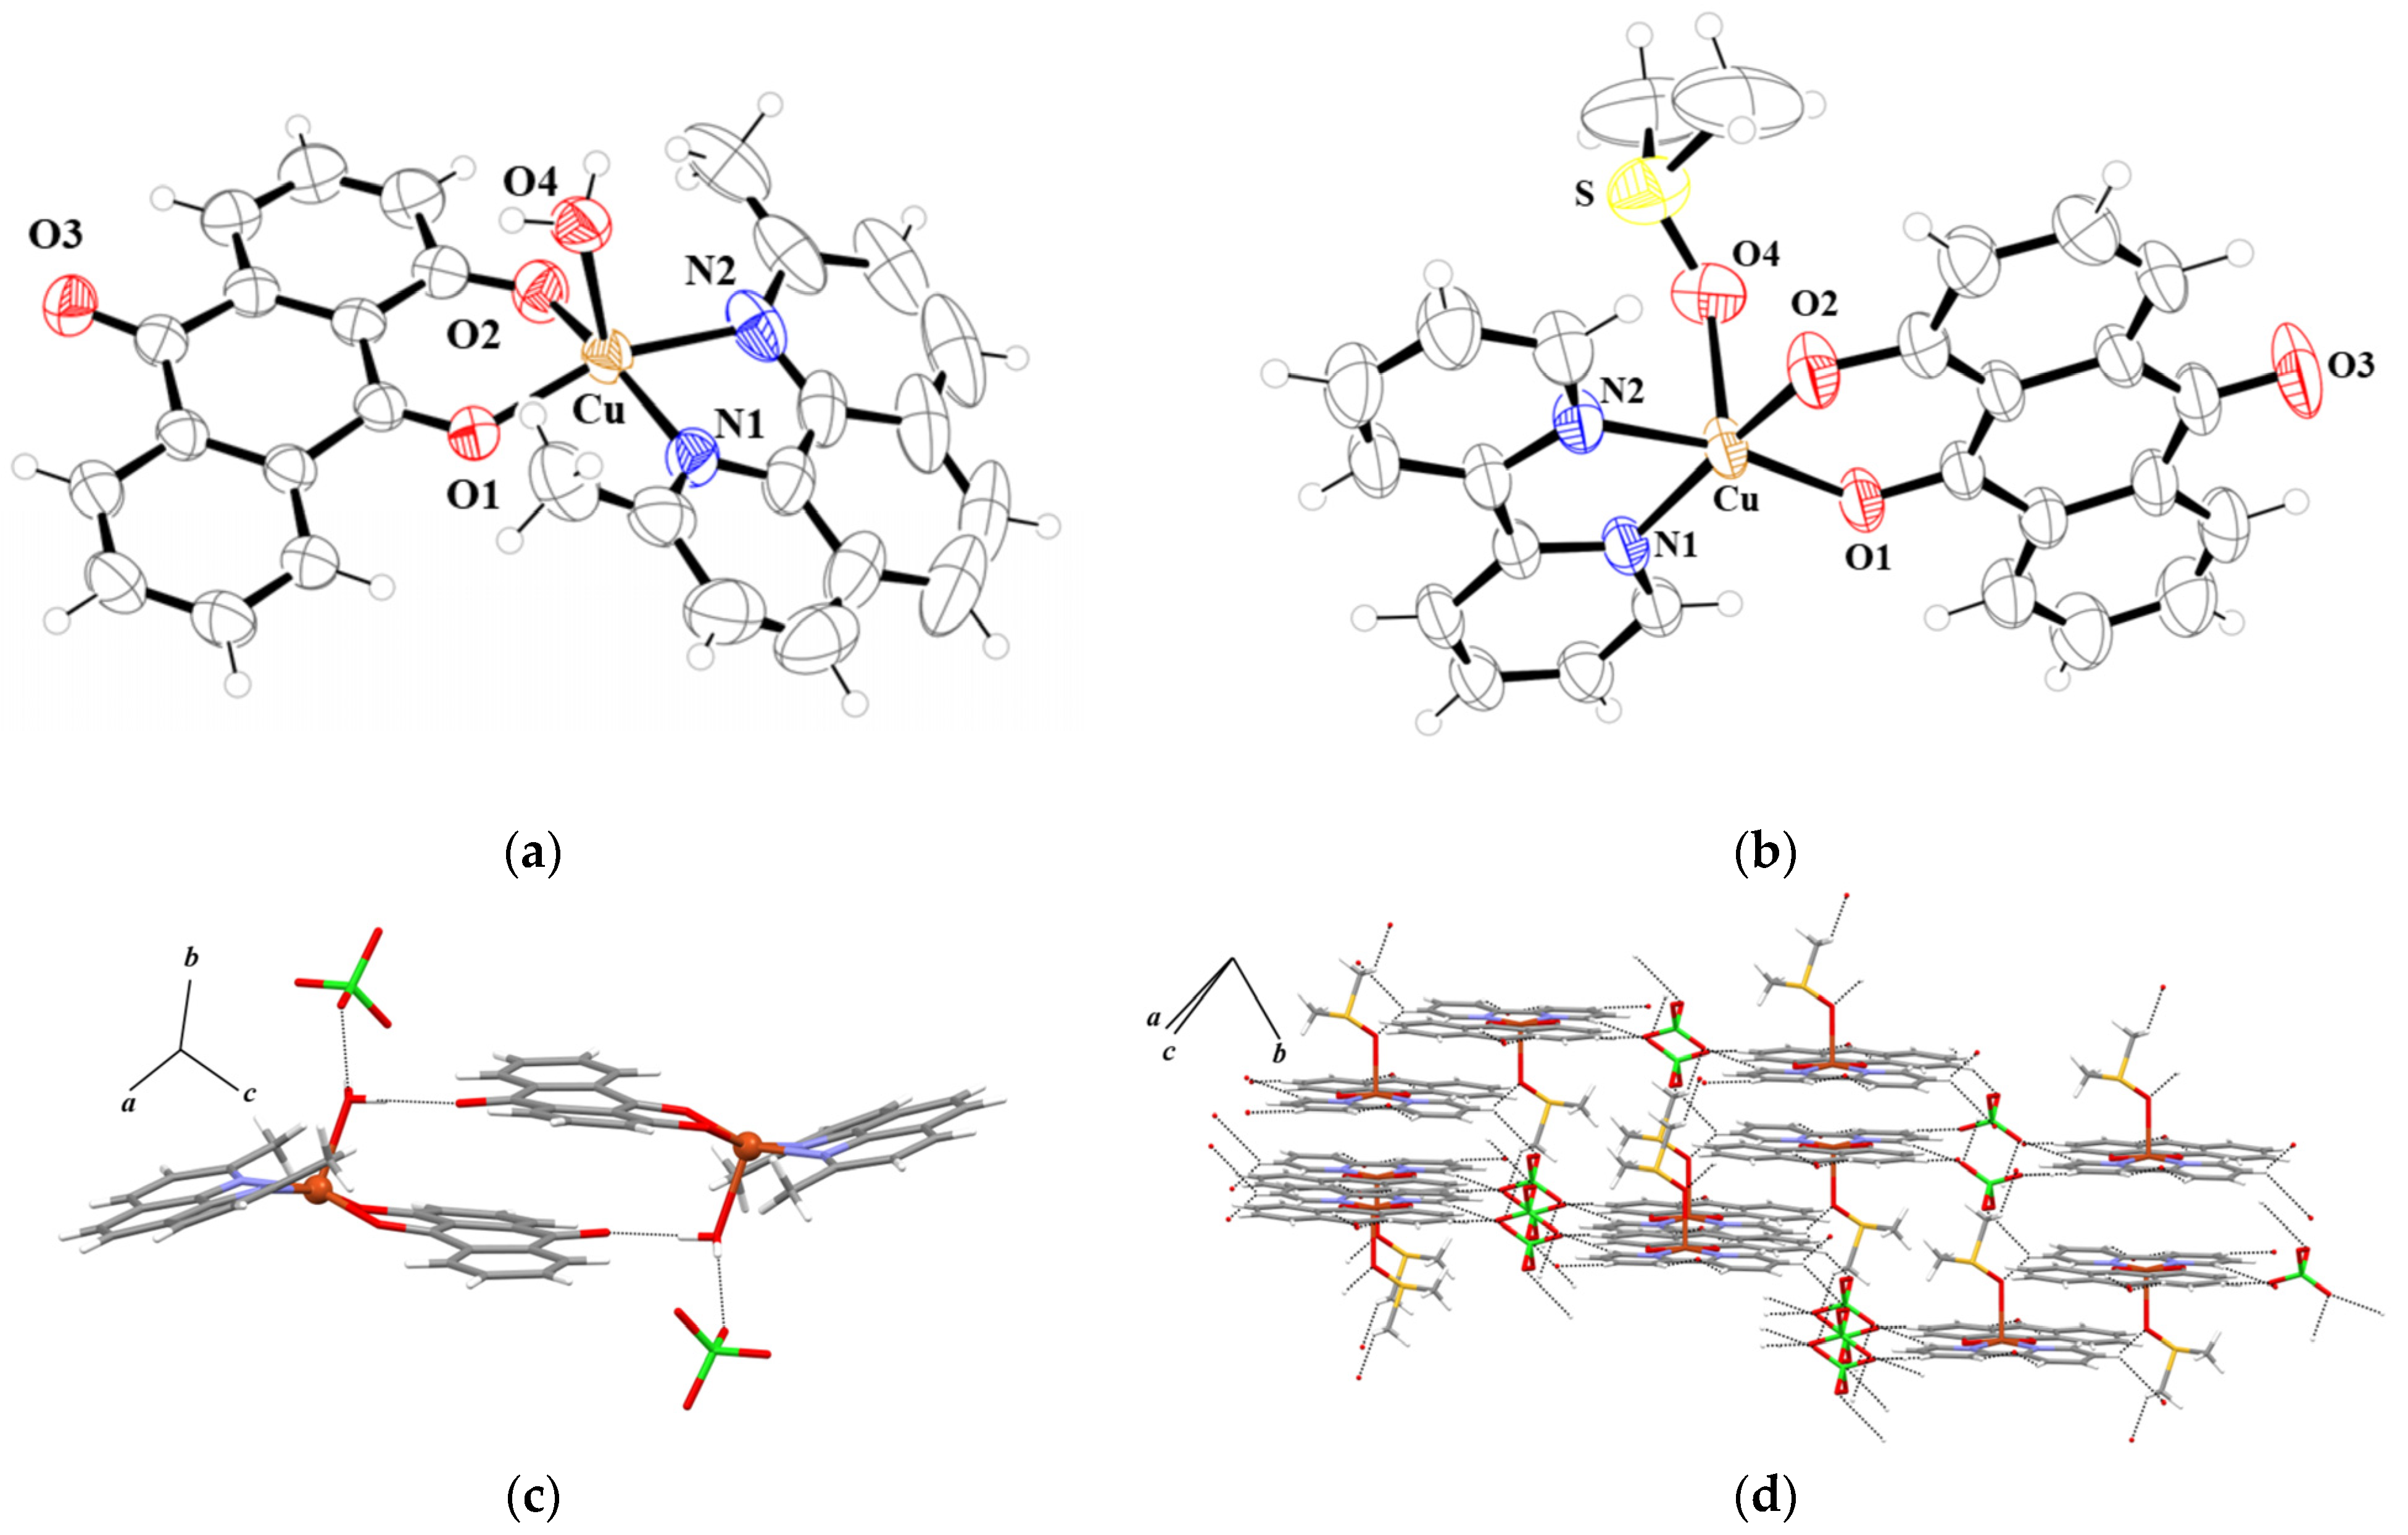
2.1. Structures
2.2. Spectral Studies
2.2.1. IR Spectral Study
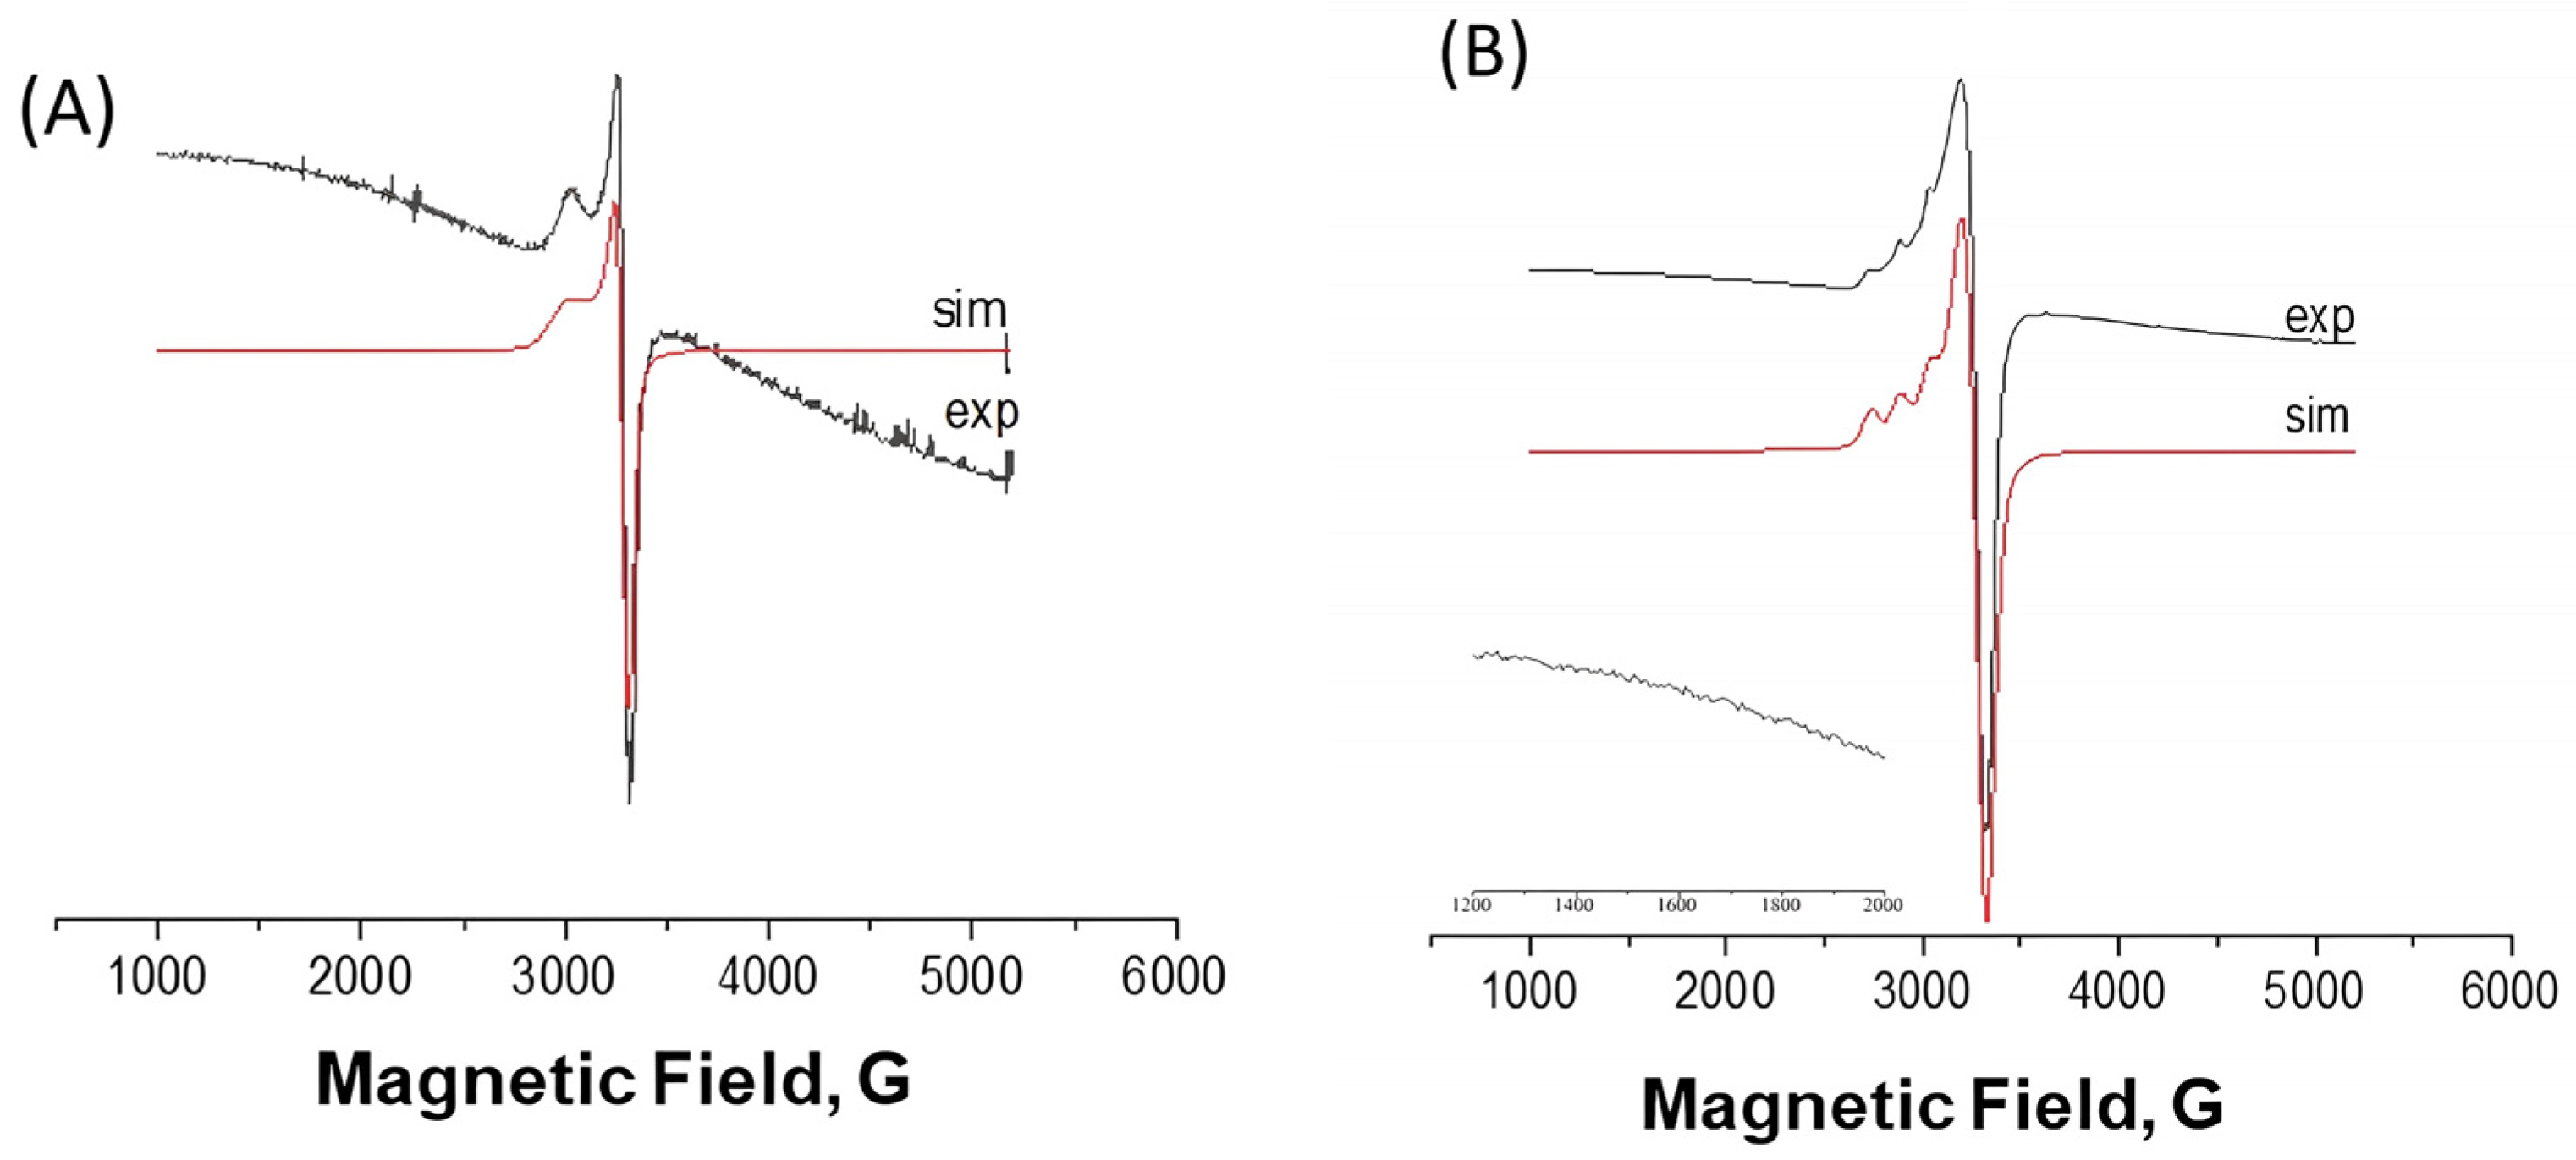
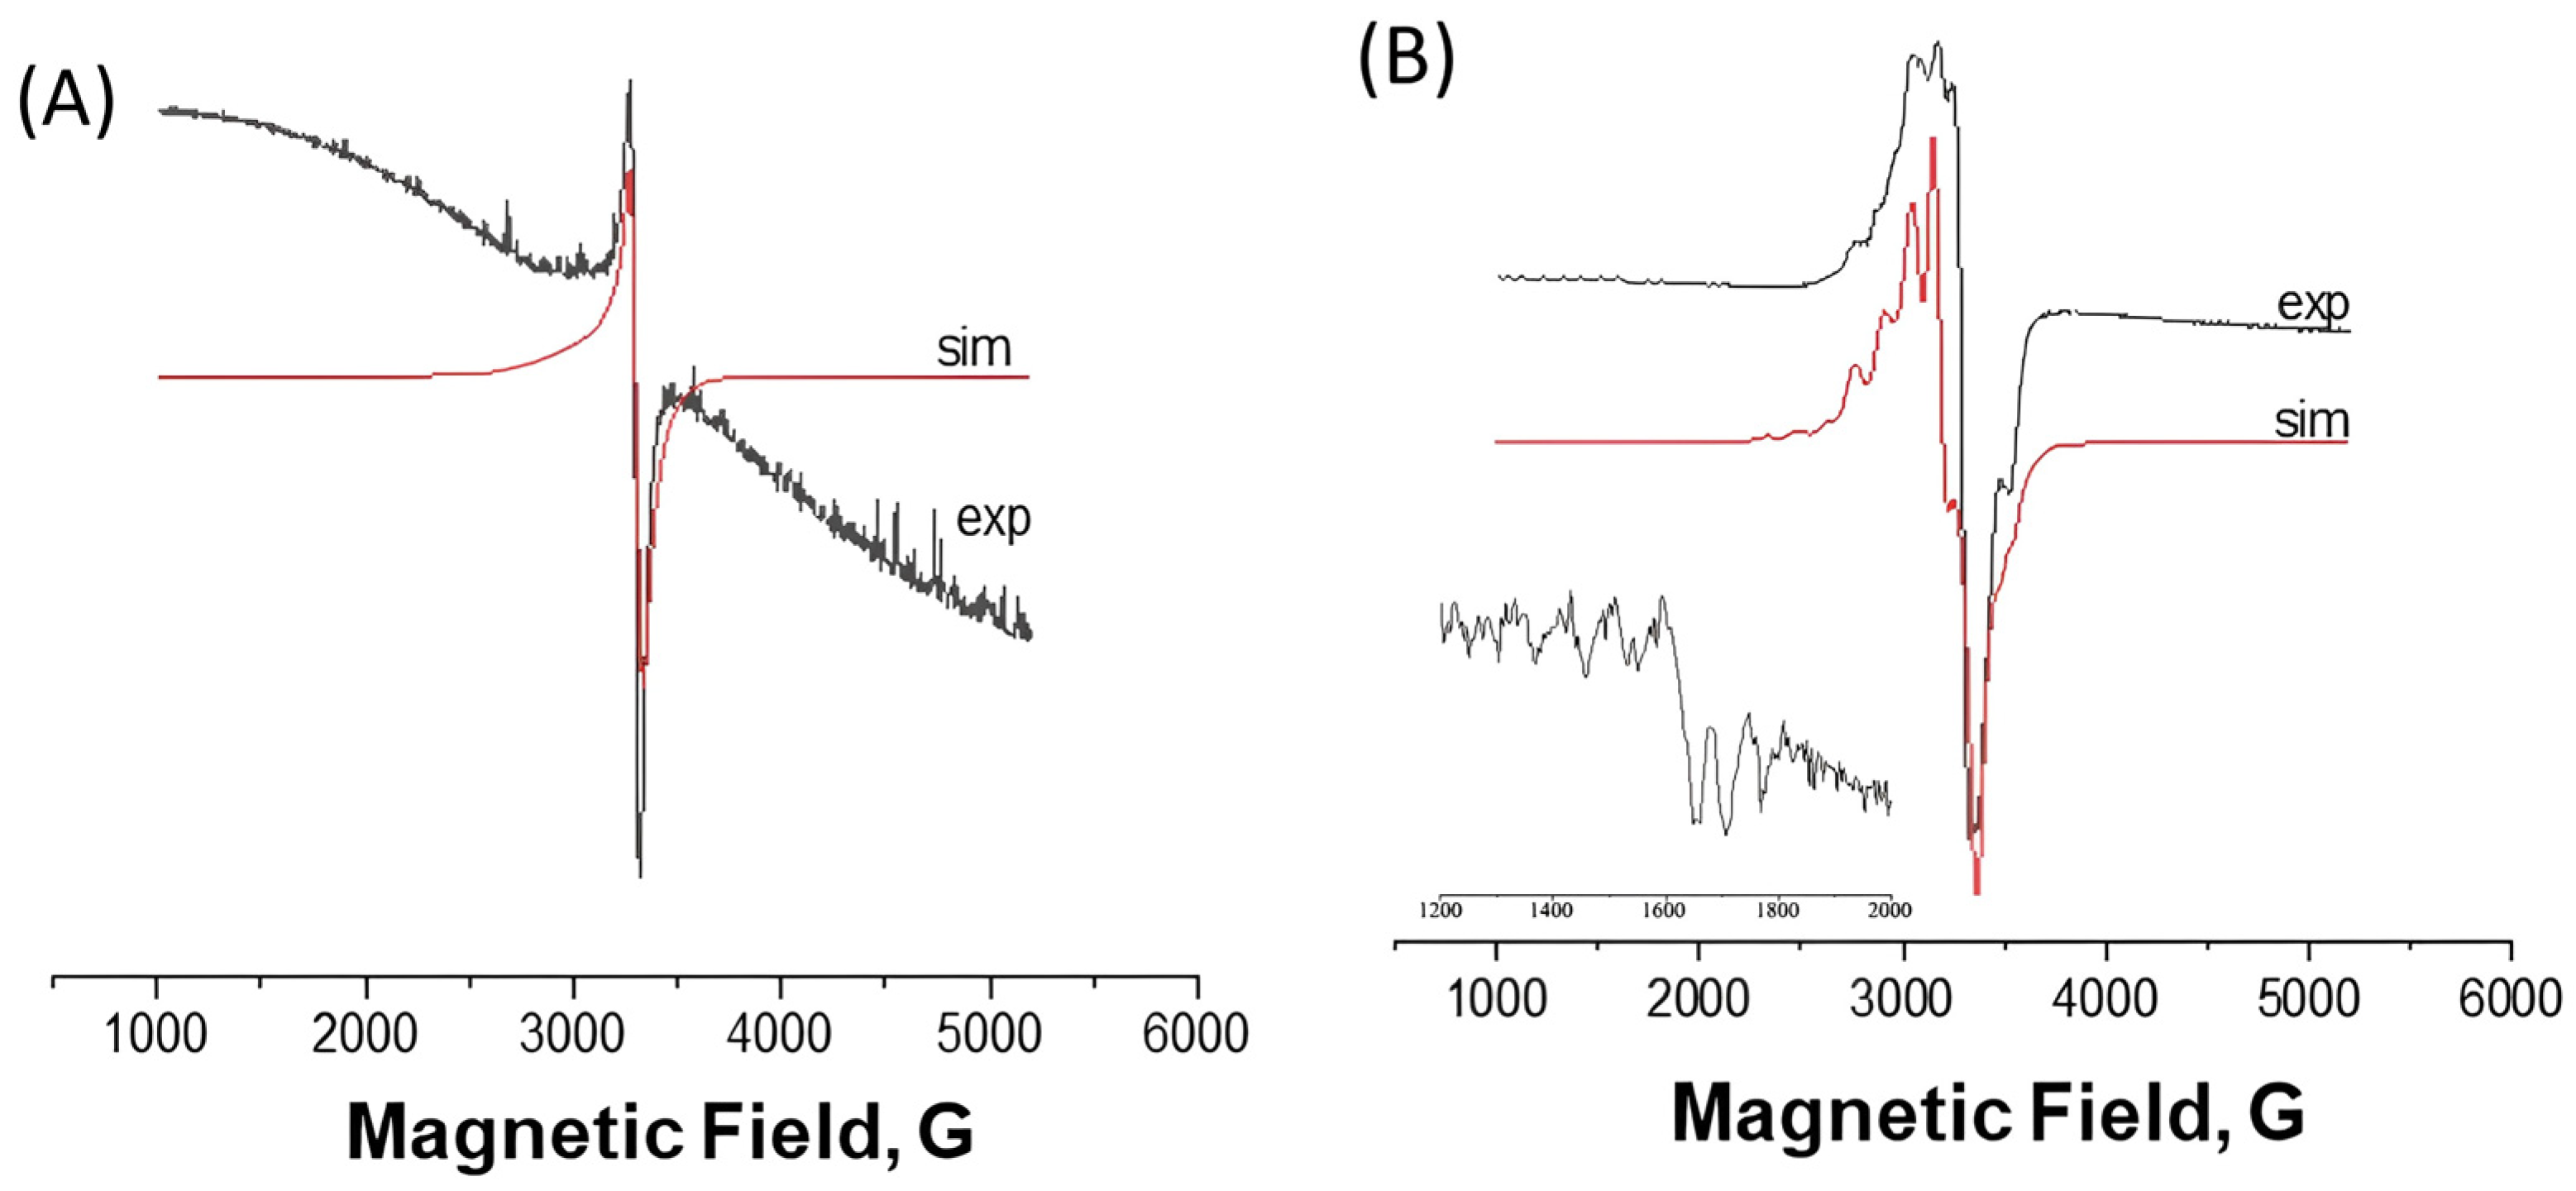
2.2.2. EPR Spectra
2.2.3. Electronic Spectral Study
2.3. DNA Interactions
2.3.1. DNA Binding
2.3.2. DNA Cleavage
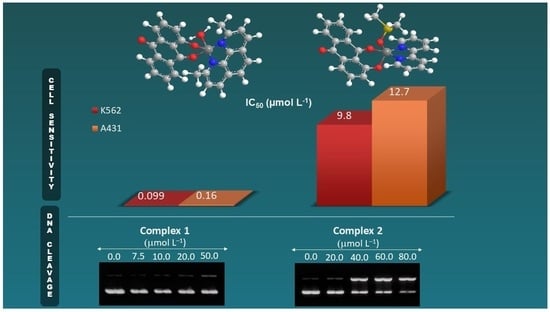
2.4. Cell Sensitivity to Compounds
3. Discussion
4. Materials and Methods
4.1. Syntheses
4.2. Spectroscopic Measurements
4.3. X-ray Crystallographic Study
4.4. Conductivity Measurements
4.5. Elemental Analyses
4.6. Plasmid DNA Cleavage
4.7. Cells and Cultures
4.8. Cell Sensitivity to Compounds
5. Patent
Supplementary Materials
Author Contributions
Funding
Data Availability Statement
Acknowledgments
Conflicts of Interest
References
- Ferlay, J.; Ervik, M.; Lam, F.; Colombet, M.; Mery, L.; Piñeros, M.; Znaor, A.; Soerjomataram, I.; Bray, F. Global Cancer Observatory: Cancer Today; International Agency for Research on Cancer: Lyon, France, 2020; Available online: https://gco.iarc.fr/today (accessed on 1 September 2023).
- Dhanyamraju, P.K.; Schell, T.D.; Amin, S.; Robertson, G.P. Drug-Tolerant Persister Cells in Cancer Therapy Resistance. Cancer Res. 2022, 82, 2503–2514. [Google Scholar] [CrossRef]
- Rani, J.J.; Roy, S. Recent Development of Copper (II) Complexes of Polypyridyl Ligands in Chemotherapy and Photodynamic Therapy. ChemMedChem 2023, 18, e202200652. [Google Scholar] [CrossRef]
- Godínez-Loyola, Y.; Gracia-Mora, J.; Rojas-Montoya, I.D.; Hernández-Ayala, L.F.; Reina, M.; Ortiz-Frade, L.A.; Rascón-Valenzuela, L.A.; Robles-Zepeda, R.E.; Gómez-Vidales, V.; Bernad-Bernad, M.J.; et al. Casiopeinas® third generation, with indomethacin: Synthesis, characterization, DFT studies, antiproliferative activity, and nanoencapsulation. RSC Adv. 2022, 12, 21662–21673. [Google Scholar] [CrossRef]
- Santini, C.; Pellei, M.; Gandin, V.; Porchia, M.; Tisato, F.; Marzano, C. Advances in Copper Complexes as Anticancer Agents. Chem. Rev. 2014, 114, 815–862. [Google Scholar] [CrossRef]
- Tabti, R.; Tounsi, N.; Gaiddon, C.; Bentouhami, E.; Desaubry, L. Progress in Copper Complexes as Anticancer Agents. Med. Chem. 2017, 07, 875–879. [Google Scholar] [CrossRef]
- Novoa-Aponte, L.; Argüello, J.M. Unique underlying principles shaping copper homeostasis networks. J. Biol. Inorg. Chem. 2022, 27, 509–528. [Google Scholar] [CrossRef]
- Kozlowski, H.; Janicka-Klos, A.; Brasun, J.; Gaggelli, E.; Valensin, D.; Valensin, G. Copper, iron, and zinc ions homeostasis and their role in neurodegenerative disorders (metal uptake, transport, distribution and regulation). Coord. Chem. Rev. 2009, 253, 2665–2685. [Google Scholar] [CrossRef]
- Kumar, P.; Tomar, S.; Kumar, K.; Kumar, S. Transition metal complexes as self-activating chemical nucleases: Proficient DNA cleavage without any exogenous redox agents. Dalton Trans. 2023, 52, 6961–6977. [Google Scholar] [CrossRef]
- Souza, I.P.; Melo, A.C.C.; Rodrigues, B.L.; Bortoluzzi, A.; Poole, S.; Molphy, Z.; McKee, V.; Kellett, A.; Fazzi, R.B.; Ferreira, A.M.C.; et al. Antitumor copper(II) complexes with hydroxyanthraquinones and N,N-heterocyclic ligands. J. Inorg. Biochem. 2023, 241, 112121. [Google Scholar] [CrossRef]
- Yu, Z.; Han, M.; Cowan, J.A. Toward the design of a catalytic metallodrug: Selective cleavage of G-quadruplex telomeric DNA by an anticancer copper-acridine-ATCUN complex. Angew. Chem. Int. Ed. 2014, 54, 1901–1905. [Google Scholar] [CrossRef]
- Fernández, C.Y.; Alvarez, N.; Rocha, A.; Ellena, J.; Costa-Filho, A.J.; Batista, A.A.; Facchin, G. New copper(II)-L-dipeptide-bathophenanthroline complexes as potential anticancer agents—Synthesis, characterization and cytotoxicity studies—And comparative DNA-binding study of related phen complexes. Molecules 2023, 28, 896. [Google Scholar] [CrossRef]
- Figueroa-DePaz, Y.; Resendiz-Acevedo, K.; Dávila-Manzanilla, S.G.; García-Ramos, J.C.; Ortiz-Frade, L.; Serment-Guerrero, J.; Ruiz-Azuara, L. DNA, a target of mixed chelate copper(II) compounds (Casiopeinas®) studied by electrophoresis, UV–vis and circular dichroism techniques. J. Inorg. Biochem. 2022, 231, 111772. [Google Scholar] [CrossRef]
- Carvalho, A.B.; Souza, I.P.; Andrade, L.M.; Binatti, I.; Pedroso, E.F.; Krambrock, K.; Oliveira, W.X.C.; Pereira-Maia, E.C.; Silva-Caldeira, P.P. Novel copper(II) coordination polymer containing the drugs nalidixic acid and 8-hydroxyquinoline: Evaluation of the structural, magnetic, electronic, and antitumor properties. Polyhedron 2018, 156, 312–319. [Google Scholar] [CrossRef]
- Nunes, C.J.; Borges, B.E.; Nakao, L.S.; Peyroux, E.; Hardré, R.; Faure, B.; Réglier, M.; Giorgi, M.; Prieto, M.B.; Oliveira, C.C.; et al. Reactivity of dinuclear copper(II) complexes towards melanoma cells: Correlation with its stability, tyrosinase mimicking and nuclease activity. J. Inorg. Biochem. 2015, 149, 49–58. [Google Scholar] [CrossRef]
- Erxleben, A. Interactions of copper complexes with nucleic acids. Coord. Chem. Rev. 2018, 360, 92–121. [Google Scholar] [CrossRef]
- Alvarez, N.; Viña, D.; Leite, C.M.; Mendes, L.F.S.; Batista, A.A.; Ellena, J.; Costa-Filho, A.J.; Facchin, G. Synthesis and structural characterization of a series of ternary copper(II)-L-dipeptide-neocuproine complexes. Study of their cytotoxicity against cancer cells including MDA-MB-231, triple negative breast cancer cells. J. Inorg. Biochem. 2020, 203, 110930. [Google Scholar] [CrossRef]
- Silva, P.P.; Guerra, W.; Silveira, J.N.; Ferreira, A.M.C.; Bortolotto, T.; Fischer, F.L.; Terenzi, H.; Neves, A.; Pereira-Maia, E.C. Two New Ternary Complexes of Copper(II) with Tetracycline or Doxycycline and 1,10-Phenanthroline and Their Potential as Antitumoral: Cytotoxicity and DNA Cleavage. Inorg. Chem. 2011, 50, 6414–6424. [Google Scholar] [CrossRef]
- Tsvetkov, P.; Coy, S.; Petrova, B.; Dreishpoon, M.; Verma, A.; Abdusamad, M.; Rossen, J.; Joesch-Cohen, L.; Humeidi, R.; Golub, T.R. Copper induces cell death by targeting lipoylated TCA cycle proteins. Science 2022, 375, 1254–1261. [Google Scholar] [CrossRef]
- Guo, J.; Sun, Y.; Liu, G. The mechanism of copper transporters in ovarian cancer cells and the prospect of cuproptosis. J. Inorg. Biochem. 2023, 247, 112324. [Google Scholar] [CrossRef]
- Zheng, P.; Zhou, C.; Lu, L.; Liu, B.; Ding, Y. Elesclomol: A copper ionophore targeting mitochondrial metabolism for cancer therapy. J. Exp. Clin. Cancer Res. 2022, 41, 271. [Google Scholar] [CrossRef]
- Filomeni, G.; Piccirillo, S.; Graziani, I.; Cardaci, S.; Ferreira, A.M.C.; Rotilio, G.; Ciriolo, M.R. The isatin-Schiff base copper(II) complex Cu(isaepy)2 acts as delocalized lipophilic cation, yields widespread mitochondrial oxidative damage and induces AMP-activated protein kinase-dependent apoptosis. Carcinogenesis 2009, 30, 1115–1124. [Google Scholar] [CrossRef]
- Mattioli, R.; Ilari, A.; Colotti, B.; Mosca, L.; Fazi, F.; Colotti, G. Doxorubicin and other anthracyclines in cancers: Activity, chemoresistance and its overcoming. Mol. Asp. Med. 2023, 93, 101205. [Google Scholar] [CrossRef]
- Geary, W.J. The use of conductivity measurements in organic solvents for the characterisation of coordination compounds. Coord. Chem. Rev. 1971, 7, 81–122. [Google Scholar]
- Abragam, A.; Bleaney, B. Electron Paramagnetic Resonance of Transition Ions; Oxford University Press: Oxford, UK, 2012. [Google Scholar]
- Braterman, P.S.; Song, J.I.; Peacock, R.D. Spectroelectrochemistry and localization of added electrons in ruthenium (II) mixed-ligand complexes. Spectrochim. Acta Part A Mol. Spectrosc. 1992, 48, 899–903. [Google Scholar] [CrossRef]
- Machatová, Z.; Barbieriková, Z.; Poliak, P.; Jancovicová, V.; Lukes, V.; Brezová, V. Study of natural anthraquinone colorants by EPR and UV/vis spectroscopy. Dye. Pigment. 2016, 132, 79–93. [Google Scholar]
- Pereira, E.; Fiallo, M.M.L.; Garnier-Suillerot, A.; Kiss, T.; Kozlowski, H. Impact of aluminium ions on adriamycin-type ligands. Dalton Trans. 1993, 3, 455–459. [Google Scholar] [CrossRef]
- Vinayagam, V.; Prabu, S.; Rajalakshmi, S.; Arumugam, M.N. Synthesis, characterization, DNA interaction, antimicrobial activity, DFT analysis and molecular docking studies of copper(II) complex with triazine and neocuproine. J. Mol. Struct. 2023, 1287, 135649. [Google Scholar] [CrossRef]
- Ganeshpandian, M.; Ramakrishnan, S.; Palaniandavar, M.; Suresh, E.; Riyasdeen, A.; Akbarsha, M.A. Mixed ligand copper(II) complexes of 2,9-dimethyl-1,10-phenanthroline: Tridentate 3N primary ligands determine DNA binding and cleavage and cytotoxicity. J. Inorg. Biochem. 2014, 140, 202–212. [Google Scholar] [CrossRef] [PubMed]
- Kellett, A.; Molphy, Z.; McKee, V.; Slator, C. Recent Advances in Anticancer Copper Compounds. In Metal-Based Anticancer Agents; Casini, A., Vessières, A., Meier-Menches, S.M., Eds.; Royal Society of Chemistry: Cambridge, UK, 2019; pp. 91–119. [Google Scholar]
- Slator, C.; Molphy, Z.; McKee, V.; Long, C.; Brown, T.; Kellet, A. Di-copper metallodrugs promote NCI-60 chemotherapy via singlet oxygen and superoxide production with tandem TA/TA and AT/AT oligonucleotide discrimination. Nucleic Acids Res. 2018, 46, 2733–2750. [Google Scholar] [CrossRef]
- Sakaguchi, U.; Addison, A.W. Spectroscopic and redox studies of some copper(II) complexes with biomimetic donor atoms: Implications for protein copper centres. J. Chem. Soc. Dalton Trans. 1979, 4, 600–608. [Google Scholar] [CrossRef]
- Sigman, D.S. Nuclease Activity of 1,10-phenanthroline-copper Ion. Acc. Chem. Res. 1986, 19, 180–186. [Google Scholar] [CrossRef]
- Stoll, S.; Schweiger, A. EasySpin, a comprehensive software package for spectral simulation and analysis in EPR. J. Magn. Reson. 2006, 178, 42–55. [Google Scholar] [CrossRef]
- Rigaku, O. CrysAlis PRO; Rigaku Oxford Diffraction: Yarnton, UK, 2015. [Google Scholar]
- Sheldrick, G.M. Crystal structure refinement with SHELXL. Acta Cryst. C Struct. Chem. 2015, 71 Pt 1, 3–8. [Google Scholar] [CrossRef]
- Farrugia, L.J. WinGX and ORTEP for Windows: An update. J. Appl. Cryst. 2012, 45, 849–854. [Google Scholar] [CrossRef]
- Barnes, C. ORTEP-3 for Windows—A version of ORTEP-III with a Graphical User Interface (GUI) by J. Farrugia. J. Appl. Cryst. 1997, 30, 568. [Google Scholar] [CrossRef]
- Macrae, C.F.; Bruno, I.J.; Chisholm, J.A.; Edgington, P.R.; McCabe, P.; Pidcock, E.; Rodriguez-Monge, L.; Taylor, R.; Streek, J.; Wood, P.A. Mercury CSD 2.0—New features for the visualization and investigation of crystal structures. J. Appl. Cryst. 2008, 41, 466–470. [Google Scholar] [CrossRef]

 ) and their ligands HL (
 ) and bpy (
 ), at concentrations of 1.0 × 10⁻⁵ mol L–1.
) and their ligands HL () and bpy (), at concentrations of 1.0 × 10⁻⁵ mol L–1.
), at concentrations of 1.0 × 10⁻⁵ mol L–1.
) and their ligands HL () and bpy (), at concentrations of 1.0 × 10⁻⁵ mol L–1.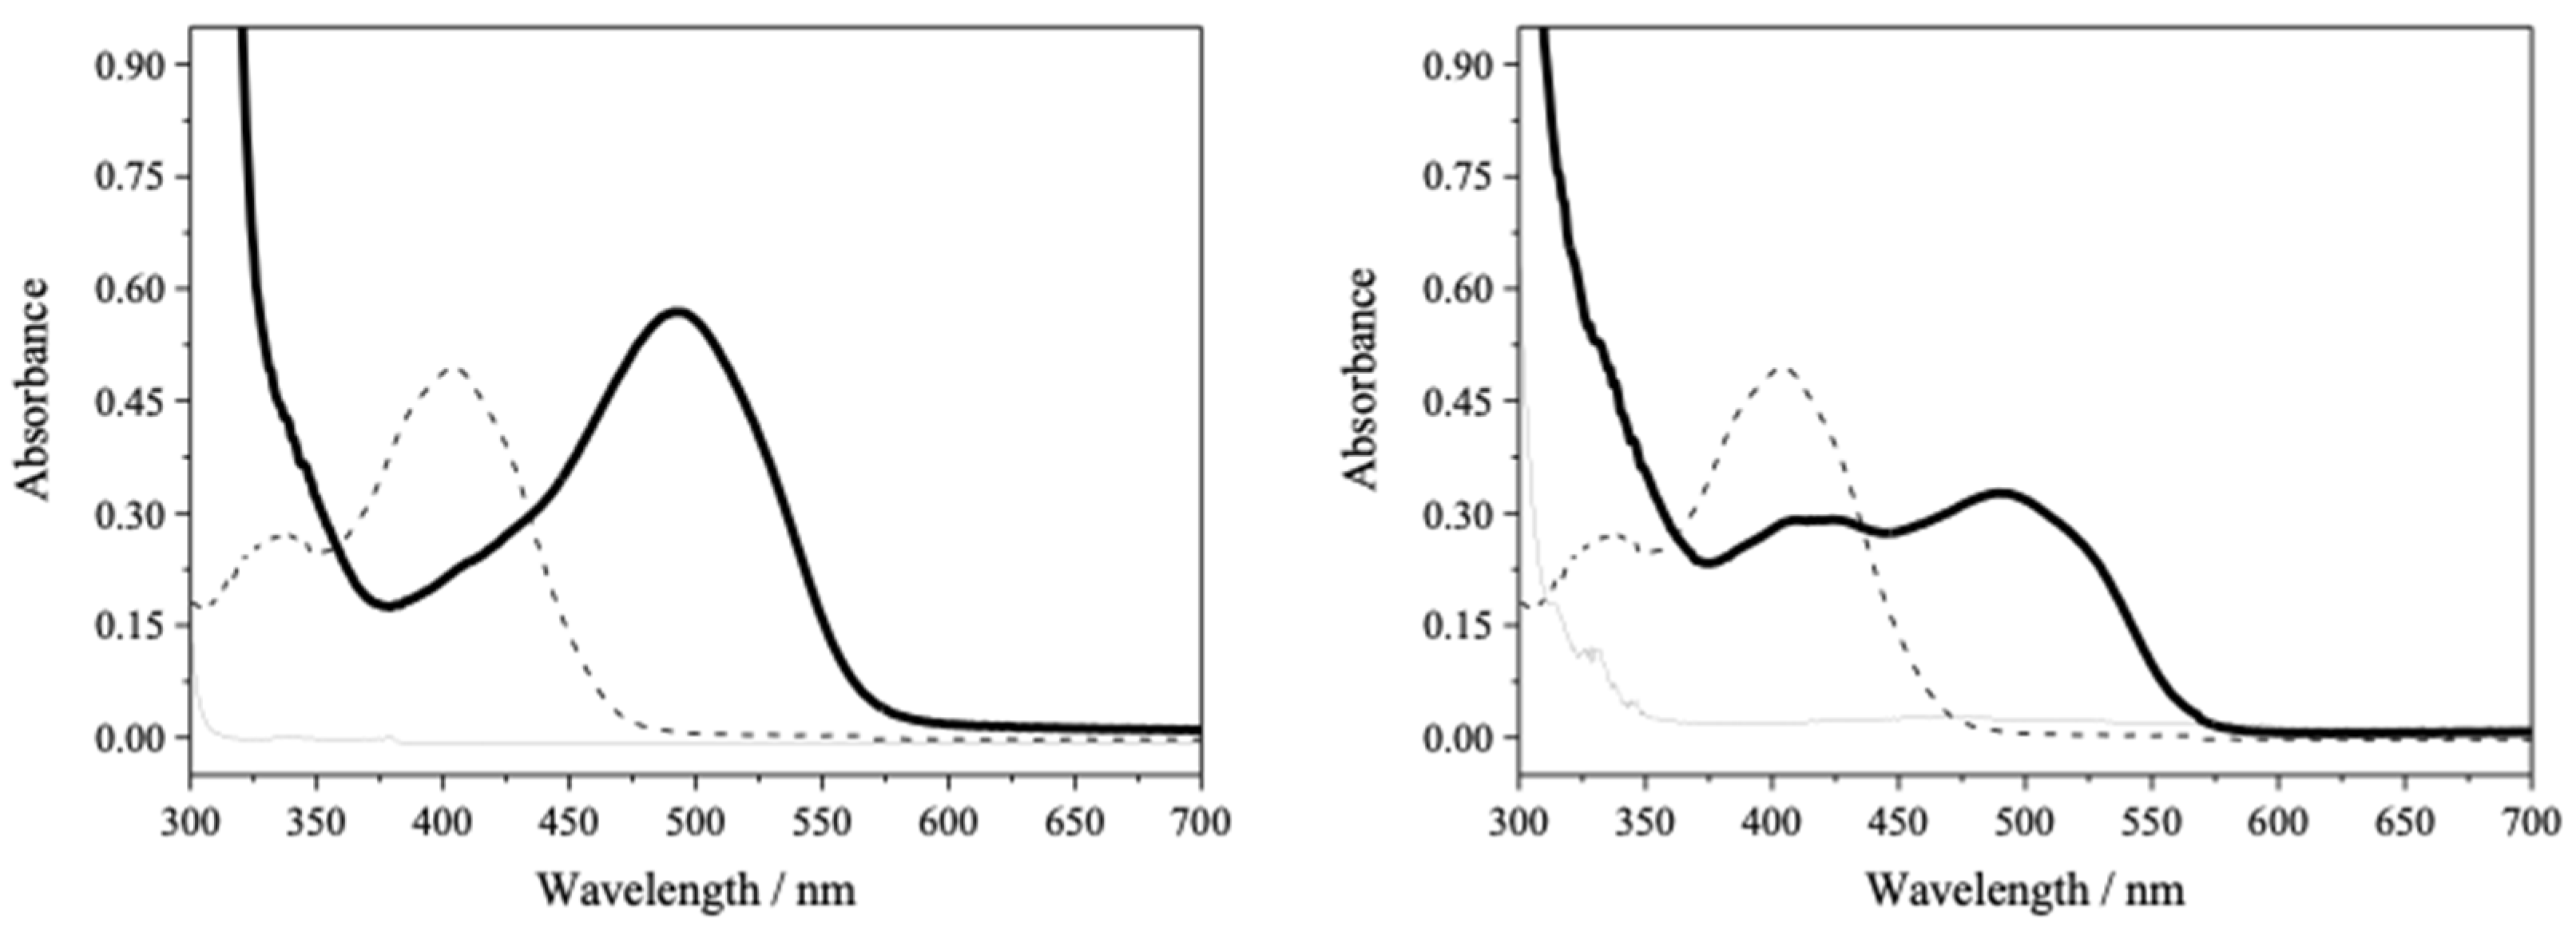

| Compound | Complex 1 | Complex 2.1 |
|---|---|---|
| Formula | C28H21N2O8ClCu | C26H21N2O8.5SClCu |
| MM/g mol−1 | 612.46 | 628.50 |
| Crystal system | Triclinic | Triclinic |
| Space group | P-1 | P-1 |
| a/Å | 9.2886(1) | 9.0562(2) |
| b/Å | 11.7516(2) | 12.6827(2) |
| c/Å | 12.9607(2) | 13.4040(1) |
| α, β, γ/° | 104.007(1), 104.096(1), 102.293(1) | 76.097(1), 71.503(1), 76.447(1) |
| V/Å3 | 1274.57(4) | 1396.18(4) |
| Temperature/K | 301(2) | 300(2) |
| Z | 2 | 2 |
| Dcalc/g cm−3 | 1.596 | 1.495 |
| Crystal size/mm | 0.06 × 0.09 × 0.19 | 0.04 × 0.15 × 0.23 |
| µ(Mo Kα)/cm−1 | 2.671 | 3.146 |
| Measured/unique reflections | 37,678/5437 | 41,284/5981 |
| Rint | 0.0363 | 0.0574 |
| Observed refletions [Fo2 > 2σ(Fo2)] | 4815 | 5277 |
| Refined parameters | 364 | 372 |
| Robs [Fo > 2σ(Fo)]/Rall | 0.0401/0.0440 | 0.0821/0.0868 |
| wRobs [Fo2 > 2σ(Fo)2]/wRall | 0.1104/0.1135 | 0.2544/0.2630 |
| S | 1.041 | 1.077 |
| RMS/e Å−3 | 0.051 | 0.151 |
| Bond Distance/Å | |||||
|---|---|---|---|---|---|
| 1 | 2 | 1 | 2 | ||
| Cu-O1 | 1.8931(17) | 1.943(3) | Cu-N1 | 2.035(2) | 1.989(3) |
| Cu-O2 | 1.9581(14) | 1.887(3) | Cu-N2 | 2.0467(19) | 1.996(3) |
| Cu-O4 | 2.2432(16) | 2.288(3) | Cu···Cu | 5.582 | 5.046 |
| Bond angle/° | |||||
| 1 | 2 | 1 | 2 | ||
| O1-Cu-O2 | 89.08(7) | 91.75(11) | O2-Cu-N1 | 90.82(7) | 167.34(13) |
| O1-Cu-O4 | 98.81(7) | 93.93(12) | O2-Cu-N2 | 159.90(8) | 90.98(12) |
| O1-Cu-N1 | 165.34(8) | 93.71(11) | N1-Cu-O4 | 95.80(7) | 95.97(12) |
| O1-Cu-N2 | 93.42(8) | 169.54(12) | N1-Cu-N2 | 81.79(9) | 81.69(12) |
| O2-Cu-O4 | 95.25(6) | 95.05(13) | N2-Cu-O4 | 104.05(7) | 95.89(13) |
| Hydrogen bond | |||||
| D-H···A | D-H/H···A/Å | D···A/Å | D-H···A/° | ||
| 1 | |||||
| O4-H4A···O3 i | 0.85/1.94 | 2.782(3) | 168.0 | ||
| O4-H4B···O5 | 0.85/2.05 | 2.806(3) | 147.5 | ||
| 2 | |||||
| C5-H5···O5 | 0.93/2.58 | 3.371(13) | 142.9 | ||
| C17-H17···O3 i | 0.93/2.48 | 3.359(5) | 158.3 | ||
| C20-H20···O3 i | 0.93/2.45 | 3.359(7) | 167.2 | ||
| C21-H21···O5 i | 0.93/2.56 | 3.466(11) | 164.0 | ||
| C23-H23···O8 ii | 0.93/2.48 | 3.287(13) | 145.6 | ||
| C25-H25A···O8 iii | 0.96/2.68 | 3.512(15) | 145.5 | ||
| C26-H26C···O7 iv | 0.96/2.62 | 3.476(15) | 148.7 | ||
| 77 K | 298 K | |||||||||||
|---|---|---|---|---|---|---|---|---|---|---|---|---|
| Complex | giso | g⊥ | g// | A// | A///g// * | gms2 | Ams2 | giso | g⊥ | g// | gms2 | |
| [Cu(dmp)(L)](ClO4) 1 | solid | - | 2.071 | 2.242 | - | - | - | - | - | 2.076 | 2.239 | - |
| [Cu(dmp)(L)](ClO4) 1 | dmso | 2.156 | 2.083 | 2.301 | 155 G | 138 | - | - | 2.124 | - | - | - |
| [Cu(bpy)(L)](ClO4) 2 | solid | 2.060 | - | - | - | - | - | - | 2.063 | - | - | - |
| [Cu(bpy)(L)](ClO4) 2 | dmso | 2.083 | 2.069 | 2.111 | 75 G | - | 4.172 | 87.0 | 2.069 | - | - | - |
| 2.104 | g1 = 2.316 g2 = 2.069 g3 = 1.926 | A1 = 103 | - | 2.107 | - | - | - | |||||
| Complex | Ksv/ L mol−1 | kq/ L mol−1 s−1 | Kb/ L mol⁻1 | n | R2 |
|---|---|---|---|---|---|
| 1 | 8.110 × 10³ | 8.110 × 10¹¹ | 5.912 × 10³ | 0.975 | 0.992 |
| 2 | 9.030 × 10³ | 9.030 × 10¹¹ | 4.506 × 10³ | 0.933 | 0.992 |
| 3 | 2.155 × 10⁴ | 2.155 × 10¹² | 3.911 × 10⁴ | 1.065 | 0.997 |
| Compound | IC50 a (µmol L−1 ± s.d.) | |
|---|---|---|
| K562 Cell Line | A431 Cell Line | |
| Complex 1 | 0.099 ± 0.001 | 0.16 ± 0.02 |
| Complex 2 | 9.80 ± 0.10 | 12.7 ± 0.13 |
| Complex 3 b | 1.84 ± 0.07 | - |
| [Cu(phen)2](ClO4)2 | 3.44 ± 0.30 | - |
Disclaimer/Publisher’s Note: The statements, opinions and data contained in all publications are solely those of the individual author(s) and contributor(s) and not of MDPI and/or the editor(s). MDPI and/or the editor(s) disclaim responsibility for any injury to people or property resulting from any ideas, methods, instructions or products referred to in the content. |
© 2023 by the authors. Licensee MDPI, Basel, Switzerland. This article is an open access article distributed under the terms and conditions of the Creative Commons Attribution (CC BY) license (https://creativecommons.org/licenses/by/4.0/).
Share and Cite
de Souza, Í.P.; Silva, J.R.L.; Costa, A.O.; Freitas, J.T.J.; Diniz, R.; Fazzi, R.B.; da Costa Ferreira, A.M.; Pereira-Maia, E.C. Heteroleptic Copper(II) Complexes Containing an Anthraquinone and a Phenanthroline as Synthetic Nucleases and Potential Anticancer Agents. Inorganics 2023, 11, 445. https://doi.org/10.3390/inorganics11110445
de Souza ÍP, Silva JRL, Costa AO, Freitas JTJ, Diniz R, Fazzi RB, da Costa Ferreira AM, Pereira-Maia EC. Heteroleptic Copper(II) Complexes Containing an Anthraquinone and a Phenanthroline as Synthetic Nucleases and Potential Anticancer Agents. Inorganics. 2023; 11(11):445. https://doi.org/10.3390/inorganics11110445
Chicago/Turabian Stylede Souza, Ívina P., Júlia R. L. Silva, Amanda O. Costa, Jennifer T. J. Freitas, Renata Diniz, Rodrigo B. Fazzi, Ana M. da Costa Ferreira, and Elene C. Pereira-Maia. 2023. "Heteroleptic Copper(II) Complexes Containing an Anthraquinone and a Phenanthroline as Synthetic Nucleases and Potential Anticancer Agents" Inorganics 11, no. 11: 445. https://doi.org/10.3390/inorganics11110445
APA Stylede Souza, Í. P., Silva, J. R. L., Costa, A. O., Freitas, J. T. J., Diniz, R., Fazzi, R. B., da Costa Ferreira, A. M., & Pereira-Maia, E. C. (2023). Heteroleptic Copper(II) Complexes Containing an Anthraquinone and a Phenanthroline as Synthetic Nucleases and Potential Anticancer Agents. Inorganics, 11(11), 445. https://doi.org/10.3390/inorganics11110445