
Characterizing the ZrBe2Hx Phase Diagram via Neutron Scattering Methods

1
NIST Center for Neutron Research, National Institute of Standards and Technology, 100 Bureau Drive, MS 6102, Gaithersburg, MD 20899, USA
2
Department of Materials Science and Engineering, University of Maryland, College Park, MD 20742, USA
3
RCB Hydrides, LLC., Franklin, OH 45005, USA
4
Institute for Energy Technology (IFE), P.O. Box 40, N-2027 Kjeller, Norway
*
Authors to whom correspondence should be addressed.
Inorganics 2023, 11(1), 1; https://doi.org/10.3390/inorganics11010001
Submission received: 23 November 2022
/
Revised: 15 December 2022
/
Accepted: 16 December 2022
/
Published: 20 December 2022
(This article belongs to the Special Issue Metal Hydrogen Systems: Fundamental Properties and Current Applications for Energy Storage and Conversion)
Abstract
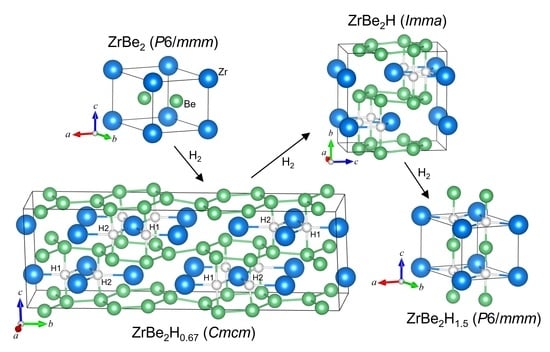
:Since the initial assessment four decades ago of zirconium diberyllide, ZrBe2, as a potential hydride-forming intermetallic for hydrogen-storage applications, structural and dynamical studies to date have been chiefly limited to the hydride composition, ZrBe2H1.5, which exists as a single-phase disordered hydride with hexagonal P6/mmm symmetry that undergoes hydrogen sublattice ordering below ~200 K (~235–250 K for ZrBe2D1.5). It is desirable from both fundamental and technological viewpoints to have a more complete understanding of the ZrBe2Hx phase diagram. In the present study, both neutron powder diffraction and neutron vibrational spectroscopy measurements of ZrBe2Hx at lower hydrogen contents (x < 1.5) indicate that at least two other ordered phases exist at low temperatures, coinciding with respective nominal x values of 1 and 0.67. Compared to ZrBe2H1.5, these more-hydrogen-dilute phases possess different structural symmetries (orthorhombic) with different H-sublattice orderings and undergo much-higher-temperature order-disorder transitions at ≈ 460 K (x = 1) and ≈ 490 K (x = 0.67) to the characteristic H-disordered hexagonal P6/mmm structure associated with ZrBe2H1.5.
1. Introduction
Intermetallic hydrides have been widely investigated for both fundamental reasons and possible uses as hydrogen-storage and energy-related materials of the future [1,2]. Despite this, relatively few experimental studies have been undertaken concerning hydrogen interactions with intermetallic compounds containing Be, despite its beneficially low atomic mass. Over the past dozen years, Be-rich intermetallics involving such secondary metals as Ti, V, Zr, and Nb have also attracted notice as advanced alternatives to pure Be neutron multipliers in nuclear fusion applications due to their lower chemical reactivity with steam that can drastically decrease hydrogen generation in a loss-of-coolant accident [3,4,5]. In this instance, it is critical to have a good understanding of the hydrogen interactions with these materials, which can be accomplished by more comprehensive experimental and theoretical studies [5].
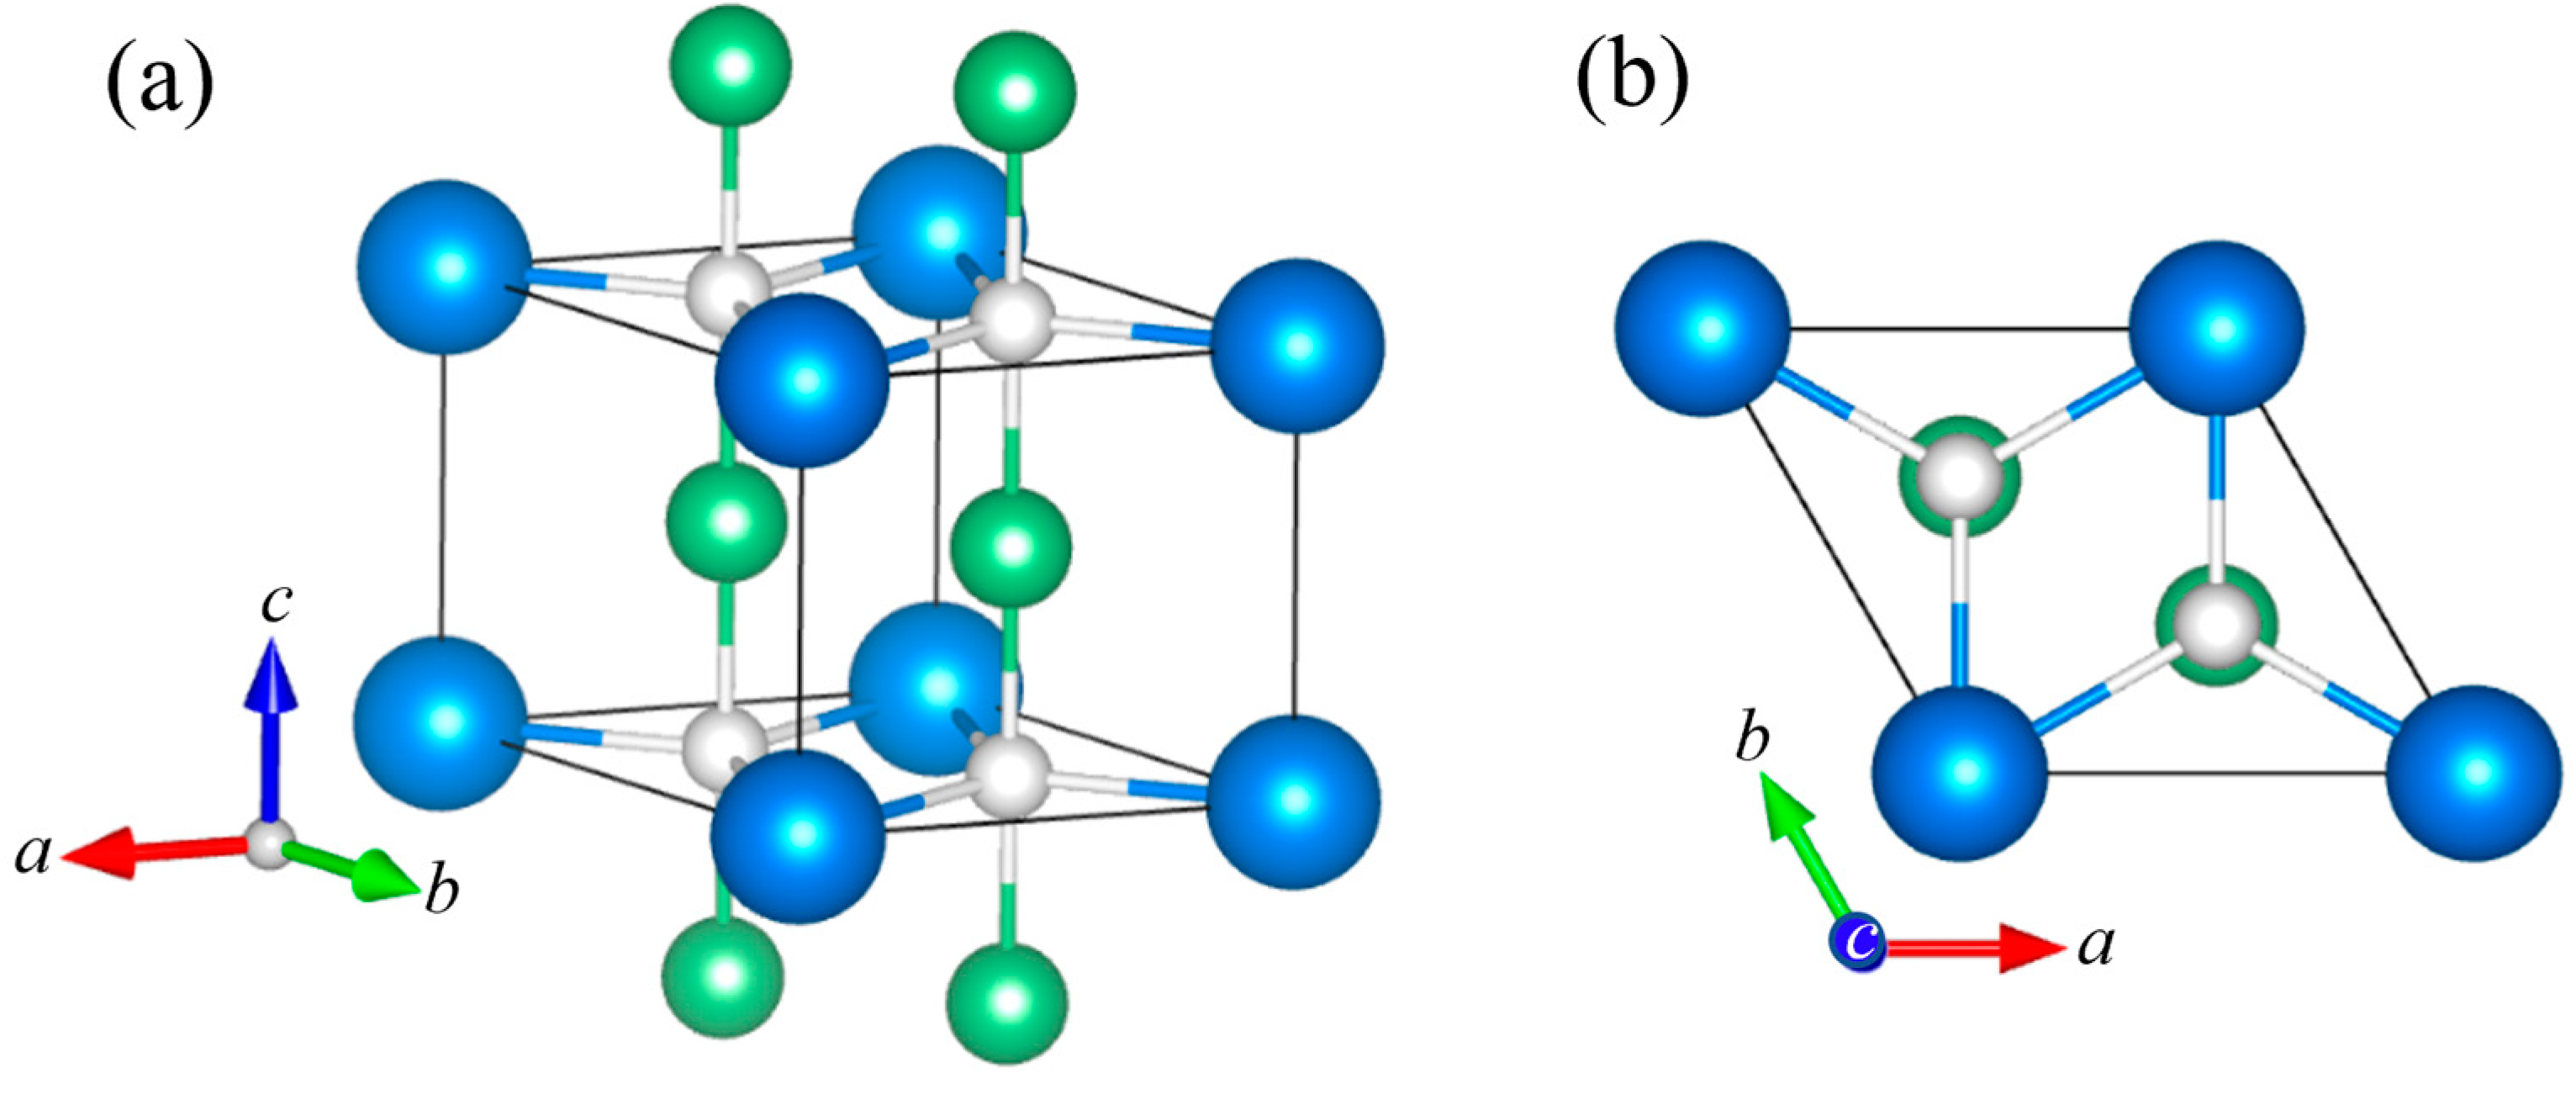
Among the scant experimental hydrogen-related investigations involving Be-based intermetallics, ZrBe2 is one of the most studied, but even then, mainly for one hydride content. From both fundamental and technological viewpoints, it is desirable to have a more complete understanding of the ZrBe2Hx phase diagram. ZrBe2 is hexagonal of AlB2 type (C32, P6/mmm) with alternating Zr and Be ab layers stacked along the c direction [6] (see Figure 1). It happens to be isostructural with the high-temperature conventional electron-phonon superconductor, MgB2 [7,8], a fact that has stimulated interesting theoretical comparisons between the latter and ZrBe2 before and after hypothetical hydrogen addition [9,10]. Upon investigating its potential as a lightweight hydrogen-storage material, Maeland and Libowitz [11,12] discovered that ZrBe2 could rapidly incorporate hydrogen under atmospheric H2 pressure at room temperature to form the hydride, ZrBe2H1.5 (although there was also evidence for a more H-rich hydride, ZrBe2H2.3, of unreported structure forming at a much higher hydrogen pressure of 13 MPa) [11,13]. ZrBe2H1.5 was further found to have a negligible hydrogen dissociation pressure (<1 kPa) at room temperature. A single H2 absorption isotherm (above the critical temperature) at 588 K has been reported [11], giving some further indication of ZrBe2Hx stability with respect to H content, with H2 vapor pressures ranging from 3 Pa at x ≈ 0.2 to 0.1 MPa at x ≈ 1. Another study reported that all hydrogen could be effectively removed by 973 K under vacuum [14].
Room-temperature neutron powder diffraction (NPD) results for ZrBe2D1.5 [15,16] indicated that the AlB2 structural symmetry of the host alloy is preserved with a slight lattice expansion of ~1.7% (7.3% c-axis elongation and 2.7% a-axis contraction), and the deuterium atoms reside on average in the Zr-defined planes in trigonal Zr-atom interstices straddled by two Be atoms in the c-direction (i.e., trigonal bipyramidal BeZr3Be 2c sites) (see Figure 1). The two such sites per formula unit are partially occupied at random. Lowering the temperature below ≈250 K led to a few additional small superstructure reflections, which could not be indexed on the hexagonal unit cell, but possibly on enlarged orthorhombic cells [16]. Moreover, refinement models for the 12 K powder pattern favored slight out-of-plane shifts of the D atoms in the c direction away from the trigonal bipyramidal 2c sites into the neighboring tetrahedral BeZr3 4h sites (with an average displacement of ±15 pm). The temperature-dependent behavior of the additional reflections suggested that the D atoms mainly occupy tetrahedral sites in an unknown superstructure at 12 K and undergo a second-order disordering transition starting at 250 K to occupy, on average, the trigonal bipyramidal sites at room temperature [16].
A subsequent 9Be nuclear magnetic resonance (NMR) study [14] independently signaled the presence of an order-disorder transition at ~235 K for ZrBe2D1.4 and at ~200 K for ZrBe2H1.4 as evidenced by the transformation from a single pair of 9Be quadrupolar satellites above the transition temperature to the splitting of each quadrupolar satellite into two below the transition temperature. In addition, the temperature dependence of the satellite frequencies and the appearance of two-phase coexistence spectra were indicative of a first-order phase transition. Deuterium NMR measurements [17] were also able to sense the order-disorder transition in ZrBe2D1.4 and ZrBe2D1.56 near 240 K based on the behavior of the deuterium relaxation times T1 and T2. Decreasing the temperature below 240 K resulted in a rapid decrease in T2 and a rapid increase in T1, indicating a phase change with dramatically reduced D atom mobility. Moreover, upon cooling down across the 240 K transition, the D NMR spectrum transformed from a relatively narrow quadrupolar doublet with ~1 kHz [reflecting a small motionally averaged electric field-gradient (EFG) at the D atoms] to a rapidly broadened distribution of quadrupolar splittings and EFGs. This indicated a shift to a broad distribution of D-atom site environments in the low-temperature ordered phase, which was postulated to arise from both Be and D displacements to compensate for strong Be–D repulsion. Such repulsion may lead to marked Be displacements toward vacant D-atom sites and be an important driving force behind low-temperature vacancy ordering. It should be noted that, despite 9Be NMR evidence of an order-disorder transition in ZrBe2H1.4, and in contrast to the D NMR results for ZrBe2D1.4, proton NMR measurements for ZrBe2H1.4 failed to detect such a transition [18,19,20].
Concomitant density functional theory (DFT) calculations [14] for various proposed vacancy-ordered ZrBe2H1.5 structures suggested that the energy was lowest when the vacancies were kept apart. Moreover, the energy consequences of vacancy-ordering within the Zr plane were found to be much more important than those stemming from vacancy-ordering along the c-direction. Singh and Gupta [10] performed later DFT calculations for ZrBe2, ZrBe2H2, and supercells representing ZrBe2Hx (x < 2), focusing more on the physics behind the potential c-axis displacements of H away from the trigonal bipyramidal position previously suggested by NPD. For hypothetical ZrBe2H2, where all 2c sites are filled, they found that H displacements along the c axis were energetically preferred for certain displacement patterns due to peculiarities in the electronic structure involving strong displacement-sensitive coupling of H s and Zr d bands near the Fermi energy. Although the tendency to displace lessened for x < 2 (i.e., with the presence of vacant H sites), weak H c-axis displacements with a wide distribution of magnitudes were still to be expected at x = 1.5, consistent with the prior low-temperature NPD and NMR results [14,16]. Thus, based on the accumulated NPD, NMR, and DFT results for ZrBe2(H/D)x (x~1.4–1.56), it seems probable that a coordinated combination of c-axis H (and D) displacements (as well as compensating Be and Zr atomic shifts) and H/D-vacancy ordering occurs for ZrBe2(H/D)1.5 below its order-disorder phase-transition temperature, forming a complex superstructure of still unknown character.
Besides the interesting low-temperature structural ordering that occurs in ZrBe2(H/D)1.5, NMR and neutron scattering methods have been used to help characterize the associated diffusive and vibrational H dynamics. Proton spin-lattice relaxation rate and pulse-field-gradient (PFG) spin-echo NMR measurements [19,20] (for ZrBe2H1.4) confirmed that two-dimensional H diffusion occurs facilely within the partially-H-occupied ab planes of trigonally arranged Zr atoms sandwiched between the Be planes. The PFG data between 272 K and 478 K yielded a diffusion activation enthalpy Ha = 0.25 (2) eV [20]. Quasielastic neutron scattering (QENS) measurements for the more H-dilute compound ZrBe2H0.56 (with the same P6/mmm structure in the probed temperature region as ZrBe2H1.4) found a similar Ha value of 0.30 (2) eV between 530 K and 580 K [21,22].
A neutron vibrational spectroscopy (NVS) study of ZrBe2H1.5 and ZrBe2D1.5 [15] (presumably at room temperature), using a neutron time-of-flight spectrometer in neutron energy gain with relatively low resolution, reported various H- and D-related scattering features. For ZrBe2H1.5, a broad feature indicated the presence of two peaks near 84 meV and 100 meV, with another lower-energy feature observed at 52 meV. For ZrBe2D1.5, two features were observed, one at 70 meV and another at 48 meV. The higher-energy features for both hydride and deuteride samples were assigned to H and D optical vibrations based on the roughly harmonic energy shifts observed as expected due to the differences in isotopic masses. The lack of significant energy shifts for the lower-energy H and D features suggested that they were due to acoustic modes. Although the 70 meV feature for ZrBeD1.5 could not be resolved into two peaks, the corresponding bimodal higher-energy H feature for ZrBe2H1.5 was tentatively assigned to H vibrations perpendicular (at 84 meV) and parallel (at 100 meV) to the Zr basal plane.
It is worth mentioning three other isostructural intermetallic hydrides that have been reported in the literature, Zr0.7Ti0.3Be2H0.9 [11], HfBe2H1.1 [11], and ThNi2D2 [23]. Unfortunately, for the former two compounds, no further detailed structural information was provided. NPD measurements for the latter compound ThNi2D2 confirmed the trigonal bipyramidal NiTh3Ni (2c) site occupation for D. Compared to ThNi2, the 2.5% c-axis elongation was about one-third that of ZrBe2D1.5. This relatively weaker expansion coupled with a 2.3% a-axis contraction (more similar to that for ZrBeD1.5) resulted in a slight volume contraction of ~2.2%,
To the best of our knowledge, except for the 500 K P6/mmm structure reported for ZrBe2H0.56 in the previous QENS study [21,22], no more comprehensive crystallographic information is available for lower hydrogen contents below ZrBe2H1.5. The NMR studies of ZrBe2D1.4, ZrBe2D1.5, and ZrBe2D1.56 [14,17] suggested that the parent P6/mmm ZrBe2Dx structure and corresponding transition temperature behave in a similar fashion for a range of D contents between at least x = 1.4 and 1.56. It has not yet been reported what happens to the ZrBe2Hx phase diagram at lower x values. Hence, here we report NPD results concerning the structural behavior of ZrBe2Hx below x ≈ 1.5, which indicate that at least two other distinct crystallographic phases with ordered H sublattices exist at lower hydrogen contents. Moreover, we present and characterize the H-weighted phonon density of states of ZrBe2Hx for a range of hydrogen contents, as measured by NVS.
2. Materials and Methods
ZrBe2D1.5 and ZrBe2H1.5 samples were provided by A. J. Maeland and synthesized as reported previously [15]. ZrBe2 was made by arc-melting the appropriate molar compositions of the pure elements under argon to form 5 g to 10 g buttons. The melting was repeated several times to ensure homogeneity. Single-phase materials were obtained without annealing, as shown by X-ray diffraction. The samples were evacuated at about 873 K down to a pressure of 10−5 Pa. High-purity hydrogen and deuterium were subsequently loaded to form ZrBe2H1.5 and ZrBe2D1.5 sample compositions via gas-phase absorption at room-temperature and atmospheric pressure. ZrBe2D1.5 was the same sample used in [16] and was not further altered. More hydrogen-dilute ZrBe2Hx samples with x = 1.2, 0.9, and 0.6 were sequentially formed from ZrBe2H1.5 via thermal annealing at 673 K while removing calibrated amounts of hydrogen via gas-phase expansion into known volumes, followed by cooling back down to room temperature. The ZrBe2H0.6 sample was the same one used in [22], in which neutron prompt-gamma activation analysis (PGAA) independently measured a hydrogen stoichiometry x = 0.56 (4). No similar PGAA measurements were undertaken for the other samples. During measurements, samples were temperature-regulated using closed-cycle He refrigerators. Samples were typically sealed in V and Al (6 mm diameter × 50 mm height) tubular sample cans during respective NPD and NVS measurements, although some NPD measurements for ZrBe2H1.2 were performed in the same Al can used for NVS measurements.
All neutron scattering measurements were carried out at the NIST Center for Neutron Research. NPD measurements were performed using the BT-1 high-resolution powder diffractometer [24] with the Cu (311) monochromator at a wavelength of 1.5391 (1) Å. The wavelengths were calibrated using an Al2O3 standard. The horizontal divergences were 15′, 20′, and 7′ of arc for the in-pile, monochromatic-beam, and diffracted-beam collimators, respectively. Data were collected every 0.05° over a 2θ angular range of 3 to 160°. All refinements were carried out with the Rietveld method [25] using the program GSAS [26]. Neutron-scattering amplitudes used in the refinements were 7.16, 7.79, 6.67, and −3.74 fm for Zr, Be, D, and H, respectively [27]. Wavelength errors were not included in the standard deviations of the unit cells, i.e., the precisions reported in this paper for the structural parameters reflect the quality of the data and the corresponding Rietveld refinement model, assuming a fixed neutron wavelength.
Additional NPD measurements following the temperature progression of individual Bragg peaks were performed with the BT-4 Triple-Axis Spectrometer using the pyrolytic graphite PG (002) monochromator in conjunction with a 5 cm thick PG filter at a wavelength of either 2.3578 (8) Å or 1.5288 (8) Å. The horizontal divergences were 60′, 40′, and 40′ of arc for the in-pile, monochromatic-beam, and diffracted-beam collimators, respectively.
NVS measurements were performed with the BT-4 Filter-Analyzer Neutron Spectrometer (FANS) [28] using the Cu (220) monochromator. Depending on the sample, the horizontal divergences were 40′ or 20′ of arc for both the in-pile and monochromatic-beam collimators. Data reported for ZrBe2H1.5 were collected with only a Be filter before the FANS detector bank instead of the normal combination of Be, pyrolytic graphite, and Bi filter layers [28], which resulted in a relatively poorer resolution, but not enough to hinder a meaningful comparison with the other sample spectra. The resulting instrumental resolutions (full width at half maximum) are denoted by horizontal bars beneath the spectra.
In conjunction with the two newly discovered low-temperature ordered ZrBe2Hx phases, first-principles calculations were performed within the plane-wave implementation of the generalized gradient approximation to Density Functional Theory (DFT) using a Vanderbilt-type ultrasoft potential with Perdew–Burke–Ernzerhof exchange correlation [29]. A cutoff energy of 544 eV and a 12 × 12 × 12 k-point mesh (generated with the Monkhorst-Pack scheme) were used and found to be enough for the total energy to converge within 0.01 meV/atom. Phonon densities of states (PDOSs) were calculated from the 0 K DFT-optimized structures using the supercell method (3 × 3 × 3 cell size) with finite displacements [30,31] For comparison with the NVS measurements, each PDOS was appropriately weighted to take into account the H, Be, and Zr total neutron scattering cross sections; averaged over the momentum-transfer (Q) space accessed by the FANS instrument; and corrected to account for the instrumental resolution.
All structural depictions were made, in part, using the VESTA (Visualization for Electronic and Structural Analysis) software [32]. For all figures, standard uncertainties are commensurate with the observed scatter in the data, if not explicitly designated by vertical error bars.
3. Results and Discussion
3.1. Neutron Powder Diffraction
NPD patterns were collected for the ZrBe2D1.5, ZrBe2H1.5, ZrBe2H1.2, ZrBe2H0.9, and ZrBe2H0.6 samples at various temperatures. Select patterns and accompanying structure refinements are shown in the Supplementary Materials. Table 1 lists the structural phases found at room temperature. All samples contained additional small Bragg features due to 2% to 3% hexagonal ZrBe5 impurity phase [33], consistent with previous NPD measurements [16].
The ZrBe2D1.5 sample was measured at 4 K and 300 K with better statistics and resolution than in [16] in an attempt to shed more light on the low-temperature ordered structure (see Figures S1 and S2). At 300 K, besides the fundamental Bragg peaks from the known P6/mmm structure (in Figure 1) and small peaks from the ZrBe5 impurity, there are also additional trace Bragg peaks that do not belong to any reported Zr-Be solid solution phases and cannot be indexed to a single phase. At 4 K, besides these trace peaks already present at 300 K, there are numerous additional weak satellite peaks, some of which were previously identified in [16] as due to some type of ordering that may involve laterally modulated c-axis displacements of the D atoms. As both sets of peaks at 300 K and 4 K are not compatible with the fundamental Bragg peaks of hexagonal ZrBe2D1.5, i.e., the d-spacing associated with these peaks cannot be expressed by the lattice parameters of the basic P6/mmm ZrBe2D1.5 structure with the corresponding integer-hkl relations, they cannot be indexed together with the average structure into a conventional single phase. Hence, the complicating pattern of these extra small Bragg peaks precludes any better understanding of the exact nature of the low-temperature structural ordering that occurs for ZrBe2D1.5. We can only speculate that, although the trace peaks present at both 300 K and 4 K are of unknown origin and may well reflect minor impurities, the second set of peaks appearing at 4 K due to the low-temperature ordering probably signal an incommensurately modulated structure induced by contributions from both D displacements and vacancy ordering. Structural parameters at 4 K and 300 K are listed in Table S1. At 300 K, the refined lattice parameters based on a disordered hexagonal structure (while ignoring the first set of extra trace peaks) are a = 3.716718 (3) Å, c = 3.474097 (3) Å, and V = 41.562 (1) Å3.
NPD patterns for the ZrBe2H1.5 sample at 15 K, 300 K, 400 K, and 500 K indicated the same P6/mmm structure as reported for ZrBe2D1.5 (see Figures S3 and S4). Interestingly, there were no extra satellite peaks appearing in the 15 K pattern to mark the occurrence of long-range ordering. If present, they were too diffusive to be recognizable, any delineation being further hindered by the higher incoherent scattering background associated with H compared to D. It is always possible that any low-temperature ordering in ZrBe2H1.5 is inherently of much shorter range compared to that for ZrBe2D1.5, leading to excessive satellite peak broadening. Structural parameters are listed in Tables S2 and S3. At 300 K, a = 3.71971 (3) Å, c = 3.47680 (4) Å, and V = 41.661 (1) Å3, values only slightly higher than for ZrBe2D1.5.
In contrast to the ZrBe2H1.5 sample, structural refinements for the three ZrBe2Hx samples with relatively less H content indicated the presence at room temperature of two new structurally unique, orthorhombic, H-sublattice-ordered ZrBe2Hx phases coinciding with respective nominal x values of 1 and 0.67. Although the model fits for the ZrBe2H phase yielded x values close to 1, the model fits for the ZrBe2H0.67 phase yielded x values more noticeably less than the ideal 0.67, suggesting that this ordered structure may prefer to be more H-deficient due to the presence of partial H-site occupations. Nonetheless, for simplicity in the ensuing discussions, the two new structural compounds will be referred to as ZrBe2H and ZrBe2H0.67. ZrBe2H is the only compound phase found in the ZrBe2H0.9 sample, whereas both compound phases are found in the ZrBe2H0.6 sample with ZrBe2H0.67 being the roughly 80 % majority phase. (The minor presence of ZrBe2H in the ZrBe2H0.6 sample is likely due to incomplete homogenization of H among ZrBe2Hx crystallites during the formation of the ZrBe2H0.6 sample from the ZrBe2H0.9 sample.) The NPD data for the ZrBe2H0.9 and ZrBe2H0.6 samples (Figures S8–S11) were the respective bases for structural determinations of these new ZrBe2H and ZrBe2H0.67 phases. The NPD data for the ZrBe2H1.2 sample (e.g., Figures S5–S7), which was found to contain both ZrBe2H and ZrBe2H~1.3–1.4 (i.e., more H-deficient ZrBe2H1.5) compound phases in a roughly 2:1 ratio, was also used to follow more extensively the temperature behavior of the ZrBe2H phase.
In both ZrBe2H and ZrBe2H0.67 model structures, the H atoms are located at the center of the trigonal bipyramidal BeZr3Be sites. Models incorporating additional positional disorder due to small H displacements from the Zr plane to the two off-center tetrahedral Zr3Be sites above and below did not show significant improvements compared to that for bipyramidal occupation regarding the goodness-of-fit R-factors, H displacement parameters, etc., so they were not considered further. This is in line with the previous DFT results [10], which suggested that the tendency for favorable off-center H displacements in ZrBe2Hx disappears for x ≤ 1.
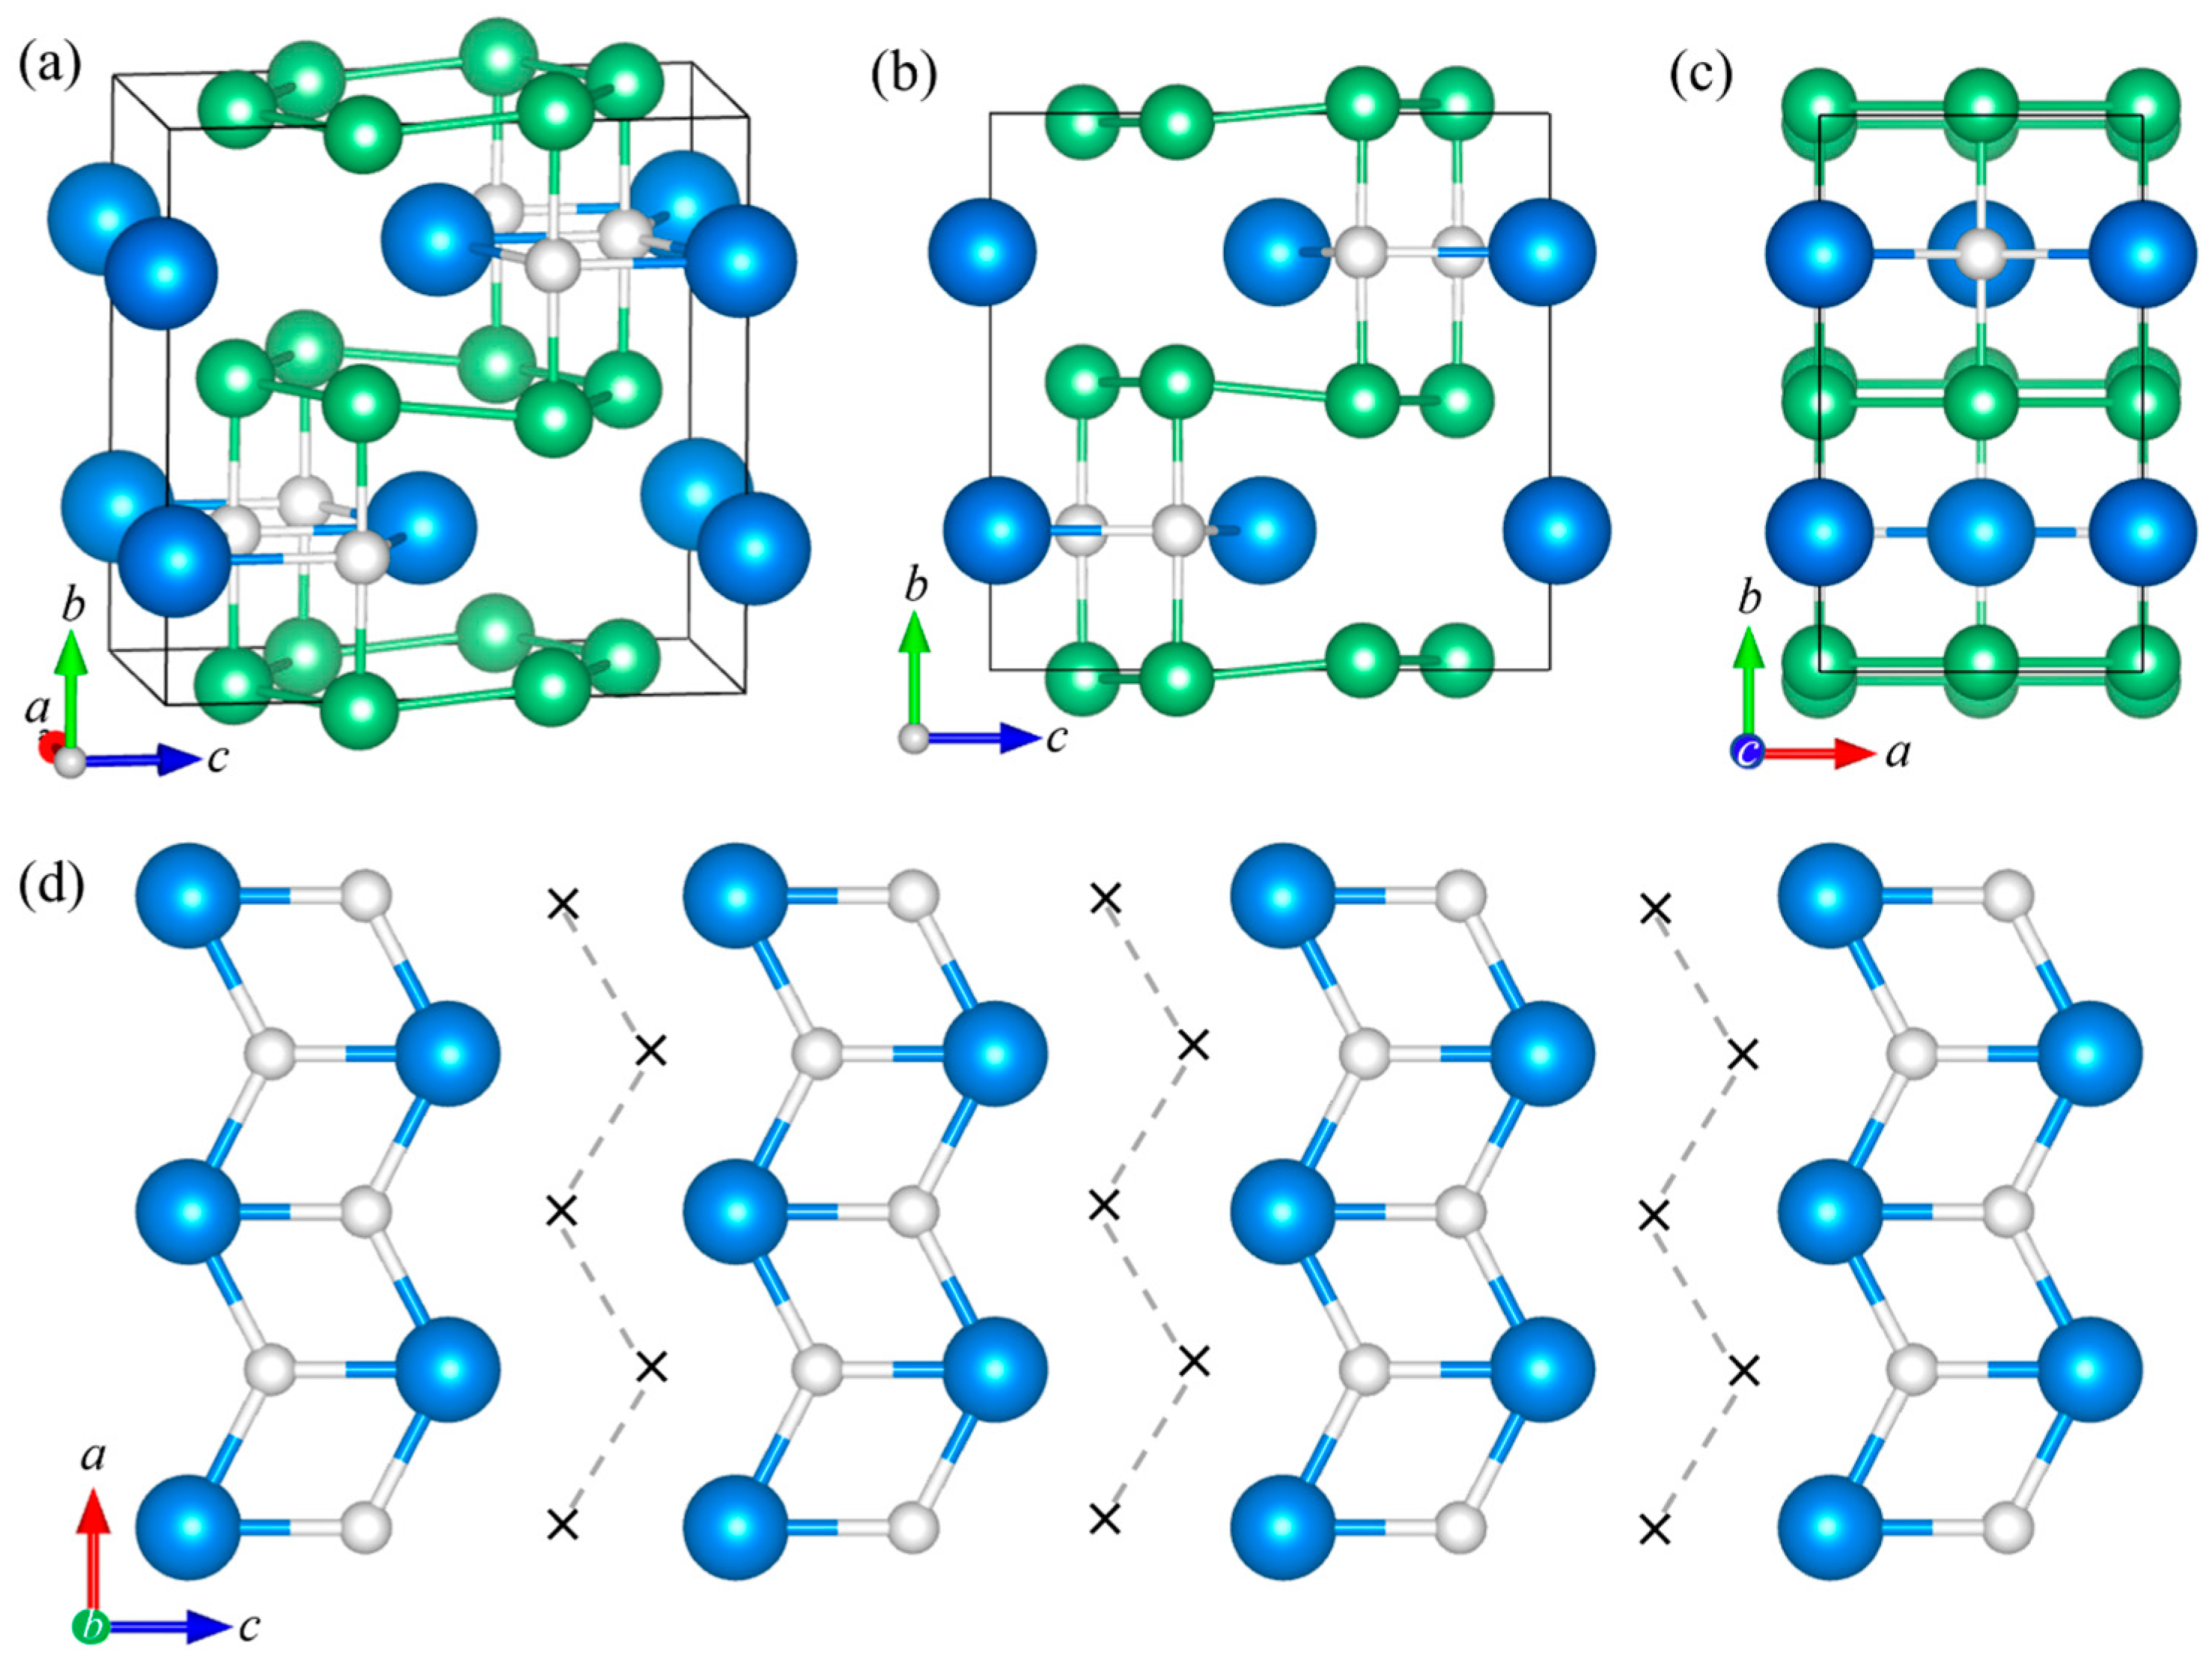
Figure 2 shows the ordered ZrBe2H structure. It possesses orthorhombic Imma symmetry. It should be noted that, for comparisons with the hexagonal P6/mmm structure in Figure 1, the orthorhombic b-axis of ZrBe2H in Figure 2 corresponds to the hexagonal c-axis in Figure 1. Tables S4–S7 summarize the ZrBe2H structural parameters. At 295 K, a = 3.8064 (2) Å, b = 6.55939 (9) Å, c = 6.5947 (3) Å, and V = 164.655 (4) Å3. Model refinements indicate that H atoms in orthorhombic ZrBe2H occupy specific trigonal Zr3 (4e) sites with near unity occupation (0.98 (1)) in the Zr ac-planes. Figure 2b shows the zigzag chains of H atoms in the Zr planes that form along the a-axis, separated by zigzag chains of vacancies. In neighboring Zr ac-planes, this arrangement of chains is nominally shifted in both the a-direction and c-direction by one-half of a unit cell. The presence of H in a particular BeZr3Be trigonal bipyramid causes a contraction of the Zr3 triad (due to Zr-H attraction) and an expansion of the Be-Be distance (due to Be-H repulsion). This results in comparatively expanded vacant Zr3 triads (yielding slight in-plane deviations from the ideal trigonal Zr planar network) and a rippling of the Be honeycomb ac-layers. At 295 K, the filled and empty BeZr3Be trigonal bipyramids display respective Be-Be separations of 3.496 (2) Å and 3.063 (2) Å, the latter separation presumably too small to accommodate an H atom. The H positions possess Be-H separations of 1.7481 (8) Å and Zr-H separations of 2.13 (2) Å and 2.145 (8) Å.
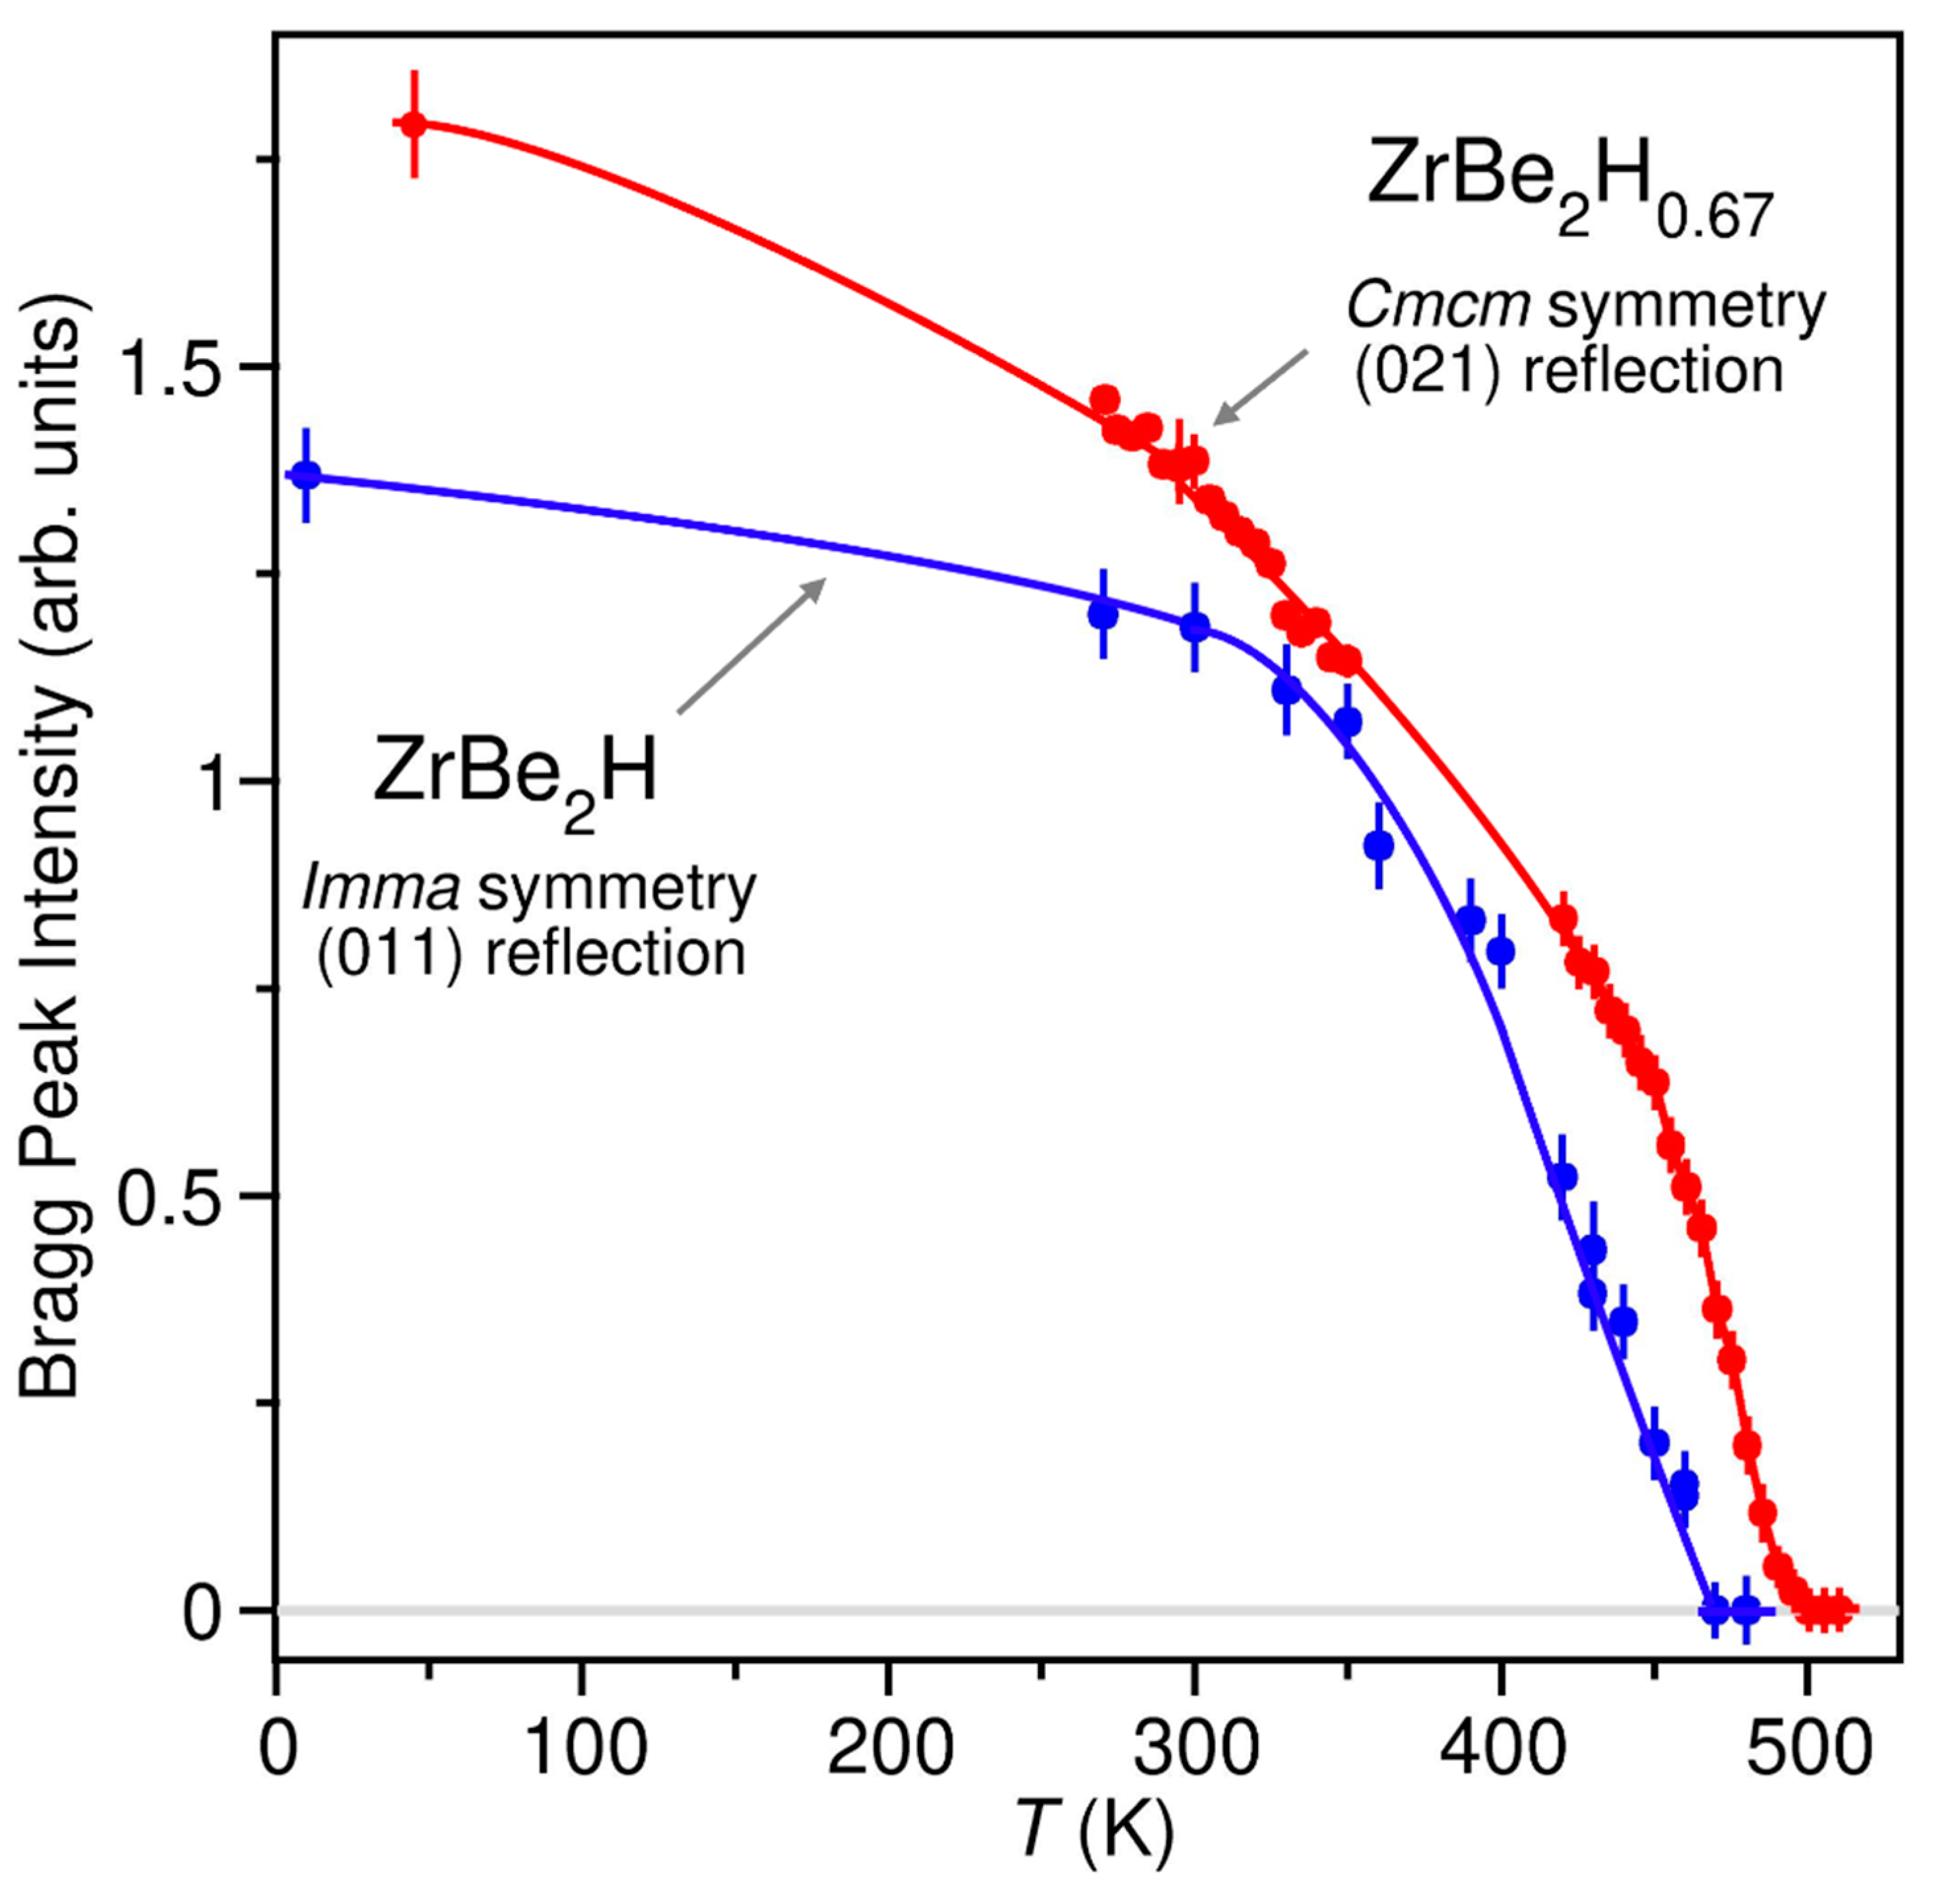
NPD patterns for ZrBe2H at different temperatures between 10 K and 480 K indicate that a transition from the orthorhombic ordered Imma phase to the hexagonal disordered P6/mmm phase with half-filled H sites (depicted in Figure 1) occurs near 460 K. This transition is reflected by the observed temperature progression of the (011) Bragg peak intensity for orthorhombic ZrBe2H in Figure 3, a reflection that is forbidden for P6/mmm symmetry.
The more extensive temperature-dependent NPD data collected for the ZrBe2H1.2 sample suggested that the observed decay of the (011) Bragg peak intensity with increasing temperature for the ZrBe2H order-disorder phase transition is not due to a spillover of H into other crystallographically distinct, vacant sites, such as marked in Figure 2, but rather mainly by an increasing displacement parameter. Indeed, according to the Fourier difference map, only the one H 4e position was evident in the orthorhombic ZrBe2H structure at all temperatures measured below the 460 K phase-transition temperature. Moreover, for all ZrBe2H1.2 sample data below 460 K, refinement of the 4e site occupancy resulted in values exceeding unity, so its value was fixed at 1 in all subsequent model refinements. (See Figures S5 and S6 and Table S4).
Figure 4 shows the ordered ZrBe2H0.67 structure. It possesses orthorhombic Cmcm symmetry. Table S8 summarizes the ZrBe2H0.67 structural parameters. At 295 K, a = 3.8161 (2) Å, b = 19.8247 (11) Å, c = 6.4997 (1) Å, and V = 491.724 (14) Å3.
Model refinements associated with the ZrBe2H0.6 sample at 45 K (see Figure S9) indicate that H atoms in the orthorhombic ZrBe2H0.67 phase occupy two crystallographically distinct trigonal Zr3 (4c) sites (H1 and H2), both with the same immediate surroundings, being at the center of BeZr3Be trigonal bipyramids. Figure 4b shows that these H1 and H2 atoms form double chains in the Zr planes along the a-axis, each double chain separated by four parallel chains of trigonal Zr3 vacancies. In neighboring Zr ab-planes, H1 and H2 designations are swapped and the general arrangement of double chains is nominally shifted in the a-direction by one-half of a unit cell and in the b-direction by one-sixth of a unit cell.
As for orthorhombic ZrBe2H, the presence of an H atom in a particular BeZr3Be trigonal bipyramid of ZrBe2H0.67 causes a contraction of the Zr3 triad and an expansion of the Be-Be distance, again resulting in comparatively expanded vacant Zr3 triads and a rippling of the Be honeycomb ab-layers (see Figure 4). At 295 K, the H1-filled and H2-filled BeZr3Be trigonal bipyramids display respective Be-Be separations of 3.571 (8) Å and 3.299 (7) Å. The four types of empty BeZr3Be trigonal bipyramids display varying Be-Be separations of 2.874 (8) Å, 2.929 (8) Å, 3.200 (7) Å, and 3.626 (8) Å, the relatively large latter separation associated with the bipyramids containing the vacant H3 positions marked by a red × in Figure 4b,d. The H1 positions possess Be-H1 separations of 1.786 (4) Å and Zr-H1 separations of 2.05 (2) Å and 2.202 (9) Å. The H2 positions possess Be-H2 separations of 1.650 (4) Å and Zr-H2 separations of 2.14 (4) Å and 2.19 (2) Å.
The differences in H ordering within the Zr planes between orthorhombic ZrBe2H0.67 and ZrBe2H shown in Figure 2d and Figure 4b are noteworthy. In ZrBe2H0.67, H atoms tend to localize in close pairs (with 2.17 (4) Å H-H separations at 295 K) situated in the double Zr3 centers of a chain of toe-to-toe Zr triangle pairs with one shared edge, whereas in ZrBe2H, all H atoms localize in zigzag chains with two close H neighbors (with 2.22 (2) Å H-H separations at 295 K), each H atom situated in the Zr3 centers of a zigzag chain of shoulder-to-shoulder Zr triangles with two shared edges. We note that the close H-H distances in all the ZrBe2Hx compounds studied are comparable to the ~2.1 Å minimum value necessary for hydride stability [34], with the lowest value of 2.08 (4) Å determined for ZrBe2H0.67 at 45 K. Unlike the DFT results for vacancy-ordered ZrBe2H1.5 structures where maximum vacancy separation seems to be favored [14], the H ordering in the more H-dilute ZrBe2H and ZrBe2H0.67 suggests that there is some energetic advantage to specific clustering patterns for both H and vacancies.
The 45 K and 295 K patterns for ZrBe2H0.67 (Figures S9 and S10) look similar and could be fit using the same model containing two H positions, H1 and H2. According to the refinements, the H1 site is close to fully occupied whereas the H2 site is partially occupied (e.g., ≈82 (4)% at 45 K). We note that the 295 K pattern could also be fit equally well using an alternative model with a small amount of H partially occupying a third 4c position, H3, already mentioned above (which is located at the centers of the BeZr3Be trigonal bipyramids neighboring the H1 positions; see Figure 4b,d and Table S8), and thus all three sites, H1, H2, and H3, have partial occupancies of around 0.79 (6), 0.75 (7), and 0.26 (7), respectively. For the 45 K pattern, the three-site model diverged during refinement and thus was not representative at this temperature. Although only tentative based solely on these two NPD patterns, the refinement results suggest that the two-site model at 45 K may gradually transform towards a three-site model as the temperature is increased, with some minor amount of H entering the neighboring empty trigonal bipyramid site already by 295 K. Of course, this would be a different thermal behavior than the apparent lack of temperature-induced H site spillover observed for orthorhombic ZrBe2H. We note that this particular spillover site does make steric sense since the associated BeZr3Be trigonal bipyramid has an unusually elongated Be-Be separation (3.626 (8) Å at 295 K) that is even larger than those respective Be-Be separations (3.571 (8) Å and 3.299 (7) Å) corresponding to the filled H1 and H2 sites. Indeed, this differs dramatically from the prohibitively short 3.063 (2) Å Be-Be separations for the empty BeZr3Be trigonal bipyramids in orthorhombic ZrBe2H.
In contrast to the 45 K and 295 K patterns, the 500 K pattern for ZrBe2H0.67 (Figure S11) indicates a change from the ordered orthorhombic structure to the same disordered hexagonal P6/mmm structure displayed in Figure 1 by disordered ZrBe2H1.5 and ZrBe2H, with H partially occupying, at random, one-third of all BeZr3Be trigonal bipyramids. By following the intensity of the characteristic (021) Bragg reflection associated with Cmcm symmetry as a function of temperature up to 510 K (see Figure 3), we ascertained that the phase transition from orthorhombic Cmcm to hexagonal P6/mmm occurs at ≈ 490 K, which is roughly 30 K and 290 K higher than the respective order-disorder transition temperatures for ZrBe2H and ZrBe2H1.5. Again, as we have full NPD patterns for the ZrBe2H0.6 sample at only two temperatures, 45 K and 295 K, we cannot completely discount H site spillover as at least partially responsible (besides increasing H displacement parameters) for the temperature-dependent decay of the (021) Bragg peak intensity for orthorhombic ZrBe2H0.67 in Figure 3.
As mentioned earlier, the ZrBe2H1.2 sample was found to be a mixture of ZrBe2H and ZrBe2H~1.3–1.4 phases at all temperatures. Below 460 K, the ZrBe2H phase is ordered orthorhombic and the ZrBe2H~1.3–1.4 phase is disordered hexagonal. Above 460 K, orthorhombic ZrBe2H transforms to the P6/mmm structure (i.e., the same disordered model structure as hexagonal ZrBe2H~1.3–1.4 but with a different H content and thus different lattice parameters). The H content of the ZrBe2H~1.3–1.4 phase is based on the refined values for H occupancy and marks the lower limit of H content for the nominally hexagonal ZrBe2H1.5 phase. A comparison of NPD data at various temperatures (e.g., see Figures S5–S7) suggest that the lower x limit at 300 K and below is ~1.4 and may drift down to ~1.3 by 460 K. Yet, this observation is tentative since, at high temperatures, H site occupancies are highly correlated to their atomic displacement parameters, precluding their accurate determination. The 460 K value is estimated only after reasonably fixing the displacement parameters. It is not clear what the upper x limit is for this phase, although the previous NMR studies of ZrBe2Dx indicated an x value as high as 1.56 is possible [17]. Nonetheless, from the current and past results, it seems clear that the hexagonal ZrBe2H1.5 phase can exist for a range of H content (from x ≈ 1.3 to >1.5).
As the 300 K volume/f.u. for the ZrBe2H phase in the ZrBe2H1.2 sample is found to be slightly larger by ~0.3% than that at similar temperature for the ZrBe2H phase in the ZrBe2H0.9 sample (see Tables S4 and S7), this suggests that there is a real, albeit slight, difference in H content for the nominal ZrBe2H phase in the two samples. This is consistent with the occurrence of refined H 4e site occupancies always >1 for the ZrBe2H phase in the ZrBe2H1.2 sample (necessitating its fixed value of 1) compared to a refined occupancy value of 0.98(1) for that in the ZrBe2H0.9 sample. Hence, this signals that there is likely some limited range of H content possible (x ≈ 0.98 to 1) for a stabilized ZrBe2H phase.
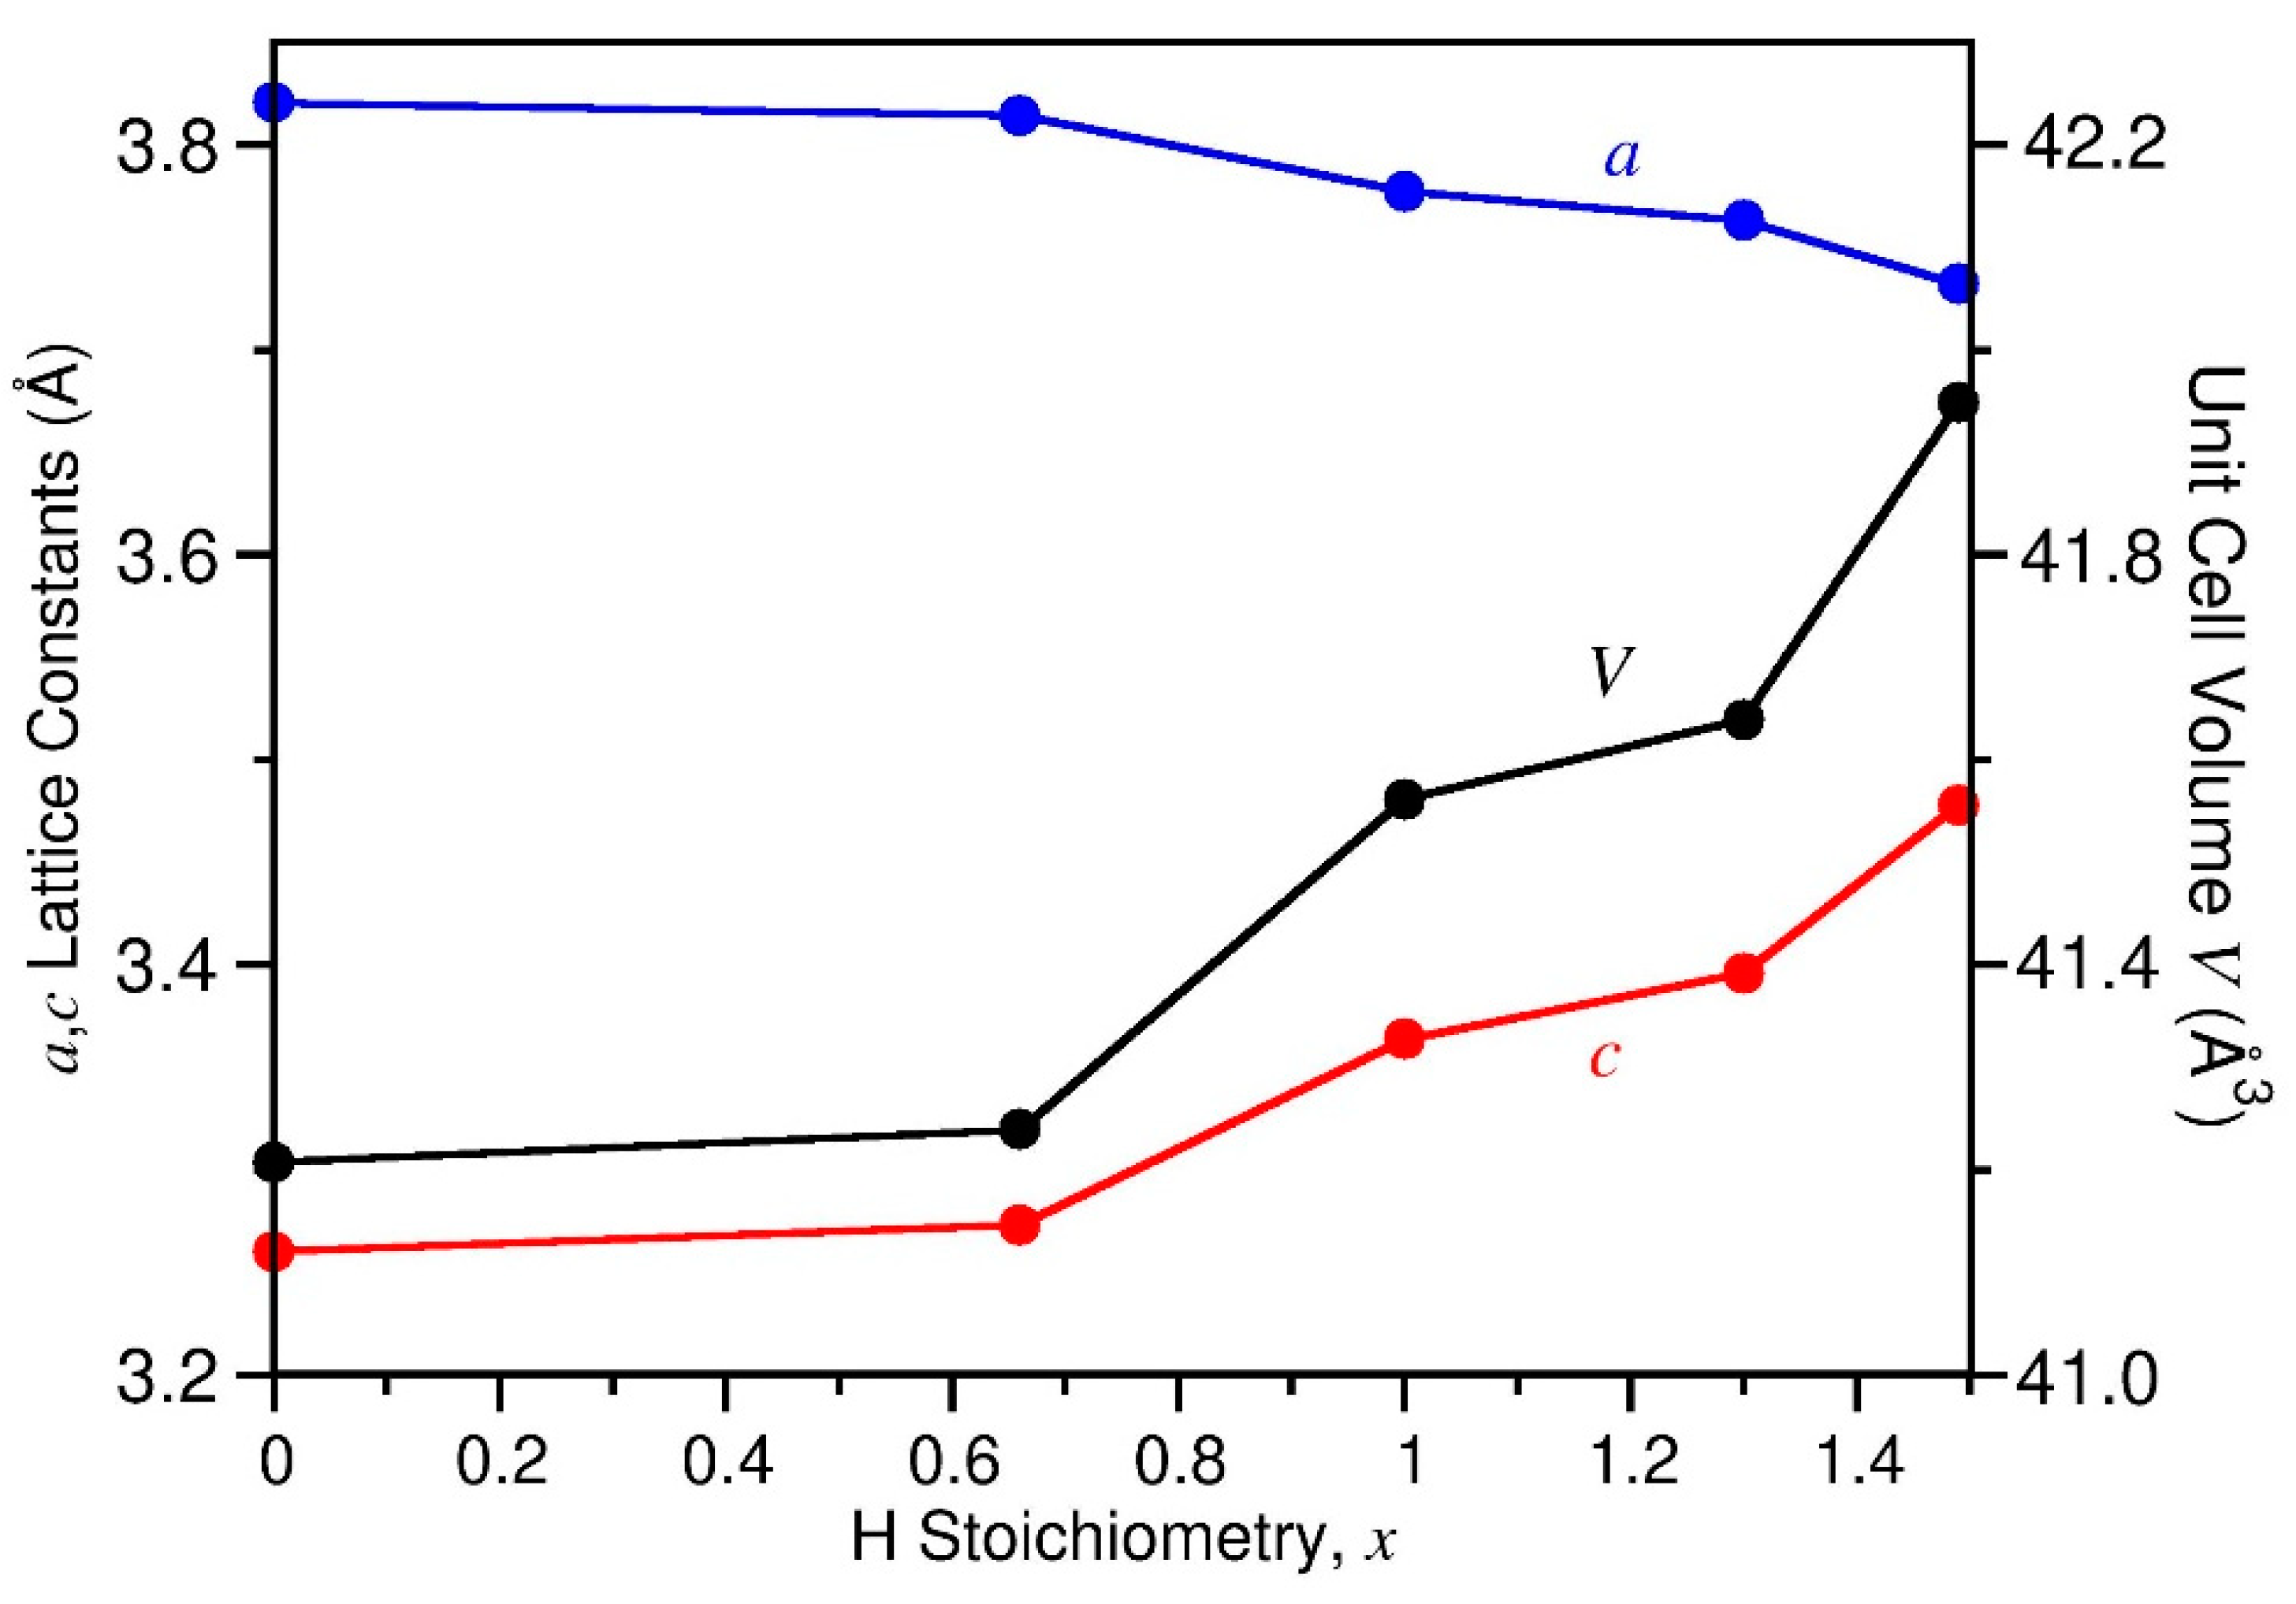
A plot of the hexagonal P6/mmm lattice constants for ZrBe2Hx near or at 500 K as functions of increasing x in Figure 5 indicates a decreasing a lattice constant concomitant with a more steeply increasing c lattice constant. The net result is an increasing unit cell volume V with increasing H content. For dilute H contents (i.e., x < 0.67), the changes in a and c and the increase in V are minimal but all become more dramatic as the H content increases above x = 0.67. This corresponds well to the observation by Westlake [13] that the H2 absorption isotherm data at 588 K [11] for x ≤ 0.5 closely follow Sieverts’ Law [35] (i.e., the solubility of a diatomic gas in a metal is proportional to the square root of the partial pressure of the gas in thermodynamic equilibrium). Indeed, in this more dilute solid-solution region, the overall ZrBe2 framework dimensions are little perturbed by the inclusion of H atoms, and x is found to be proportional to (PH2)½. In contrast, at higher x values, the ZrBe2 framework dimensions become more markedly affected by the more numerous H atoms, leading to a significant positive deviation from Sieverts’ Law. As for the orthorhombic ordered ZrBe2H0.67 and ZrBe2H phases, within this hexagonal solid-solution phase, the decreasing a lattice constant reflects a basal-plane contraction due to the attractive Zr-H interactions, whereas the increasing c lattice constant reflects the repulsive Be-H interactions.
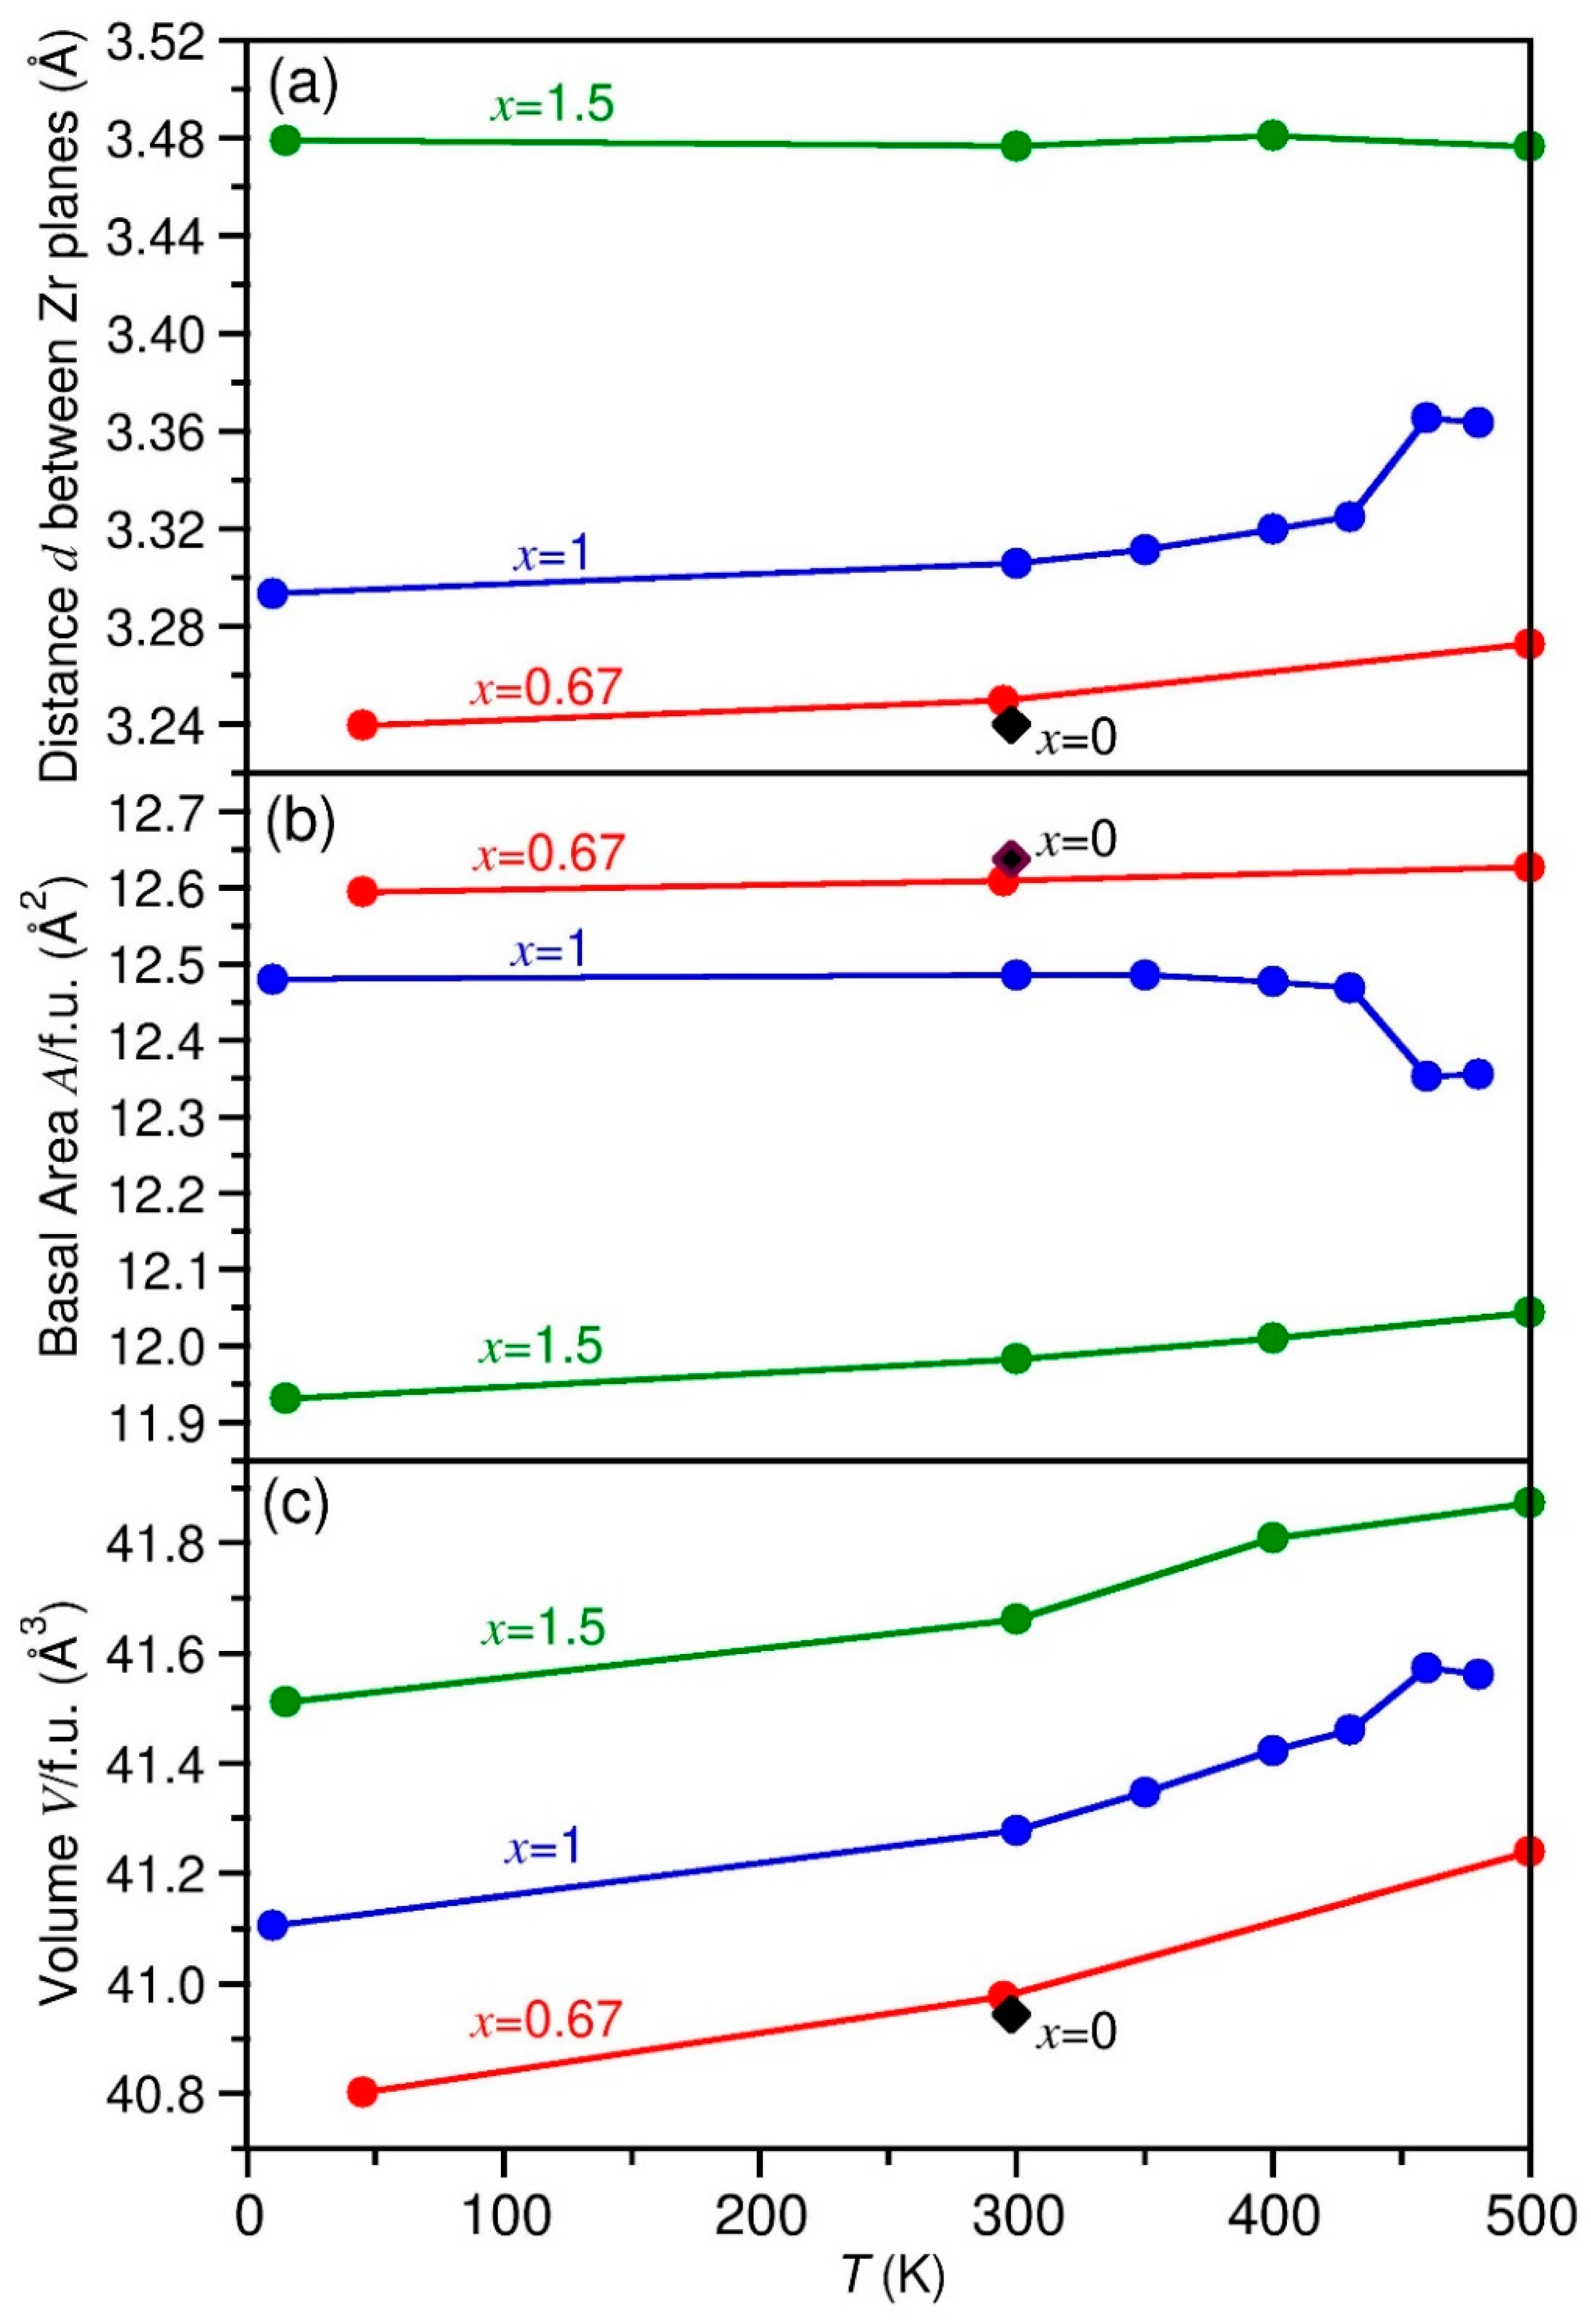
Figure 6 conveys the lattice expansion behavior of the three compounds ZrBe2H0.67, ZrBe2H, and ZrBe2H1.5 as functions of temperature, as determined from the NPD results for the ZrBe2H0.6, ZrBe2H1.2, and ZrBe2H1.5 samples listed in Tables S3, S6 and S8. Data are plotted in a way that allows for a meaningful comparison of the changing dimensions of the structural hexagonal or quasi-hexagonal (in reference to the orthorhombic phases) ZrBe2 template. Figure 6a shows the temperature evolution of the distance d between Zr planes for the three compounds. This is measured parallel to the crystallographic c-direction for all phases except for orthorhombic ZrBe2H, in which it is measured parallel to the crystallographic b-direction (see Figure 2). Figure 6b shows the temperature evolution of the average Zr basal-plane area A/ZrBe2Hx formula unit (f.u.). This refers to the ab basal plane for all phases except for orthorhombic ZrBe2H, in which it refers to the ac basal plane. Figure 6c shows the temperature evolution of the average volume V/ZrBe2Hx f.u., where V = d × A. This is equivalent to the unit cell volume of the hexagonal P6/mmm phase and one-fourth and one-twelfth of the unit cell volumes of the respective orthorhombic Imma and Cmcm phases.
As alluded to in Figure 5, The room-temperature lattice-parameter values for ZrBe2, designated by the black diamonds in Figure 6, are not much different than those for the ordered orthorhombic ZrBe2H0.67 phase, again indicating that the overall volume of the underlying ZrBe2 template is largely able to accommodate the inclusion of this small amount of H without much volume expansion. In contrast, as the H content increases above x = 0.67, the average volume/f.u. (seen in Figure 5 and Figure 6c) increases more significantly over the whole temperature range in a roughly linear fashion with x, with V expanding by around 0.8 (1) Å3/H atom. Figure 6a indicates that the distance d between Zr planes noticeably expands with increasing x above 0.67 to compensate for repulsive Be-H interactions, whereas the average basal-plane area A (in Figure 6b) noticeably contracts in response to attractive Zr-H interactions.
It is noteworthy that the orthorhombic-to-hexagonal phase change for ZrBe2H near 460 K is marked by a step up in the d spacing in Figure 6a concomitant with a step down in the basal-plane area A in Figure 6b. No similarly obvious step behaviors are observed for ZrBe2H0.67 during its orthorhombic-to-hexagonal phase change near 490 K. Although the lack of clear step changes in the latter case may merely be an artifact of sparser data points, it may otherwise be an indicator of different H-site-spillover behaviors for the ordered orthorhombic ZrBe2H and ZrBe2H0.67 phases as discussed earlier. In particular, the lack of H spillover into other neighboring empty crystallographic sites in orthorhombic ZrBe2H up to the phase-transition temperature might well manifest itself by a relatively low d spacing and a relatively high basal-plane area A in this region due to the peculiar accommodating effects of the persistent double-chain H-atom ordering observed for this structure. As the transition occurs, the step change to a now random distribution of H atoms in the hexagonal structure could trigger clear step changes in lattice parameters. In contrast, for orthorhombic ZrBe2H0.67, a more gradual shift to H site disorder via site spillover with increasing temperature (as hinted by the NPD data) as the transition to complete disorder is approached may ultimately attenuate any transition-induced step-change effects in the lattice parameters.
As pointed out earlier for the ordered orthorhombic ZrBe2H0.67 and ZrBe2H phases, H occupation of BeZr3Be trigonal bipyramids result in planar contraction of the Zr3 triads and expansion of the Be-Be separations. This is reflected structurally by ab planar displacements of the associated Zr atoms and c-axis displacements of the associated Be atoms. These displacements should occur even in the hexagonal disordered ZrBe2Hx structure, although in a disordered fashion, and this would be reflected by noticeable anisotropic behaviors in the associated Zr and Be displacement parameters. Indeed, the refined 15 K and 300 K anisotropic displacement parameters for ZrBe2H1.5 listed in Table S2 indicate relatively large ab basal-plane components compared to the c-axis component for Zr and a relatively a large c-axis component compared to the ab basal-plane components for Be.
3.2. Neutron Vibrational Spectroscopy
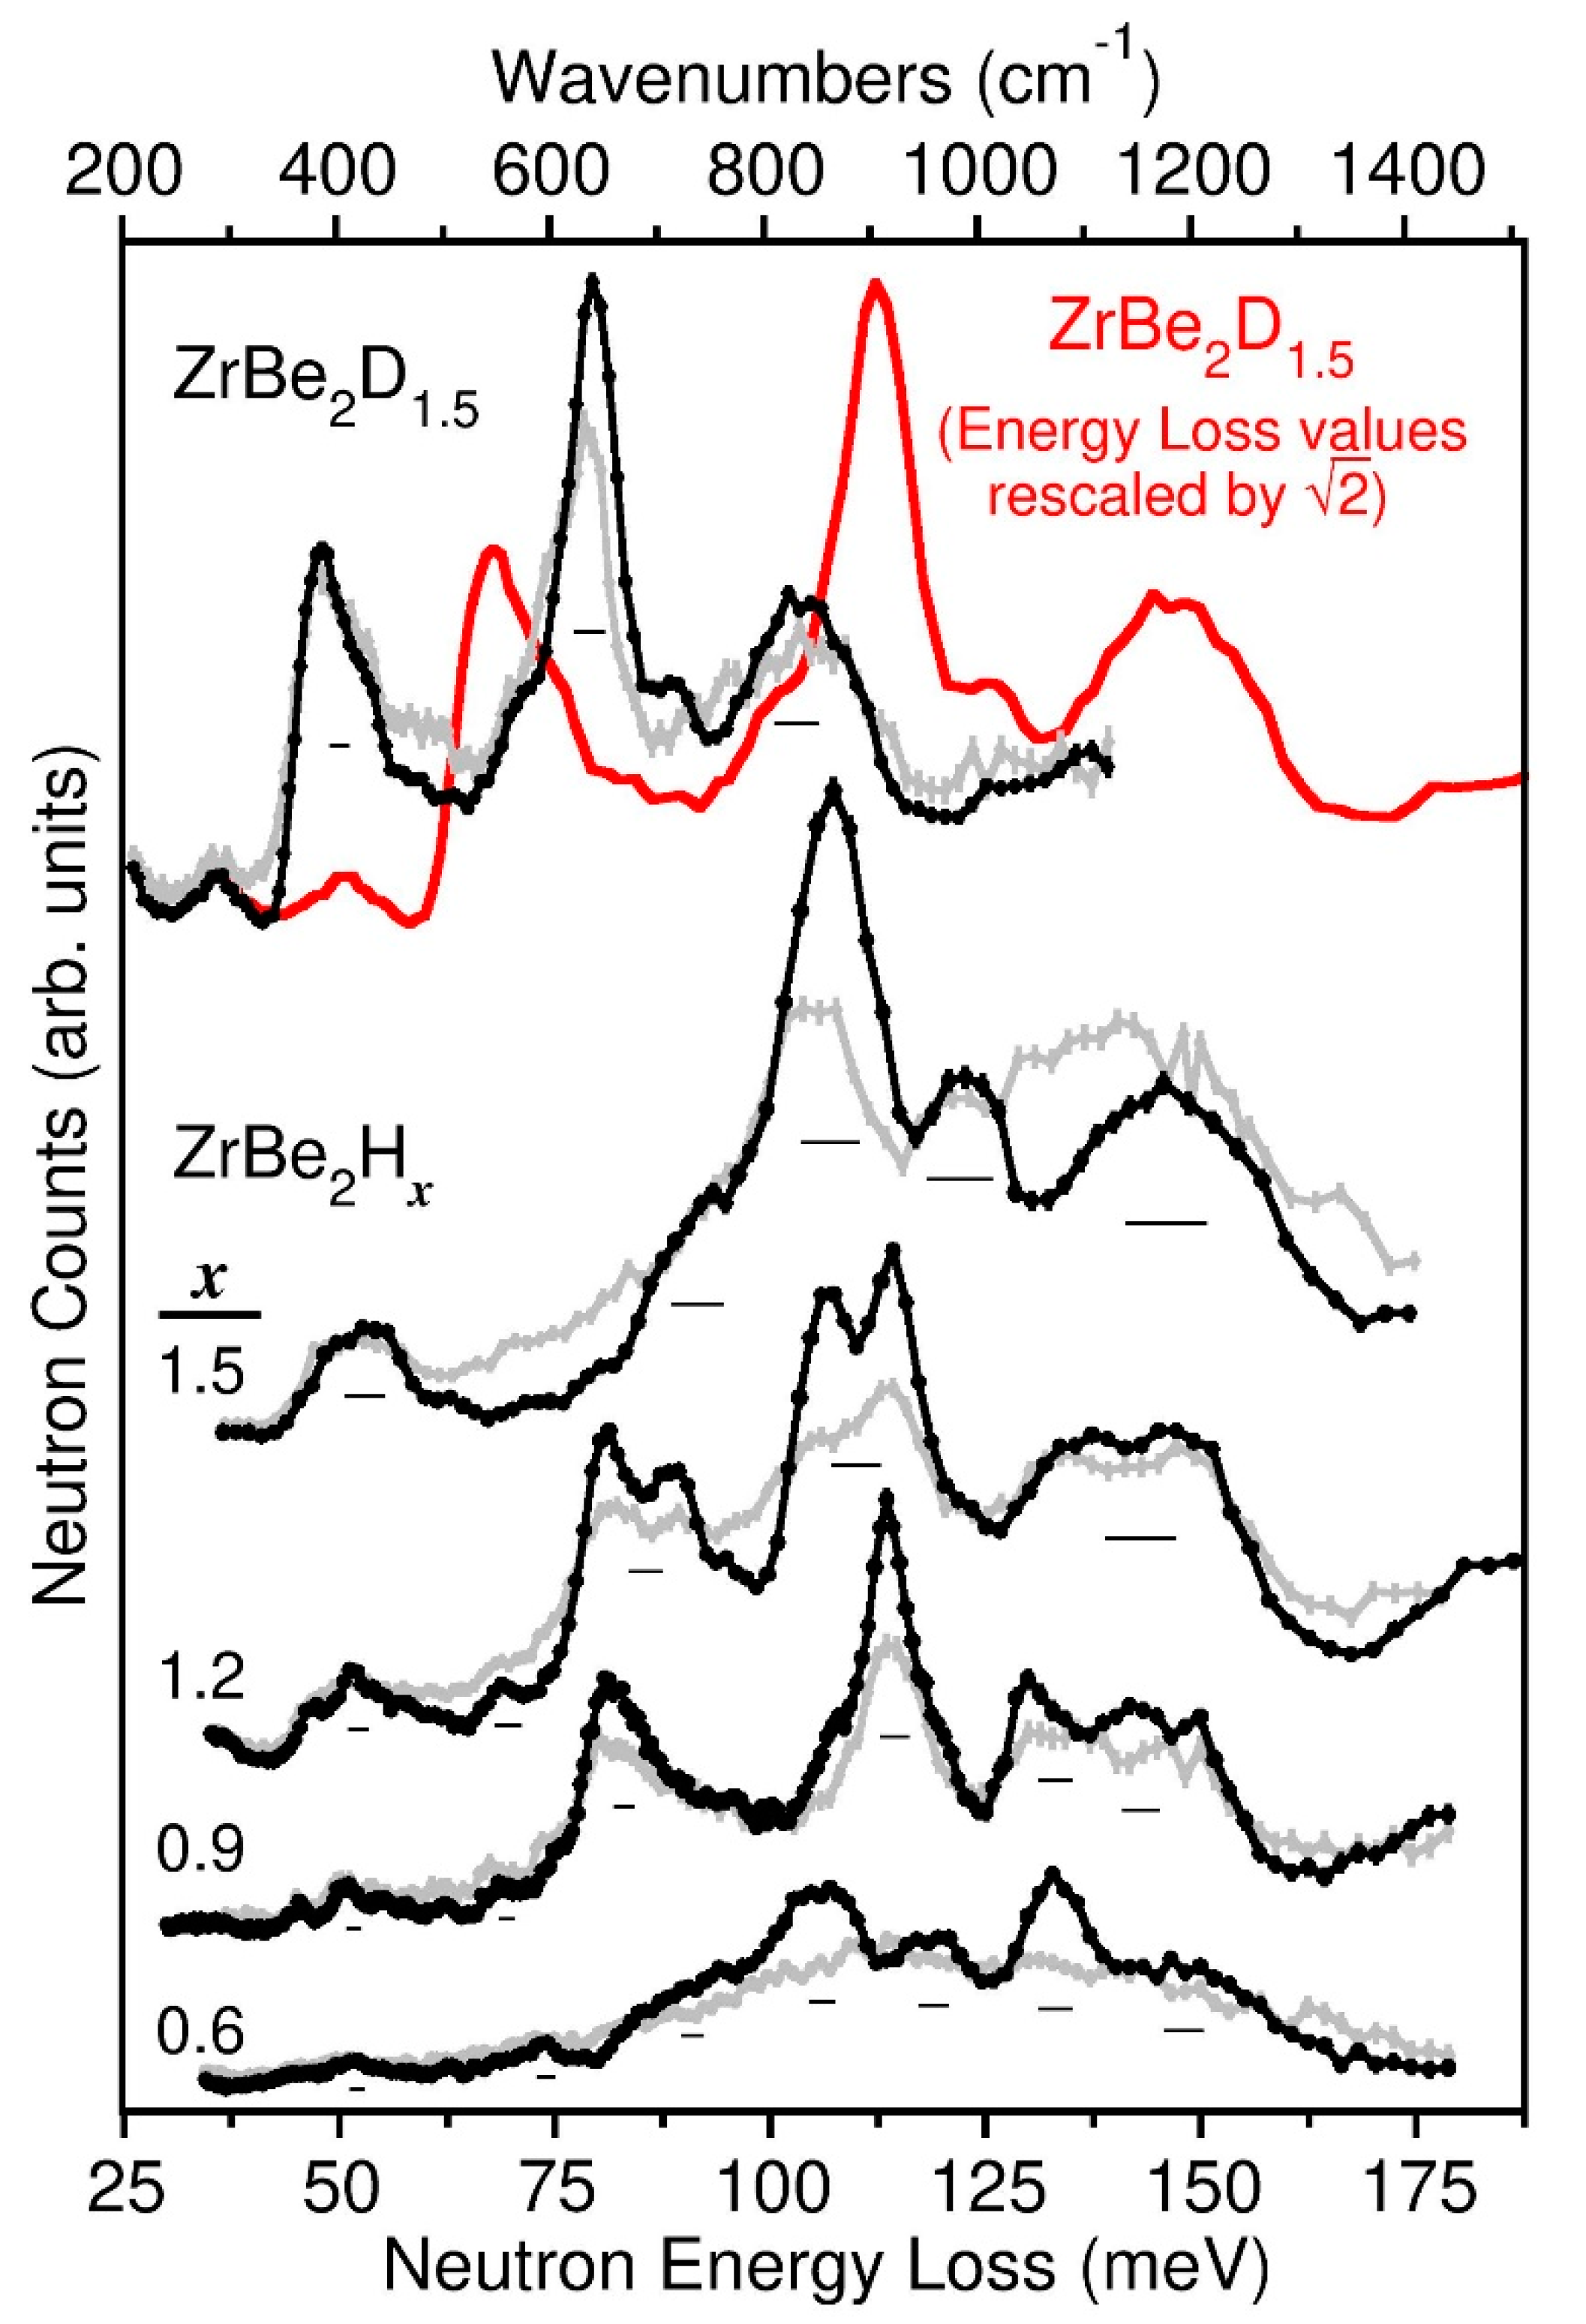
Figure 7 shows the neutron vibrational spectra for the ZrBe2D1.5 and ZrBe2Hx (x = 0.6, 0.9, 1.2, 1.5) samples at both 10 K and room temperature (except for the ZrBe2H0.6 sample, where the gray spectrum was measured at 480 K). They were measured in neutron energy loss at superior resolution and intensity to the prior measurements reported in [15]. The scattering features reported for ZrBe2H1.5 and ZrBe2D1.5 in [15] are in line with the corresponding room-temperature spectra in Figure 7, although there was no mention of observing the two highest-energy features clearly present in the current NV spectra.
The NV spectra reflect the H-weighted phonon densities of states (PDOSs) due to the overly dominant incoherent neutron scattering cross section for H compared to the other elements. Indeed, D, Be, and Zr all have similar scattering cross sections, but are all about an order of magnitude less than for H. Hence, the majority of scattering intensity in an NV spectrum reflects the various normal-mode vibrations involving H displacements. Nonetheless, there will be minor contributions from potential Be displacements due to its relatively low mass. Of course, in the non-H-containing ZrBe2D1.5 sample, the Be scattering contributions will be more noticeable in the spectrum with respect to those for D. In contrast, any contributions from Zr will be insignificant due to its relatively high mass.
Ideally at 0 K, all of the constituent atoms are in their vibrational ground states. At 10 K, this is still largely true, with only a very minor fraction of the atoms in their vibrational excited states. Thus, the 10 K spectra in Figure 7 reflect normal-mode vibrational excitations predominantly from the ground states and contain both 1-phonon and 2-phonon (combination) modes. In contrast, the higher-temperature spectra reflect the normal-mode vibrational excitations from a mixed population of atoms, with one fraction in their ground states and another in their excited states. The spectra are thus more complicated due to a larger variety of resulting excitations and combination bands involving both up- and down-scattering as well as more severe attenuation by the Debye-Waller factor. Nonetheless, the higher-temperature spectra in Figure 7 do reflect similar characteristics to the corresponding 10 K spectra, albeit more smeared in appearance.
The 10 K spectra are snapshots of all the low-temperature ordered structures present in the ZrBe2Hx and ZrBe2D1.5 samples, and it is clear that the PDOSs for ZrBe2Hx are markedly sensitive to the H content. A better understanding of the spectral features can be attained by first-principles phonon calculations. Because the low-temperature ordering in ZrBe2H1.5 and ZrBe2D1.5 is still unknown, no attempt was made to extract the DFT-simulated PDOS from possible ordered structural arrangements. Nonetheless, the simulated PDOSs for the two DFT-optimized, ordered orthorhombic ZrBe2H and ZrBe2H0.67 structures, shown in Figure 8 compared to their 10 K NV spectra, were found to greatly aid in the spectral assignments. The accompanying normal-mode animation files generated at the gamma point for the 0 K DFT-optimized structures are provided in the Supplementary Materials. These ASCII files can be used with appropriate software [36] to visualize the displacement amplitudes of the various unit-cell atoms for each normal-mode vibration. It should be noted, though, that the various gamma-point energies associated with particular vibrational modes may not exactly match the positions of the simulated peaks, since simulated spectra are averaged over the Q-space accessed by the FANS instrument, not at the gamma point. Any dispersion of a mode in Q-space may result in a shifting and complex broadening of the resulting spectral feature.
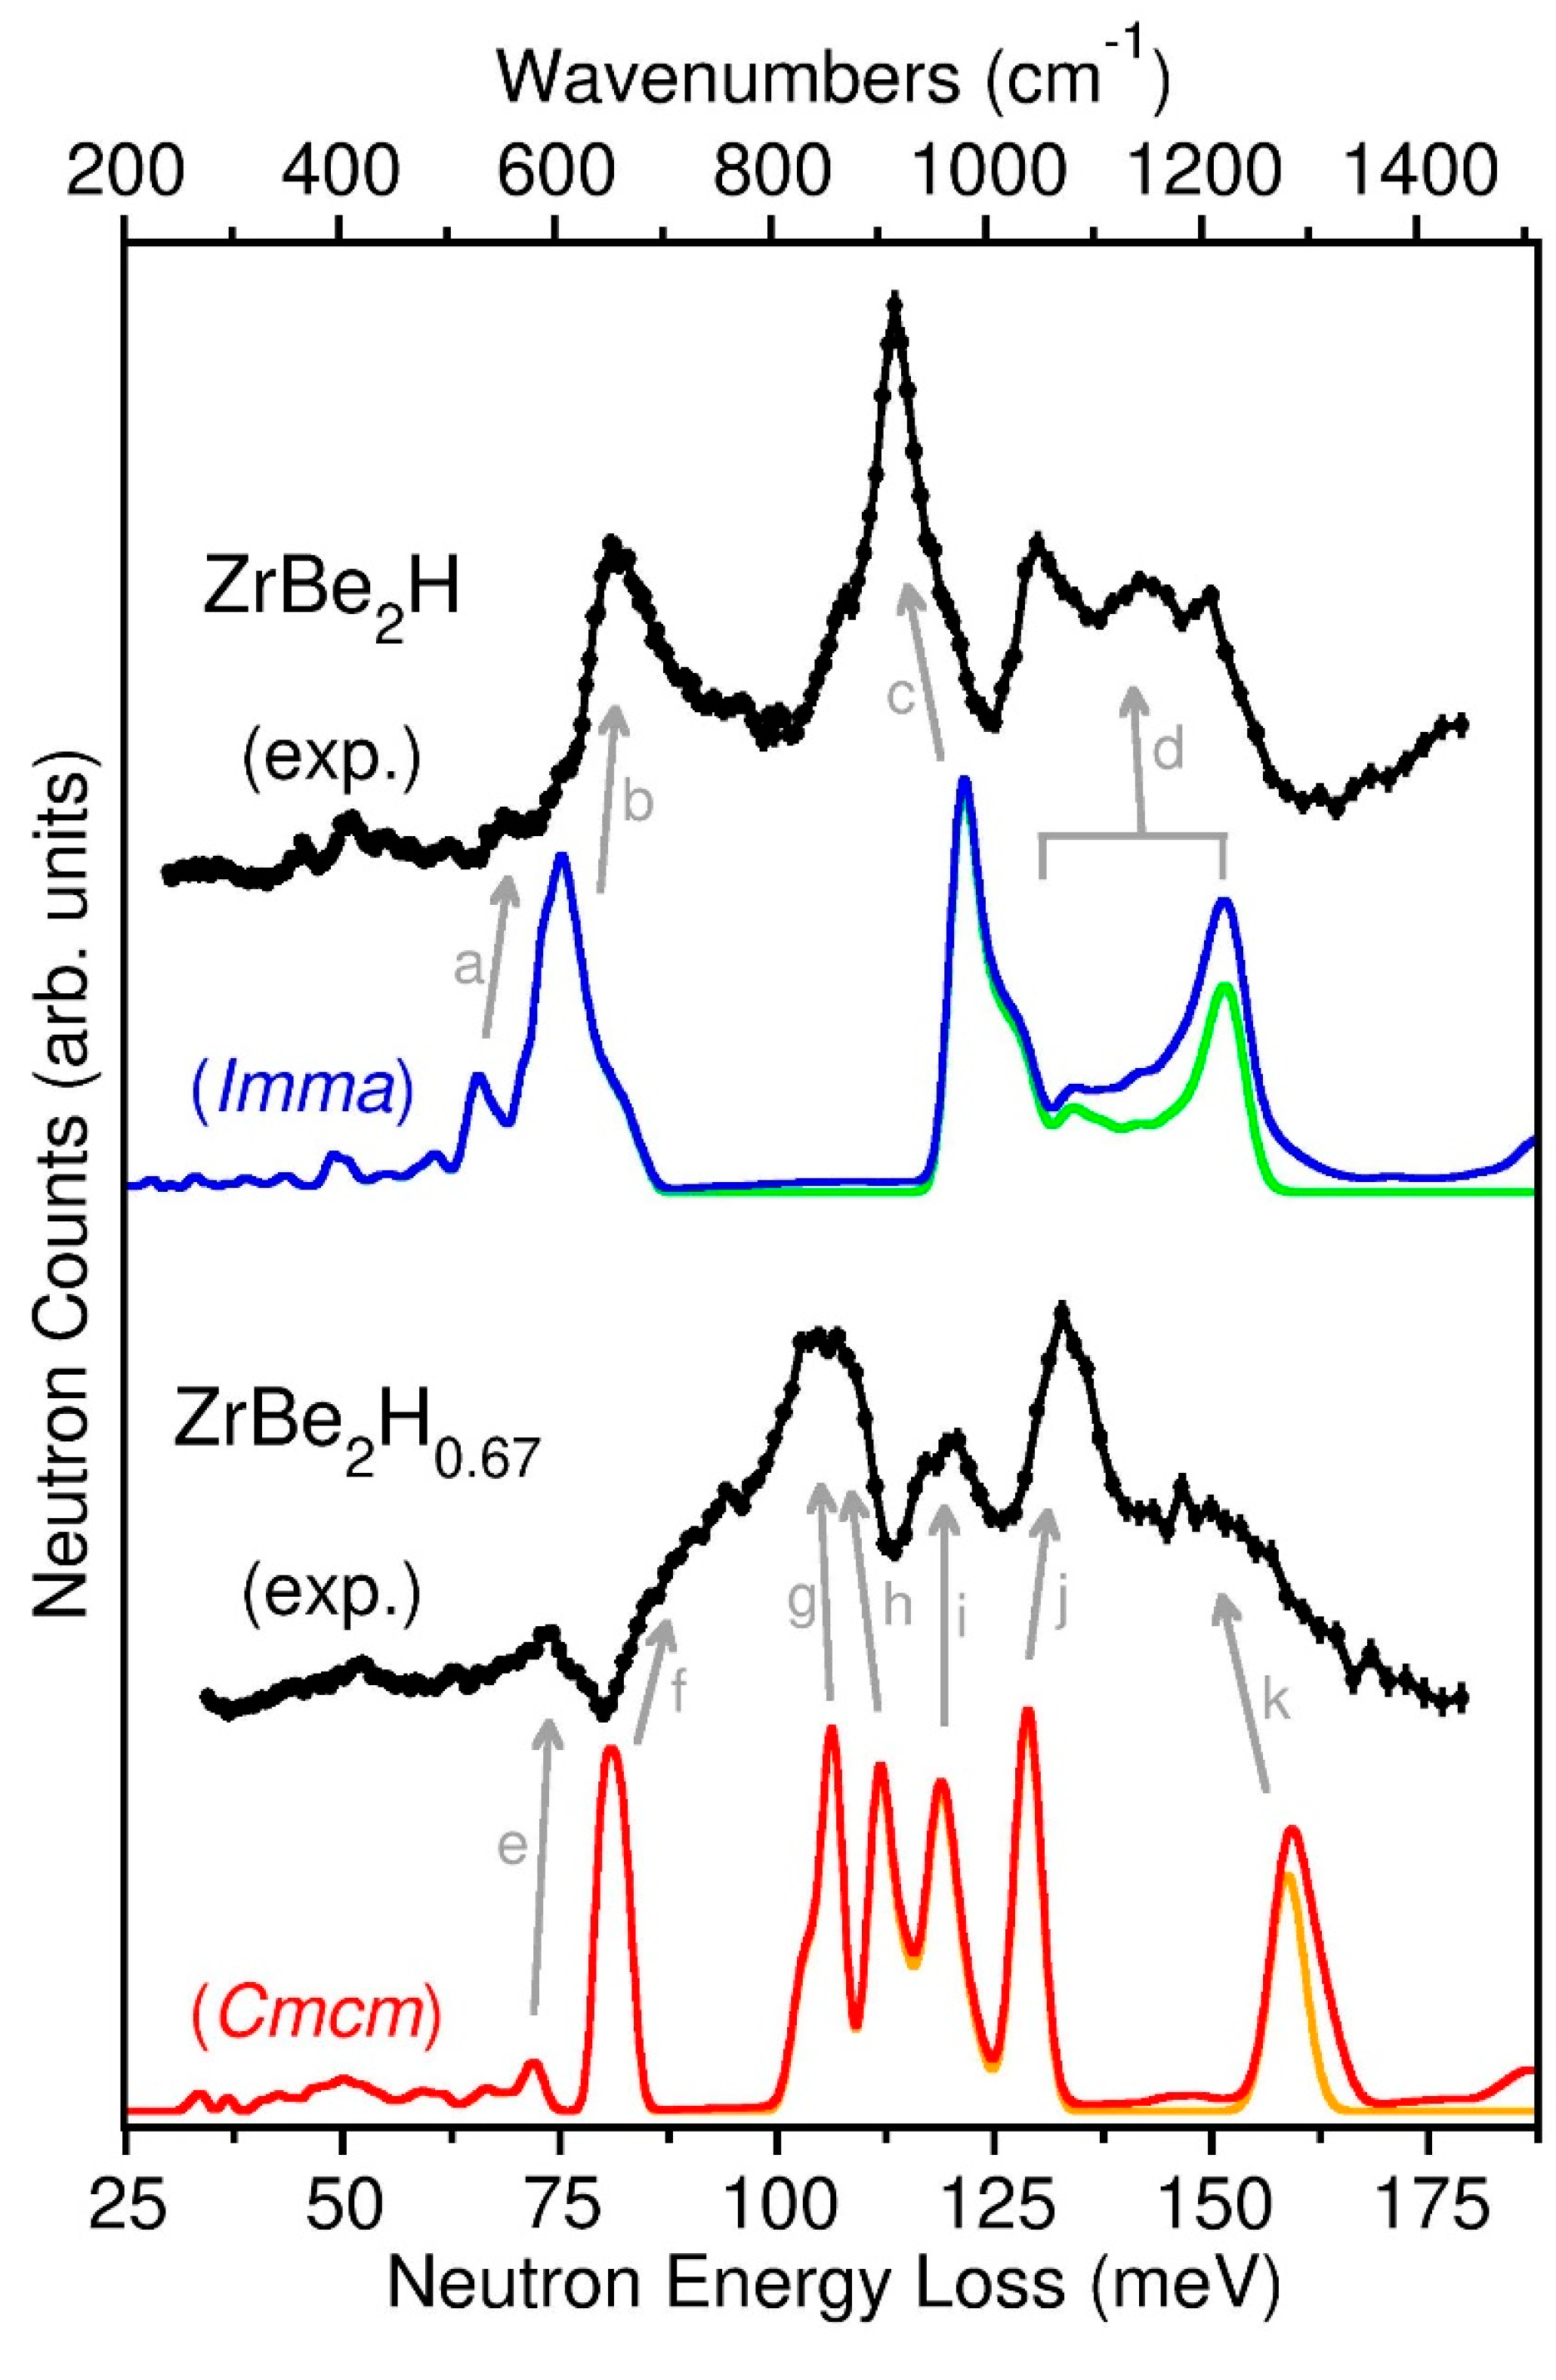
Based on the NPD results, the ZrBe2H0.9 sample is essentially a single-phase hydride with the orthorhombic ZrBe2H structure. Although there is not perfect agreement with the DFT-simulated Imma PDOS (which can be attributed to some minor lack of accuracy afforded by this level of DFT to describe the various interaction potentials involved), it is straightforward to assign the various NVS features to the vibrational features (designated by labelled arrows) as identified by DFT. Firstly, all the weak NVS features below ~70 meV are attributable to various Be-dominated normal-mode vibrations with usually little participation from H displacements. Slightly more intense features in this region, such as the small peak at ~69 meV associated with DFT feature (a) in Figure 8, are due to Be-dominated modes with more significant H participation. For example, (a) in Figure 8 represents Be displacements along the c-direction (parallel to the Zr planes for Imma symmetry) concomitant with small displacements of the H atoms along the b-direction (perpendicular to the Zr planes). The strong NVS features above ~70 meV are associated with the six normal modes involving predominantly large-amplitude H displacements, with one in-phase and one out-of-phase normal mode (with respect to nearest-neighbor pairs of H atoms) along each of the three orthogonal directions. The 81.7 meV NVS feature associated with DFT feature (b) reflects the in-phase and out-of-phase modes involving H displacements along the b-direction. The 114 meV NVS feature associated with DFT feature (c) reflects the two in-phase modes involving H displacements along the a- and c-directions (both parallel to the Zr planes). Finally, the highest NVS features between 130 meV and 150 meV associated with DFT feature (d) reflect the two out-of-phase modes involving H displacements along the a- and c-directions, with the mode along the a-direction (along the zigzag H chain) associated with the higher-energy portion near 150 meV and that along the c-direction (perpendicular to the zigzag H chain) associated with the lower-energy portion near 130 meV. Considerable normal-mode dispersion with Q in this high-energy region is suggested by both the NVS and DFT spectra.
Because the NPD results indicated that the ZrBe2H0.6 sample was actually a mixed phase (i.e., orthorhombic ZrBe2H0.67 with a small fraction of orthorhombic ZrBe2H at low temperature), the NV spectrum for orthorhombic ZrBe2H0.67 in Figure 8 was isolated by subtracting an appropriately scaled ZrBe2H0.9 sample spectrum (representing orthorhombic ZrBe2H) from the ZrBe2H0.6 sample spectrum. It should be noted that, even after the subtraction, a comparison of the extracted ZrBe2H0.67 spectrum in Figure 8 with the parent ZrBe2H0.6 sample spectrum in Figure 7 indicates very little qualitative difference.
Differences between the ZrBe2H0.67 spectrum and the DFT-simulated Cmcm PDOS again reflect the limitations of this level of DFT to accurately describe the various interaction potentials involved. Moreover, the simulated PDOS is based on an optimized Cmcm structure with full occupancies of the H1 and H2 sites. In reality, the actual refined structure indicated only a partial occupancy of the H2 site (~82% at 45 K). The fact that some of the H2 sites are randomly vacant likely results in the noticeably broadened scattering features compared to the sharp features of the simulated spectrum. Nonetheless, this does not prohibit using the simulated PDOS to identify the origin of the NV spectral features. As for ZrBe2H, the NV scattering features below ~77 meV are attributable to Be-dominated normal modes as, e.g., evidenced by DFT feature (e) and lower-energy features in Figure 8. There are twelve normal modes involving the large-amplitude H displacements of H1 and H2 atoms situated above 77 meV. This is twice as many as for ZrBe2H, since there are now two different H sites to consider with their accompanying combinations of in-phase and out-of-phase motions instead of only one H site for ZrBe2H. The 88 meV NVS shoulder associated with DFT feature (f) reflects two modes involving only H1 displacements along the c-direction (perpendicular to the Zr planes for Cmcm symmetry). The 106 meV NVS feature associated with DFT features (g) and (h) reflect the respective two in-phase and two out-of-phase modes involving H1 and H2 atoms along the a-direction (parallel to the Zr planes and along the double-chain direction). The 118 meV NVS feature associated with DFT feature (i) reflect two modes involving only H2 displacements along the c-direction. The 133 meV NVS feature associated with DFT feature (j) reflects the two in-phase modes involving H1 and H2 atoms along the b-direction (parallel to the Zr planes and perpendicular to the double chain direction). Finally, the 150 meV NVS shoulder associated with DFT feature (k) reflects the two out-of-phase modes involving H1 and H2 atoms along the b-direction.
The mode assignments for both ZrBe2H and ZrBe2H0.67 make sense based on the structural details. The Be-dominated modes reside between ~45 meV to 75 meV, energies of this two-dimensional Be network consistent with those found in elemental Be [37]. The H vibrational modes perpendicular to the Zr planes along the Be-H-Be axis of the H-occupied BeZr3Be trigonal bipyramids tend to have lower energies. For ZrBe2H0.67, the H1- and H2-only modes (f) and (i) along the Be-H-Be axis indicate lower energies for the H1 atoms (with relatively larger Be-H bond distances) compared to the H2 atoms (with relatively smaller Be-H bond distances). The H vibrational modes within the Zr planes tend to have higher energies due to the relatively strong Zr-H bonding interactions, with the highest energies occurring for the out-of-phase vibrational modes, which are additionally affected by H-H coupling interactions during the opposing displacements of nearest-neighbor H atoms with close 2.1–2.2 Å separations in the structures. Interestingly, these high-energy scattering bands between ~125 meV and 165 meV associated with trigonally bonded H within the planar Zr3 sites for the various ZrBe2Hx phases match well with the broad range of vibrational energies for H in the Zr4 tetrahedral sites of ZrHx (x = 0.54–2.0) [38,39] with comparable Zr-H bond distances (e.g., 2.08 Å for ZrH2 at 297 K) [40].
These observations allow us to assign the probable origins of the NV features for ZrBe2H1.5 in Figure 7. In particular, the two higher-energy features near 123 meV and 147 meV are likely associated with the various respective in-phase and out-of-phase H vibrational modes parallel to the Zr planes, whereas the 90 meV shoulder and 107.5 meV feature are likely associated with various H vibrational modes perpendicular to the Zr planes. It should be noted that these assignments are different than postulated in the earlier NVS study [15], since the higher-energy NV features in Figure 7 were not detected in that study.
The ZrBe2D1.5 spectrum in Figure 7 is seen to be in good agreement with that for ZrBe2H1.5. After rescaling the energy-loss values by a harmonic magnitude of , the resulting red ZrBe2D1.5 spectrum in Figure 7 closely mimics the ZrBe2H1.5 spectrum except for the low-energy feature near 68 meV, which is confirmation that the original 48 meV ZrBe2D1.5 feature is due to Be-dominated vibrational modes. Again, this feature is relatively enhanced compared to the D-related modes due to the similar neutron scattering cross sections for Be and D. This is analogous to the observed 52 meV ZrBe2H1.5 feature in Figure 7, whose considerable intensity signals the likely involvement of some H displacements concomitant with the main Be displacements. (It should be noted that the weak ZrBe2D1.5 feature at 36 meV is an Al phonon artifact from the sample can and refrigerator cryoshields.)
It is interesting that the highest two harmonically rescaled D modes (originally located at ~89 meV and 105 meV) align very well with the ZrBe2H1.5 features at 123 meV and 147 meV, whereas the lower-energy shoulder and peak (originally located respectively at 69 meV and 79.5 meV) are about 8% and 5% higher after rescaling than the corresponding ZrBe2H1.5 features at 90 meV and 107.5 meV. Although this may reflect some anharmonicity for the H potential well along the c-direction between Be atoms compared a more harmonic well along the ab-plane within the Zr3 trigonal sites, it may just be a consequence of some participation of the relatively low-mass Be atoms (mBe = 9 g mol−1) in the H optical vibrational modes along the c-directed Be-H-Be axis. In such a case, the ratio of reduced masses for these modes in ZrBe2D1.5 and ZrBe2H1.5 would be smaller than the 2:1 ratio of masses for D and H alone and would indeed be manifested as a reduction in the otherwise harmonic EH/ED = = isotope shift. For example, the ratio of reduced masses between D and H modes, assuming the participation of one Be atom per D or H atom becomes 1.818. The expected harmonic energy-scaling factor for these particular c-axis modes would now be = 1.348, which is more in line with the spectral behavior in Figure 7. Of course, this would not be as much of an issue for the higher-energy H vibrations within the Zr planes, since no Be participation would be expected in this orthogonal direction and the reduced-mass contributions from the much-higher-mass Zr atoms (mZr = 91 g/mol−1) would be much more insignificant, thus largely preserving the expected harmonic rescaling factor for these modes, as observed.
Finally, we point out that the NV spectrum of the ZrBe2H1.2 sample in Figure 7 is a combination of the spectra for the ZrBe2H1.5 and ZrBe2H0.9 samples, consistent with the two phases, ZrBe2H~1.3–1.4 and ZrBe2H, observed by NPD. The lower-energy spectral contributions near 90 meV and 107.5 meV from the more minor ZrBe2H~1.3–1.4 component appear to be somewhat narrower than for ZrBe2H1.5, possibly because the relatively lower H content for ZrBe2H~1.3–1.4 results in mode-sharpening perturbations. The small differences in resolution between the two measured spectra cannot account for these changes in peak width.
4. Conclusions
The temperature-dependent structural analysis results for the ZrBe2H0.6, ZrBe2H0.9, ZrBe2H1.2, and ZrBe2H1.5 samples indicate H-site-disordered hexagonal P6/mmm structures at high temperatures near 500 K, with decreasing a and increasing c lattice constants with increasing H content. Upon lowering the temperature, although the disordered hexagonal P6/mmm ZrBe2H1.5 phase persists down to ~200 K (according to prior NMR results), two structurally distinct ordered orthorhombic phases appear at lower H contents, namely, ZrBe2H0.67 (Cmcm) at ~490 K and ZrBe2H (Imma) at ~460 K. Below ~200 K, ZrBe2H1.5 presumably transforms to some type of ordered structure involving a coordinated arrangement of vacancies and c-axis shifts in H positions (as proposed for ZrBe2D1.5), although no clear indication is found by the NPD results, suggesting that the ordering may be short-ranged.
The formation of the ordered orthorhombic phases clarify for the first time the structural perturbation effects of H occupation within the BeZr3Be trigonal bipyramids of the ZrBe2 host lattice, even in the hexagonal solid-solution ZrBe2Hx phase. In particular, Zr-H attractive interactions and Be-H repulsive interactions generally lead to a planar contraction of the Zr3 triad and an expansion of the Be-Be separation. This would lead to a range of ab planar displacements of the associated Zr atoms and c-axis displacements of the associated Be atoms. This is consistent with the refined anisotropic Be and Zr displacement parameters determined for hexagonal disordered ZrBe2H1.5.
NVS results indicate that the H PDOS for ZrBe2Hx is sensitive to the H content. The H optical vibrational energies lie within a range of ~75 meV to 165 meV. In general, although the exact vibrational energies may vary with x, the H vibrational modes perpendicular to the Zr planes along the Be-H-Be axis of the H-occupied BeZr3Be trigonal bipyramids tend to have lower energies compared to the H vibrational modes within the Zr planes due to the relatively strong Zr-H bonding interactions in this direction.
The two newly discovered orthorhombic ZrBe2H0.67 and ZrBe2H phases provoke intriguing questions concerning their corresponding two-dimensional H diffusive mobilities. As the previous NMR studies have indicated that H mobility in ZrBe2H1.5 is greatly reduced upon cooling down the hexagonal disordered phase below its 200 K transition temperature to the unknown ordered phase, it would be interesting to determine how the ordering of the more H-dilute ZrBe2H0.67 and ZrBe2H phases below 490 K and 460 K, respectively, affect their H mobilities. There may be a fundamental difference between the two compounds. Indeed, for ZrBe2H, no H spillover into other sites was identified by NPD in the ordered phase since the vacant BeZr3Be trigonal bipyramids likely possess insufficient Be separations, whereas for ZrBe2H0.67, there are indications that the H2 site tends to be only partially occupied and that spillover into other sites (i.e., the H3 sites) from H1 and H2 may be occurring with increasing temperature. Future NMR and QENS studies will be needed to address these questions.
Supplementary Materials
The following supporting information can be downloaded at: https://www.mdpi.com/article/10.3390/inorganics11010001/s1, Figure S1: NPD pattern and fit for the ZrBe2D1.5 sample at 300 K; Figure S2: low-angle magnified NPD patterns for the ZrBe2D1.5 sample at 4 K and 300 K; Figure S3: NPD pattern and fit for the ZrBe2H1.5 sample at 15 K; Figure S4: NPD pattern and fit for the ZrBe2H1.5 sample at 300 K; Figure S5: NPD pattern and fit for the ZrBe2H1.2 sample at 10 K; Figure S6: NPD pattern and fit for the ZrBe2H1.2 sample at 300 K; Figure S7: NPD pattern and fit for the ZrBe2H1.2 sample at 460 K; Figure S8: NPD pattern and fit for the ZrBe2H0.9 sample at 295 K; Figure S9: NPD pattern and fit for the ZrBe2H0.6 sample at 45 K; Figure S10: NPD pattern and fit for the ZrBe2H0.6 sample at 295 K; Figure S11: NPD pattern and fit for the ZrBe2H0.6 sample at 500 K; Table S1: refined crystallographic parameters for the ZrBe2D1.5 sample at 4 K and 300 K; Table S2: refined crystallographic parameters for the ZrBe2H1.5 sample at 15 K and 300 K; Table S3: refined lattice parameters for the ZrBe2H1.5 sample at different temperatures; Table S4: refined crystallographic parameters for the ZrBe2H1.2 sample at 300 K; Table S5: refined crystallographic parameters for the disordered ZrBe2H model structure extracted from the NPD pattern for the ZrBe2H1.2 sample at 480 K; Table S6: refined lattice parameters of various phases in the ZrBe2H1.2 sample measured at different temperatures; Table S7: refined crystallographic parameters for the ordered ZrBe2H model structure extracted from the NPD pattern for the ZrBe2H0.9 sample at 295 K; Table S8: refined crystallographic parameters for the ZrBe2H0.67 model structures extracted from the NPD patterns for the ZrBe2H0.6 sample at 45 K, 295 K, and 500 K; Table S9: compositional dependence of ZrBe2Hx lattice parameters of the hexagonal P6/mmm phase compared at similar high temperatures; ASCII animation files (ZrBe2H0.67_anime.txt and ZrBe2H_anime.txt) for the DFT-optimized orthorhombic ZrBe2H0.67 and ZrBe2H structures at 0 K containing frequency and atomic-displacement information concerning the normal mode vibrations at the gamma point [viewable using the open-source v_sim software downloadable for various OS (windows, linux, etc.) at https://gitlab.com/l_sim/v_sim-website/-/tree/master/download (accessed on 19 November 2022). N.B., the use of this software does not imply the recommendation or endorsement by NIST]; CIF files (ZrBe2H0.67_45K.cif, ZrBe2H0.67_295K.cif, ZrBe2H0.67_500K.cif, ZrBe2H_295K.cif, and ZrBe2H1.5_300K.cif) for ZrBe2H0.67 at 45 K, 295 K, and 500 K; ZrBe2H at 295 K; and ZrBe2H1.5 at 300 K.
Author Contributions
T.J.U. and B.C.H. conceived and designed the experiments. T.J.U. performed the experiments; H.W. and W.Z. and T.J.U. contributed to analyzing the data. H.W., W.Z., T.J.U., R.C.B.J. and B.C.H. all contributed to writing the paper. All authors have read and agreed to the published version of the manuscript.
Funding
This research received no external funding.
Informed Consent Statement
Not applicable.
Data Availability Statement
Not applicable.
Acknowledgments
We dedicate this paper to the late Arnulf J. Maeland, who provided the ZrBe2H1.5 and ZrBe2D1.5 samples for this work, and who was an early pioneer in the field of metal-hydride materials. The authors acknowledge collaboration within the framework of Task 32 and 40 in the Hydrogen Technology Collaboration Programme (TCP) of the International Energy Agency (IEA). The authors also acknowledge collaboration within the Hydrogen Materials—Advanced Research Consortium (HyMARC), established as part of the Energy Materials Network under the U.S. Department of Energy, Office of Energy Efficiency and Renewable Energy, Fuel Cell Technologies Office.
Conflicts of Interest
The authors declare no conflict of interest.
References
- Matar, S.F. Intermetallic Hydrides: A Review with Ab Initio Aspects. Prog. Solid State Chem. 2010, 38, 1–37. [Google Scholar] [CrossRef]
- Hirscher, M.; Yartys, V.A.; Baricco, M.; Bellosta von Colbe, J.; Blanchard, D.; Bowman, R.C., Jr.; Broom, D.P.; Buckley, C.E.; Chang, F.; Chen, P. Materials for Hydrogen-based Energy Storage—Past, Recent Progress and Future Outlook. J. Alloys Compd. 2020, 827, 153548. [Google Scholar] [CrossRef]
- Nakamichi, M.; Yonehara, K.; Wakai, D. Trial Fabrication of Beryllides as Advanced Neutron Multiplier. Fusion Eng. Des. 2011, 86, 2262–2264. [Google Scholar] [CrossRef]
- Kim, J.-H.; Nakamichi, M. Characterization of Modified Be13Zr Beryllide Pebbles as Advanced Neutron Multipliers. Fusion Eng. Des. 2019, 146, 2608–2612. [Google Scholar] [CrossRef]
- Mukai, K.; Kasada, R.; Kim, J.-H.; Nakamichi, M. Electronic Descriptors for Vacancy Formation and Hydrogen Solution in Be-rich Intermetallics. Acta Mater. 2022, 241, 118428. [Google Scholar] [CrossRef]
- Nielsen, J.W.; Baenziger, N.C. The Crystal Structures of ZrBeSi and ZrBe2. Acta Cryst. 1954, 7, 132–133. [Google Scholar] [CrossRef]
- Nagamatsu, J.; Nakagawa, N.; Muranaka, T.; Zenitani, Y.; Akimitsu, J. Superconductivity at 39 K in Magnesium Diboride. Nature 2001, 410, 63–64. [Google Scholar] [CrossRef]
- Yildirim, T.; Gülseren, O.; Lynn, J.W.; Brown, C.M.; Udovic, T.J.; Huang, Q.; Rogado, N.; Regan, K.A.; Hayward, M.A.; Slusky, J.S. Giant Anharmonicity and Nonlinear Electron-Phonon Coupling in MgB2: A Combined First-Principles Calculation and Neutron Scattering Study. Phys. Rev. Lett. 2001, 87, 037001. [Google Scholar] [CrossRef] [Green Version]
- Shein, I.R.; Medvedeva, N.I.; Ivanovskii, A.L. The Band Structures of Superconducting MgB2 and the Isostructural Compounds CaGa2, AgB2, AuB2, ZrBe2, and HfBe2. Phys. Solid State 2001, 43, 2213–2218. [Google Scholar] [CrossRef]
- Singh, D.J.; Gupta, M. Anomalous Structural Behavior and Electronic Structure in ZrBe2Hx: Density Functional Calculations. Phys. Rev. B 2007, 76, 075120. [Google Scholar] [CrossRef]
- Maeland, A.J.; Libowitz, G.G. Hydrides of Beryllium-based Intermetallic Compounds. J. Less Common Met. 1983, 89, 197–200. [Google Scholar] [CrossRef]
- Maeland, A.J. Investigation of Some New Hydride Systems. J. Less Common Met. 1983, 89, 173–182. [Google Scholar] [CrossRef]
- Westlake, D.G. Geometric Rationale for the Hydrides of Beryllium-based Intermetallic Compounds. Mat. Res. Bull. 1983, 18, 1409–1418. [Google Scholar] [CrossRef]
- Kodibagkar, V.D.; Fedders, P.A.; Browning, C.D.; Bowman, R.C., Jr.; Adolphi, N.L.; Conradi, M.S. Vacancy Ordering Phase Transition in ZrBe2(H/D)x: NMR and Electronic Structure Study. Phys. Rev. B 2003, 67, 045107. [Google Scholar] [CrossRef]
- Andresen, A.F.; Otnes, K.; Maeland, A.J. Neutron Scattering Investigations of Be2ZrH1.5 and Be2ZrD1.5. J. Less Common Met. 1983, 89, 201–204. [Google Scholar] [CrossRef]
- Hauback, B.C.; Fjellvåg, H.; Maeland, A.J. Temperature-induced Structural Changes in Be2ZrD1.5 Studied by Powder Neutron Diffraction. J. Alloys Compd. 1995, 224, 241–243. [Google Scholar] [CrossRef]
- Kodibagkar, V.; Herberg, J.L.; Bowman, R.C., Jr.; Conradi, M.S. NMR Study of a Temperature-induced Structural Transition in ZrBe2Dx. J. Alloys Compd. 2002, 330–332, 179–182. [Google Scholar] [CrossRef]
- Bowman, R.C., Jr.; Torgeson, D.R.; Maeland, A.J. Proton NMR Studies of Hydrogen Diffusion Behavior for ZrBe2H1.4. Z. Phys. Chem. 1993, 181, 181–186. [Google Scholar] [CrossRef]
- McDowell, A.F.; Mendelsohn, C.F.; Conradi, M.S.; Bowman, R.C., Jr.; Maeland, A.J. Two-dimensional Diffusion of Hydrogen in ZrBe2H1.4. Phys. Rev. B 1995, 51, 6336–6342. [Google Scholar] [CrossRef]
- Kimmerle, F.; Majer, G.; Kaess, U.; Maeland, A.J.; Conradi, M.S.; McDowell, A.F. NMR Studies of Hydrogen Diffusion in ZrBe2H1.4. J. Alloys Compd. 1998, 264, 63–70. [Google Scholar] [CrossRef]
- Cappelletti, R.L.; Udovic, T.J.; Chowdhuri, Z.; Hauback, B.C.; Maeland, A.J.; Dimeo, R.M. Diffusive Hydrogen Motion in ZrBe2H0.56: A Quasielastic Neutron Scattering Study. Physica B 2006, 385–386, 208–211. [Google Scholar] [CrossRef]
- Cappelletti, R.L.; Chowdhuri, Z.; Udovic, T.J.; Dimeo, R.M. Quasielastic Neutron Scattering Study of Diffusive Hydrogen Motion in ZrBe2H0.56. Phys. Rev. B 2006, 73, 224109. [Google Scholar] [CrossRef]
- Andresen, A.F.; Fjellvåg, H.; Maeland, A.J. Formation and Crystal Structure of ThNi2Dx. J. Less Common Met. 1984, 103, 27–31. [Google Scholar] [CrossRef]
- Stalick, J.K.; Prince, E.; Santoro, A.; Schroder, I.G.; Rush, J.J. Materials Science Applications of the New National Institute of Standards and Technology Powder Diffractometer. In Neutron Scattering in Materials Science II; Neumann, D.A., Russell, T.P., Wuensch, B.J., Eds.; Materials Research Soc.: Pittsburgh, PA, USA, 1995; Volume 376, pp. 101–106. [Google Scholar]
- Rietveld, H.M. A Profile Refinement Method for Nuclear and Magnetic Structures. J. Appl. Crystallogr. 1969, 2, 65–71. [Google Scholar] [CrossRef]
- Larson, A.C.; Von Dreele, R.B. General Structure Analysis System. University of California: Berkeley, CA, USA, 1985. [Google Scholar]
- Sears, V.F. Neutron Scattering Lengths and Cross Sections. Neutron News 1992, 3, 26–37. [Google Scholar] [CrossRef]
- Udovic, T.J.; Brown, C.M.; Leão, J.B.; Brand, P.C.; Jiggetts, R.D.; Zeitoun, R.; Pierce, T.A.; Peral, I.; Copley, J.R.D.; Huang, Q. The Design of a Bismuth-based Auxiliary Filter for the Removal of Spurious Background Scattering Associated with Filter-Analyzer Neutron Spectrometers. Nucl. Instrum. Methods Phys. Res. Sect. A Accel. Spectrometers Detect. Assoc. Equip. 2008, 588, 406–413. [Google Scholar] [CrossRef]
- Giannozzi, P.; Baroni, S.; Bonini, N.; Calandra, M.; Car, R.; Cavazzoni, C.; Ceresoli, D.; Chiarotti, G.L.; Cococcioni, M.; Dabo, I. QUANTUM ESPRESSO: A Modular and Open-Source Software Project for Quantum Simulations of Materials. J. Phys. Condens. Matter 2009, 21, 395502. [Google Scholar] [CrossRef]
- Kresse, G.; Furthmuller, J.; Hafner, J. Ab initio Force Constant Approach to Phonon Dispersion Relations of Diamond and Graphite. Europhys. Lett. 1995, 32, 729–734. [Google Scholar] [CrossRef]
- Yildirim, T. Structure and Dynamics from Combined Neutron Scattering and First-Principles Studies. Chem. Phys. 2000, 261, 205–216. [Google Scholar] [CrossRef]
- Momma, K.; Izumi, F. VESTA 3 for Three-Dimensional Visualization of Crystal, Volumetric and Morphology Data. J. Appl. Crystallogr. 2011, 44, 1272–1276. [Google Scholar] [CrossRef]
- Zalkin, A.; Bedford, R.G.; Sands, D.E. Crystal Structures of ZrBe5 and Zr2Be17. Acta Cryst. 1959, 12, 700. [Google Scholar] [CrossRef]
- Switendick, A.C. Band Structure Calculations for Metal Hydrogen Systems. Z. Phys. Chem. 1979, 117, 89–112. [Google Scholar] [CrossRef] [Green Version]
- Sieverts, A. Absorption of Gases by Metals. Z. Met. 1929, 21, 37–46. [Google Scholar]
- Phonon Animation Ascii Files in the Supplementary Materials for the DFT-Optimized 0 K Orthorhombic Ordered ZrBe2H0.67 and ZrBe2H Structures Can Be Viewed Using the Open-Source V_Sim Software. Available online: https://gitlab.com/l_sim/v_sim-website/-/tree/master/download (accessed on 19 November 2022). N.B., the use of this software does not imply the recommendation or endorsement by NIST..
- Udovic, T.J.; Neumann, D.A.; Leão, J.; Brown, C.M. Origin and Removal of Spurious Background Peaks in Vibrational Spectra Measured by Filter-Analyzer Neutron Spectrometers. Nucl. Instrum. Methods Phys. Res. Sect. A Accel. Spectrometers Detect. Assoc. Equip. 2004, 517, 189–201. [Google Scholar] [CrossRef]
- Couch, J.G.; Harling, O.K.; Clune, L.C. Structure in the Neutron Scattering Spectra of Zirconium Hydride. Phys. Rev. B 1971, 4, 2675–2681. [Google Scholar] [CrossRef]
- Zhang, J.; Cheng, Y.; Kolesnikov, A.I.; Bernholc, J.; Lu, W.; Ramirez-Cuesta, A.J. Study of Anharmonicity in Zirconium Hydrides Using Inelastic Neutron Scattering and Ab-Initio Computer Modeling. Inorganics 2021, 9, 29. [Google Scholar] [CrossRef]
- Kempter, C.P.; Elliott, R.O.; Gschneidner, K.A., Jr. Thermal Expansion of Delta and Epsilon Zirconium Hydrides. J. Chem. Phys. 1960, 33, 837–840. [Google Scholar] [CrossRef]
Figure 1.
(a) Hexagonal P6/mmm crystal structure of ZrBe2Hx. Blue, green, and white spheres represent Zr, Be, and H, respectively. Alternate ab-planar layers of Zr and Be atoms form the parent ZrBe2 structure with H atoms occupying at random the trigonal Zr3 (2c) sites of the Zr plane and further straddled by Be atoms directly above and below along the c-axis. For ZrBe2Hx, 2c site occupation is x/2. Full H site occupation corresponds to the theoretical compound ZrBe2H2. For x = 1.5, the H site occupation is 0.75. (b) View along the c axis, starting from the Zr layer surface.

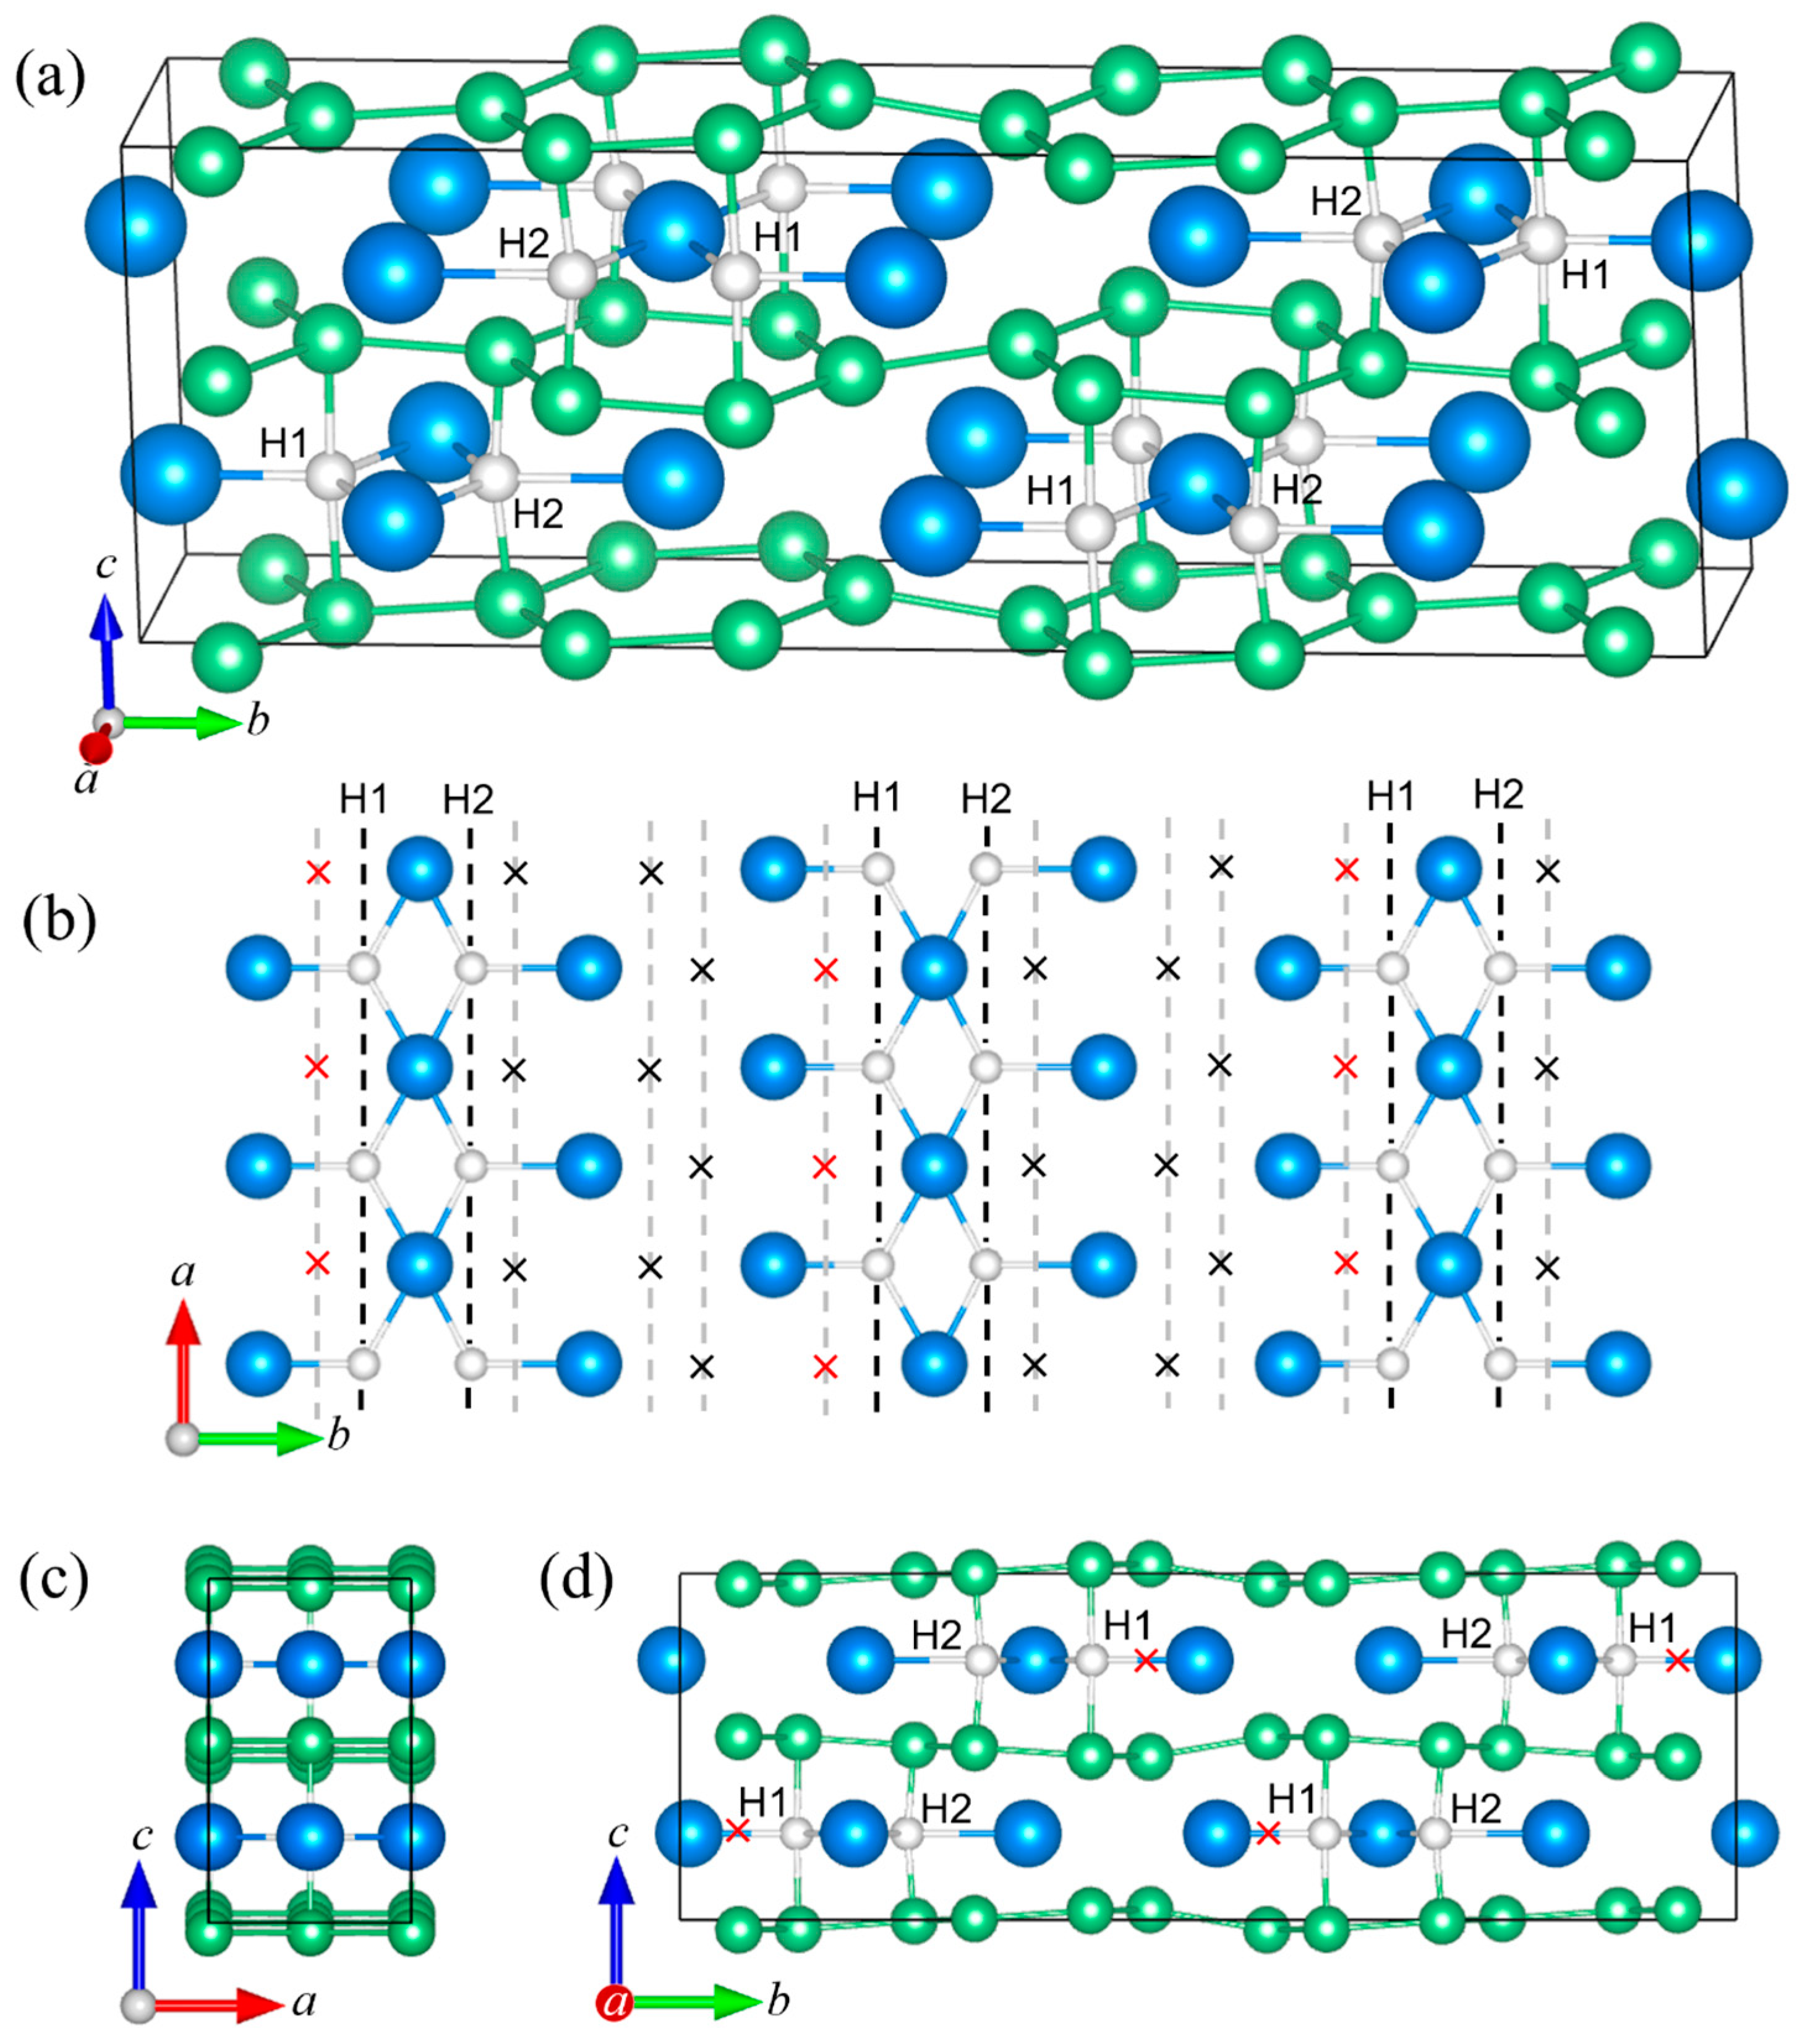
Figure 2.
(a) Orthorhombic Imma crystal structure of ZrBe2H. Blue, green, and white spheres represent Zr, Be, and H, respectively. Analogous to the hexagonal P6/mmm ZrBe2Hx structure in Figure 1, alternate ac-planar layers of Zr and Be atoms form the parent ZrBe2 structure with H atoms occupying specific trigonal Zr3 (4e) sites in the Zr plane, which cause a rippling of the Be layers. (b) View along the a-axis. (c) View along the c-axis. (d) View along the b-axis, showing just the Zr layer and the ordered pattern of H-site occupation forming zigzag chains of H atoms along the a-axis, separated by zigzag chains of vacancies (×).

Figure 3.
Temperature progression of the intensities of the respective (011) and (021) Bragg peaks for orthorhombic ordered ZrBe2H and ZrBe2H0.67. These respective peaks correspond to the low-angle features seen near 2θ = 19.1° and 16.3° in the BT-1 Powder Diffractometer patterns at λ = 1.5391 Å and are absent for P6/mmm symmetry. The majority of the data were collected on the BT-4 Triple-Axis Spectrometer at λ = 2.3578 Å (ZrBe2H) and λ = 1.5288 Å (ZrBe2H0.67). Relative intensities for each curve are arbitrarily scaled for clarity. Lines are drawn through the data as guides to the eye.

Figure 4.
(a) Orthorhombic Cmcm crystal structure of ZrBe2H0.67. Blue, green, and white spheres represent Zr, Be, and H, respectively. Like the hexagonal P6/mmm ZrBe2Hx structure in Figure 1, alternate ab-planar layers of Zr and Be atoms form the parent ZrBe2 structure with H atoms occupying specific trigonal Zr3 (4c) sites in the Zr planes, which cause a rippling of the Be layers. (b) View along the c-axis, showing just the Zr layer, and the ordered pattern of H-site occupation forming double chains of H atoms along the a-axis. Each double chain is comprised of one chain each of crystallographically distinct H1 and H2 atoms. Four parallel chains of vacancies (×) separate neighboring double chains. Red vacancies represent a third 4c site (H3) for possible H occupation appearing at higher temperatures. (c) View along the b-axis. (d) View along the a-axis.

Figure 5.
The hexagonal P6/mmm lattice constants (a, c) and unit cell volume (V) for ZrBe2Hx near or at 500 K as functions of x, as determined by neutron powder diffraction (NPD). Values at x = 0 estimated from [1]. Exact temperatures for each datapoint are listed in Table S9.

Figure 6.
The lattice parameters of the three distinct ZrBe2Hx compounds (x = 0.67, 1, 1.5) as functions of temperature, as determined by NPD. The black diamonds denote values for x = 0 from [1]. (a) distance d between Zr planes, equivalent to the c lattice constant for hexagonal P6/mmm symmetry; (b) average Zr basal-plane area A/ZrBe2Hx formula unit (f.u.); (c) average volume V/ZrBe2Hx f.u., where V = d × A.

Figure 7.
Neutron vibrational spectra of ZrBe2D1.5 and ZrBe2Hx (x = 0.6, 0.9, 1.2, 1.5) samples. Black spectra were measured at 10 K. Gray spectra were measured at room temperature except for ZrBe2H0.6, which was measured at 480 K. Red spectrum reflects the 10 K ZrBe2D1.5 spectrum after rescaling the neutron energy loss values by . ZrBe2Hx spectra are roughly normalized to the same ZrBe2 mass and all spectra are vertically offset for clarity. Full-width-at-half-maximum instrumental resolutions are depicted by the horizontal bars beneath the spectra. (N.B., 1 meV ≈ 8.0655 cm−1).

Figure 8.
Comparison of the 10 K neutron vibrational spectra (black) for orthorhombic ZrBe2H (identical to the ZrBe2H0.9 sample spectrum) and ZrBe2H0.67 (derived by subtracting the minor ZrBe2H fraction from the ZrBe2H0.6 sample spectrum) with the simulated 1 + 2-phonon spectra for the 0 K density-functional-theory-optimized structures of Imma-ordered ZrBe2H (blue) and Cmcm-ordered ZrBe2H0.67 (red) assuming full occupancies for the H sites designated in Figure 2 and Figure 4. Green and orange curves denote the corresponding 1-phonon spectra. Arrows provide a guide for relating simulated peak intensities to the experimental scattering features. (N.B., 1 meV ≈ 8.0655 cm−1).


Table 1.
Summary of the room-temperature phases present in the ZrBe2Dx and ZrBe2Hx samples.
| Synthesized Sample 1 | Hydride Structural Phases Present 2 |
|---|---|
| ZrBe2D1.5 sample | hexagonal ZrBe2D1.5 |
| ZrBe2H1.5 sample | hexagonal ZrBe2H1.5 |
| ZrBe2H1.2 sample | ~2:1 orthorhombic ZrBe2H:hexagonal ZrBe2H1.4 |
| ZrBe2H0.9 sample | orthorhombic ZrBe2H |
| ZrBe2H0.6 sample | ~4:1 orthorhombic ZrBe2H0.67:orthorhombic ZrBe2H |
1 N.B., throughout the text, to avoid confusion, the use of the appended term “sample” implies the referral to one of the synthesized samples and not to a particular ZrBe2Hx structural phase. 2 All samples also contained 2% to 3% of hexagonal ZrBe5 impurity phase.
Disclaimer/Publisher’s Note: The statements, opinions and data contained in all publications are solely those of the individual author(s) and contributor(s) and not of MDPI and/or the editor(s). MDPI and/or the editor(s) disclaim responsibility for any injury to people or property resulting from any ideas, methods, instructions or products referred to in the content. |
© 2022 by the authors. Licensee MDPI, Basel, Switzerland. This article is an open access article distributed under the terms and conditions of the Creative Commons Attribution (CC BY) license (https://creativecommons.org/licenses/by/4.0/).
Share and Cite
MDPI and ACS Style
Wu, H.; Zhou, W.; Udovic, T.J.; Bowman, R.C., Jr.; Hauback, B.C. Characterizing the ZrBe2Hx Phase Diagram via Neutron Scattering Methods. Inorganics 2023, 11, 1. https://doi.org/10.3390/inorganics11010001
AMA Style
Wu H, Zhou W, Udovic TJ, Bowman RC Jr., Hauback BC. Characterizing the ZrBe2Hx Phase Diagram via Neutron Scattering Methods. Inorganics. 2023; 11(1):1. https://doi.org/10.3390/inorganics11010001
Chicago/Turabian StyleWu, Hui, Wei Zhou, Terrence J. Udovic, Robert C. Bowman, Jr., and Bjørn C. Hauback. 2023. "Characterizing the ZrBe2Hx Phase Diagram via Neutron Scattering Methods" Inorganics 11, no. 1: 1. https://doi.org/10.3390/inorganics11010001
Note that from the first issue of 2016, this journal uses article numbers instead of page numbers. See further details here.