Abstract
Pressure-induced amorphization (PIA) has drawn great attention since it was first observed in ice. This process depends closely on the crystal structure, the size, the morphology and the correlated pressurization environments, among which the morphology-tuned PIA remains an open question on the widely concerned mesoscale. In this work, we report the synthesis and high-pressure research of VO2(B) nanobelts. XRD and TEM were performed to investigate the amorphization process. The amorphization pressure in VO2(B) nanobelts(~30 GPa) is much higher than that in previous reported 2D VO2(B) nanosheets(~21 GPa), the mechanism is the disruption of connectivity at particular relatively weaker bonds in the (010) plane. These results suggest a morphology-tuned pressure-induced amorphization, which could promote the fundamental understanding of PIA.
1. Introduction
Amorphous materials without long-range order present unique physical properties compared to their crystalline counterparts, which is the prime motivation behind research on materials science. Since the first observation of transforming crystalline materials into amorphous phase by applying pressure (pressure-induced amorphization, PIA), PIA has attracted considerable interest because of the disordering process and diverse properties of amorphous phase, and this phenomenon has been observed in many materials like H2O, TiO2, SiO2, Y2O3 and CaAl2Si2O8 [1,2,3,4,5,6]. From a certain point of view, PIA is a unique kind of pressure-induced phase transition, whose process depends closely on the crystal structure, the size, the morphology and the correlated pressurization environments of the materials. For example, size-dependent amorphization has been found in Y2O3 [5]. Apart from this, non-hydrostatic induced amorphization has been observed in B4C [7] and MAPbBr3 [8]. Recent high-pressure study on several nanomaterials with different morphology show morphology-tuned high-pressure phase transitions. For example, a different phase transition routine has been found in one-dimensional (1D) Si [9], AlN [10], ZnS [11], ZnO [12], SnO2 [13], BaTiO3 [14], LiMn2O4 [15] and Zn2SnO4 [16] in contrast to their bulk materials or two-dimensional (2D) nanomaterials. For morphology-tuned amorphization, although one-dimensional TiO2 nanorods and nanorices show different onset pressures in pressure-induced amorphization revealed by synchrotron WAXS at atomic scale [17], open questions remain regarding the amorphization and morphology of typical oxide materials as a function of pressure on the widely concerned mesoscale. Determining the amorphization process is one of the crucial parameters required for understanding nanomaterials properties as the structure-function relationship, while the morphology-tuned pressure-induced amorphization remains unclear for the functional materials.
VO2 is a representative polymorphic material with various conventional structures at ambient conditions, including tetragonal VO2(A), monoclinic VO2(M1) and VO2(B). Besides, VO2 nanomaterials with different morphology have been synthesized in recent years, providing an ideal model for investigating the morphology effect on the structure transitions of nanomaterials [18,19,20,21,22]. Recent high-pressure study on VO2(M1) suggest a M1→Mx transition in bulk materials [23], and a transition sequence of M1→M’1→X up to 61.2 GPa in nanobelts [24], but no PIA is observed. For VO2(A) phase, nanorods transform into an amorphous state at ~32 GPa [25], but lack of contrast in other initial morphology. VO2(B) is an important polymorph at ambient condition owning a monoclinic symmetry C2/m and a layered structure composed of edge and corner-sharing VO6 octahedra [19]. Recently, PIA has been found in 2D VO2(B) nanosheets at ~21.1 GPa [26], inspired by this result, it is reasonable to explore the phase transition process in VO2(B) nanomaterials, and further clarify the potential morphology-tuned amorphization. The study of morphology effect on the PIA of VO2 could potentially allow a more comprehensive understanding of the order–disorder transformation mechanism. This nanomaterial has a preferred orientation and a large L/D ratio (length/diameter ratio). Rods along axial direction can be regarded as micrometer material, while rods along radial direction can be regarded as nanomaterial. This could lead to an anisotropy of pressure effect between axial direction and radial direction, and finally result in various transition processes. An example is how the high mechanical stability of ZnS nanobelts results in an explosive mechanism for the wurtzite-to-sphalerite phase transformation, which is totally different with that in bulk and nanoparticle materials [11]. The strain energy of Si nanowires also generates a lower phase transition pressure (~2 GPa) and a larger bulk modulus (25%) than bulk Si [9].
Here we demonstrate the morphology-tuned pressure-induced amorphization in one dimensional VO2(B) nanobelts using in situ X-ray diffraction and TEM measurements. The crystal-amorphous transition is completed at ~30 GPa, much higher than ~21 GPa in 2D VO2(B) nanosheets [26], and the unique morphology-tuned amorphization mechanism has been carefully discussed. These results are different from previous work on VO2(B) nanosheets, providing not only an experimental understanding of order–disorder transformation mechanism, but also a synthetic guideline for functional amorphous materials from their crystalline phases.
2. Experimental
2.1. Preparation of VO2(B) Nanobelts
VO2(B) nanobelts were synthesized by a hydrothermal method using V2O5 as the source of vanadium and oxalic acid (H2C2O4 2H2O) as a reducing agent. All the chemical reagents in our experiments were of analytical grade and used without further purification. In a typical reaction, a certain amount of V2O5 (0.18 g) and oxalic acid (H2C2O4 2H2O) (0.252 g) were added into 100 mL distilled water at room temperature to form a suspension solution. The suspension was continuously stirred until a clear orange transparent solution was formed, after which the solution was placed in a 50 mL Teflon cup with a filling ratio 0.6 and then heated in a sealed autoclave with a stainless steel shell at 180 °C for 1 day.
After hydrothermal treatment, the autoclave was cooled down naturally to room temperature. The resulting black precipitates were collected by centrifuge tubes, washed with distilled water and dehydrated alcohol for several times by centrifuging, and then dried in vacuum freeze dryer for 2 days.
2.2. Morphology and Crystal Structure Characterizations
The morphology and crystal structure of VO2(B) nanobelts were characterized using Transmission Electron Microscope (TEM, 200 KV, HITACHI, H-8100IV), High Resolution Transmission Electron Microscope (HRTEM, 80 KV, JOEL, JEM-2200FS), Raman (Renishaw in Via) with 514.5 nm laser excitation and X-ray diffraction (XRD) with Cu Kα radiation (λ = 0.15418 nm). High pressure measurements were generated by a diamond anvil cell (DAC)In situ angle-dispersive synchrotron XRD (ADXD) measurements under high pressures were carried out at 4W2 beamline of Beijing Synchrotron Radiation Facility (BSRF). The wavelength is 0.6199 Å. The X-ray beam size is 26 × 8 µm2. The position and orientation of the detector to the X-ray beam were calibrated using the diffraction pattern of a CeO2 standard. The culet size of DAC is ~400 μm in diameter. The gasket was T301 stainless steel that was pre-indented to ~20 GPa. A hole with a diameter of ~150 μm was drilled to serve as the sample chamber by a laser drilling system at the center of the gasket indent. The powder was pre-pressed into a thin pellet and cut into flakes with proper sizes for DACs. Then, the tiny flake was loaded into a DAC along with a tiny ruby ball. Argon was used as the pressure-transmitting medium (PTM), which was loaded by cryogenic loading method. The background scattering was collected at each pressure point by shining the X-ray beam on the empty area inside the sample chamber, which only passed through the pressure medium and two diamond anvils. The exposure time was set at 30 s. One-dimensional (1D) XRD patterns were obtained by integrating the 2D patterns along the azimuth angle from 0° to 360° with the Dioptas software [27] The resulting diffraction patterns were refined using the GSAS package [28]. The pressures were determined from the pressure dependent shift of the R1 line fluorescence of ruby [29]. For the HRTEM of the recovered sample, the powder samples were dispersed in ethyl alcohol and picked up using a holey carbon grid. HRTEM experiments were carried out using the Field Emission Electron Microscope (JEM-2200FS) in Jilin University. An accelerating voltage of 80 kV was used to minimize the possible electron irradiation effect on the sample structure.
3. Results and Discussion
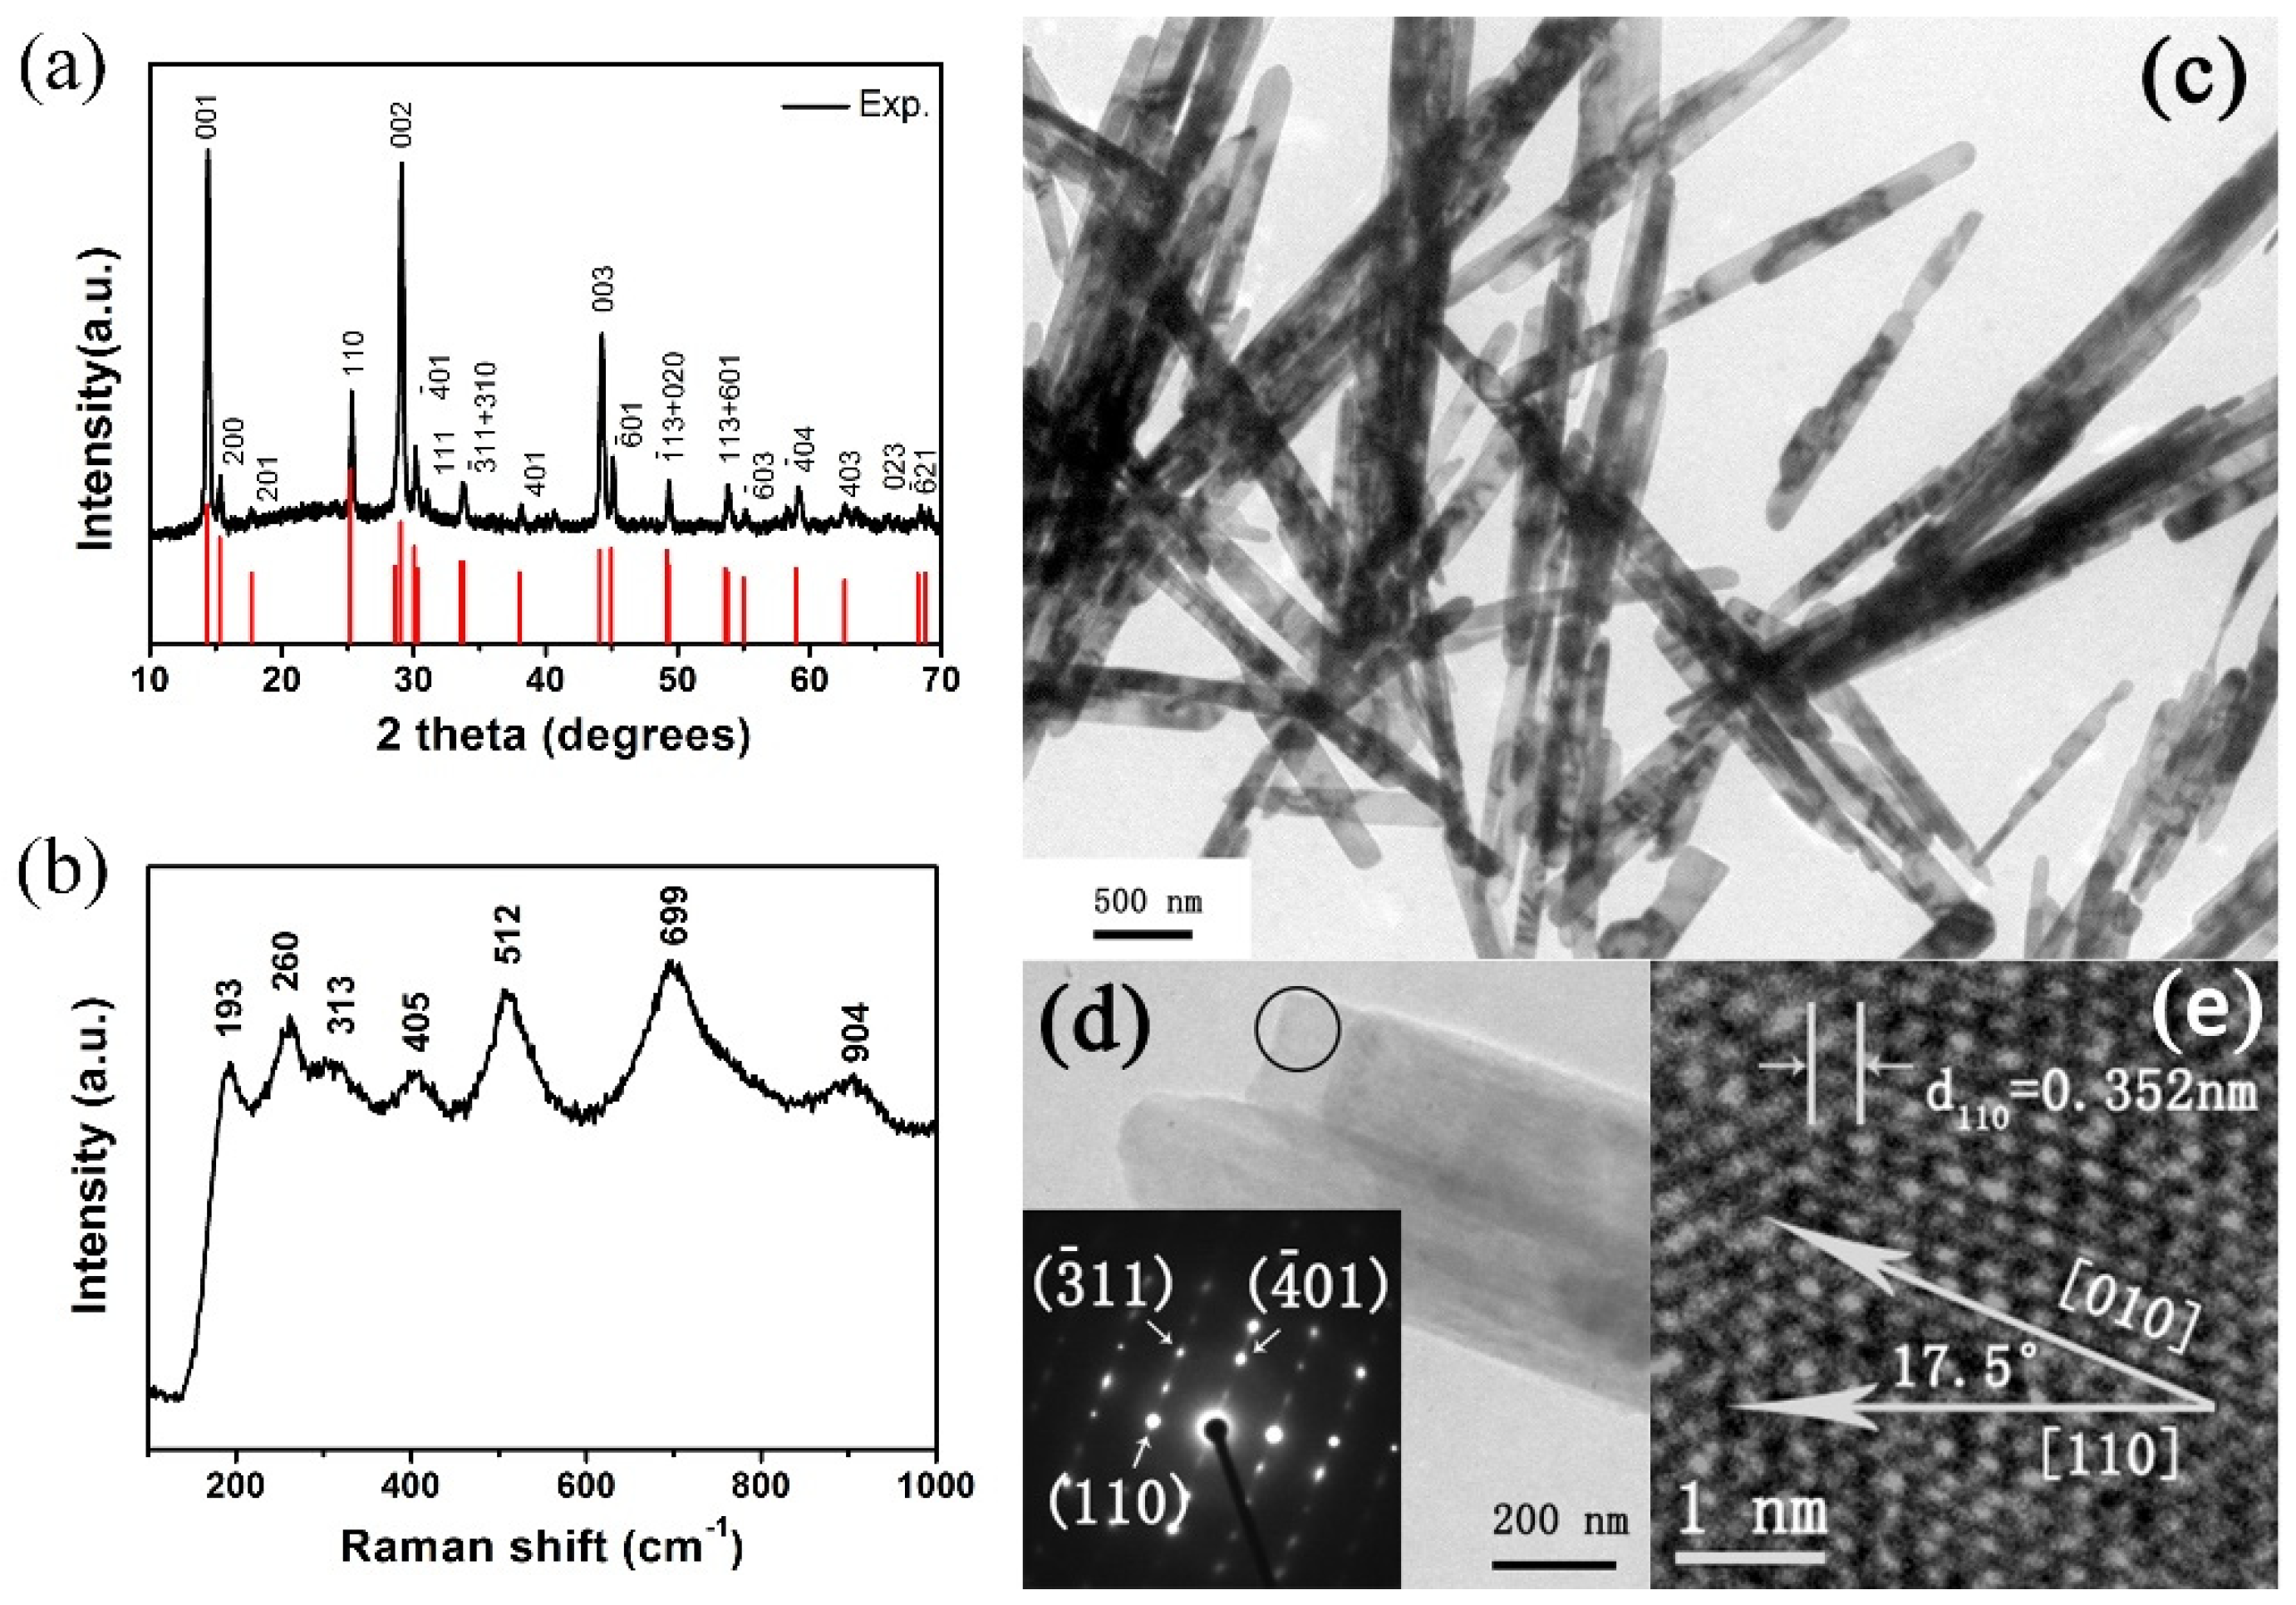
The crystal structure and phase composition of the obtained products were revealed by XRD. As shown in Figure 1a, all the diffraction peaks match well with the standard XRD pattern of a monoclinic phase (space group: C2/m, JCPDS No. 81-2392) and no peaks of any other vanadium oxide phases or impurities were detected. The strong and sharp diffraction peaks suggest high crystallinity. The lattice parameters of our sample refined by GSAS are a = 12.166 Å, b = 3.655 Å, c = 6.423 Å, β = 105.78°, which are in good agreement with JCPDS No. 81-2392 (a = 12.09 Å, b = 3.702 Å, c = 6.433 Å, β = 106.6°) and previous work [21,30]. Raman spectra of as-prepared VO2(B) nanobelts are shown in Figure 1b. The peaks located at 193, 270, 313, 405, 512, 699 and 904 cm−1 are attributed to Ag, Bg, Ag, Ag, Bg, Bg and B2g modes, respectively. Our Raman results match well with previous work [31,32,33].
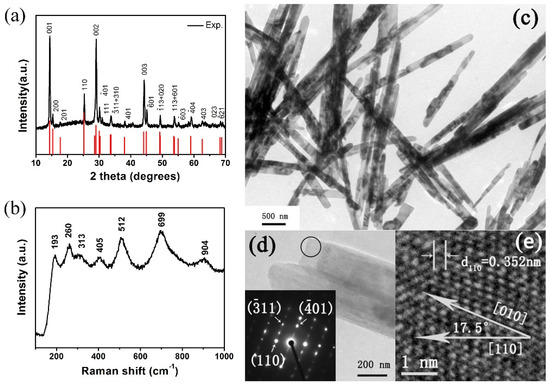
Figure 1.
(a) XRD pattern (b) Raman spectra and (c) TEM image of as-prepared VO2(B) nanobelts at ambient conditions. (d) The selected belt for HRTEM. Insets: selected area electron diffraction of the circular region of a single VO2(B) nanobelt. The diffraction spots with arrows can be defined, respectively. (e) HRTEM image of the selected area from the selected nanobelt. The lines over the number represent the scale bar.
From Figure 1c we can see that all the as-prepared products are belt-like morphology. The diameters of the belts are in a short range between 140 nm to 240 nm, and the length of the nanobelts are estimated to be several micrometers. In Figure 1d, the selected-area electron diffraction (SAED) pattern (inset) taken from the individual nanobelt demonstrates that the synthesized samples are single-crystal. In Figure 1e, the HRTEM image of the individual nanobelt of Figure 1d clearly exhibits lattice fringes, demonstrating that the synthesized nanobelts are single-crystal with a preferred [010] orientation. Our results correlate well with previous work in VO2(B) nanowires and nanorods [34,35,36].
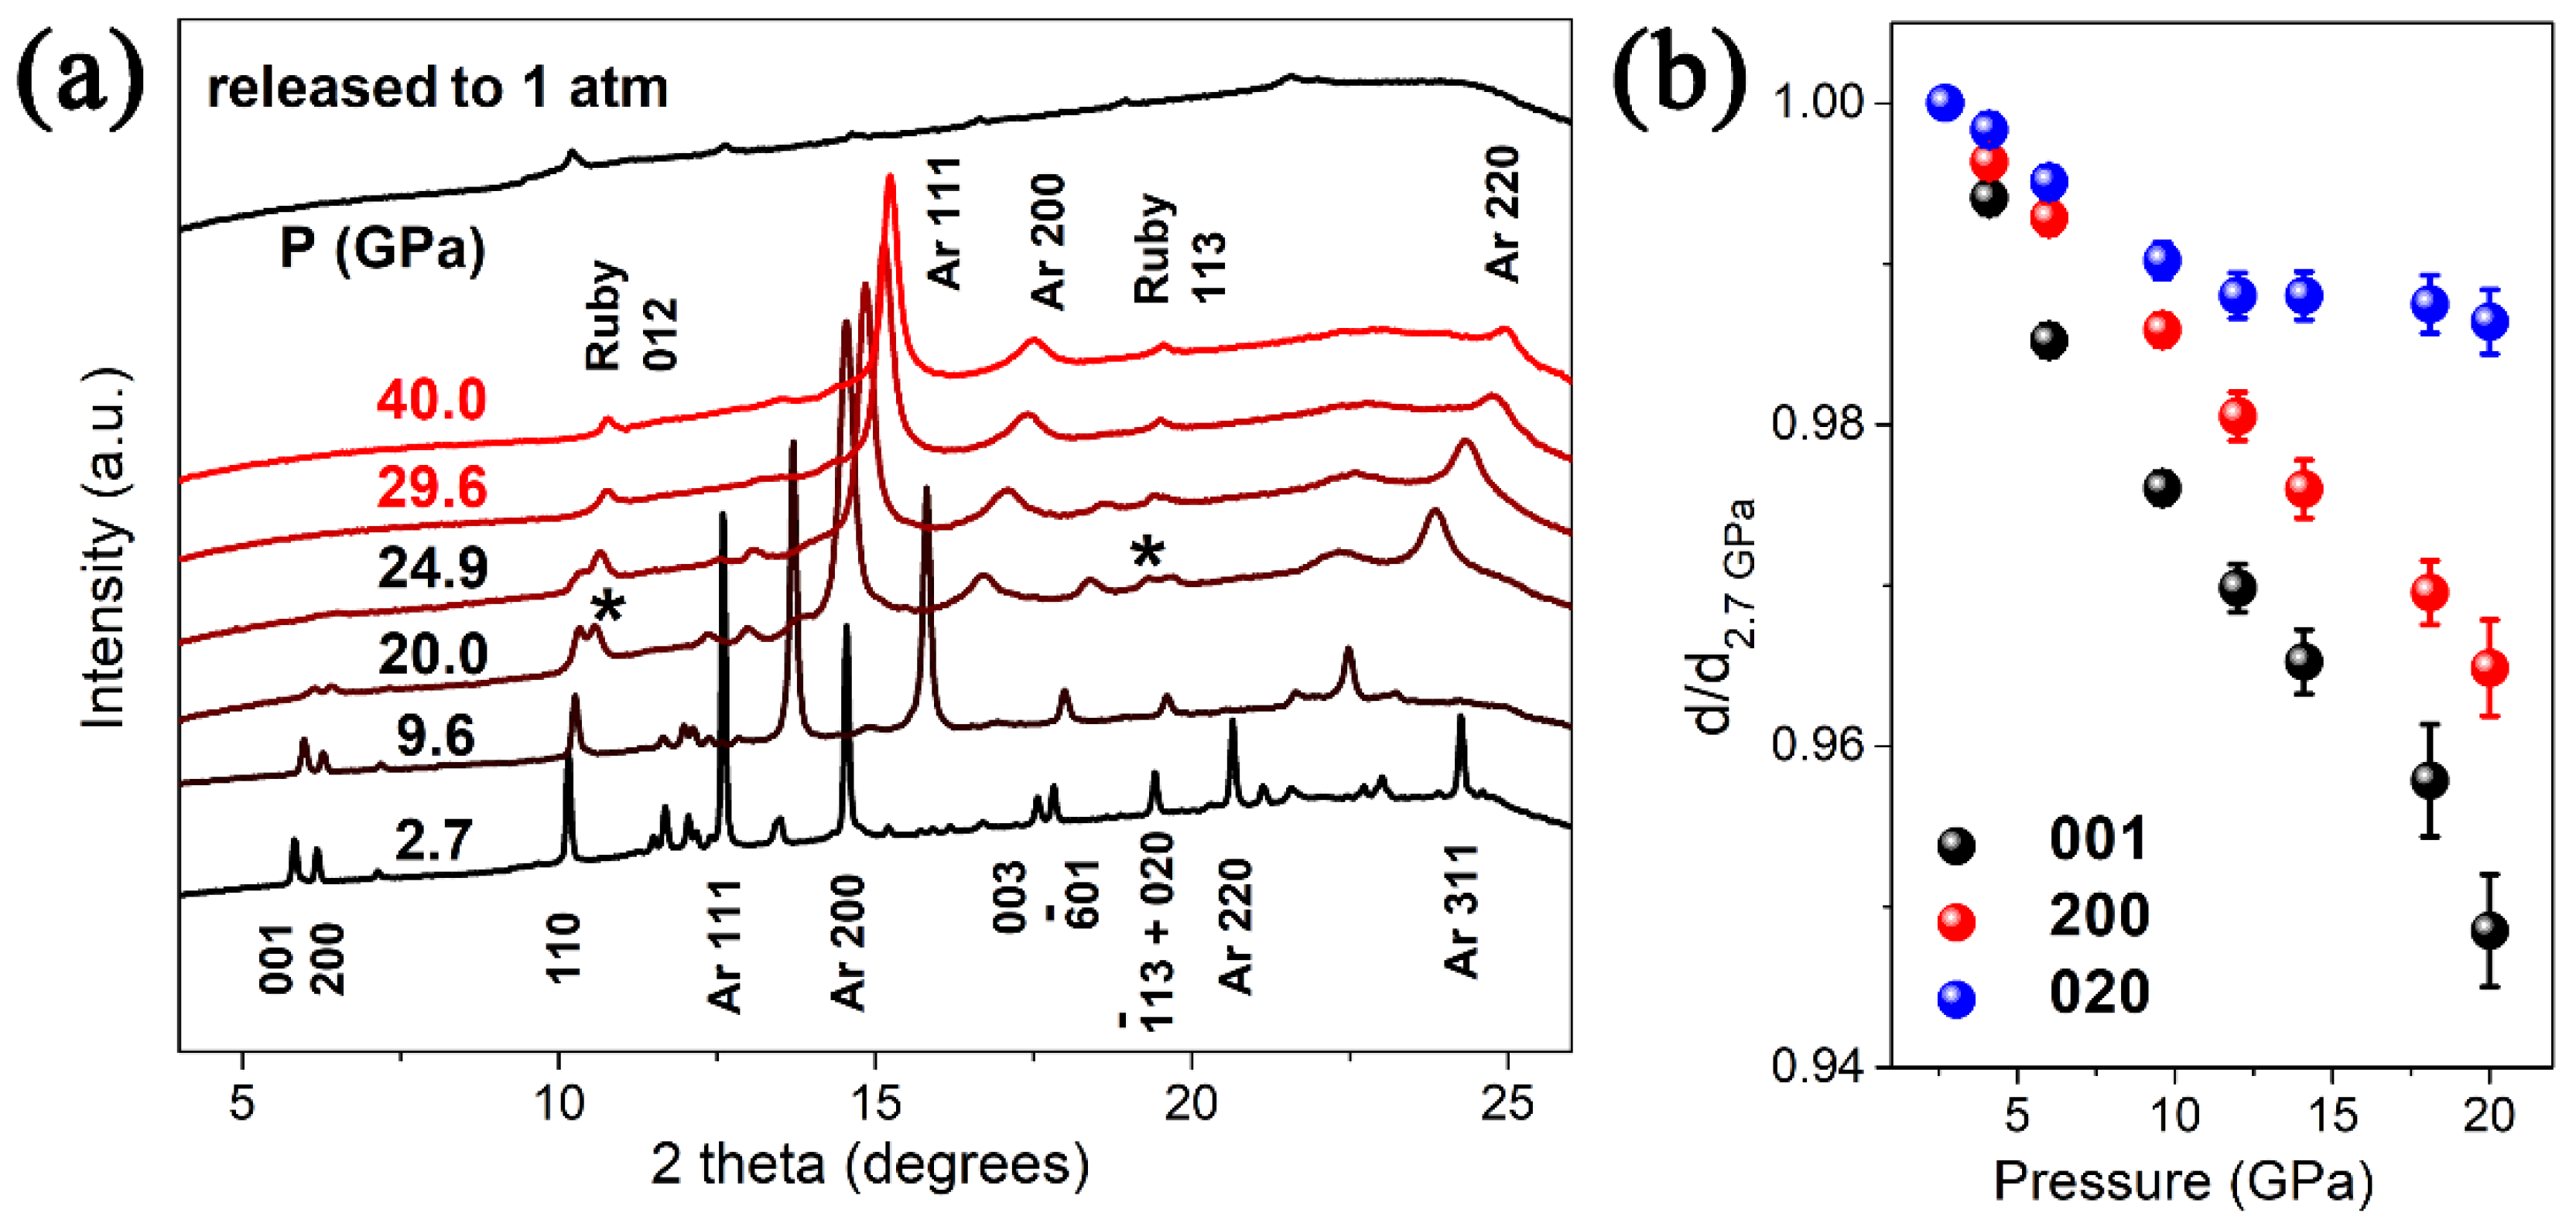
The crystal structure of VO2(B) belongs to a space group of C2/m, which consists of a three-dimensional framework of VO6 octahedra. The VO2(B) structure can be considered as formed by two identical layers of atoms along b, and the second layer is shifted with respect to the first one by 1/2, 1/2, 0. The pressure evolution of the XRD patterns of VO2(B) nanobelts are shown in Figure 2a. All the Bragg peaks shift to larger angles, showing the shrinkage of the VO2(B) lattice. The diffraction peaks of argon appear at 2.7 GPa and last till the highest pressure 40 GPa, which is similar to Santilla’n’s work in Mn2O3 [37]. Upon compression to 20 GPa the diffraction peaks of the sample broaden dramatically, the intensity of these diffraction peaks decrease sharply and several weak peaks disappear without occurring any new peak. With increasing pressure to 29.6 GPa, the disappearance of VO2(B) peaks signifies that the sample transformed into an amorphous state completely. This amorphous state lasts till the highest pressure 40 GPa. Upon decompression, the peaks of Ar disappear and no new peak emerges when the pressure is released to ambient condition, suggesting an irreversible amorphization. This PIA is similar to the previous study in VO2(B) nanosheets [26] and high pressure structural transition of VO2(A) in our previous work [25], but totally different with the crystal-crystal structural transition in VO2(M1) [23,24,38]. It is noticeable that the amorphization pressure in this work is significantly higher than that in VO2(B) nanosheets [26], similar to that in VO2(A) nanorods. Furthermore, we have refined the bulk modulus of VO2(B) nanobelts by the Birch–Murnaghan equation, bulk modulus B0 = 132.9 GPa, pressure derivative B0′ = 4, and the zero-pressure volume V0 = 274.3 Å3, the observed bulk modulus is slightly higher than that in nanosheets (B0 = 129.1 GPa, B0′ = 4).
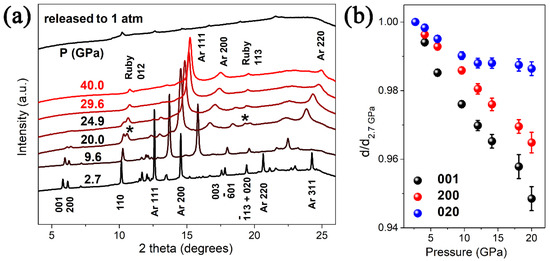
Figure 2.
(a) XRD patterns of VO2(B) upon compression, the peaks of ruby are asterisked as *. (b) Pressure dependence of the d value of three selected peaks (001), (020) and (200) upon compression.
From the pressure dependence of the d value of three selected peaks (001), (020) and (200) upon compression in Figure 2b, we can find a nonlinear variation of (020) peak at 12 GPa in contrast to the linear dependence of (001) peak and (200) peak. The low compressibility of (020) planes above 12 GPa reveals that the movement of the atoms along the b axis becomes difficult. The pressure transmitting medium in this experiment is argon, whose highest hydrostatic pressure differs from ~12 GPa [39] to ~30 GPa [40] in the previous research, if the aeolotropy of pressure effect by the [010] orientation is derived from the non-hydrostatic effect at higher pressures, similar discontinuity should also be observed in the [001] and [100] orientation, but Figure 2b shows a linear dependence of (001) peak and (200) peak. Thus, the aeolotropy of pressure effect by the [010] orientation at ~12 GPa has no relationship with the non-hydrostatic effect of PTM, and it is reasonable to speculate that this aeolotropy is related to the unique crystal structure, especially the orientation of the VO6 polyhedra in the crystal lattice.
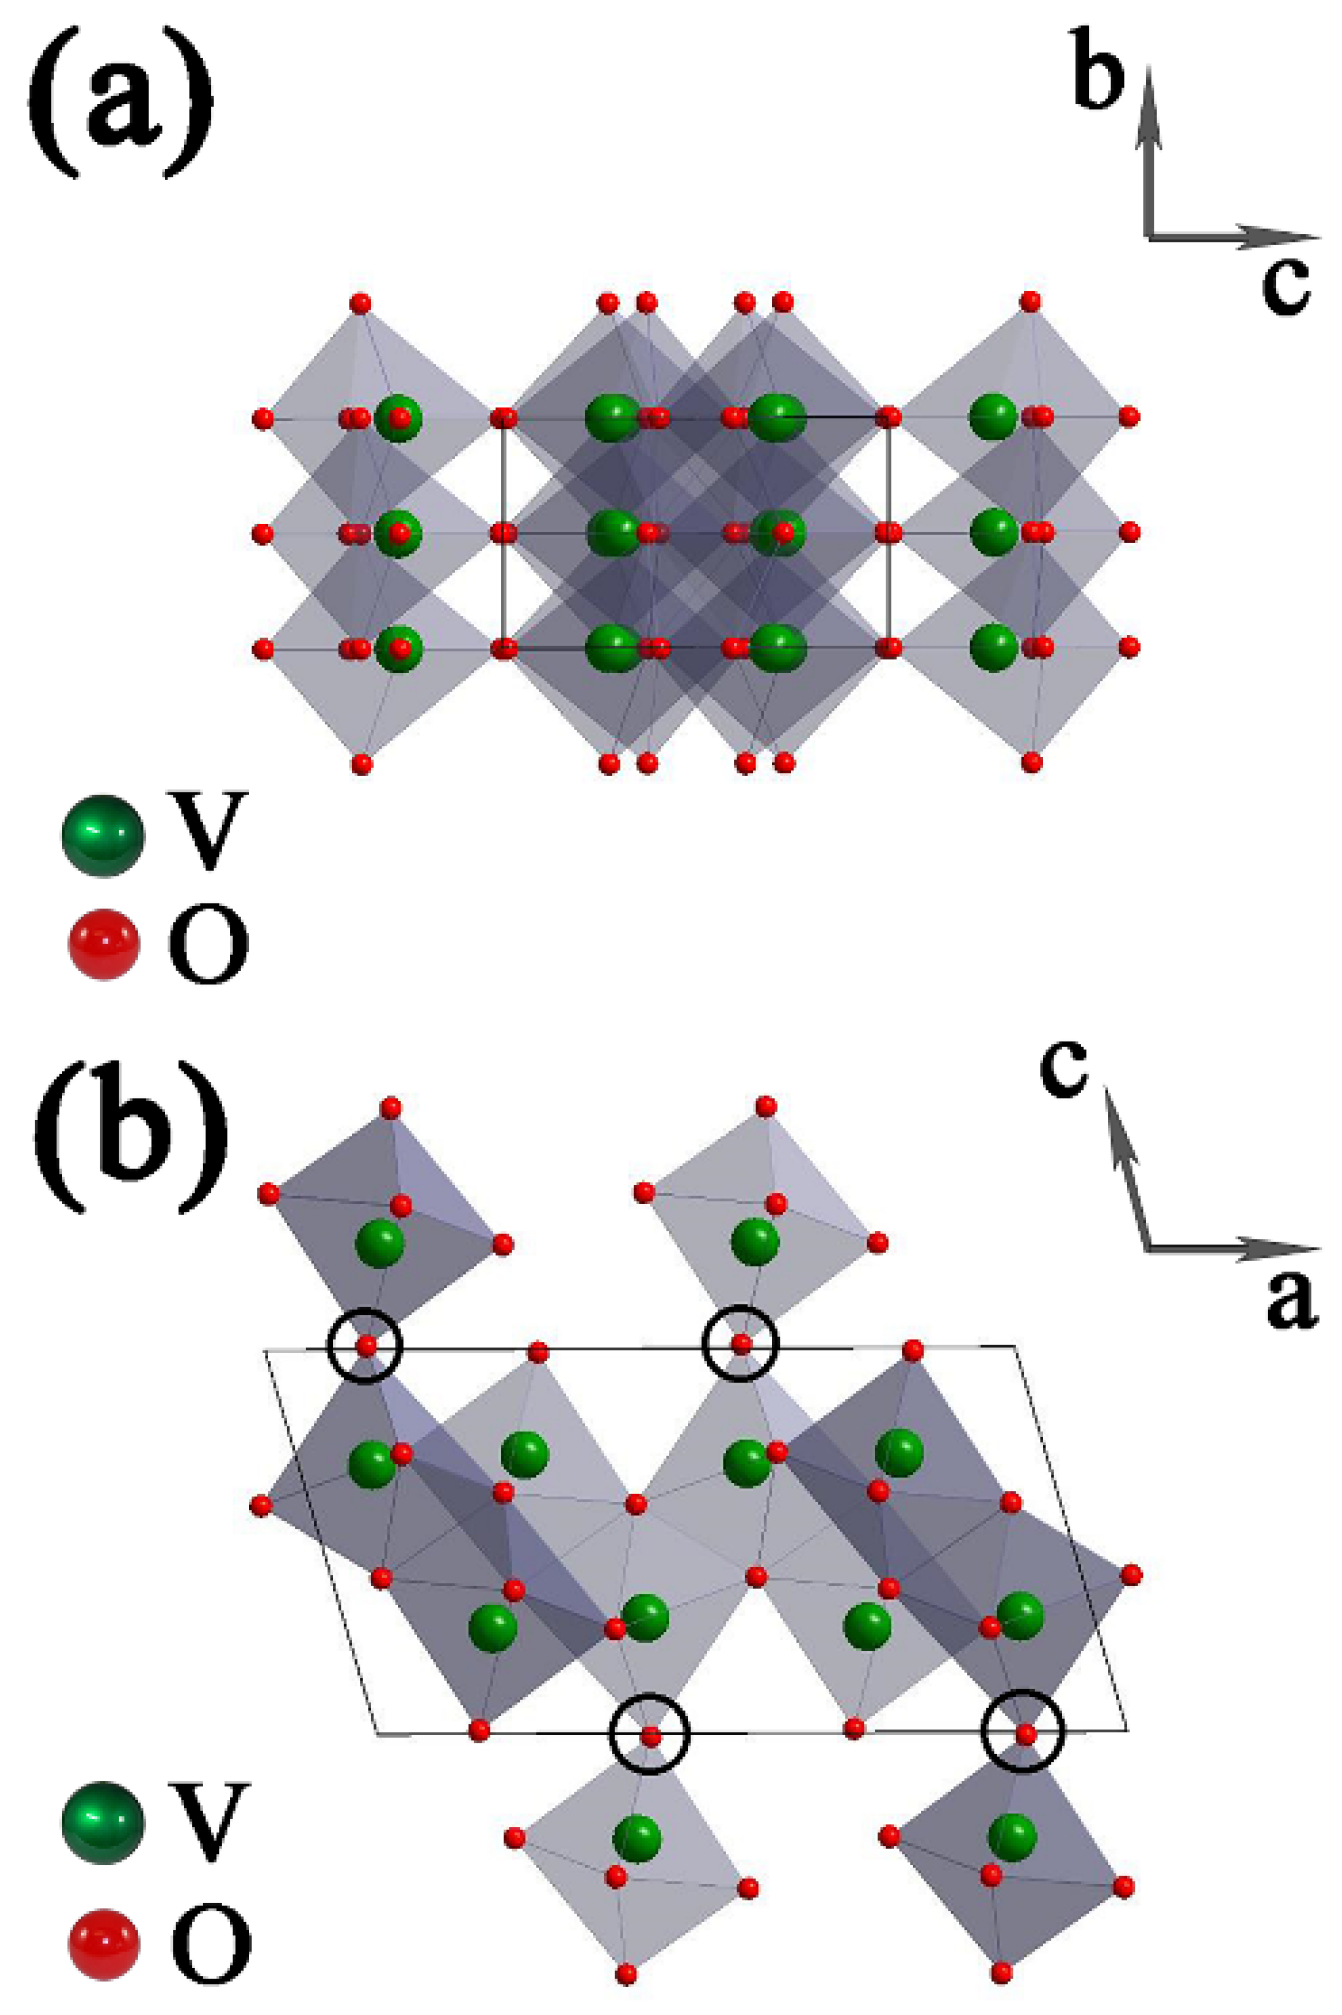
The crystal structure of VO2(B) is shown in Figure 3. There are two identical layers of atoms along b in a unit cell, the second layer is shifted with respect to the first one by 1/2, 1/2, 0, and VO6 octahedra are connected with each other by corners or edges. For the circled regions in Figure 3b, the large empty spaces are relatively easier to be compressed than the solid octahedra. On the other hand, the connection between corner-shared VO6 octahedra is much weaker than the connection between edge-shared VO6 octahedra. From the mechanical-stability point of view, breaking the connection of octahedra in the (010) plane is much easier than that in the (100) plane and the (001) plane [41]. Therefore, the coherence along the [010] direction may break first at a critical pressure.
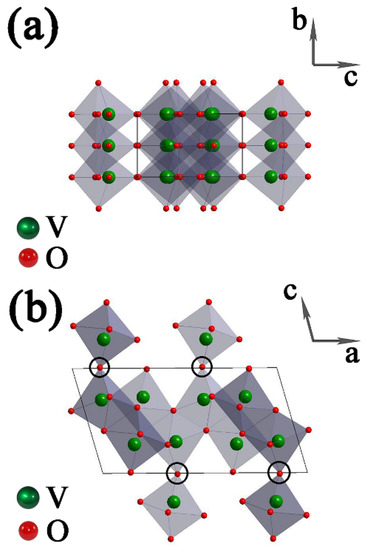
Figure 3.
Unit-cell structure of monoclinic VO2(B), which is built up of edge- and corner-shared VO6 octahedra: viewing along the (a) a axis and (b) b axis. The circled regions represent the possibly weakest connection between VO6 octahedra. The arrows represent the axis directions of the unit cell.
For the various compressibility in three dimensions of VO6 octahedra, we can find that the structure of VO2(B) is formed by two identical layers of atoms along the b axis, the VO6 octahedra along the b axis are all edge-shared, and the VO6 octahedra arrangement is relatively dense. While along the a axis and c axis, there are some corner-shared VO6 octahedra, and the VO6 octahedra arrangement is relatively sparse. This can explain the discontinuity of (020) peak in Figure 2b, indicating a lower compressibility along the b axis than the other two axes.
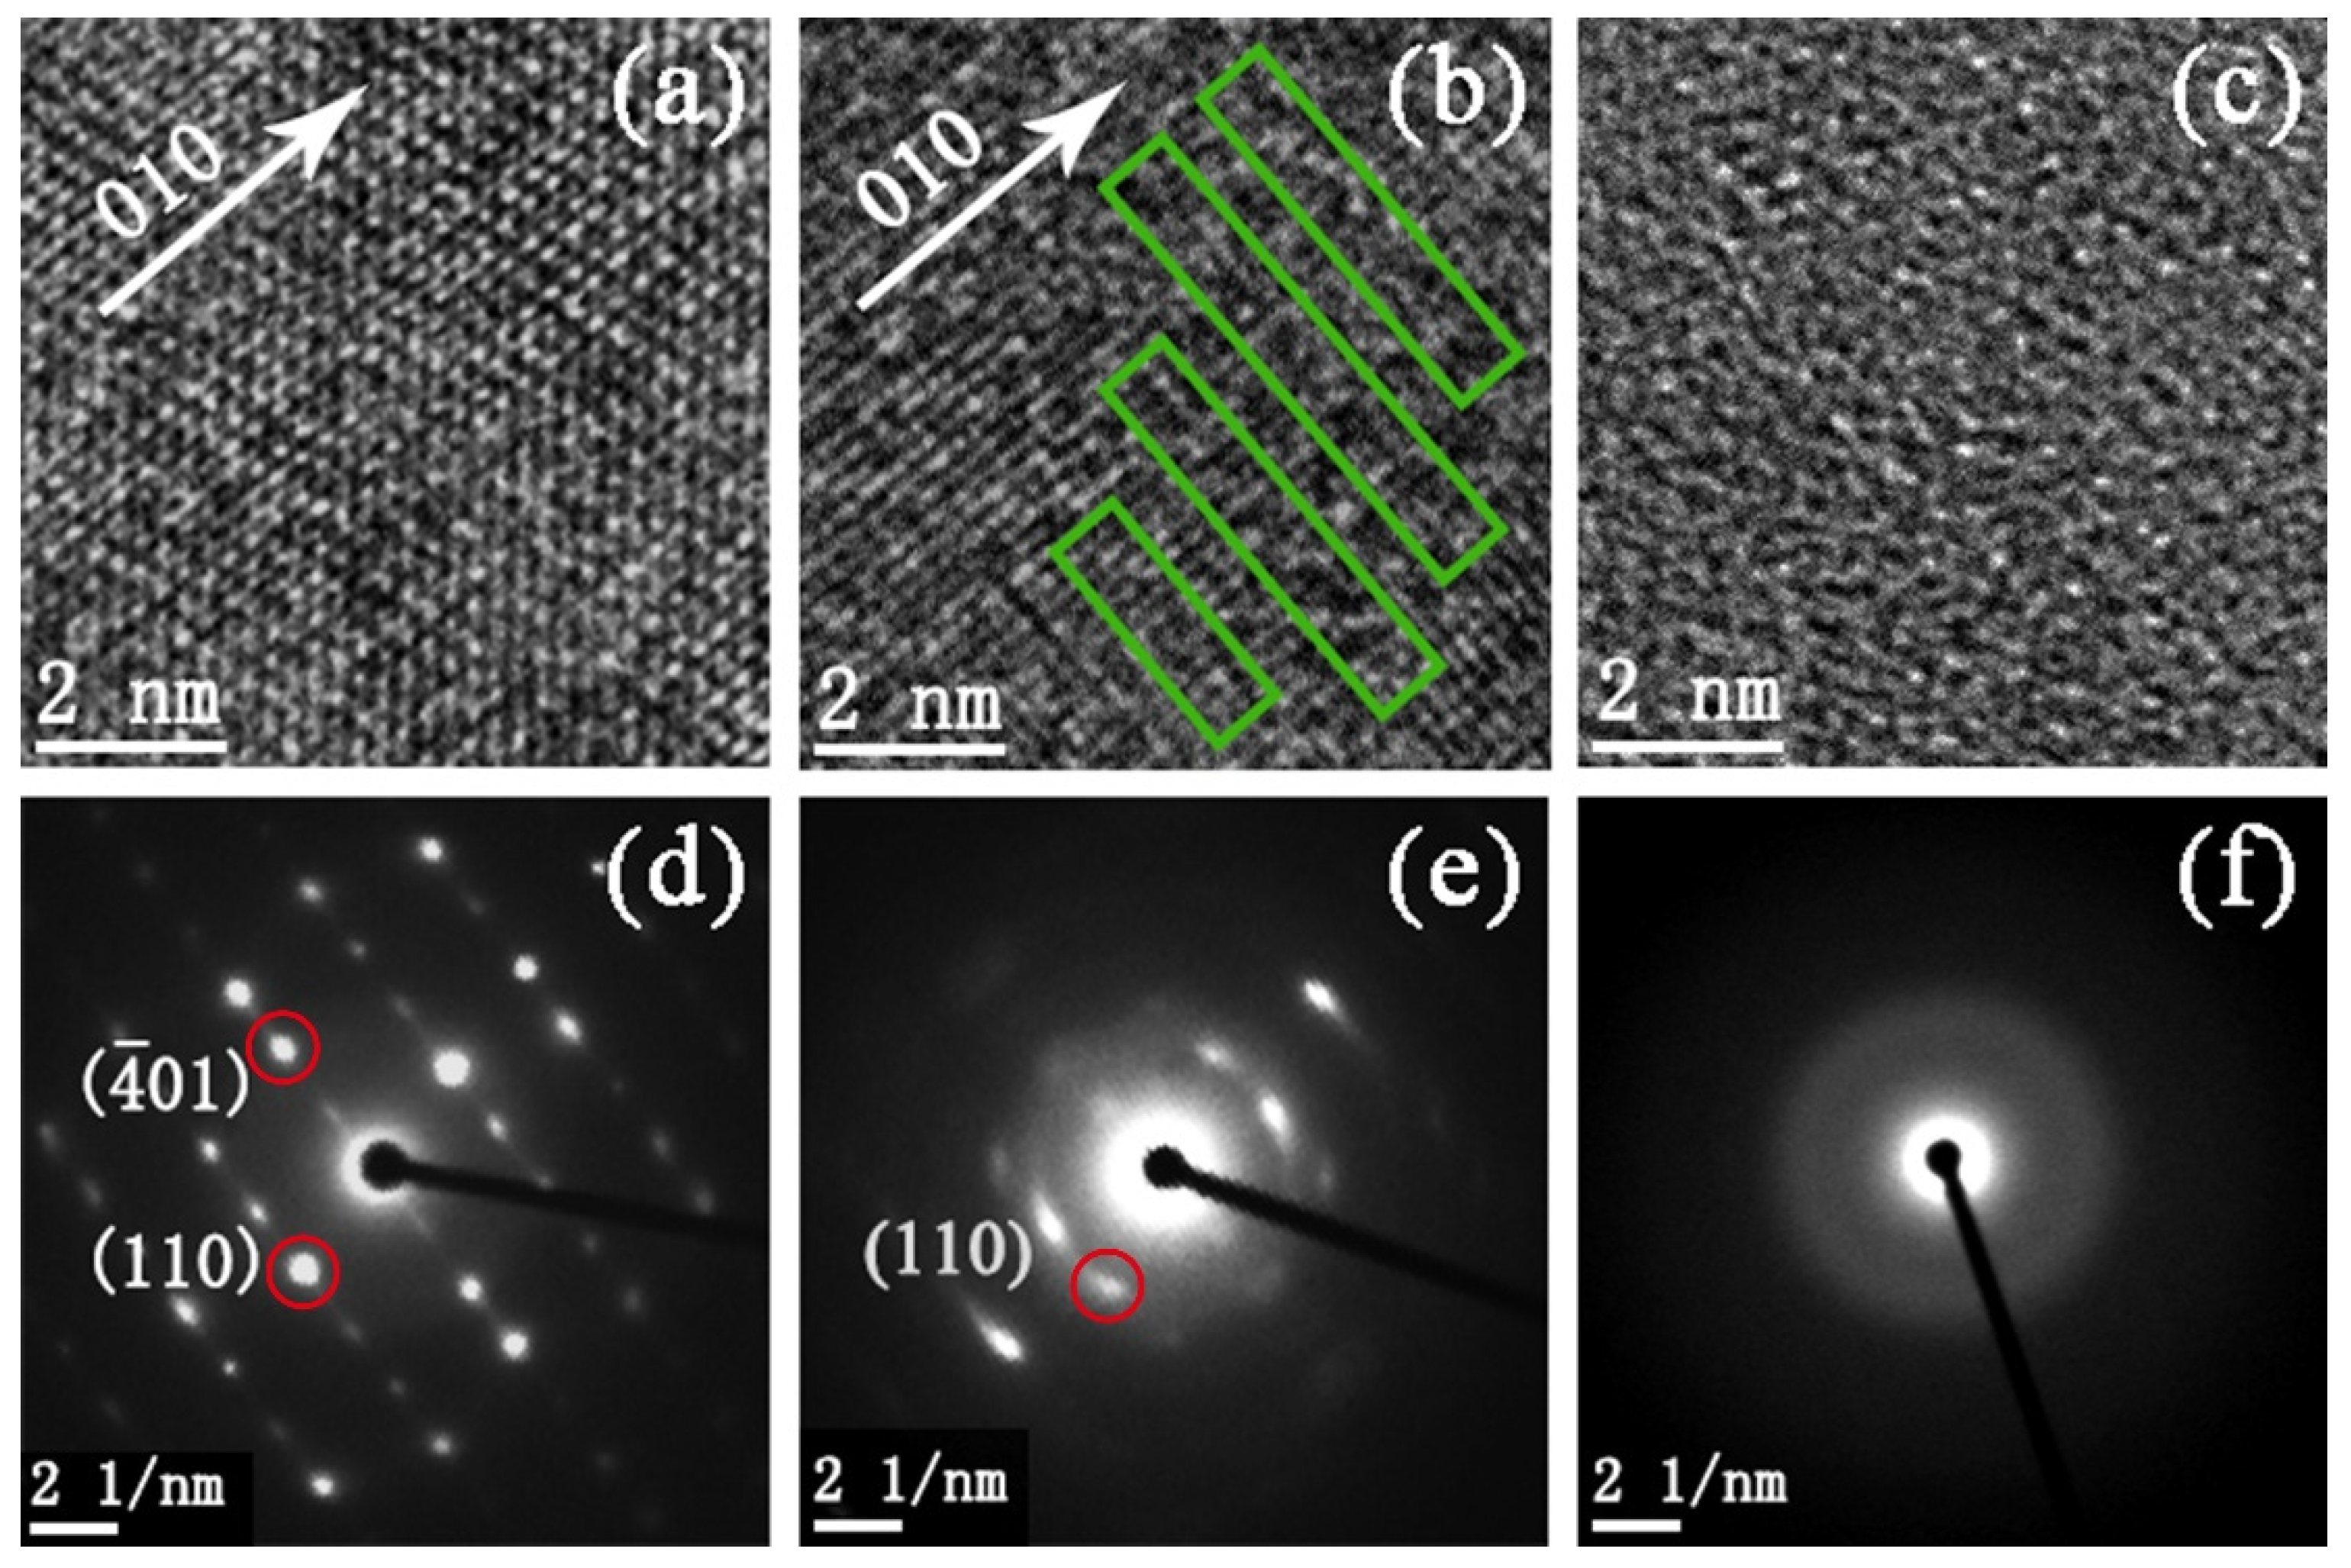
To further reveal the structure change of VO2(B) nanobelts during amorphization, we carried out high-resolution transmission electron microscopy (HRTEM) and selected area electron diffraction (SAED) analysis for the pristine sample and samples released from 15 and 30 GPa, respectively. For the sample released from 15 GPa, there is a small amount of amorphous segments in the crystalline lattice in contrast to the pristine one, as marked by rectangles in Figure 4b. Moreover, many diffraction points become weak and disappear and an amorphous halo emerges in Figure 4e. Hence, in the regions marked by rectangles, the local structure of sample is expected at the beginning stage of amorphization. For the sample released from 30 GPa, no crystalline lattice is observed in Figure 4c and only an amorphous halo emerges in Figure 4f. This indicates that the amorphization was completed and the sample transformed to the amorphous state totally at 30 GPa. The whole process is clear and in good agreement with XRD data.
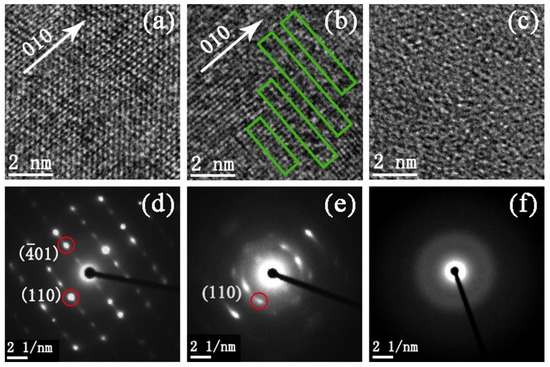
Figure 4.
HRTEM images and SAED patterns of VO2(B) nanobelts from (a,d) pristine sample and recovered samples from (b,e) 15 GPa and (c,f) 30 GPa, respectively. Disorder regions are marked by rectangles. The diffraction spots with red circles can be defined, respectively.
Combining the above data, we propose that the amorphization is possibly induced by the disruption of connectivity between the octahedra in the (010) plane. From Figure 1d,e, we can find the nanobelts in our experiments own a [010] growth orientation, the amount of edge-shared VO6 octahedra along this orientation, in other words, along the b axis, is much larger than that along the a axis and c axis, making a higher amorphization pressure than nanosheets, indicating a morphology-tuned pressure-induced amophization.
4. Conclusions
In summary, observations of PIA in VO2(B) nanobelts have been performed using high pressure XRD and HRTEM analysis. The initial monoclinic phase transformed into an amorphous form at ~30 GPa. Upon decompression, the amorphous retained until the ambient condition. We propose that the PIA is due to the disruption of connectivity at particular, relatively weaker bonds in the (010) plane, which is helpful and powerful to probe into the implications on the nature of morphology-tuned amorphization. Further, such pressure-induced amorphous nanomaterials hold great promise for numerous applications in the future, and the corresponding synthetic guideline would motivate us to discover more pressure-induced amorphous materials.
Author Contributions
B.C. and H.Z. contributed equally in this work. Q.L. and B.L. initiated the research project, B.C. and Q.L. designed experiments. B.C., H.Z. and Q.L. carried out synchrotron XRD and TEM experiments. B.C., H.Z., Q.L., J.L. and B.L. analysed data. B.C., H.Z. and Q.L. wrote the paper. All authors discussed the results and commented on the manuscript. All authors have read and agreed to the published version of the manuscript.
Funding
This work was financially supported by the National Key Research and Development Program of China (No. 2018YFA0305900), National Natural Science Foundation of China (No. 11874172, U2032215, 11634004 and 12104427).
Acknowledgments
We thank F. Zhang from Institute of High Energy Physics, Chinese Academy of Sciences, T. Liang from Center for High Pressure Science and Technology Advanced Research for their kind help with data analysis. We thank R. Liu, B. Liu and D. Li from State Key Laboratory of Superhard Materials for their help with experiments.
Conflicts of Interest
The authors declare no conflict of interest.
References
- Mishima, O.; Calvert, L.D.; Whalley, E. ‘Melting ice’ I at 77 K and 10 kbar: A new method of making amorphous solids. Nature 1984, 310, 393–395. [Google Scholar] [CrossRef]
- Swamy, V.; Kuznetsov, A.; Dubrovinsky, L.S.; McMillan, P.F.; Prakapenka, V.B.; Shen, G.; Muddle, B.C. Size-Dependent Pressure-Induced Amorphization in Nanoscale TiO2. Phys. Rev. Lett. 2006, 96, 135702. [Google Scholar] [CrossRef] [PubMed]
- Li, Q.; Liu, B.; Wang, L.; Li, D.; Liu, R.; Zou, B.; Cui, T.; Zou, G.; Meng, Y.; Mao, H.-K.; et al. Pressure-Induced Amorphization and Polyamorphism in One-Dimensional Single-Crystal TiO2 Nanomaterials. J. Phys. Chem. Lett. 2010, 1, 309–314. [Google Scholar] [CrossRef]
- Hemley, R.J.; Jephcoat, A.P.; Mao, H.K.; Ming, L.C.; Manghnani, M.H. Pressure-induced amorphization of crystalline silica. Nature 1988, 334, 52–54. [Google Scholar] [CrossRef]
- Wang, L.; Yang, W.; Ding, Y.; Ren, Y.; Xiao, S.; Liu, B.; Sinogeikin, S.V.; Meng, Y.; Gosztola, D.J.; Shen, G.; et al. Size-dependent amorphization of nanoscale Y2O3 at high pressure. Phys. Rev. Lett. 2010, 105, 095701. [Google Scholar] [CrossRef]
- Daniel, I.; Gillet, P.; McMillan, P.F.; Wolf, G.; Verhelst, M.A. High-pressure behavior of anorthite: Compression and amorphization. J. Geophys. Res. Solid Earth 1997, 102, 10313–10325. [Google Scholar] [CrossRef]
- Yan, X.Q.; Tang, Z.; Zhang, L.; Guo, J.J.; Jin, C.Q.; Zhang, Y.; Goto, T.; McCauley, J.W.; Chen, M.W. Depressurization amorphization of single-crystal boron carbide. Phys. Rev. Lett. 2009, 102, 75505. [Google Scholar] [CrossRef]
- Zhang, R.; Cai, W.; Bi, T.; Zarifi, N.; Terpstra, T.; Zhang, C.; Verdeny, Z.V.; Zurek, E.; Deemyad, S. Effects of Nonhydrostatic Stress on Structural and Optoelectronic Properties of Methylammonium Lead Bromide Perovskite. J. Phys. Chem. Lett. 2017, 8, 3457–3465. [Google Scholar] [CrossRef] [PubMed]
- Wang, Y.; Zhang, J.; Wu, J.; Coffer, J.L.; Lin, Z.; Sinogeikin, S.V.; Yang, W.; Zhao, Y. Phase Transition and Compressibility in Silicon Nanowires. Nano Lett. 2008, 8, 2891–2895. [Google Scholar] [CrossRef]
- Shen, L.H.; Li, X.F.; Ma, Y.M.; Yang, K.F.; Lei, W.W.; Cui, Q.L.; Zou, G.T. Pressure-induced structural transition in AlN nanowires. Appl. Phys. Lett. 2006, 89, 141903. [Google Scholar] [CrossRef]
- Wang, Z.; Daemen, L.L.; Zhao, Y.; Zha, C.S.; Downs, R.T.; Wang, X.; Wang, Z.L.; Hemley, R.J. Morphology-tuned wurtzite-type ZnS nanobelts. Nat. Mater. 2005, 4, 922–927. [Google Scholar] [CrossRef] [PubMed]
- Dong, Z.; Zhuravlev, K.K.; Morin, S.A.; Li, L.; Jin, S.; Song, Y. Pressure-Induced Structural Transformations of ZnO Nanowires Probed by X-ray Diffraction. J. Phys. Chem. C 2012, 116, 2102–2107. [Google Scholar] [CrossRef]
- Dong, Z.; Song, Y. Pressure-induced morphology-dependent phase transformations of nanostructured tin dioxide. Chem. Phys. Lett. 2009, 480, 90–95. [Google Scholar] [CrossRef]
- Zhang, H.; Cheng, B.; Li, Q.; Liu, B.; Mao, Y. Morphology-Tuned Phase Transitions of Horseshoe Shaped BaTiO3 Nanomaterials under High Pressure. J. Phys. Chem. C 2018, 122, 5188–5194. [Google Scholar] [CrossRef]
- Lin, Y.; Yang, Y.; Ma, H.; Cui, Y.; Mao, W.L. Compressional Behavior of Bulk and Nanorod LiMn2O4 under Nonhydrostatic Stress. J. Phys. Chem. C 2011, 115, 9844–9849. [Google Scholar] [CrossRef]
- Das, P.P.; Devi, P.S.; Blom, D.A.; Vogt, T.; Lee, Y. High-Pressure Phase Transitions of Morphologically Distinct Zn2SnO4 Nanostructures. ACS Omega 2019, 4, 10539–10547. [Google Scholar] [CrossRef] [PubMed]
- Meng, L.; Duwal, S.; Lane, J.M.D.; Ao, T.; Stoltzfus, B.; Knudson, M.; Park, C.; Chow, P.; Xiao, Y.; Fan, H.; et al. High pressure induced atomic and mesoscale phase behaviors of one-dimensional TiO2 anatase nanocrystals. MRS Bull. 2022, 47, 455–460. [Google Scholar] [CrossRef]
- Théobald, F. Étude hydrothermale du système VO2-VO2,5-H2O. J. Less Common Met. 1977, 53, 55–71. [Google Scholar] [CrossRef]
- Théobald, F.; Cabala, R.; Bernard, J. Essai sur la structure de VO2(B). J. Solid State Chem. 1976, 17, 431–438. [Google Scholar] [CrossRef]
- Morin, F.J. Oxides Which Show a Metal-to-Insulator Transition at the Neel Temperature. Phys. Rev. Lett. 1959, 3, 34–36. [Google Scholar] [CrossRef]
- Zhang, S.; Shang, B.; Yang, J.; Yan, W.; Wei, S.; Xie, Y. From VO2 (B) to VO2 (A) nanobelts: First hydrothermal transformation, spectroscopic study and first principles calculation. Phys. Chem. Chem. Phys. 2011, 13, 15873–15881. [Google Scholar] [CrossRef] [PubMed]
- Rao Popuri, S.; Artemenko, A.; Labrugere, C.; Miclau, M.; Villesuzanne, A.; Pollet, M. VO2 (A): Reinvestigation of crystal structure, phase transition and crystal growth mechanisms. J. Solid State Chem. 2014, 213, 79–86. [Google Scholar] [CrossRef]
- Arcangeletti, E.; Baldassarre, L.; Di Castro, D.; Lupi, S.; Malavasi, L.; Marini, C.; Perucchi, A.; Postorino, P. Evidence of a Pressure-Induced Metallization Process in Monoclinic VO2. Phys. Rev. Lett. 2007, 98, 196406. [Google Scholar] [CrossRef]
- Zhang, H.; Li, Q.; Cheng, B.; Guan, Z.; Liu, R.; Liu, B.; Liu, Z.; Li, X.; Cui, T.; Liu, B. The pressure-induced metallization of monoclinic vanadium dioxide. RSC Adv. 2016, 6, 104949–104954. [Google Scholar] [CrossRef]
- Cheng, B.; Li, Q.; Zhang, H.; Liu, R.; Liu, B.; Yao, Z.; Cui, T.; Liu, J.; Liu, Z.; Sundqvist, B.; et al. Pressure-induced metallization and amorphization inVO2(A)nanorods. Phys. Rev. B 2016, 93, 184109. [Google Scholar] [CrossRef]
- Wang, Y.; Zhu, J.; Yang, W.; Wen, T.; Pravica, M.; Liu, Z.; Hou, M.; Fei, Y.; Kang, L.; Lin, Z.; et al. Reversible switching between pressure-induced amorphization and thermal-driven recrystallization in VO2(B) nanosheets. Nat. Commun. 2016, 7, 12214. [Google Scholar] [CrossRef]
- Prescher, C.; Prakapenka, V.B. DIOPTAS: A program for reduction of two-dimensional X-ray diffraction data and data exploration. High Press. Res. 2015, 35, 223–230. [Google Scholar] [CrossRef]
- Toby, B. EXPGUI, a graphical user interface for GSAS. J. Appl. Crystallogr. 2001, 34, 210–213. [Google Scholar] [CrossRef]
- Mao, H.K.; Xu, J.; Bell, P.M. Calibration of the ruby pressure gauge to 800 kbar under quasi-hydrostatic conditions. J. Geophys. Res. Solid Earth 1986, 91, 4673–4676. [Google Scholar] [CrossRef]
- Oka, Y.; Yao, T.; Yamamoto, N. Structural phase transition of VO2(B) to VO2(A). J. Mater. Chem. 1991, 1, 815–818. [Google Scholar] [CrossRef]
- Huang, C.; Chen, L.; Xu, G.; Miao, L. Sol–gel template synthesis and characterization of VO2 nanotube arrays. J. Sol-Gel Sci. Technol. 2012, 63, 103–107. [Google Scholar] [CrossRef]
- Wang, X.J.; Li, H.D.; Fei, Y.J.; Wang, X.; Xiong, Y.Y.; Nie, Y.X.; Feng, K.A. XRD and Raman study of vanadium oxide thin films deposited on fused silica substrates by RF magnetron sputtering. Appl. Surf. Sci. 2001, 177, 8–14. [Google Scholar] [CrossRef]
- Shuchao Zhang, Z.Z.; Lv, T.; Li, S.; Zhang, Y. Excellent Cyclic Stability of Pre-lithiated VO2(B) Nanorods as a Cathode Material for Lithium Ion Batteries. Int. J. Electrochem. Sci. 2020, 15, 7203–7213. [Google Scholar] [CrossRef]
- Chen, X.; Wang, X.; Wang, Z.; Wan, J.; Liu, J.; Qian, Y. An ethylene glycol reduction approach to metastable VO2 nanowire arrays. Nanotechnology 2004, 15, 1685–1687. [Google Scholar] [CrossRef]
- Rahman, M.M.; Wang, J.-Z.; Idris, N.H.; Chen, Z.; Liu, H. Enhanced lithium storage in a VO2(B)-multiwall carbon nanotube microsheet composite prepared via an in situ hydrothermal process. Electrochim. Acta 2010, 56, 693–699. [Google Scholar] [CrossRef]
- Subba Reddy, C.V.; Walker, E.H.; Wicker, S.A.; Williams, Q.L.; Kalluru, R.R. Synthesis of VO2 (B) nanorods for Li battery application. Curr. Appl. Phys. 2009, 9, 1195–1198. [Google Scholar] [CrossRef]
- Santillán, J.; Shim, S.-H.; Shen, G.; Prakapenka, V.B. High-pressure phase transition in Mn2O3: Application for the crystal structure and preferred orientation of the CaIrO3 type. J. Mater. Chem. 2006, 33, 815–818. [Google Scholar] [CrossRef]
- Hsieh, W.-P.; Trigo, M.; Reis, D.A.; Artioli, G.A.; Malavasi, L.; Mao, W.L. Evidence for photo-induced monoclinic metallic VO2 under high pressure. Appl. Phys. Lett. 2014, 104, 21917. [Google Scholar] [CrossRef]
- Klotz, S.; Chervin, J.C.; Munsch, P.; Le Marchand, G. Hydrostatic limits of 11 pressure transmitting media. J. Phys. D Appl. Phys. 2009, 42, 75413. [Google Scholar] [CrossRef]
- Shu-Jie, Y.; Liang-Chen, C.; Chang-Qing, J. Hydrostaticity of Pressure Media in Diamond Anvil Cells. Chin. Phys. Lett. 2009, 26, 96202. [Google Scholar] [CrossRef]
- Lu, X.; Hu, Q.; Yang, W.; Bai, L.; Sheng, H.; Wang, L.; Huang, F.; Wen, J.; Miller, D.J.; Zhao, Y. Pressure-induced amorphization in single-crystal Ta2O5 nanowires: A kinetic mechanism and improved electrical conductivity. J. Am. Chem. Soc. 2013, 135, 13947–13953. [Google Scholar] [CrossRef] [PubMed]
Publisher’s Note: MDPI stays neutral with regard to jurisdictional claims in published maps and institutional affiliations. |
© 2022 by the authors. Licensee MDPI, Basel, Switzerland. This article is an open access article distributed under the terms and conditions of the Creative Commons Attribution (CC BY) license (https://creativecommons.org/licenses/by/4.0/).

