Article

Effect of the Precursor on the Synthesis of ZnO and Its Photocatalytic Activity

by
Isaias Limón-Rocha
1,
C. A. Guzmán-González
2,
Luis M. Anaya-Esparza
3,
R. Romero-Toledo
1,
J. L. Rico
4,
O. A. González-Vargas
5 and
A. Pérez-Larios
1,*
1
Engineering Department, University of Guadalajara Campus Altos, No. 1200, Av. Rafael Casillas Aceves, Tepatitlán 47600, Mexico
2
Department of Applied Basic Sciences, University of Guadalajara Campus Tonalá, No. 555, Av. Nuevo Periférico, Tonalá 45425, Mexico
3
Department of Livestock and Agricultural Sciences, University Center of Los Altos, University of Guadalajara, No. 1200, Av. Rafael Casillas Aceves, Tepatitlán de Morelos 47600, Mexico
4
Faculty of Chemical Engineering, Michoacan University of San Nicolas de Hidalgo, S/N Felícitas del Río, Morelia 58060, Mexico
5
Departamento de Ingeniería en Control y Automatización, Escuela Superior de Ingeniería Mecánica y Eléctrica-Zacatenco, Instituto Politécnico Nacional, UPALM, Av. Politécnico S/N, Col. Zacatenco, Alcaldía Gustavo A. Madero, Ciudad de México 07738, Mexico
*
Author to whom correspondence should be addressed.
Inorganics 2022, 10(2), 16; https://doi.org/10.3390/inorganics10020016
Submission received: 11 December 2021 / Revised: 26 January 2022 / Accepted: 28 January 2022 / Published: 3 February 2022
(This article belongs to the Section Organometallic Chemistry)

Abstract

:
Zinc nitrate (ZnON) and zinc acetate (ZnOA) were used as precursors for the synthesis of zinc oxide (ZnO) nanoparticles by the sol–gel method. The ZnO powder was characterized by scanning electron microscopy (SEM), transmission electron microscopy (TEM), UV–vis diffuse reflectance spectroscopy, X-ray diffraction (UV–Vis DRS), Fourier transform infrared spectroscopy (FTIR), physisorption of nitrogen, and X-ray photoelectron spectroscopy (XPS). On the other hand, the photocatalytic activity of the samples was tested in the degradation of 2,4-Dichlorophenoxyacetic acid (2,4-D) and 2,4-Dichlorophenol (2,4-DCP) under UV-light irradiation. The ZnON and ZnOA showed polycrystalline irregular structures and rod-like morphology with mean sizes of 40 and 99 nm, respectively. The precursor type influenced the bandgap, crystallite size, surface area, total pore volume, and pore diameter. The XPS results showed high contents of C and N in the ZnO samples, and as a consequence, the solids present remarkable differences in the C/N, O/C, and O/Zn atomic ratios, which significantly influenced the physicochemical characteristics. The ZnON and ZnOA exhibit photocatalytic properties against 2,4-D (74.7 and 90.9%, respectively) and 2,4-DCP (78.4 and 86.7%, respectively) and better performance of ZnOA. These results are promising and indicate the potential to use this material as a photocatalyst to degrade organic pesticides.

1. Introduction

The phenolic compounds are hazardous and highly stable contaminants. Chlorophenols belong to a group of organic compounds containing a benzene ring, –OH group, and chlorine atoms. Within this group, 2,4-DCP and 2,4D stand out as compounds used in different fields [1,2]. The 2,4-DCP and 2,4-D are pesticides widely used in the agro-industry to deal with certain pests which are a threat to agriculture. Although the Federal Drugs Administration (FDA) and World Health Organization (WHO) have banned these products in Mexico, they are still used [3,4,5]. When the concentration of 2,4 D and 2,4-DCP is significant, these compounds can reach the aquifers and lead to intestinal diseases, and their accumulation in humans can cause carcinogenesis after water consumption [6]; the presence of these compounds in water has been reported [7,8]. Furthermore, the Advance Oxidation Process (AOP) is a technological option for water treatment, in which photocatalysts play an important role [9]. Semiconductors have also been extensively explored as photocatalysts [10].
ZnO is a semiconductor with a bandgap of 3.37 eV, which is non-toxic, inexpensive, chemically stable, and biocompatible. It exhibits high sensitivity and luminescent efficiency with a large exciton binding energy for diverse applications [11,12]. Due to its physicochemical, photocatalytic, and antimicrobial properties, ZnO is widely used in many fields [13,14]. Moreover, there are several pathways to synthesize ZnO nanoparticles that include co-precipitation [15], wet-chemical co-precipitation [16], deposition [17], hydrothermal [18], and sol–gel [19]. Among these, the sol–gel method is a simple synthesis procedure with mild reaction conditions that represents a viable, easy, and low-cost alternative method to produce nanoparticles with desirable properties [20,21]. In general, ZnO nanomaterials synthesized by the sol–gel exhibit controlled particle size, morphology, and high homogeneity [22,23]. In this context, following this synthesis route, diverse precursors such as zinc acetate [24,25], zinc nitrate [21], zinc chloride [26], and zinc sulfate [27] have been reported for synthetizing ZnO nanoparticles.
Additionally, it has been reported that ZnO nanoparticles have the potential to generate the hydroxyl radical to photodegrade pesticides as 2,4-DCP and 2,4-D from aqueous media [28]. Ba-Abbad et al. [28] reported that ZnO obtained by sol–gel utilizing zinc acetate as a precursor effectively degraded 2,4-DCP (98% at 50 mg L−1) under UV-light irradiation (2.3 mW/cm2) after 60 min of exposure. Rodriguez-Mata et al. [29] prepared ZnO nanoparticles by urea precipitation method with ZnON and (NH4)2SO4 as a precursor and reported a photocatalytic (20 mW/cm2 at 365 nm) degradation of 82.3% at 3.4 mM L−1 of 2,4-DCP after 360 min of exposure.
The physicochemical properties and morphologic characteristics are parameters that improve the photocatalytic activity of ZnO nanoparticles to degrade pollutants. Moreover, various factors such as the synthesis method, pH of the solution, surfactant, temperature, reaction time, and shape contribute to the crystallinity NPs. The average pore size, change bandgap, and specific surface area influence the structural, optical, and photocatalytic properties of the ZnO catalyst, highlighting the use and concentration of the salt precursor of ZnO [30,31,32]. In the present study, ZnO nanoparticles were synthesized using zinc acetate (ZnOA) and zinc nitrate (ZnON) by the sol–gel method to explore the influence of precursors on the photocatalytic properties against the degradation of 2,4-D and 2,4-DCP under UV irradiation. Furthermore, the ZnO powder was characterized by SEM, TEM, UV–Vis DRS, DRX, FTIR, Physisorption N2, and XPS.

2. Results

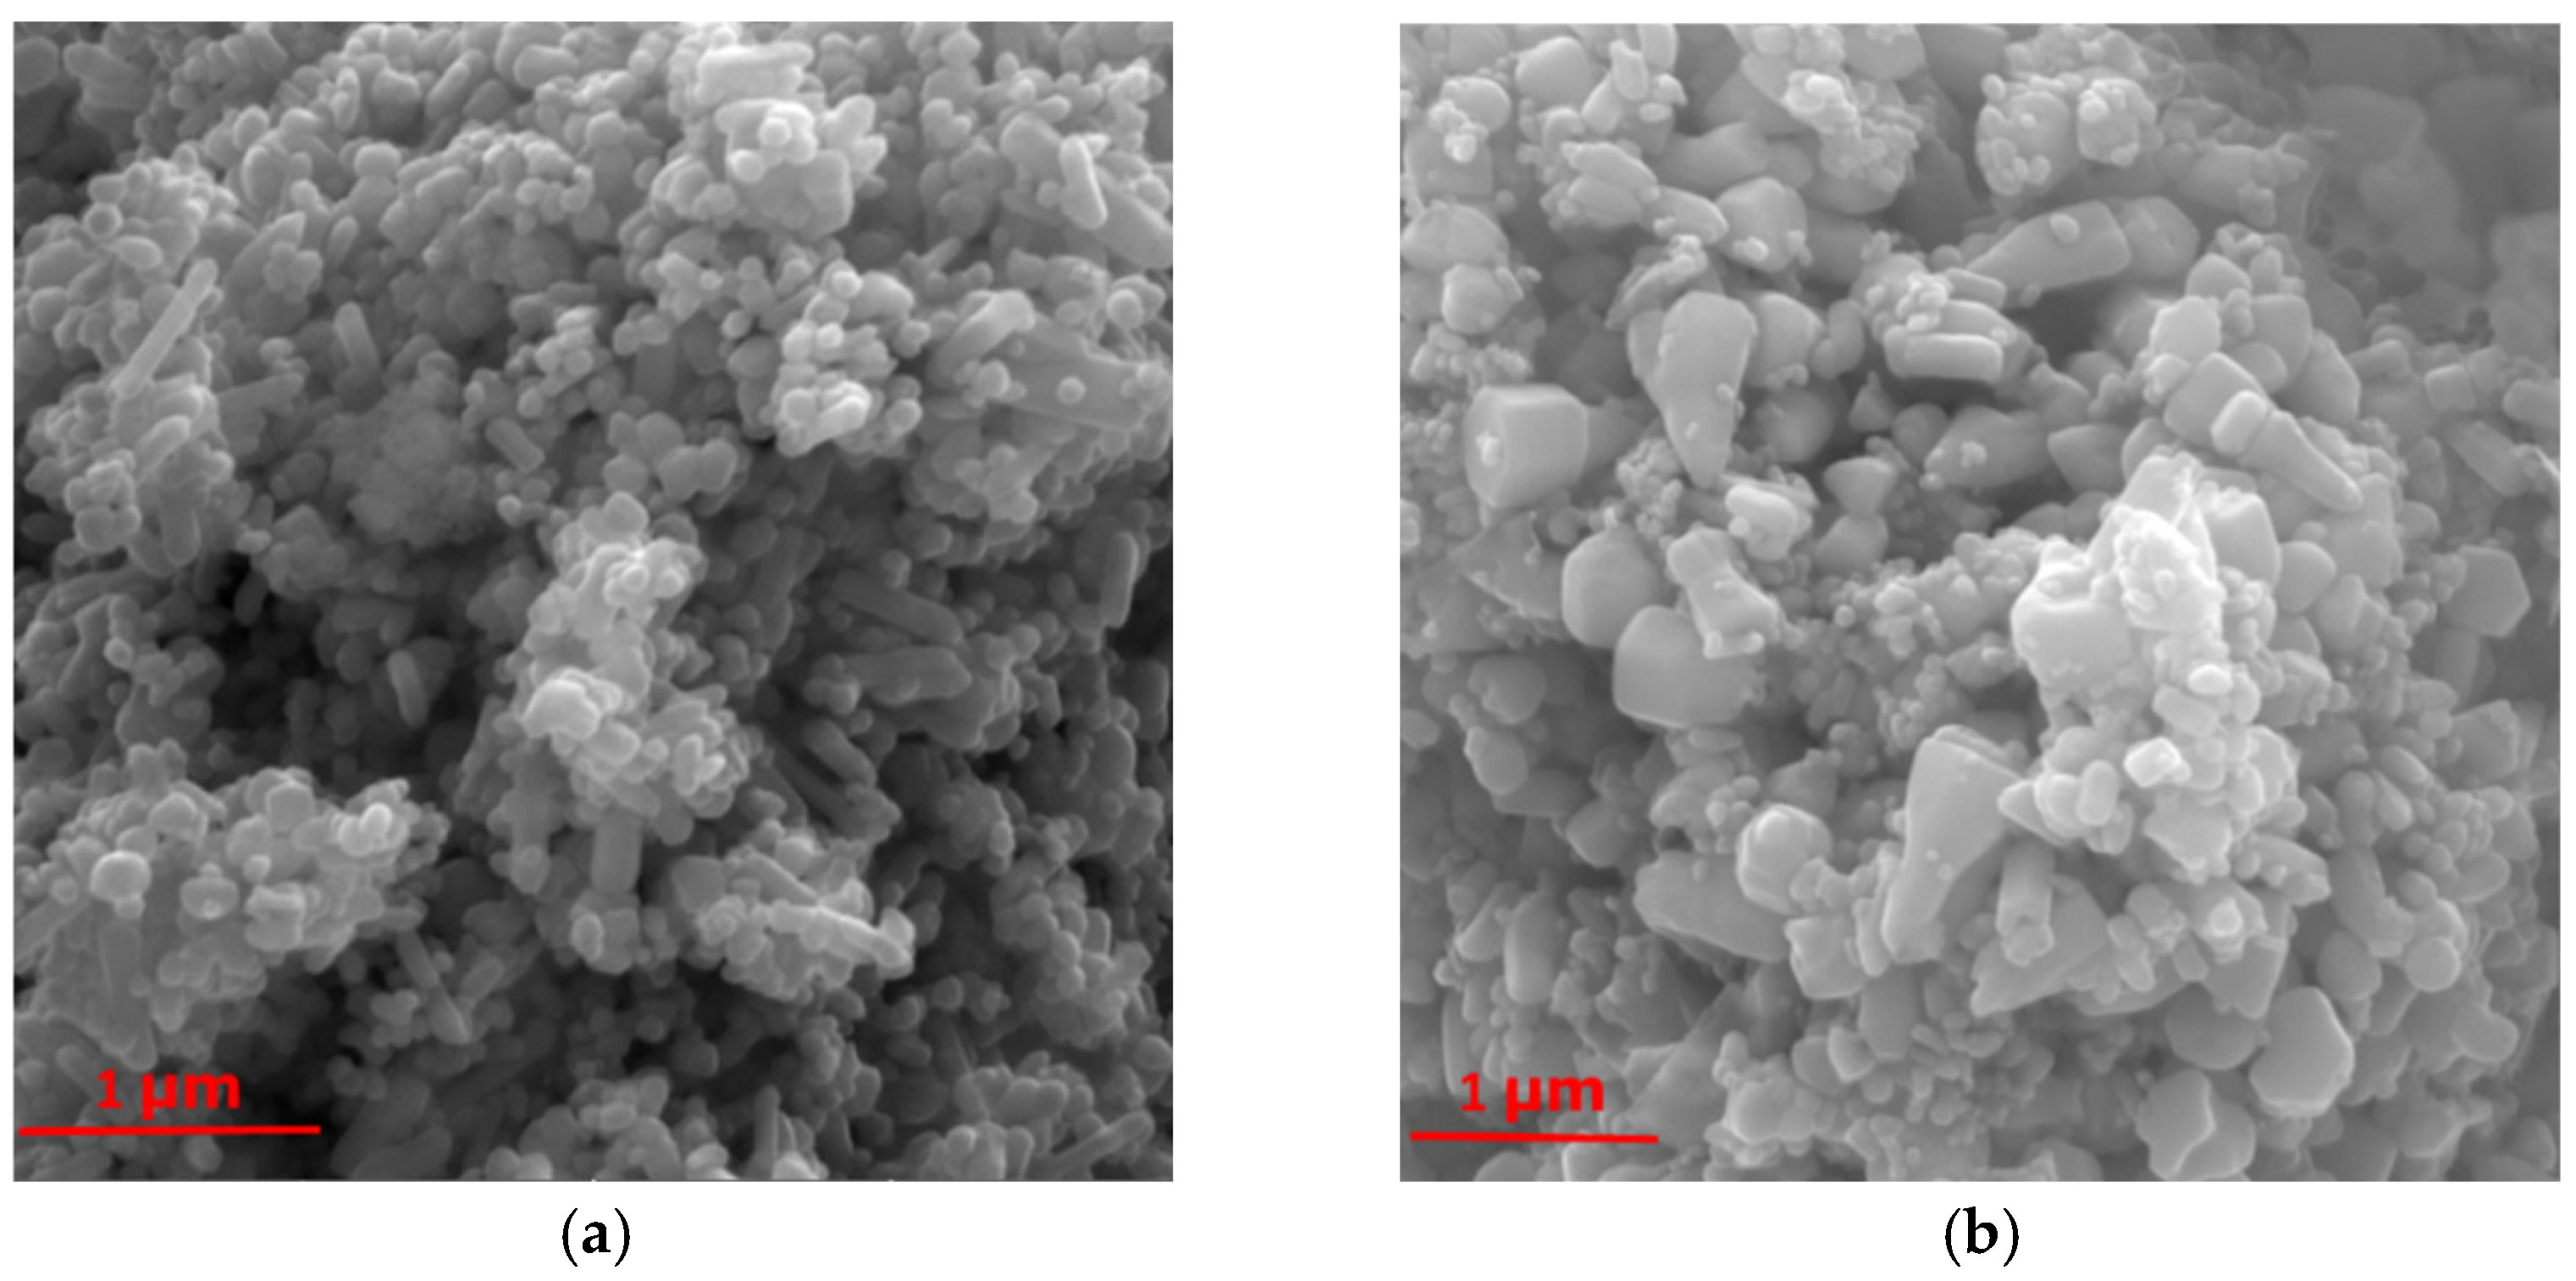
2.1. Scanning Electron Microscopy (SEM) Analysis

The micrographs of ZnO nanoparticles are shown in Figure 1. The ZnON (Figure 1a) showed that nanorods are shaped with agglomerated irregular nanoparticles of diverse size similar to those reported in the literature [33,34]. On the other hand, ZnOA (Figure 1b) exhibited an amorphous rod-like form [35]. The morphology of the nano-ZnO differs significantly depending on the precursor used [36,37]. The addition of NH4OH during the synthesis process could affect the nucleation and growth of the ZnO, thereby influencing the crystal formation and morphological structure, which is associated with a supersaturation that affects the nuclei formation [38].

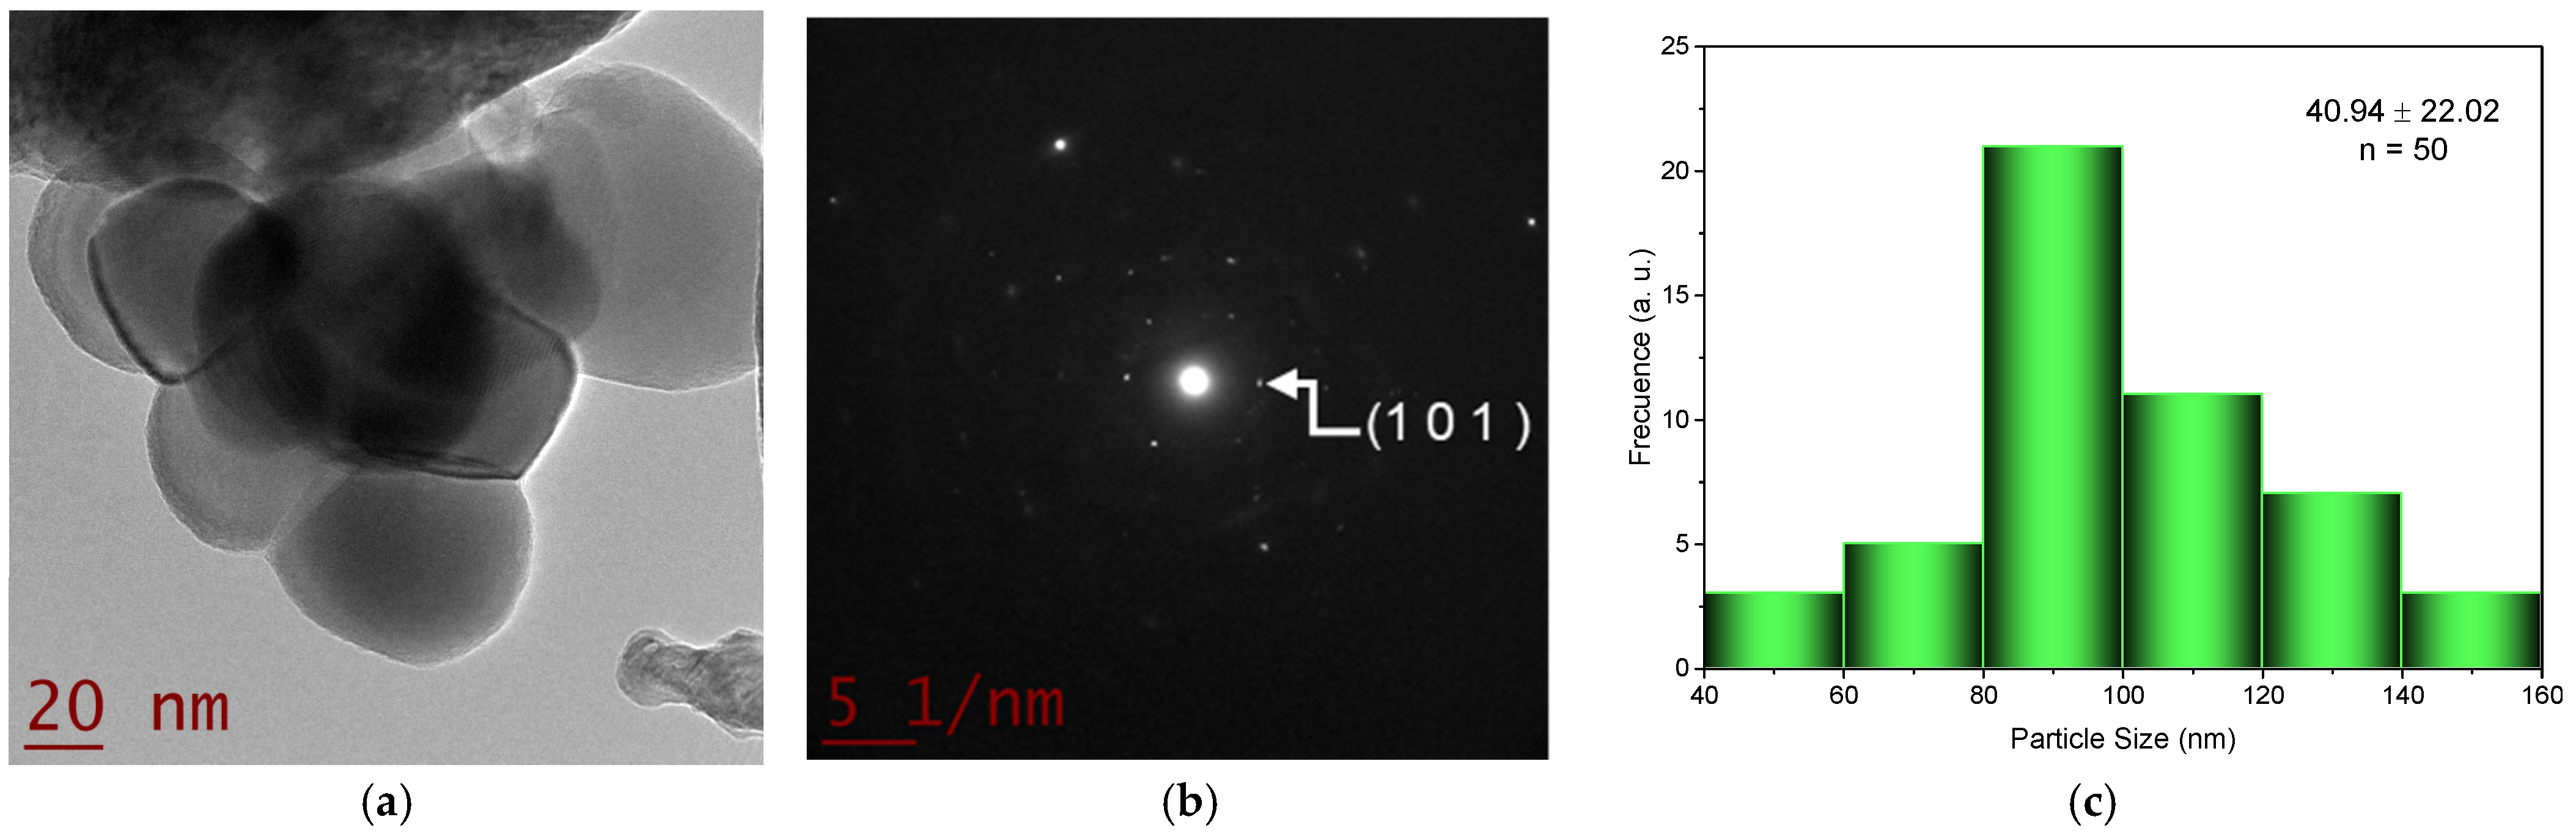
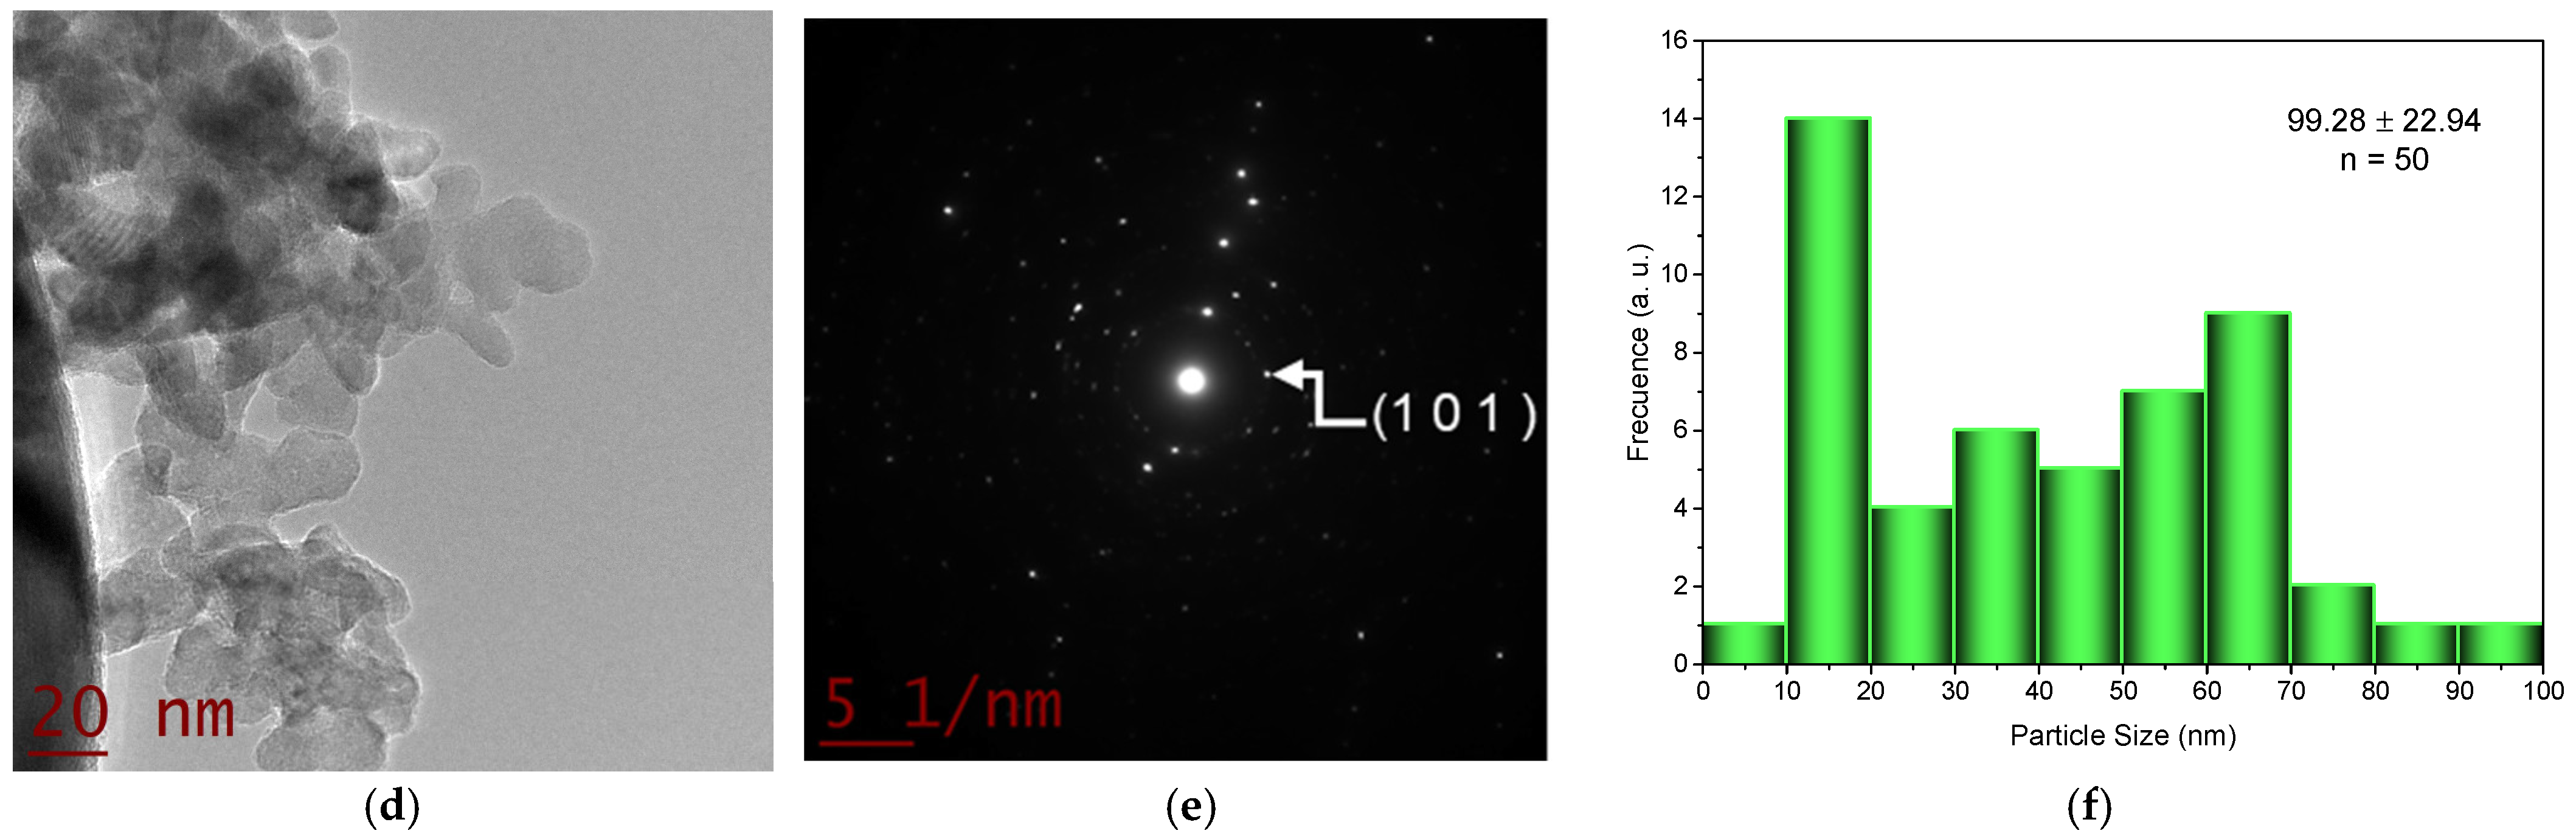
2.2. Transmision Electron Microscopy (TEM) Studies

The morphology (TEM), the selected area electron diffraction (SAED) studies, and the mean size particles of ZnON and ZnOA are shown in Figure 2. The corresponding TEM (Figure 2a,d) image shows that materials exhibited a near-spherical shape for ZnON (Figure 2a), whereas ZnOA showed an elongated rod-like morphology (Figure 2d) with mean particle sizes of 99.28 and 40.94 nm (Figure 2c,f), respectively. Comparable shapes and sizes were previously reported when ZnO nanoparticles were synthesized using zinc nitrate (random spherical with an average particle size of 50 nm) [39] and zinc acetate (hexagonal geometric form with a size between 25 and 50 nm) [40] as precursors. Additionally, the SAED imagens obtained for ZnON and ZnOA (Figure 2b,e) showed ring patterns (intensity and brightness) indicating polycrystalline nanomaterials [25,41]. It has been reported that the crystallinity of ZnO nanoparticles depends on chemical precursors, synthesis method and conditions (pH, solvent, and temperature), and annealing conditions [42].

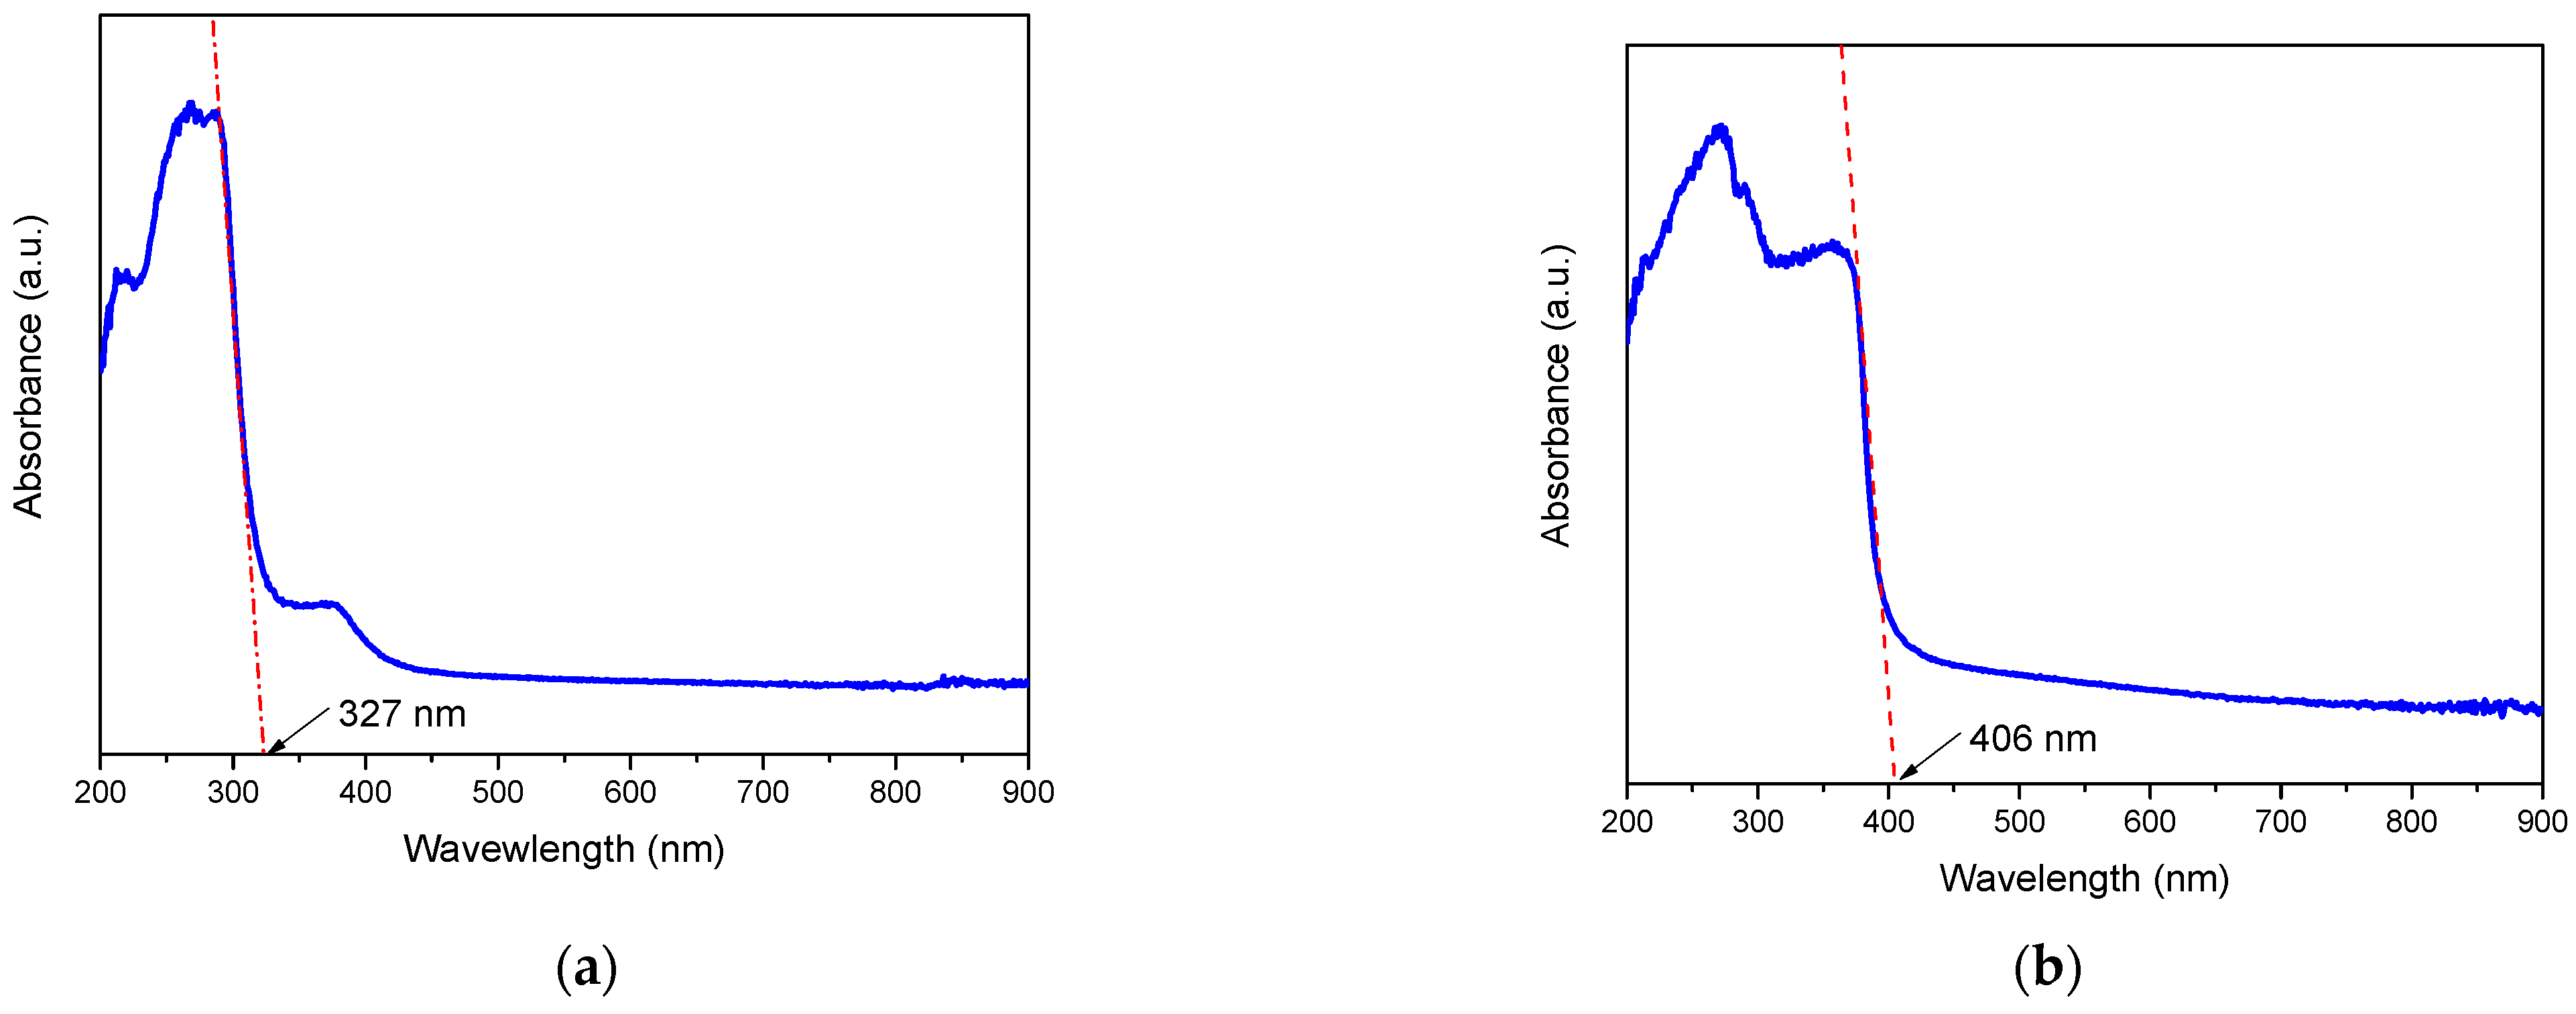
2.3. UV–VIS by Diffuse Reflectance Spectroscopy

Figure 3 shows the UV–Vis spectra obtained for the ZnON and ZnOA nanoparticles. The powders exhibited a strong absorption wavelength of around 327 nm for ZnON and 406 nm for ZnOA, which is typical of ZnO materials [13]. According to Bathia and Verma [43], the UV-absorption peak of nano-ZnO may be shifted due to the difference in crystal size, influenced by the precursor and synthesis method. The band-gap energies of the ZnON and ZnOA nanoparticles were calculated by applying Plank’s equation [44], which showed significant differences in the band-gap values, 3.79 eV for ZnON and 3.05 eV for ZnOA [13,45]. Similar trends have been reported in ZnO nanopowders synthesized by the sol–gel method using zinc nitrate (3.37 eV) [21] and zinc acetate (2.93 eV) as precursors [24]. According to Zeng et al. [46], various defect states are present in ZnO (donor defects such as Zni••, Zni, Znix, Vo••, Vo, and Vo, and acceptor defects such as Zn’’ and Zn’), with the Zn interstitials and oxygen vacancies being the predominant ionic defect types influencing the excitation level of ZnO. Additionally, diverse authors argue that factors such as the shape of the nanoparticles, precursors, calcination temperature, and induced defects (degree of open lattice structure) influenced the band-gap values of ZnO nanoparticles [24,40,43].

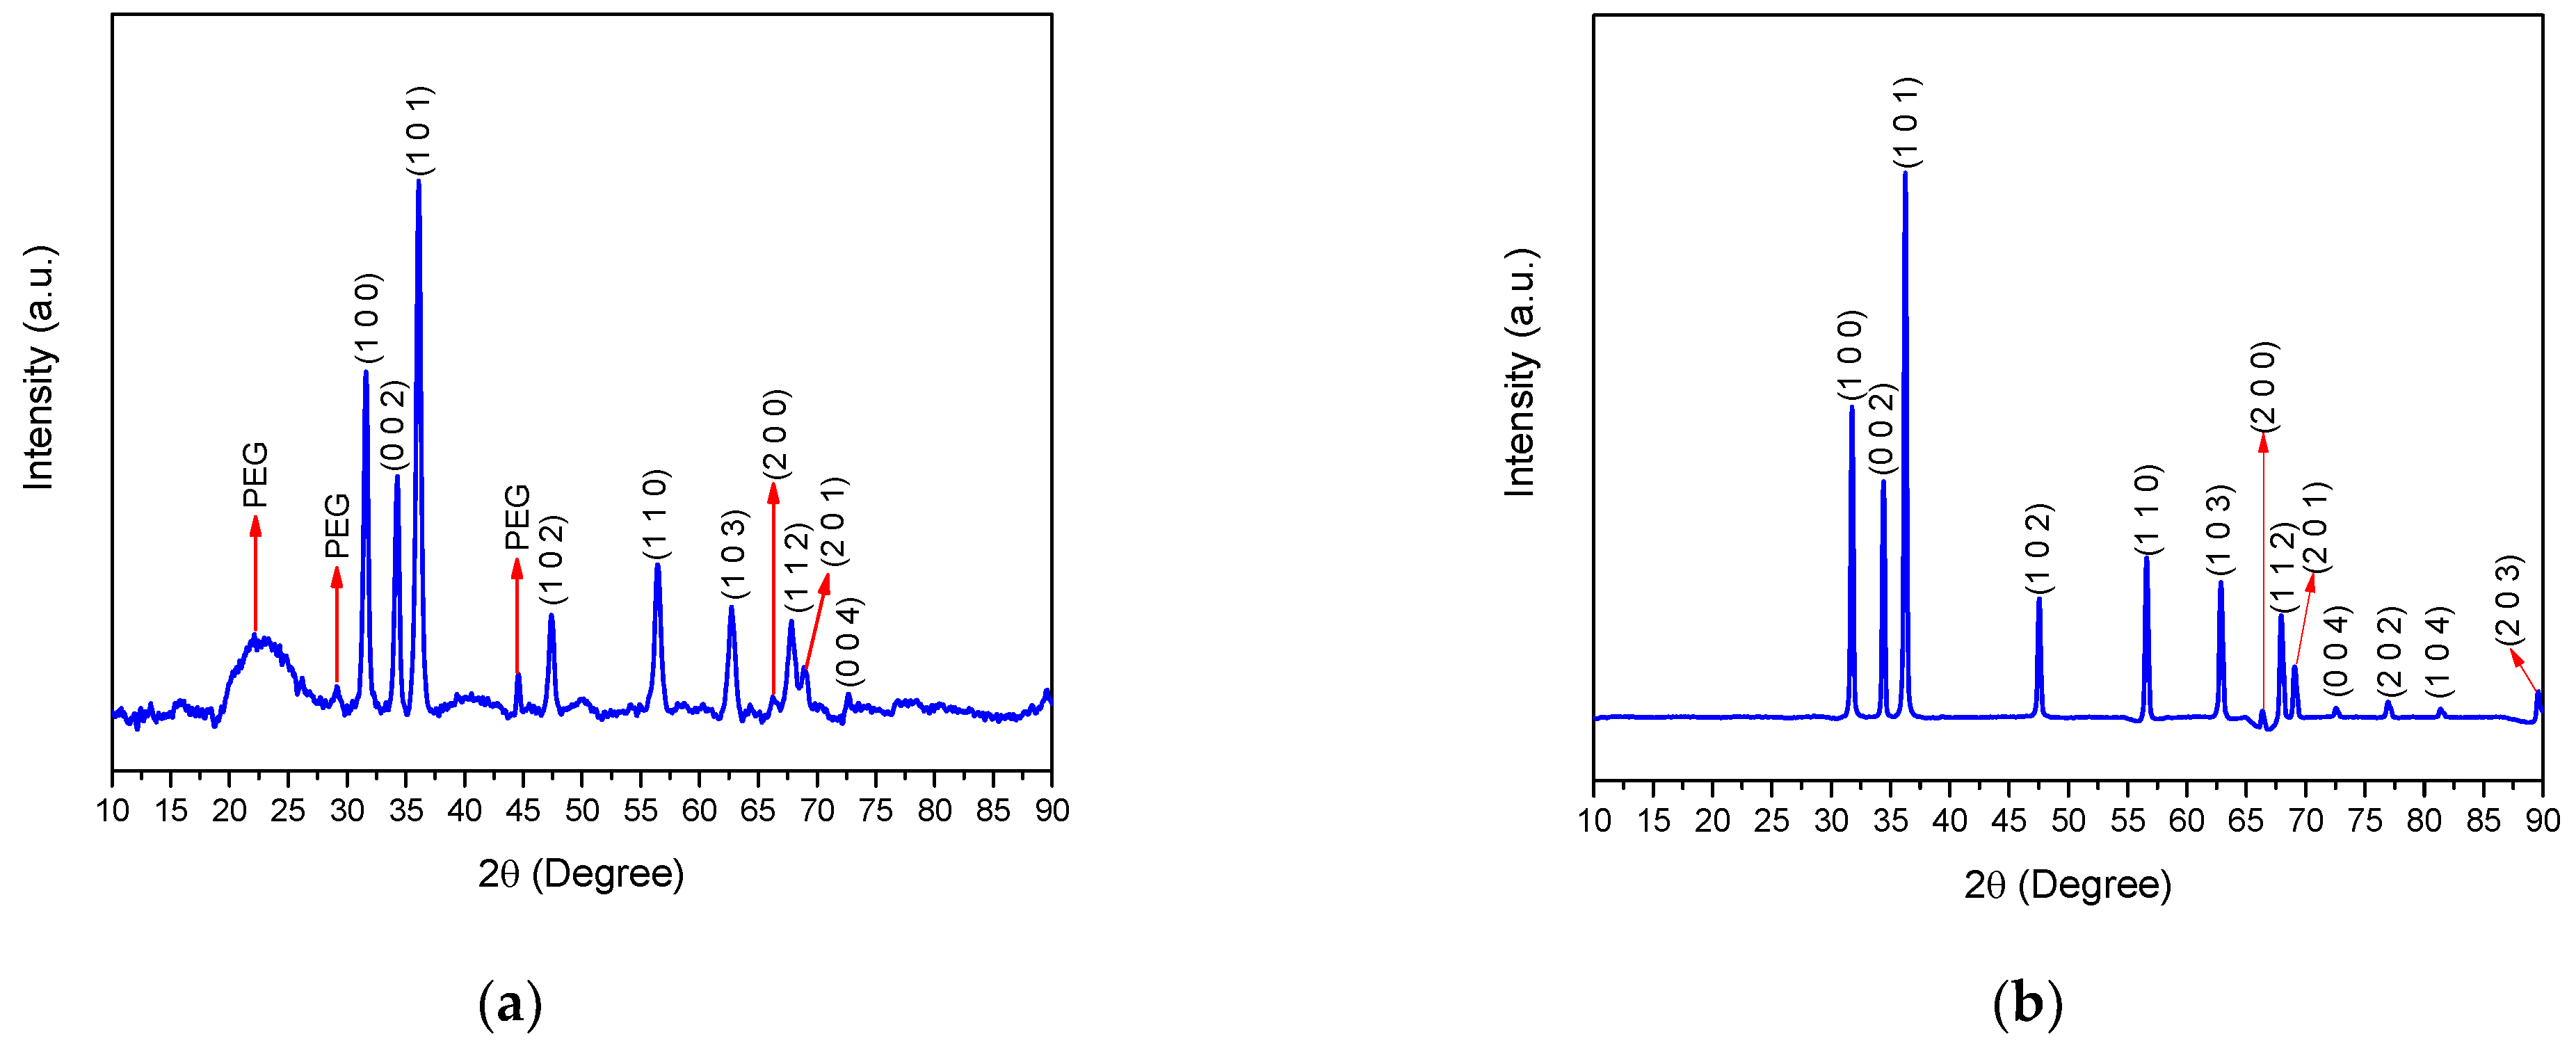
2.4. X-ray Diffraction
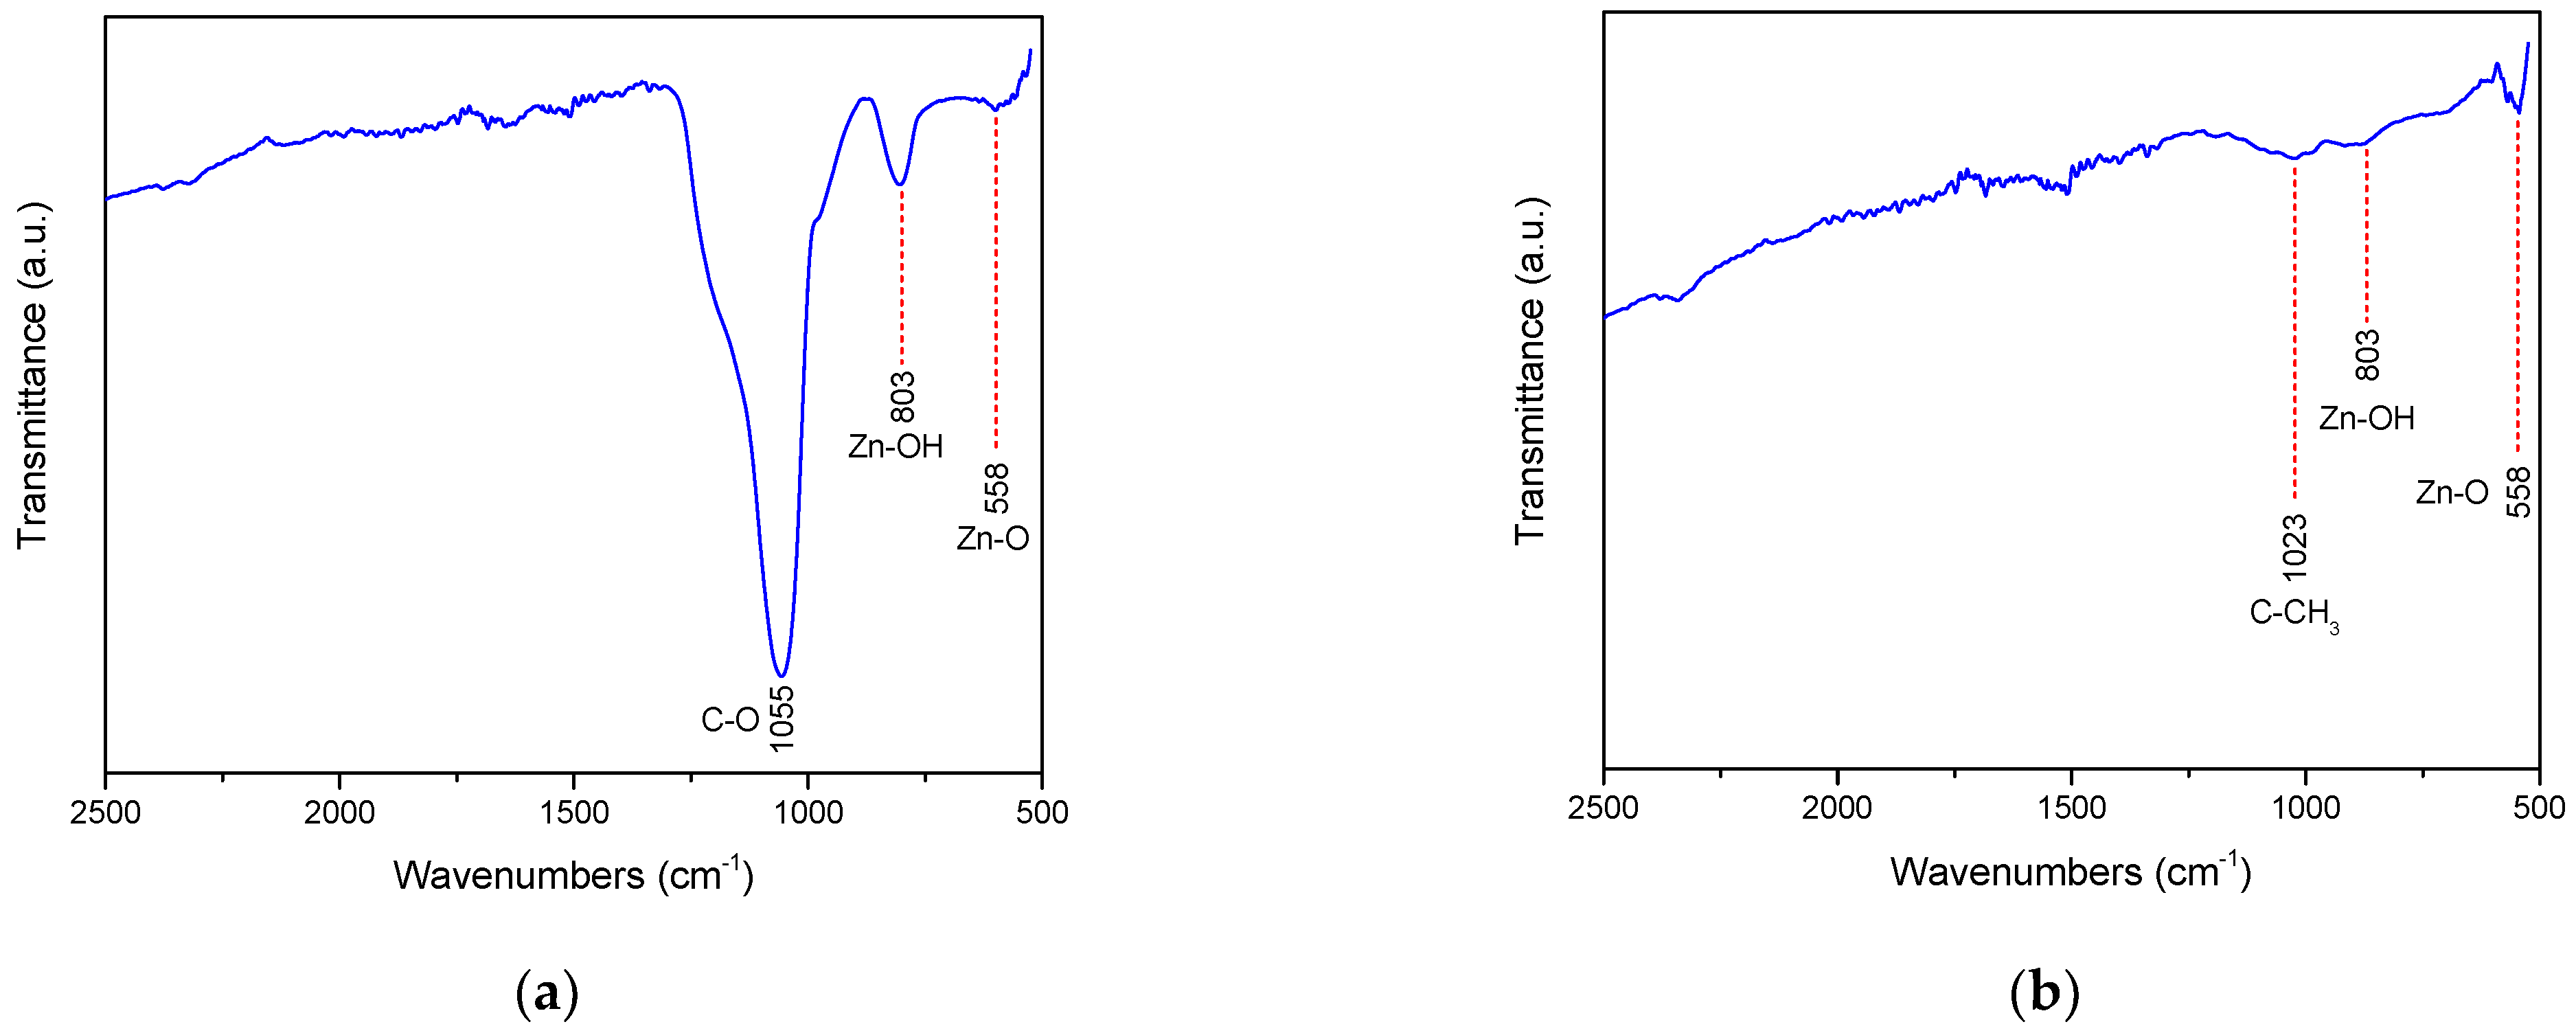
The diffractograms (Figure 4) of the ZnON and ZnOA powder show the wurtzite hexagonal phase of ZnO, corresponding to diffraction signals at 2θ = 31.52°, 34.16°, 36.02°, 47.5°, 56.42°, 62.71°, 66.12°, 67.83°, 68.84°, and 72.65°, with a respective Miller index of (100), (002), (101), (102), (110), (103), (200), (112), (201), (004), and (202) planes (JCPDS No. 89–1397), in agreement with previous works [14,47,48]. On the other hand, the ZnON showed reflection signals around 22.13°, 29.04°, and 44.6° (2θ), which are representative of Zn(OH)2 [49,50,51]. Similar peaks were observed in the diffractograms for PEG at 2θ = 26.19°, 29.16°, and 44.57°, which is consistent with previous reports [52,53]. Some authors have suggested than an incomplete transformation of the precursor to ZnO during synthesis can occur [54,55,56]. Table 1 summarizes the interplanar d-spacing and crystallite size of ZnON and ZnOA. The type of precursor influenced the crystallite size of ZnO: 17.2 nm for ZnON and 31.3 nm for ZnOA with an interplanar d-spacing of 0.2480 and 0.2472 nm, respectively. Al-Dhahir et al. [57] synthesized ZnO nanoparticles using C4H6O4Zn*2H2O with an average crystallite size of 31.5 nm. Likewise, Mesaros et al. [58] reported a crystallite size and interplanar d-spacing of 0.28 nm and 0.32 nm, respectively, in ZnO synthesized through the wet chemical method using zinc acetate as the precursor. Nonetheless, it has been reported that the crystallite size of ZnO prepared by the sol–gel method using zinc acetate ranged from 11.84 to 24.82 nm in a pH-dependent response [59].

2.5. FT-IR Results

The FTIR spectrum of ZnON and ZnOA after calcination were recorded in the range of 4000 to 400 cm−1 (Figure 5). In general, ZnON and ZnOA exhibited similar absorption regions, in agreement with previous reports [21,60]. Bands at 547 and 558 cm−1 were observed, and the vibrations in these regions are assigned to the Zn-O bond [21]. Signals at 803 and 1055 cm−1 are due to the C=O, C-C, and Zn-OH stretching modes [60,61,62,63]. However, ZnOA showed a noticeable decrease in transmittance at 1055 cm−1 in comparison with ZnON, which could be attributed to the stretching vibration of the residual C-O group present in the salt precursor [64], whereas the peaks around 1023 cm−1 depict the stretching vibration of the C-CH3 bond, associated with the ZnOA precursor [65,66,67].

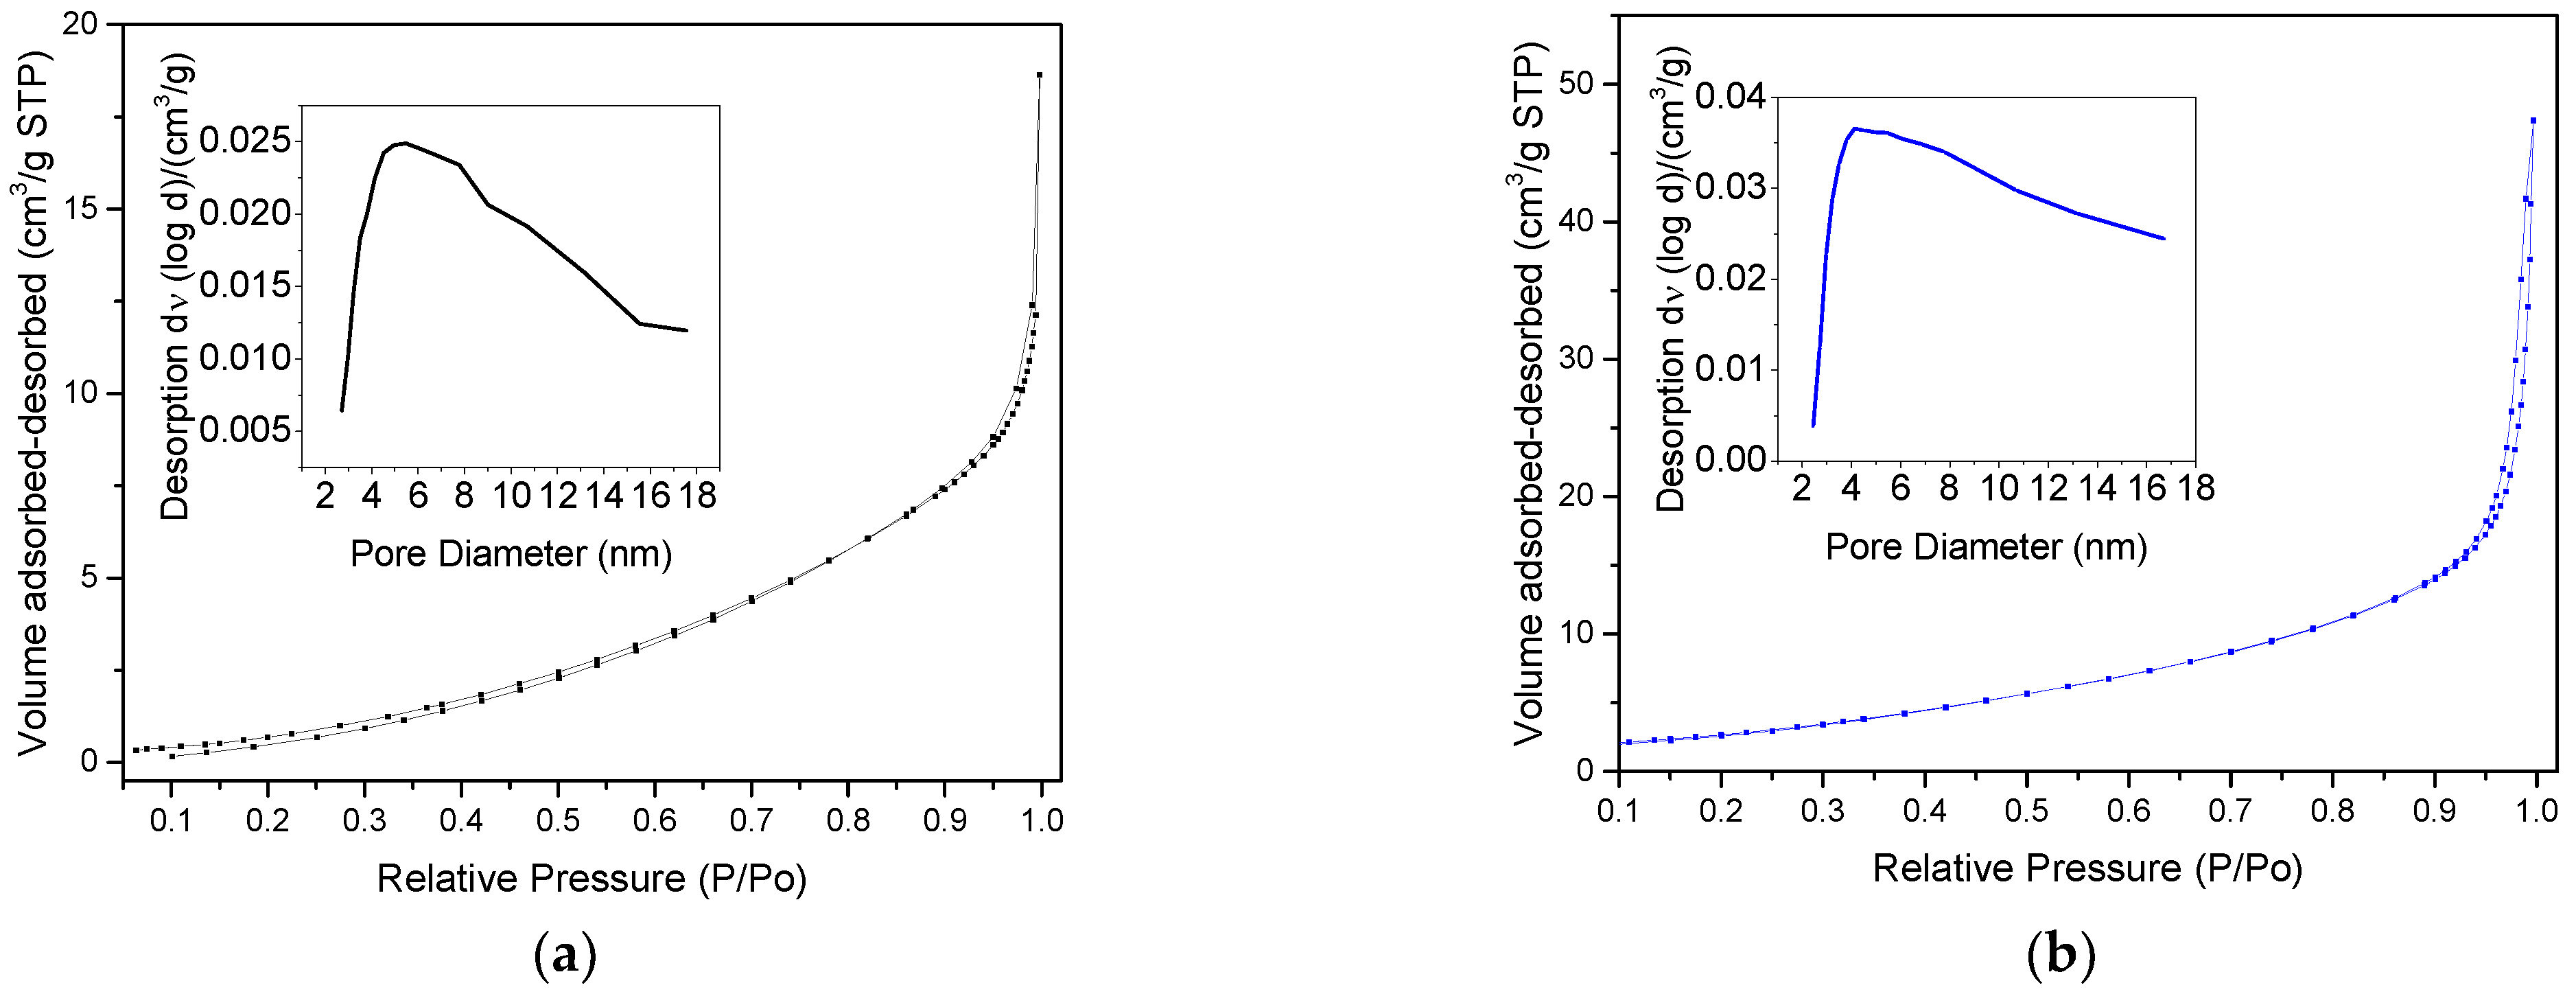
2.6. Nitrogen Physisorption Analysis

The N2 physisorption analysis was used to investigate the textural properties (BET surface area (SBET), total pore volume, and average pore size) of the ZnO nanoparticles (Table 1). Figure 6 shows the isotherms of ZnON and ZnOA of type IV which are characteristic of microporous materials. The samples present H3-type hysteresis behaviour associated with interconnected micropores with non-uniform sizes or shapes [68].
ZnON and ZnOA showed SBET of 0.85 and 2.24 m2 g−1, respectively, which are in the range of those reported by Wang et al. [69]. Hamrouni et al. [70] synthesized ZnO nanoparticles (using C4H6O4Zn ∗ 2H2O as a precursor) with a BET surface area of 4.2 m2 g−1. It has been reported that the SBET of ZnO could be influenced by the type of precursor [71]. Wang et al. [71] reported a SBET of 91, 81, 79, and 68 m2 g−1 for ZnO nanoparticles prepared using zinc sulfate, zinc nitrate, zinc acetate, and zinc chloride, respectively. Moreover, both ZnON and ZnOA nanoparticles exhibited differences in the total pore volume (ZnON of 0.01 cm3 g−1 and ZnOA of 0.02 cm3 g−1) with average pore diameters of 54.82 and 39.10 nm, respectively. Similar trends have been reported in the ZnO synthesized using different precursors (pore volume from 0.38 to 0.57 cm3 g−1 and average pore size from 19.1 to 33.5 cm3 g−1). According to Veriansyah et al. [42], differences in pore volume and pore diameter between samples could be associated with some superficial agglomerations, blocking the pores on the particle internal surface.

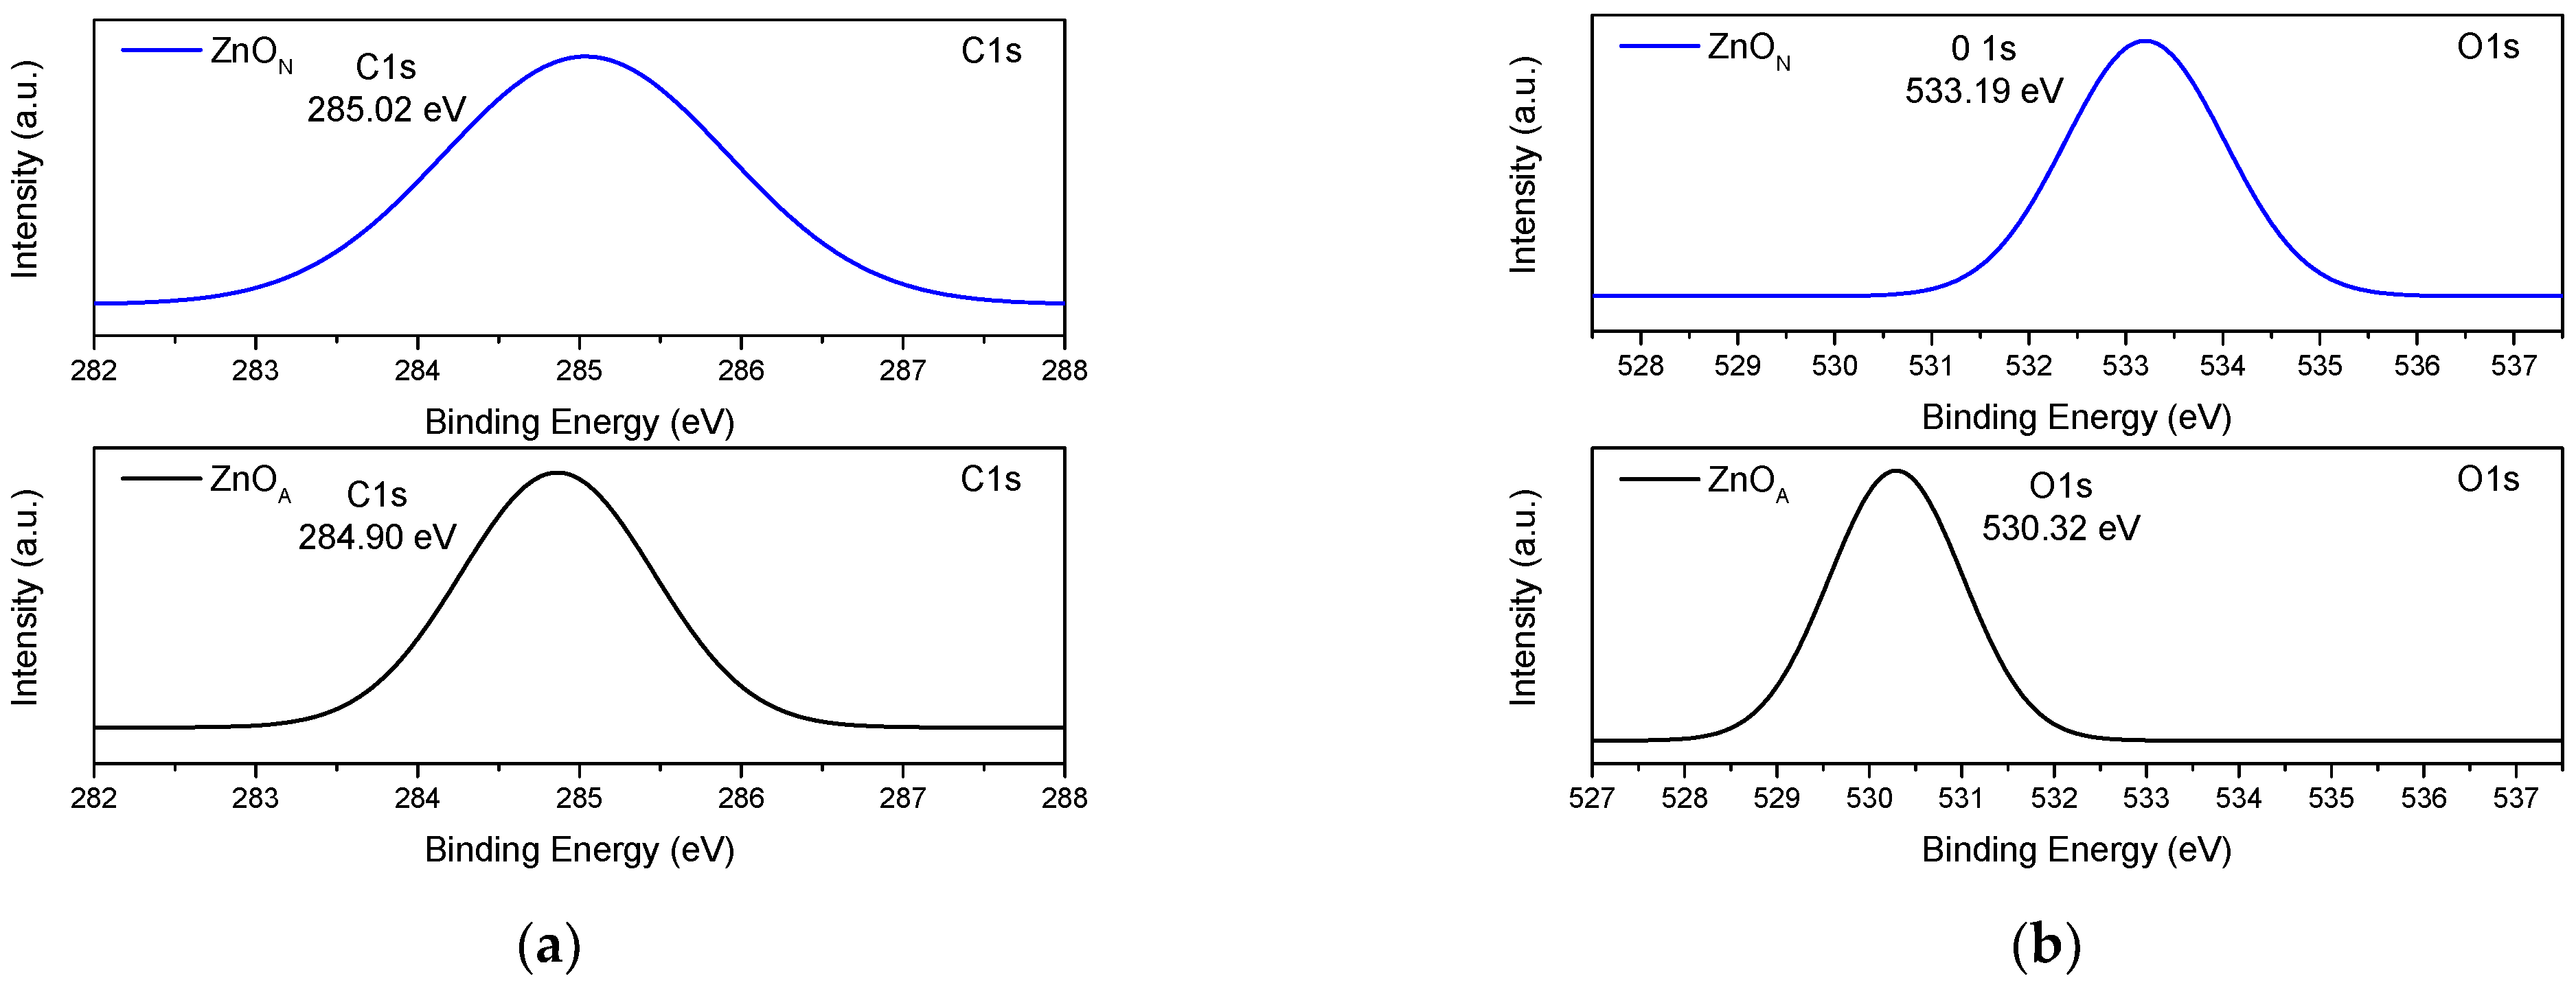
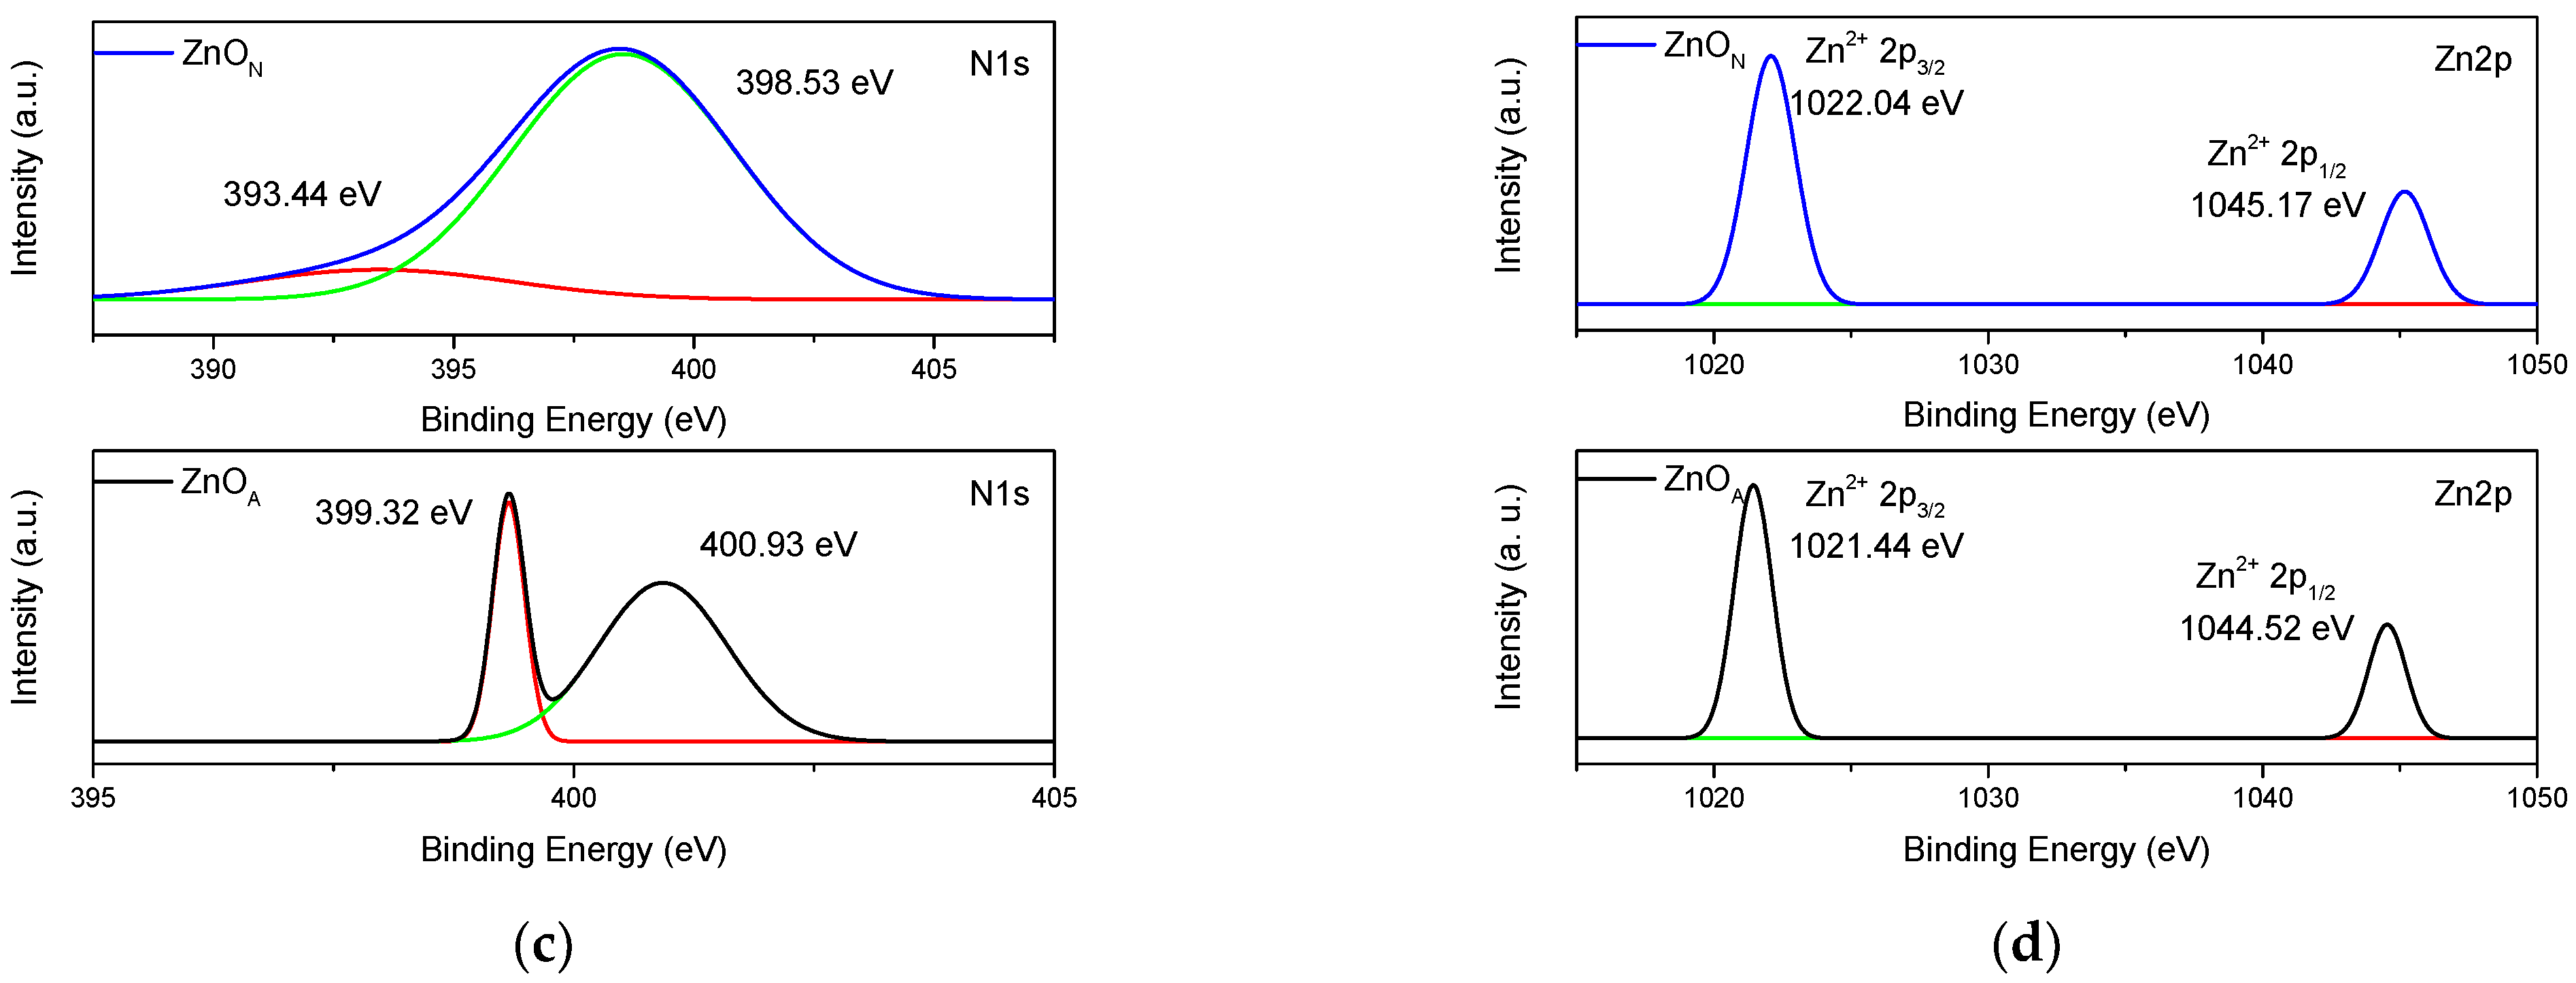
2.7. XPS Spectroscopy

Figure 7 exhibits the XPS spectra of ZnON and ZnOA samples and shows the corresponding signals for carbon (C1s), oxygen (O1s), nitrogen (N1s), and zinc (Zn2p). According to the nature of the precursor, it is expected that some N and C atoms would remain solid after calcination. The two peaks characteristic of Zn2p3/2 and Zn2p1/2 [72,73,74,75] are shown in Figure 7d, for ZnON and ZnOA, respectively. These two signals are observed at 1022.04 and 1045.17 eV for the ZnON sample, whereas those for ZnOA are located at 1021.44 and 1044.52 eV [76]. The Zn2p signals for ZnON are shifted to higher binding energies than those measured for ZnOA. Moreover, the peaks assigned to C1s are displayed in Figure 7a; that for ZnON is located at 285.02 eV, and that for ZnOA is placed at 284.9 eV. The difference indicates a shift to higher binding energies when ZnON is used as a precursor [77]. For the signal corresponding to O1s (Figure 7b), the peaks are located at 533.19 and 530.32 eV for ZnON and ZnOA, respectively, and belong to O 2 of the wurtzite crystal structure [78]. The difference demonstrates a move to higher binding energies when using ZnON [72]. From the XPS results, it is clearly observed that a shift to higher binding energies resulted when using Zn(NO3)2 ∗ 6H2O compared to C4H6O4Zn ∗ 2H2O, and this is probably due to the difference in C and N concentrations in both ZnO samples, as discussed below. Moreover, the signal intensity of the C1s is stronger for ZnOA than that observed for ZnON, indicating the presence of carbon on the surface. The nitrogen signals indicated that nitrogen is present in both samples in different arrangements (Figure 7c). Shimizu et al. [79] noted that the nitrogen signals detected in the XPS study were related to the speciation of ammonium at the hematite/water interface. The authors also assigned the N1s peaks at 401.7 for NH 4 + and at 400.1 eV for NH3. In our study, the deconvoluted peaks were located at 393.8, 397.4, 399.2, and 401 eV for both samples and associated with the presence of the NH3 group from the ammonium hydroxide (NH4OH) solution used for the adjustment of pH during the synthesis procedure. The atomic surface composition determined by XPS is shown in Table 2. The C/N atomic ratio was 47.22 and 32.21 for ZnOA and ZnON, respectively. Furthermore, the O/C atomic ratio was 1.47 and 4.15 for the ZnOA and ZnON samples, respectively. The small O/C atomic ratio for ZnOA is probably due to the doping of carbon into the ZnO structure which was the result of the zinc acetate precursor, as was suggested by Lavand and Malghe [75]. The presence of high N and C content in both samples after calcination indicates that N and C absorbed species from the reagents used int the synthesis method on the ZnO samples [79,80]. It is also worth noting that the O/Zn ratio varies; it was 1.28 for ZnOA, whereas it was 2.04 for ZnON. These differences in the C/N, O/C, and O/Zn atomic ratios of the ZnO materials will undoubtedly influence the bandgap energies determined from the UV–Vis spectra.

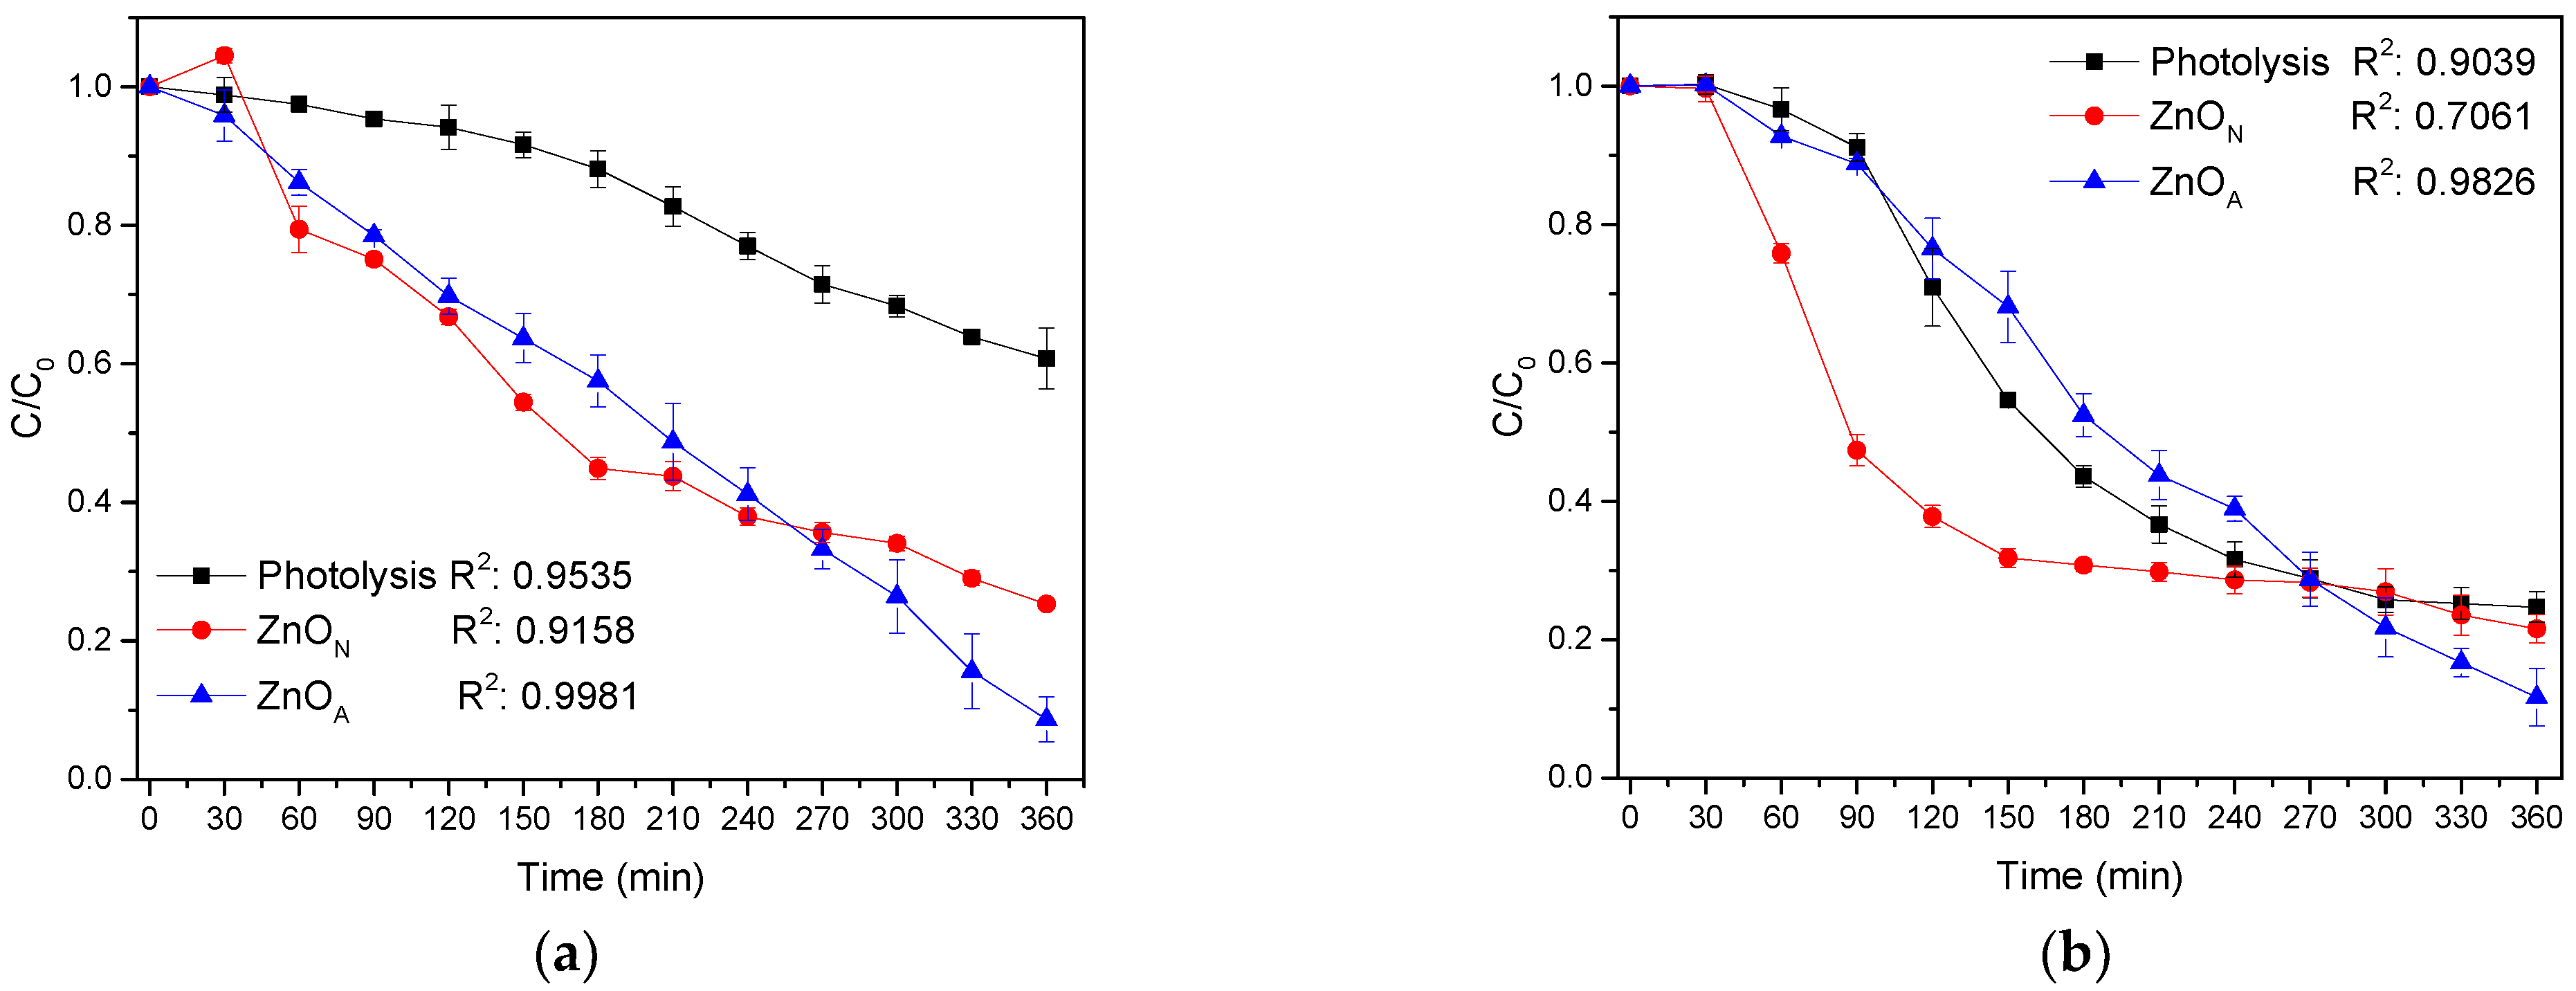
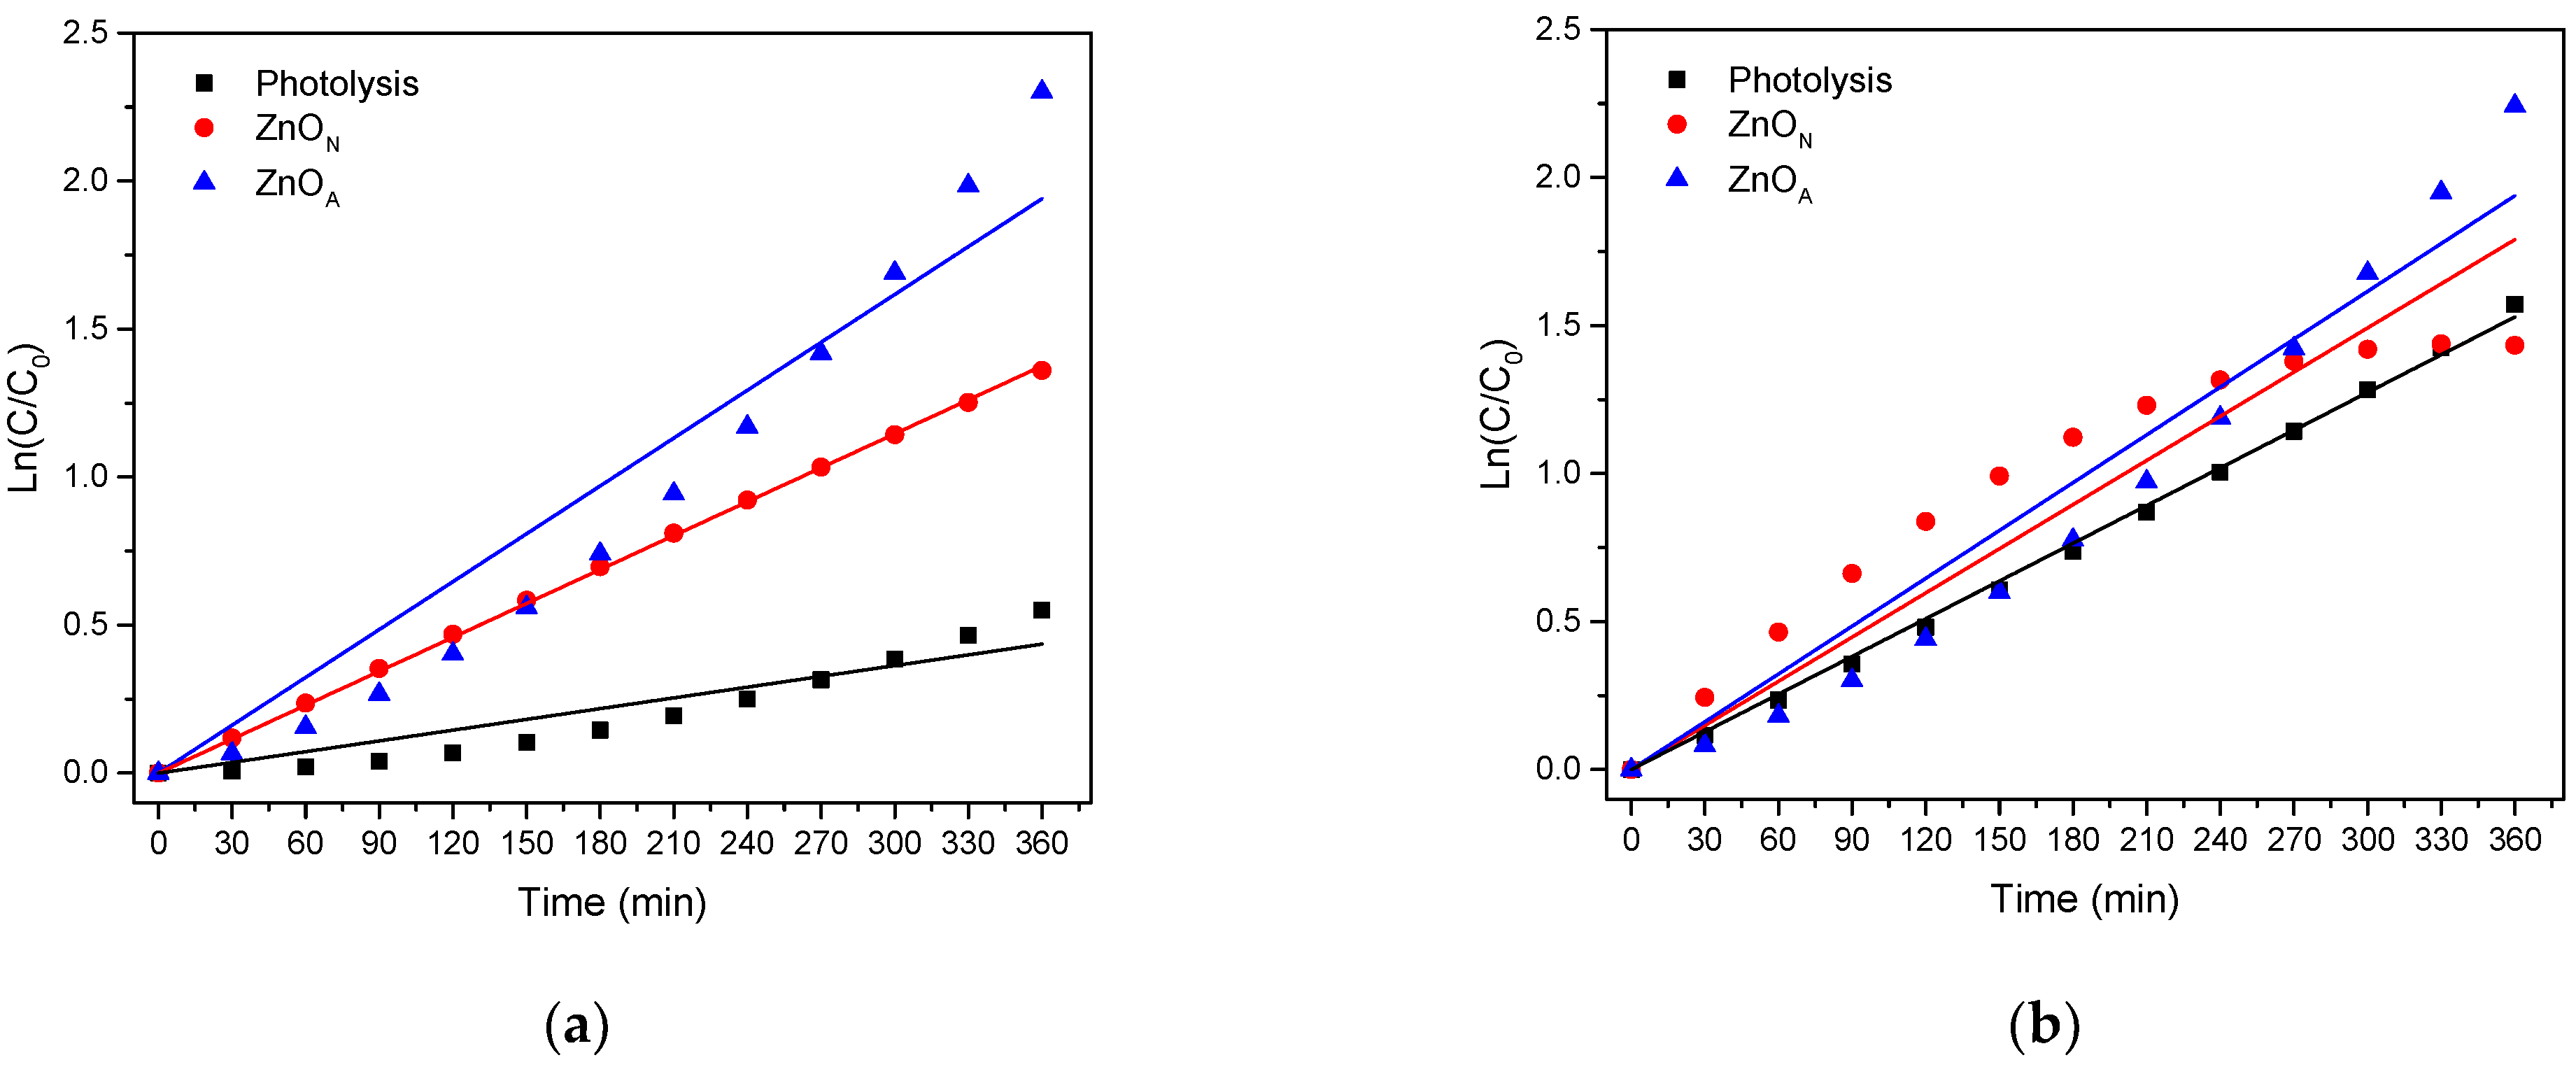
2.8. Degradation of Organic Compounds

The absorbance spectra in the photodegradation of 2,4-D and 2,4-DCP exhibited three characteristic absorption bands centered at 210.5, 245, and 283 nm for 2,4-D, and 210.5, 245, and 285 nm for 2,4-DCP. The primary and secondary transitions were due to the aromatic group, while the third band belongs to the n → π* transition, which is attributed to the C–Cl bond [6]. The shoulder absorption corresponding to 2,4-D (283 nm) and 2,4-DCP (285 nm) showed a significant decrease as the irradiation time increased (360 min), indicating the degradation of 2,4-D and 2,4-DCP, respectively, which is associated with the decomposition of the organic compounds in both catalysts studied [81].
Figure 8 shows the degradation activities of ZnON and ZnOA. In general, ZnOA exhibited better photocatalytic performance (p < 0.05) in the degradation of 2,4-D (90.9%) and 2,4-DCP (86.7%) than ZnON (74.7 and 78.4%, respectively), and the photolysis presented a photocatalytic activity of 40.1 and 73.6%, respectively (Table 3). Rodriguez-Mata et al. [29] found that the ZnO (zinc acetate as precursor) was synthesized by the urea precipitation method and showed a degradation of 38.86% in 2,4-D. Similar trends were described by Meenakshi and Sivasamy [45], who reported that ZnO (zinc acetate as precursor) prepared by the sol–gel method exhibited a photodegradation of 70% under UV and visible light irradiations. Similarly, Ba-Abbad et al. [81] reported a degradation efficiency of 2,4-DCP > 96% using a commercial ZnO catalyst under UV-light irradiation after 120 min of exposure in a pesticide-dependent response. Moreover, the performance of ZnO as a catalyst for the photodegradation of a commercial herbicide (dimethylamine salt of 2,4-dichlorophenoxyacetic acid) has been investigated by Burbano et al. [82], who reported a photocatalytic degradation of 38% after 8 h of treatment, whereas in the absence of the catalyst (photolysis), a pesticide degradation of 6% was observed. These results indicate that in the presence of ZnO nanoparticles, photolysis and photocatalysis, which further decompose the reaction intermediates, occurred simultaneously [83].
Kinetic study of the photocatalytic degradation of 2,4-D and 2,4-DCP was performed using the Langmuir Hinshelwood (LH) kinetics model. Additionally, Figure 9 shows the kinetic profile of the pseudo-first order reaction for both pollutants. Moreover, the time required for half of the organic compound present in the solution irradiated with UV-light to degrade was calculated [84]. The reaction half-life (t½) can be calculated with Equation (13) by replacing C by C0/2 Equation (1):
t 1 2 = l n 2 K A p p
Table 4 show the apparent first-order kinetic constant according to the LH kinetics model (k), and the reaction half-life (t½) of 2,4-D and 2,4-DCP in the photocatalytic degradation showed a much longer tailing. These were obtained from linearization of Ln(C/C0) vs. t [85] with high coefficients of correlation. It can be seen how k changes due to the type of precursor used for the ZnO synthesis. This is a typical phenomenon that occurs in nanomaterials due to the saturation of photocatalytic active centers.
Table 5 shows the different correlation coefficients under different kinetic models, where the highest photocatalyst concentration exerted a negative effect because the ZnON nanoparticles had high concentrations of PEG and inhibited the UV irradiation pass, limiting the photocatalytic process.

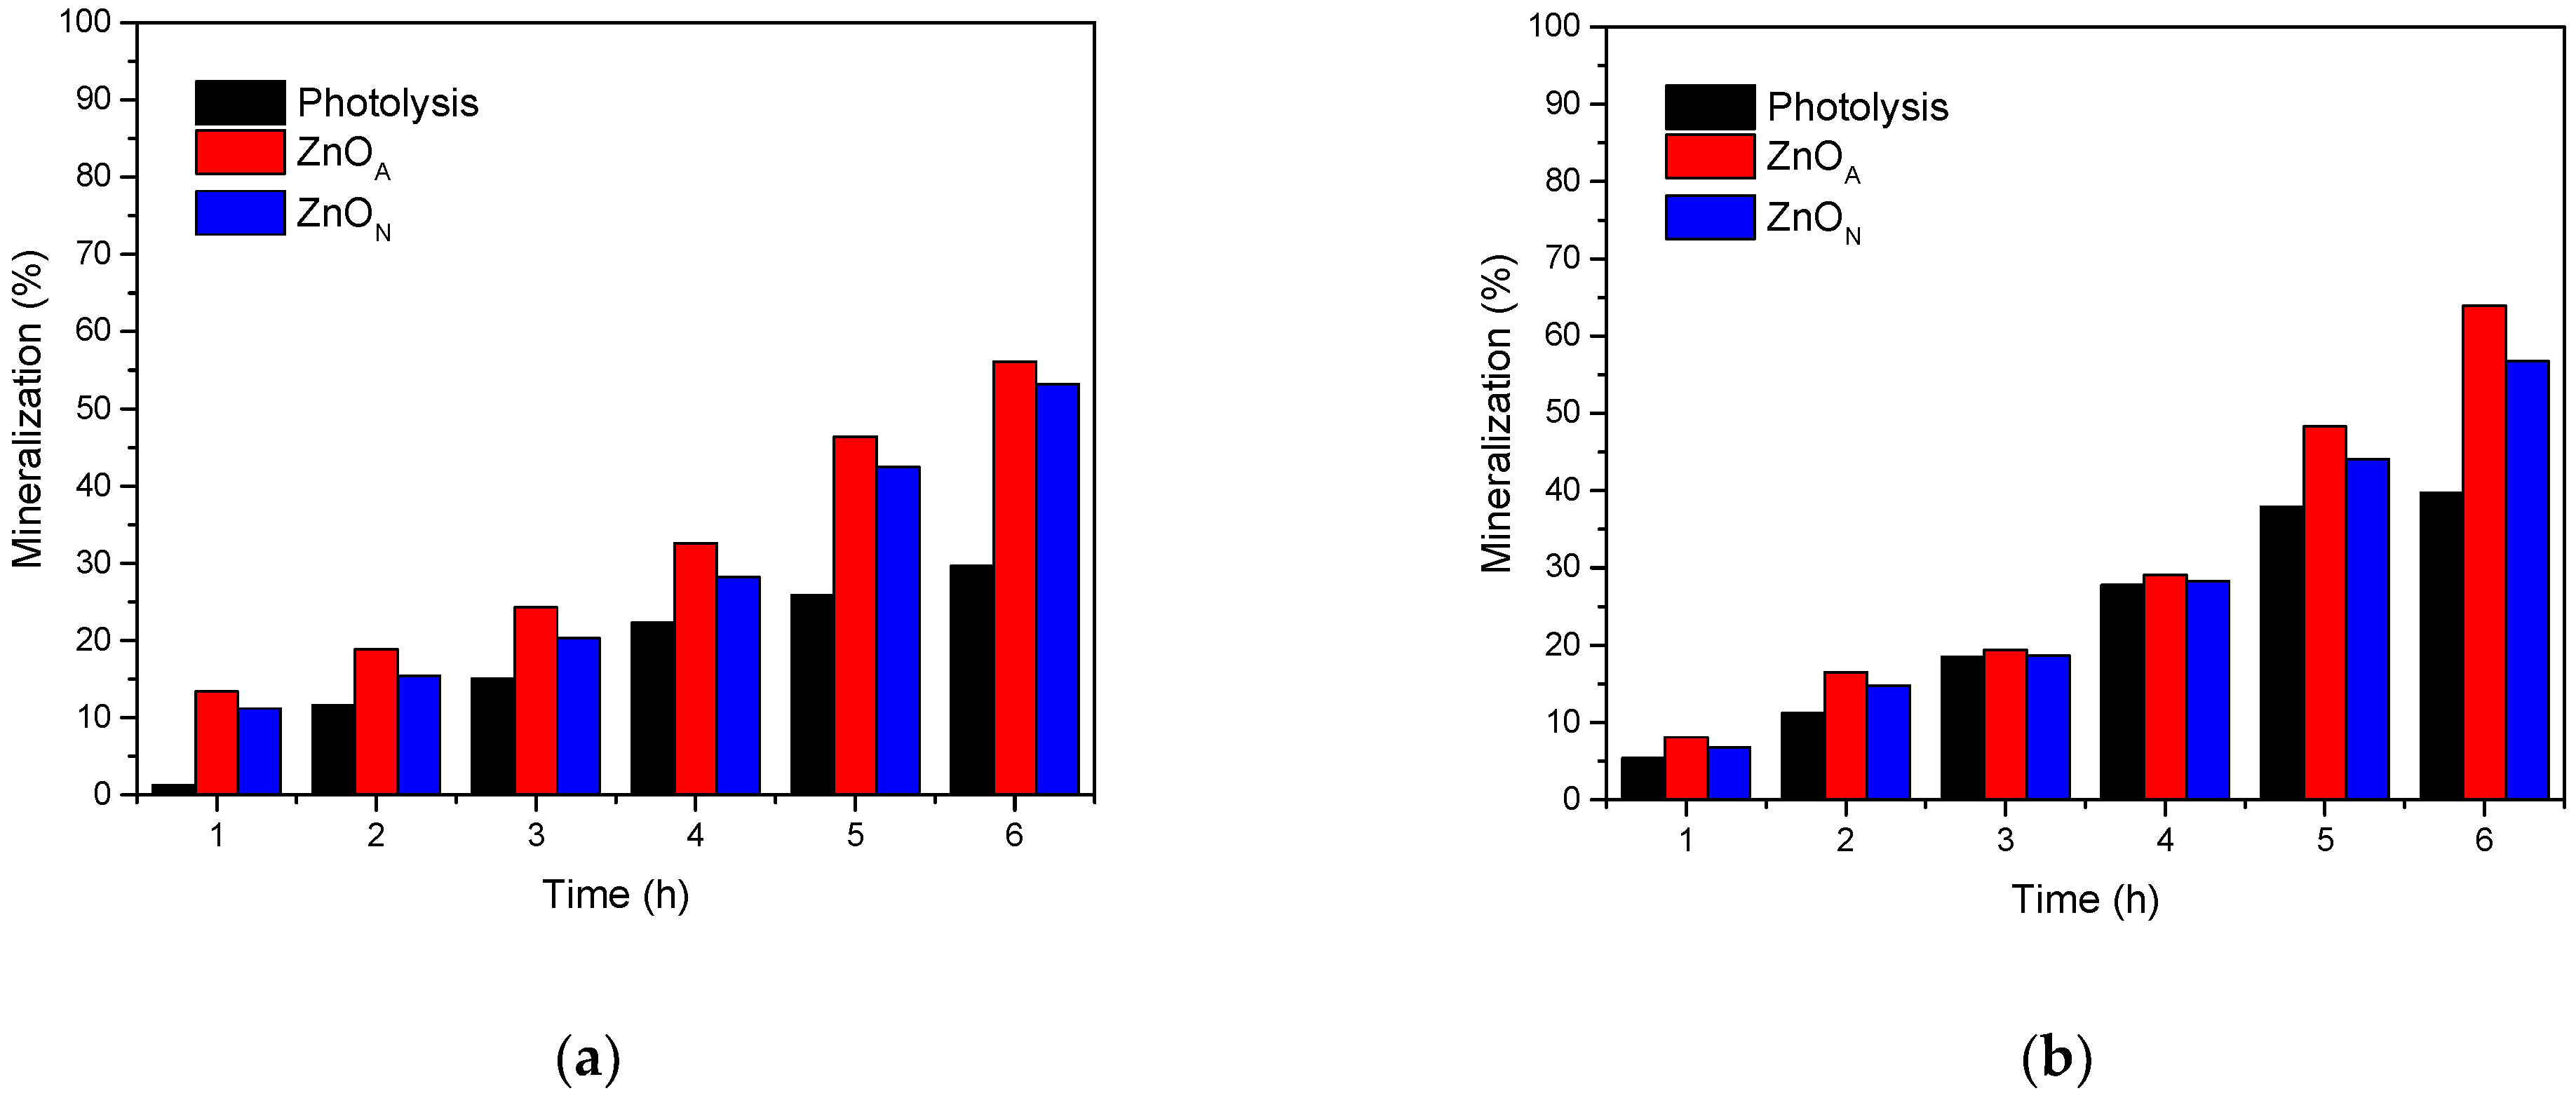
Mineralization of Organic Compounds

The mineralization of the organic pollutants 2,4-D and 2,4-DCP was carried out through total organic carbon (TOC) analysis (Figure 10a,b). In general, the mineralization of the pollutant is dependent on the irradiation time and the photocatalyst precursor.
According to these data, the degradation rate of both pollutants is higher than the mineralization process. Ramos-Ramírez et al. [6] mentioned that this phenomenon is attributed to the different absorption bands detected in the UV–Vis study, particularly for the aromatic group located at 210.5 nm. They suggested that the absence of oxygen limits the formation of superoxide radicals, which promotes partial dechlorination of organic pollutants; therefore, the aromatic structure of phenol present in both studied pollutants is maintained, avoiding the total degradation and mineralization. Furthermore, Wang et al. [69] reported that a small size in nanoparticles equates to a larger specific surface area, giving rise to a more significant number of active sites.
Table 6 shows the results of data analysis for 2,4-D and 2,4-DCP. In the first case, we can see that the use of different precursors to obtain ZnO nanoparticles does not represent differences between treatments, with both showing very similar results. On the other hand, the treatments using catalysts compared to the photolysis process represent statistical differences (p < 0.05). However, the results of the analysis of mineralization of the 2,4-DCP present statistical differences (p < 0.05) between treatments.
Macías-Sánchez et al. [86] used an aqueous solution of a mixture of 20 mg L−1 2,4-D and 5 mg L−1 picloram adjusted to pH 7 under visible light radiation ≥ 400 nm and found a mineralization efficiency of 0.2%. Barik and Gogate [87] investigated sonocatalytic degradation of 2,4-DCP using the process of ultrasonic irradiation in combination with ZnO nanoparticles and reported achieving, under conditions of initial concentration of 20 mg L−1 of pollutant and with a dose of 0.1 g L−1 of ZnO, a TOC removal of 24.6%.
The possible photocatalytic degradation mechanism of 2,4-D and 2,4-DCP under UV light irradiation is described below:
Z n O + h v   e c b + h v b +
P e s t i c i d e s + ( e c b ) R e d u c t i o n   p r o d u c t s  
Z n O   ( e c b ) + O 2 Z n O + O 2 °
O 2 ° + H + H O 2 °
O H 2 ° + H + + Z n O   ( e c b ) H 2 O 2 + Z n O
O H ° + O r g a n i c   p o l l u t   C O 2 + H 2 O
Equations (4)–(9) show the photocatalytic process; UV-light generates photons with energy equal to or greater than the bandgap of the ZnO nanoparticles, which are adsorbed on the surface and give rise to the appearance of holes ( h + ) in the valence band (BV) and electrons ( e ) in the conduction band (BC). These electrons react with O 2 to produce radicals O 2 ° , which are the main electron-accepting species. The superoxide radical interacts with water to promote the production of radicals O H ° and O H ; the reactions between the ions h + and O H favor the formation of radicals O H ° . The radicals O H ° and O 2 ° are considered oxidizing agents that promote the mineralization of pollutants and generate C O 2 and produce H 2 O , which are considered final degradation products [29,88]. According to Djebbar and Sehili [89], about 70% of the conversion of 2,4-D involves hydroxyl radicals and about 30% can be associated with the capture of positive holes by adsorbed 2,4-D on semiconductors.

3. Materials and Methods

3.1. Chemical Reagents

Zinc nitrate hexahydrate (Zn(NO3)2 ∗ 6H2O) 98% purity, zinc acetate dihydrate (C4H6O4Zn ∗ 2H2O) 98% purity, Ammonium hydroxide (NH4OH) 28–30% purity, 2,4-Dichlorophenol (C6H4Cl2O) 99% purity, 2,4-Dichlorophenoxyacetic acid 95% purity, polyethylene glycol (PEG) 98% purity and ethyl alcohol 96% purity reagents were obtained from Sigma-Aldrich Chemical Co., St. Louis, MO, USA.

3.2. ZnO Nanoparticles Synthesis

ZnO nanoparticles were synthesized by the sol–gel method using Zn(NO3)2 ∗ 6H2O and C4H6O4Zn ∗ 2H2O as precursors [90] with some modifications. For this purpose, 14 g of Zn(NO3)2 ∗ 6H2O was dissolved in 140 mL of ethanol in a three-mouth flask. In addition, 2 g of PEG was added to the solution (as a structure directing agent) under continuous magnetic stirring until the PEG dissolved completely [91]. Then, a few drops of NH4OH (1 M) were added to adjust the pH to 7 in the solutions. The solution was heated under reflux at 80 °C for two h under magnetic stirring. After this period, the solution was cooled down to −4 °C and aged for six h under cold storage. The gel was dried at 100 °C and annealed at 500 °C for 240 min in a static air atmosphere (heating rate of 2 °C min−1). A similar procedure was followed for the synthesis of ZnO nanoparticles using C4H6O4Zn ∗ 2H2O as a precursor. The synthesized zinc oxide samples after calcination were labelled ZnON and ZnOA, according to the precursor used, and Zn(NO3)2 ∗ 6H2O and C4H6O4Zn ∗ 2H2O, respectively.

3.3. Sample Characterization

3.3.1. Scanning Electron Microscopy

The morphology of the materials was observed by scanning electron microscopy (Tescan, MIRA3 LMU, London, UK) operated at 20 kV.

3.3.2. Transmission Electron Microscopy

High-resolution images were obtained using a transmission electron microscopy (Jeol, JEM ARM200F, Boston, MA, USA) operated at 200 kV, and the images were analyzed using specialized software (Gatan Micrograph v. 3.7.0, Gatan Inc., Pleasanton, CA, USA).

3.3.3. UV–Vis Diffuse Reflactance Spectroscopy (UV–Vis DRS)

The absorption spectra of the materials were acquired by a UV–Vis DRS (Shimadzu UV-2600, Tokyo, Japan) provided with an integration sphere suitable for diffuse reflectance studies. The UV–Vis DRS spectra were obtained from a wavelength of 200 to 900 nm. From the plot, the band gap energy was calculated using Plank’s Equation (8) [44].
E g = 1239.8 ƛ
where energy (Eg) = band gap energy (eV) and wavelength (ƛ) absorption peak value.

3.3.4. X-ray Diffraction

The X-ray powder diffraction patterns were acquired using an XRD Panalytical diffractometer (Empyrean, Almelo, Netherland) equipped with Cu Kα radiation (ƛ = 0.154 nm). Data were collected from 10° to 90° (2θ) with a scan rate of 0.02°/0.2 s. The average crystal size was determined using the Scherrer Equation (9).
D = k ƛ β cos θ
where D is the crystal size, k is the form factor (0.89), ƛ is the wavelength of Cu Kα radiation (0.154 nm), β is the width evaluated at mid-high of the most intense diffraction peak, and θ is the Bragg angle. The inter-planar distance (d) can also be evaluated from Bragg’s law (10).
d (Å) = nƛ2 sin θ

3.3.5. FTIR Spectroscopy

The FTIR spectra for the material were recorded with an FTIR (Thermo Fisher Scientific, Nicolet iS5, Tokyo, Japan) spectrophotometer using attenuated total reflectance (ATR) with a diamond waveguide (XR model). A detector of fast recovery deuterated triglycine sulfate (DTGS) (standard) was used for the analysis. The spectra were recorded at room temperature, with 24 scans and 4 cm−1 of resolution. Samples were recorded from 4000 cm−1 to 500 cm−1.

3.3.6. Nitrogen Physisorption Analysis

The ZnO textural properties (surface area, pore volume, and pore size) were determined by nitrogen adsorption-desorption with a Micromeritics (TriStar II Plus, Norcross, GA, USA). The samples were degassed at 200 °C for 2 h under a vacuum. Nitrogen adsorption isotherms were measured at liquid nitrogen temperature (77 K) with nitrogen pressures ranging from 10–6 to 1.0 P/P0. The specific surface area was obtained by the Brunauer–Emett–Teller method (BET) and the pore size distribution following the Barret–Joyner–Halenda (BJH) method.

3.3.7. XPS Spectroscopy

The surface composition of the powder was evaluated by X-ray photoelectron spectroscopy (XPS) using a spectrometer (Thermo Scientific K Alpha, Tokyo, Japan) operated at 1487 eV. Narrow scans with 60 eV Epass with a point size of 400 mm were acquired. To minimize the effect of charge, the samples were supported on an indium foil.

3.4. Photocatalytic Activity

The photocatalytic properties of the ZnO nanoparticles were studied through the degradation of 2,4-D and 2,4-DCP in a typical kinetic reaction experiment. A glass batch reactor provided with a cooling medium, and a UV-lamp of 1 mW cm−2 placed inside a quartz tube was used. The reactor was loaded with 200 mL of deionized water polluted with 80 mg L−1 of 2,4-D or 80 mg L−1 2,4-DCP and 100 mg L−1 of ZnO as a catalyst. The degradation curves were obtained by measuring the evolution of the absorbance maximum (at 283 and 285 nm for 2,4-D and 2,4-DCP, respectively) as a function of time (every 30 min up to 360 min) using a UV–Vis (Shimadzu UV-2600, Tokyo, Japan) spectrophotometer with scans from 200 to 900 nm. Furthermore, the total organic carbon in the samples was measured using TOC-LCSN equipment (Shimadzu, model) and calculated by applying the Equation (11):
T O C = T C I C
where TOC is the amount of total organic carbon (mg L−1), TC is the amount of total carbon (mg L−1), and IC is the inorganic carbon (mg L−1) in an aqueous solution.
The quantitative analysis of the reaction kinetics of the degradation of organic compounds can be obtained by fitting the experimental data using the Langmuir–Hinshelwood model and expressed by the following Equation (12):
r = d c d t = k K c 1 + K c
where k is the rate constant, K is the equilibrium constant, and c is the concentration of the organic pollutant. Nonetheless, Equation (1) can be simplified due to the low concentration of pollutant Kc < 1 to adapt to the form of a first-order apparent rate Equation (13):
l n C 0 C = K A p p t
where kApp is the apparent pseudo-first-order rate constant (min−1), C and C0 are the final and initial organic compound concentrations (mg L−1), and t is the reaction time (min).

3.5. Data Analysis

The results of the degradation of organic pollutants were subjected to a statistical analysis applying a One-Way ANOVA and the Tukey test to analyze the differences between samples (p < 0.05). Statistical analyses were obtained with the help of Statistic software (V. 10.0 Statsoft, Tulsa, OK, USA).

4. Conclusions

Zinc oxide nanoparticles using zinc nitrate and zinc acetate as precursors were successfully synthesized following the sol–gel method. The morphology, crystalline structure, and physicochemical properties depend on the zinc oxide precursor. The final C/N, O/C, and O/Zn atomic ratios in the zinc oxide samples varied according to the precursor and as a consequence, a difference in the band gap values was determined. Our experiments showed that the ZnOA catalyst was better than the ZnON sample in the photocatalytic degradation of both 2,4-DCP and 2,4-D under UV-light irradiation, which could be associated with the crystallinity, crystallite size, specific surface area, and type of ZnO precursor. The experimental results also demonstrate that both photolysis and photocatalysis contributed to the degradation of both organic pesticides.

Author Contributions

Writing—original draft preparation, I.L.-R.; supervision, C.A.G.-G.; writing—review and editing, L.M.A.-E., R.R.-T., J.L.R. and O.A.G.-V.; conceptualization, resources, and project administration, A.P.-L. All authors have read and agreed to the published version of the manuscript.

Funding

This research received no external funding.

Institutional Review Board Statement

Not applicable.

Informed Consent Statement

Not applicable.

Data Availability Statement

The tables and figures are self-made based on the information carried out.

Acknowledgments

ILR thanks CONACYT for the scholarship (936484) and appreciates the support in the characterization of photocatalysts from Martín Flores and Milton Vázquez as well as technicians of the equipment Ing. Sergio Oliva and José Rivera for the characterization of XRD, SEM-DES, and XPS analysis (project 270660, Support for the Strengthening and Development of the Scientific and Technological Infrastructure).

Conflicts of Interest

The authors declare no conflict of interest.

References

  1. Garba, Z.N.; Zhou, W.; Lawan, I.; Xiao, W.; Zhang, M.; Wang, L.; Chen, L.; Yuan, Z. An overview of chlorophenols as contaminants and their removal from wastewater by adsorption: A review. J. Environ. Manag. 2019, 241, 59–75. [Google Scholar] [CrossRef]
  2. Zada, A.; Khan, M.; Khan, M.A.; Khan, Q.; Habibi-Yangjeh, A.; Dang, A.; Maqbool, M. Review on the hazardous applications and photodegradation mechanisms of chlorophenols over different photocatalysts. Environ. Res. 2021, 195, 110742. [Google Scholar] [CrossRef]
  3. Cruz González, G.; Julcour, C.; Chaumat, H.; Jáuregui-Haza, U.; Delmas, H. Degradation of 2,4-dichlorophenoxyacetic acid by photolysis and photo-Fenton oxidation. J. Environ. Chem. Eng. 2018, 6, 874–882. [Google Scholar] [CrossRef]
  4. Bejarano González, F. Los Plagicidas Altamente Peligrosos en México, 1st ed.; RAPAM: Texcoco, Mexico, 2017; pp. 1–365. [Google Scholar]
  5. Centro de Estudios para el Desarrollo Rural Sustentable y la Soberanía Alimentaria. Uso y Regulación de Herbicidas en México, 1st ed.; CEDRSSA: Mexico City, Mexico, 2020; pp. 1–43. [Google Scholar]
  6. Ramos-Ramírez, E.; Gutiérrez-Ortega, N.L.; Tzompantzi-Morales, F.; Barrera-Rodríguez, A.; Castillo-Rodríguez, J.C.; Tzompantzi-Flores, C.; Santolalla-Vargas, C.E.; del Pilar Guevara-Hornedo, M. Photocatalytic degradation of 2,4-Dichlorophenol on NiAl-mixed oxides derivatives of activated layered double hydroxides. Top. Catal. 2020, 63, 546–563. [Google Scholar] [CrossRef]
  7. Diaz, E.; Mohedano, A.F.; Casas, J.A.; Calvo, L.; Gilarranz, M.A.; Rodriguez, J.J. Deactivation of a Pd/AC catalyst in the hydrodechlorination of chlorinated herbicides. Catal. Today 2015, 241, 86–91. [Google Scholar] [CrossRef]
  8. Gar Alalm, M.; Samy, M.; Ookawara, S.; Ohno, T. Immobilization of S-TiO2 on reusable aluminum plates by polysiloxane for photocatalytic degradation of 2,4-dichlorophenol in water. J. Water Process Eng. 2018, 26, 329–335. [Google Scholar] [CrossRef]
  9. Jaafarzadeh, N.; Ghanbari, F.; Ahmadi, M. Efficient degradation of 2,4-dichlorophenoxyacetic acid by peroxymonosulfate/magnetic copper ferrite nanoparticles/ozone: A novel combination of advanced oxidation processes. Chem. Eng. J. 2017, 320, 436–447. [Google Scholar] [CrossRef]
  10. Samadi, M.; Zirak, M.; Naseri, A.; Khorashadizade, E.; Moshfegh, A.Z. Recent progress on doped ZnO nanostructures for visible-light photocatalysis. Thin Solid Films 2016, 605, 2–19. [Google Scholar] [CrossRef] [Green Version]
  11. Lam, S.M.; Sin, J.C.; Abdullah, A.Z.; Mohamed, A.R. Investigation on visible-light photocatalytic degradation of 2,4-dichlorophenoxyacetic acid in the presence of MoO3/ZnO nanorod composites. J. Mol. Catal. A Chem. 2013, 370, 123–131. [Google Scholar] [CrossRef]
  12. Abdullah, A.H.; Mun, L.K.; Zainal, Z.; Hussein, M.Z. Photodegradation of Chlorophenoxyacetic Acids by ZnO/r-Fe2O3 Nanocatalysts: A Comparative Study. Int. J. Chem. 2013, 5, 56–65. [Google Scholar] [CrossRef]
  13. Varadavenkatesan, T.; Lyubchik, E.; Pai, S.; Pugazhendhi, A.; Vinayagam, R.; Selvaraj, R. Photocatalytic degradation of Rhodamine B by zinc oxide nanoparticles synthesized using the leaf extract of Cyanometra ramiflora. J. Photochem. Photobiol. B Biol. 2019, 199, 111621. [Google Scholar] [CrossRef]
  14. Xu, J.; Cui, Z.; Liu, Z.; Xu, F.; Chen, Y. Organic-inorganic nanohybrid electrochemical sensors from multi-walled carbon nanotubes decorated with zinc oxide nanoparticles and insitu wrapped with poly(2-methacryloyloxyethyl-ferrocenecarboxylate) for detection of food additives. Nanomaterials 2019, 9, 1388. [Google Scholar] [CrossRef] [Green Version]
  15. Singh, O.; Kohli, N.; Singh, R.C. Precursor controlled morphology of zinc oxide and its sensing behaviour. Sens. Actuators B Chem. 2013, 178, 149–154. [Google Scholar] [CrossRef]
  16. Koutu, V.; Shastri, L.; Malik, M.M. Effect of NaOH concentration on optical properties of zinc oxide nanoparticles. Mater. Sci. Pol. 2016, 34, 819–827. [Google Scholar] [CrossRef] [Green Version]
  17. Changsong, L.; Zhiwen, L.; Yanfeng, G.; Qifeng, Z. Microstructral evolution of well-aligned ZnO nanorods array films in aqueous solution. J. Wuhan Univ. Technol. 2007, 22, 603–606. [Google Scholar] [CrossRef]
  18. Kenanakis, G.; Vernardou, D.; Koudoumas, E.; Katsarakis, N. Growth of c-axis oriented ZnO nanowires from aqueous solution: The decisive role of a seed layer for controlling the wires’ diameter. J. Cryst. Growth 2009, 311, 4799–4804. [Google Scholar] [CrossRef]
  19. Gupta, M.; Sharma, V.; Shrivastava, J.; Solanki, A. Preparation and characterization of nanostructured ZnO thin films for photoelectrochemical splitting of water. Bull. Mater. Sci. 2009, 32, 23–30. [Google Scholar] [CrossRef]
  20. Bazli, L.; Siavashi, M.; Shiravi, A. A review of Carbon nanotube/TiO2 composite prepared via Sol-Gel method. J. Compos. Compd. 2019, 1, 1–9. [Google Scholar] [CrossRef]
  21. Fardood, S.T.; Ramazani, A.; Joo, S.W. Synthesis and characterization of Zinc oxide nanoparticles using Black Tea extract. J. Appl. Chem. Res. 2017, 11, 8–17. [Google Scholar]
  22. Yan, X.B.; Tay, B.K.; Yang, Y. Dispersing and functionalizing multiwalled carbon nanotubes in TiO2 Sol. J. Phys. Chem. B 2006, 110, 25844–25849. [Google Scholar] [CrossRef]
  23. Siahpoosh, S.; Salahi, E.; Hessari, F.; Mobasherpour, I. Synthesis of γ-Alumina nanoparticles with high-surface-area via Sol-Gel method and their performance for the removal of Nickel from aqueous solution. Bull. Société R. Sci. Liège 2016, 85, 912–934. [Google Scholar] [CrossRef]
  24. Alwan, R.M.; Kadhim, Q.A.; Sahan, K.M.; Ali, R.A.; Roaa, J.; Mahdi, N.A.K.; Jassim, A.N. Synthesis of Zinc oxide nanoparticles via Sol—Gel route and their characterization. Nanosci. Nanotechnol. 2015, 5, 1–6. [Google Scholar] [CrossRef]
  25. Tseng, Y.K.; Chuang, M.H.; Chen, Y.C.; Wu, C.H. Synthesis of 1D, 2D, and 3D ZnO polycrystalline nanostructures using the sol-gel method. J. Nanotechnol. 2012, 2012, 712850. [Google Scholar] [CrossRef] [Green Version]
  26. Davis, K.; Yarbrough, R.; Froeschle, M.; White, J.; Rathnayake, H. Band gap engineered zinc oxide nanostructures: Via a sol-gel synthesis of solvent driven shape-controlled crystal growth. RSC Adv. 2019, 9, 14638–14648. [Google Scholar] [CrossRef] [Green Version]
  27. El Mragui, A.; Daou, I.; Zegaoui, O. Influence of the preparation method and ZnO(ZnO+TiO2) weight ratio on the physicochemical and photocatalytic properties of ZnO-TiO2 nanomaterials. Catal. Today 2018, 321–322, 41–51. [Google Scholar] [CrossRef]
  28. Ba-Abbad, M.; Kadhum, A.A.; Mohamad, A.B.; Takriff, M.; Sopian, K. Solar photocatalytic degradation of environmental pollutants using ZnO prepared by sol-gel: 2,4-Dichlorophenol as case study. Int. J. Therm. Environ. Eng. 2010, 1, 37–42. [Google Scholar] [CrossRef]
  29. Rodriguez-Mata, A.E.; Tzompantzi, F.J.; Amabilis-Sosa, L.E.; Diaz-Peña, I.; Bustos-Terrones, Y.; Rangel-Peraza, J.G. Characterization of SO42−/ZnO and photodegradation kinetics of 2,4-Dichlorophenoxyacetic acid (2,4-D). Kinet. Catal. 2018, 59, 720–726. [Google Scholar] [CrossRef]
  30. Sahu, K.; Kar, A.K. Counterion-induced tailoring of energy transfer in hydrothermally grown nanostructured ZnO for photocatalysis. Cryst. Growth Des. 2021, 21, 3656–3667. [Google Scholar] [CrossRef]
  31. Mohammed, R.; Ali, M.E.M.; Gomaa, E.; Mohsen, M. Highly stable, reusable, and MW-assisted prepared ZnO nanorods for wastewater decontamination: Precursors ratios effect and insights on matrix and pollutants mineralization. J. Environ. Chem. Eng. 2021, 9, 104630. [Google Scholar] [CrossRef]
  32. Lin, C.-C.; You, Y.-C. Mass-production of ZnO nanoparticles by precipitation in a rotating packed bed: Effect of zinc salt. J. Mater. Res. Technol. 2020, 9, 8451–8458. [Google Scholar] [CrossRef]
  33. Mohammed, R.; Ali, M.E.M.; Gomaa, E.; Mohsen, M. Green ZnO nanorod material for dye degradation and detoxification of pharmaceutical wastes in water. J. Environ. Chem. Eng. 2020, 8, 104295. [Google Scholar] [CrossRef]
  34. Abdulrahman, A.F. Study the optical properties of the various deposition solutions of ZnO nanorods grown on glass substrate using chemical bath deposition technique. J. Ovonic Res. 2020, 16, 181–188. [Google Scholar]
  35. Mayekar, J.; Radha, S.; Dhar, V. Role of salt precursor in the synthesis of zinc oxide role of salt precursor in the synthesis of zinc oxide. Int. J. Res. Eng. Technol. 2014, 3, 43–45. [Google Scholar] [CrossRef]
  36. Ramzuz, N.I.M.; Zakaria, N.; Zain, Z.M. Synthesis and characterization of zinc oxide nanostructures in biosensor application. Int. J. Biosens. Bioelectron. 2020, 6, 48–54. [Google Scholar] [CrossRef]
  37. Kaur, M.; Kalia, A. Role of salt precursors for the synthesis of zinc oxide nanoparticles and in imparting variable antimicrobial activity. J. Appl. Nat. Sci. 2016, 8, 1039–1048. [Google Scholar] [CrossRef]
  38. Dahiya, A.S.; Boubenia, S.; Franzo, G.; Mirabella, S.; Alquier, D. Photoluminescence study of the influence of additive Ammonium hydroxide in hydrothermally grown ZnO nanowires. Nanoscale Res. Lett. 2018, 13, 249. [Google Scholar] [CrossRef]
  39. Darroudi, M.; Sabouri, Z.; Kazemi Oskuee, R.; Khorsand Zak, A.; Kargar, H.; Hamid, M.H.N.A. Sol-gel synthesis, characterization, and neurotoxicity effect of zinc oxide nanoparticles using Gum Tragacanth. Ceram. Int. 2013, 39, 9195–9199. [Google Scholar] [CrossRef]
  40. Thorat, J.H.; Kanade, K.G.; Nikam, L.K.; Chaudhari, P.D.; Kale, B.B. Nanostructured ZnO hexagons and optical properties. J. Mater. Sci. Mater. Electron. 2011, 22, 394–399. [Google Scholar] [CrossRef]
  41. Wu, G.S.; Xie, T.; Yuan, X.Y.; Li, Y.; Yang, L.; Xiao, Y.H.; Zhang, L.D. Controlled synthesis of ZnO nanowires or nanotubes via sol-gel template process. Solid State Commun. 2005, 134, 485–489. [Google Scholar] [CrossRef]
  42. Veriansyah, B.; Kim, J.D.; Min, B.K.; Shin, Y.H.; Lee, Y.W.; Kim, J. Continuous synthesis of surface-modified zinc oxide nanoparticles in supercritical methanol. J. Supercrit. Fluids 2010, 52, 76–83. [Google Scholar] [CrossRef]
  43. Bhatia, S.; Verma, N. Photocatalytic Activity of ZnO Nanoparticles with Optimization of Defects. Mater. Res. Bull. 2017, 95, 468–476. [Google Scholar] [CrossRef]
  44. Benhebal, H.; Chaib, M.; Salmon, T.; Geens, J.; Leonard, A.; Lambert, S.D.; Crine, M.; Heinrichs, B. Photocatalytic degradation of phenol and benzoic acid using zinc oxide powders prepared by the sol-gel process. Alex. Eng. J. 2013, 52, 517–523. [Google Scholar] [CrossRef] [Green Version]
  45. Meenakshi, G.; Sivasamy, A. Synthesis and characterization of zinc oxide nanorods and its photocatalytic activities towards degradation of 2,4-D. Ecotoxicol. Environ. Saf. 2017, 135, 243–251. [Google Scholar] [CrossRef] [PubMed]
  46. Zeng, B.H.; Duan, G.; Li, Y.; Yang, S.; Xu, X. Blue Luminescence of ZnO nanoparticles based on non-equilibrium processes: Defect origins and emission controls. J. Adv. Funct. Mater. 2010, 20, 561–572. [Google Scholar] [CrossRef]
  47. Muñoz-Fernandez, L.; Alkan, G.; Milošević, O.; Rabanal, M.E.; Friedrich, B. Synthesis and characterisation of spherical core-shell Ag/ZnO nanocomposites using single and two-steps ultrasonic spray pyrolysis (USP). Catal. Today 2019, 321–322, 26–33. [Google Scholar] [CrossRef] [Green Version]
  48. Fan, C.; Sun, F.; Wang, X.; Huang, Z.; Keshvardoostchokami, M.; Kumar, P.; Liu, B. Synthesis of ZnO hierarchical structures and their gas sensing properties. Nanomaterials 2019, 9, 1277. [Google Scholar] [CrossRef] [Green Version]
  49. Liu, Y.; Zhou, J.; Larbot, A.; Persin, M. Preparation and characterization of nano-zinc oxide. J. Mater. Process. Technol. 2007, 189, 379–383. [Google Scholar] [CrossRef]
  50. Nasrollahzadeh, M.S.; Hadavifar, M.; Ghasemi, S.S.; Chamjangali, M.A. Synthesis of ZnO nanostructure using activated carbon for photocatalytic degradation of methyl orange from aqueous solutions. Appl. Water Sci. 2018, 8, 104. [Google Scholar] [CrossRef] [Green Version]
  51. Ghica, D.; Vlaicu, I.D.; Stefan, M.; Nistor, L.C.; Nistor, S.V. On the agent role of Mn2+ in redirecting the synthesis of Zn(OH)2 towards nano-ZnO with variable morphology. RSC Adv. 2016, 6, 106732–106741. [Google Scholar] [CrossRef] [Green Version]
  52. Bhattacharyya, R.; Ray, S.K. Removal of congo red and methyl violet from water using nano clay filled composite hydrogels of poly acrylic acid and polyethylene glycol. Chem. Eng. J. 2015, 260, 269–283. [Google Scholar] [CrossRef]
  53. Jayaramudu, T.; Raghavendra, G.M.; Varaprasad, K.; Reddy, G.V.S.; Reddy, A.B.; Sudhakar, K.; Sadiku, E.R. Preparation and characterization of poly(ethylene glycol) stabilized nano silver particles by a mechanochemical assisted ball mill process. J. Appl. Polym. Sci. 2016, 133, 43027. [Google Scholar] [CrossRef]
  54. Pholnak, C.; Sirisathitkul, C.; Suwanboon, S.; Harding, D.J. Effects of precursor concentration and reaction time on sonochemically synthesized ZnO nanoparticles. Mater. Res. 2014, 17, 405–411. [Google Scholar] [CrossRef]
  55. Osman, D.A.M.; Mustafa, M.A. Synthesis and characterization of Zinc oxide nanoparticles using zinc acetate dihydrate and sodium hydroxide. J. Nanosci. Nanoeng. 2015, 1, 248–251. Available online: https://www.aiscience.org/diario/jnn (accessed on 14 October 2021).
  56. Khan, M.F.; Ansari, A.H.; Hameedullah, M.; Ahmad, E.; Husain, F.M.; Zia, Q.; Baig, U.; Zaheer, M.R.; Alam, M.M.; Khan, A.M. Sol-gel synthesis of thorn-like ZnO nanoparticles endorsing mechanical stirring effect and their antimicrobial activities: Potential role as nano-antibiotics. Sci. Rep. 2016, 6, 27689. [Google Scholar] [CrossRef] [PubMed]
  57. Al-dhahir, T.A.; Al-obodi, E.E.; Al-saadi, T.M.; Issam, L. ZnO nanoparticles: Synthesis and crystal structure study. Wasit J. Sci. Med. 2014, 7, 87–95. [Google Scholar]
  58. Mesaros, A.; Vasile, B.S.; Toloman, D.; Lelia, P.O.; Marinca, T.; Unguresan, M.; Perhaita, I.; Filip, M.; Iordache, F.; Ciontea, L. Towards understanding the enhancement of antibacterial activity in manganese doped ZnO nanoparticles. Appl. Surf. Sci. 2018, 471, 960–972. [Google Scholar] [CrossRef]
  59. Mustapha, S.; Ndamitso, M.; Abdulkareem, A.S.; Oladejo, J.T.; Shuaib, D.T.; Mohammed, A.K.; Sumaila, A. Comparative study of crystallite size using Williamson-Hall and Debye-Scherrer plots for ZnO nanoparticles. Adv. Nat. Sci. Nanosci. Nanotechnol. 2019, 10, 045013. [Google Scholar] [CrossRef]
  60. Hakim, A.A.N.; Rashid, A.R.A.; Arsad, N.; Surani, A.H. Zinc oxide thin film synthesized by Sol-Gel method. Solid State Phenom. 2020, 307, 51–57. [Google Scholar] [CrossRef]
  61. Gayathri, S.; Ghosh, O.; Sathishkumar, S.; Sudhakara, P.; Jayaramudu, J.; Ray, S.; Viswanath, A. Investigation of physicochemical properties of Ag doped ZnO nanoparticles prepared by chemical route. Appl. Sci. Lett. 2015, 1, 8–13. [Google Scholar]
  62. Balogun, S.W.; James, O.O.; Sanusi, Y.K.; Olayinka, O.H. Green synthesis and characterization of zinc oxide nanoparticles using bashful (Mimosa pudica), leaf extract: A precursor for organic electronics applications. SN Appl. Sci. 2020, 2, 504. [Google Scholar] [CrossRef] [Green Version]
  63. Koodziejczak-Radzimska, A.; Markiewicz, E.; Jesionowski, T. Structural characterisation of ZnO particles obtained by the emulsion precipitation method. J. Nanomater. 2012, 2012, 656353. [Google Scholar] [CrossRef]
  64. Da Silva-Neto, M.L.; de Oliveira, M.C.A.; Dominguez, C.T.; Lins, R.E.M.; Rakov, N.; de Araújo, C.B.; de Souza Menezes, L.; de Oliveira, H.P.; Gomes, A.S.L. UV random laser emission from flexible ZnO-Ag-enriched electrospun cellulose acetate fiber matrix. Sci. Rep. 2019, 9, 11765. [Google Scholar] [CrossRef]
  65. Rodriguez Martinez, C.; Joshi, P.; Vera, J.L.; Ramirez-Vick, J.E.; Perales, O.; Singh, S.P. Cytotoxic Studies of PEG Functionalized ZnO Nanoparticles on MCF-7 Cancer Cells. In Proceedings of the NSTI Nanotechnology Conference and Expo, NSTI-Nanotech 2011, Boston, MA, USA, 13–16 June 2011; Volume 3, pp. 420–423. [Google Scholar]
  66. Chithra, M.J.; Sathya, M.; Pushpanathan, K. Effect of pH on crystal size and photoluminescence property of zno nanoparticles prepared by chemical precipitation method. Acta Metall. Sin. 2015, 28, 394–404. [Google Scholar] [CrossRef]
  67. Phoohinkong, W.; Foophow, T.; Pecharapa, W. Synthesis and characterization of copper zinc oxide nanoparticles obtained via metathesis process. Adv. Nat. Sci. Nanosci. Nanotechnol. 2017, 8, 035003. [Google Scholar] [CrossRef] [Green Version]
  68. Sing, K.S.W.; Everett, D.H.; Haul, R.A.W.; Moscou, L.; Pierotti, R.A.; Rouquérol, J.; Siemieniewska, T. Reporting physisorption data for Gas/solid systems with special reference to the determination of surface area and porosity. Pure Appl. Chem. 1985, 57, 603–619. [Google Scholar] [CrossRef]
  69. Wang, Q.; Ma, Q.; Lian, J.; Zhong, J.; Wang, F.; Li, J.; He, Y.; Wang, R. Bovine serum albumin modified ZnO to degrade organic dyes under ultraviolet. New J. Chem. 2016, 6, 5604–5610. [Google Scholar] [CrossRef]
  70. Hamrouni, A.; Moussa, N.; Parrino, F.; Di Paola, A.; Houas, A.; Palmisano, L. Sol–gel synthesis and photocatalytic activity of ZnO–SnO2 nanocomposites. J. Mol. Catal. A Chem. 2014, 390, 133–141. [Google Scholar] [CrossRef] [Green Version]
  71. Wang, S.; Kuang, P.; Cheng, B.; Yu, J.; Jiang, C. ZnO Hierarchical Microsphere for Enhanced Photocatalytic Activity; Elsevier B.V.: Amsterdam, The Netherlands, 2018; ISBN 0086278787102. [Google Scholar]
  72. Jiang, J.; Zhang, K.; Chen, X.; Zhao, F.; Xie, T.; Wang, D.; Lin, Y. Porous Ce-doped ZnO hollow sphere with enhanced photodegradation activity for artificial waste water. J. Alloys Compd. 2017, 699, 907–913. [Google Scholar] [CrossRef]
  73. Podyacheva, O.Y.; Lisitsyn, A.S.; Kibis, L.S.; Stadnichenko, A.I.; Boronin, A.I.; Slavinskaya, E.M.; Stonkus, O.A.; Yashnik, S.A.; Ismagilov, Z.R. Influence of the nitrogen-doped carbon nanofibers on the catalytic properties of supported metal and oxide nanoparticles. Catal. Today 2018, 301, 125–133. [Google Scholar] [CrossRef]
  74. Barrera, A.; Tzompantzi, F.; Campa-Molina, J.; Casillas, J.E.; Pérez-Hernández, R.; Ulloa-Godinez, S.; Velásquez, C.; Arenas-Alatorre, J. Photocatalytic activity of Ag/Al2O3-Gd2O3 photocatalysts prepared by the sol-gel method in the degradation of 4-chlorophenol. RSV Adv. 2018, 8, 3108–3119. [Google Scholar] [CrossRef] [Green Version]
  75. Lavand, A.B.; Malghe, Y.S. Synthesis, characterization and visible light photocatalytic activity of Carbon and Iron modified ZnO. J. King Saud Univ. Sci. 2018, 30, 65–74. [Google Scholar] [CrossRef] [Green Version]
  76. Zhou, W.-D.; Dastan, D.; Li, J.; Yin, X.-T.; Wang, Q. Discriminable sensing response behavior to homogeneous gases based on n-ZnO/p-NiO Composites. Nanomaterials 2020, 10, 785. [Google Scholar] [CrossRef] [Green Version]
  77. Yousef, A.; Barakat, N.A.M.; Amna, T.; Unnithan, A.R.; Al-Deyab, S.S.; Yong Kim, H. Influence of CdO-doping on the photoluminescence properties of ZnO nanofibers: Effective visible light photocatalyst for waste water treatment. J. Lumin. 2012, 132, 1668–1677. [Google Scholar] [CrossRef]
  78. Rambu, A.P.; Nica, V.; Dobromir, M. Influence of Fe-doping on the optical and electrical properties of ZnO films. Superlattices Microstruct. 2013, 59, 87–96. [Google Scholar] [CrossRef]
  79. Shimizu, K.; Shchukarev, A.; Boily, J.F. X-ray photoelectron spectroscopy of fast-frozen hematite colloids in aqueous solutions. 3. Stabilization of ammonium species by surface (Hydr)oxo groups. J. Phys. Chem. C 2011, 115, 6796–6801. [Google Scholar] [CrossRef]
  80. Nawawi, W.I.; Zaharudin, R.; Azlan, M.; Ishak, M.; Ismail, K. The preparation and characterization of immobilized TiO2/PEG by using DSAT as a support binder. Appl. Sci. 2017, 7, 24. [Google Scholar] [CrossRef] [Green Version]
  81. Ba-abbad, M.M.; Kadhum, A.A.H.; Mohamad, A.B.; Takriff, M.S.; Sopian, K. Photocatalytic degradation of chlorophenols under direct solar radiation in the presence of ZnO catalyst. Res. Chem. Intermed. 2013, 39, 1981–1996. [Google Scholar] [CrossRef]
  82. Burbano, J.; Cruz, I.; Colina-Márquez, J.; López-vásquez, A.; Machuca, F. Evaluation of Zinc oxide-based photocatalytic degradation of a commercial pesticide. J. Adv. Oxid. Technol. 2008, 11, 49–55. [Google Scholar] [CrossRef]
  83. Kundu, S.; Pal, A.; Dikshit, A.K. UV induced degradation of herbicide 2,4-D: Kinetics, mechanism and effect of various conditions on the degradation. Sep. Purif. Technol. 2005, 44, 121–129. [Google Scholar] [CrossRef]
  84. Tzompantzi, F.; Mantilla, A.; Bañuelos, F.; Fernández, J.L.; Gómez, R. Improved photocatalytic degradation of phenolic compounds with ZnAl mixed oxides obtained from LDH materials. Top. Catal. 2011, 54, 257–263. [Google Scholar] [CrossRef]
  85. Melián, E.P.; Díaz, O.G.; Rodríguez, J.M.D.; Araña, J.; Peña, J.P. Adsorption and photocatalytic degradation of 2,4-dichlorophenol in TiO2 suspensions. Effect of hydrogen peroxide, sodium peroxodisulphate and ozone. Appl. Catal. A Gen. 2013, 455, 227–233. [Google Scholar] [CrossRef]
  86. Macías-Sánchez, J.J.; Hinojosa-Reyes, L.; Caballero-Quintero, A.; De La Cruz, W.; Ruiz-Ruiz, E.; Hernández-Ramírez, A.; Guzmán-Mar, J.L. Synthesis of nitrogen-doped ZnO by sol-gel method: Characterization and its application on visible photocatalytic degradation of 2,4-D and picloram herbicides. Photochem. Photobiol. Sci. 2015, 14, 536–542. [Google Scholar] [CrossRef]
  87. Barik, A.J.; Gogate, P.R. Degradation of 2,4-dichlorophenol using combined approach based on ultrasound, ozone and catalyst. Ultrason. Sonochem. 2017, 36, 517–526. [Google Scholar] [CrossRef]
  88. Sánchez-Cantú, M.; Barcelos-Santiago, C.; Gomez, C.M.; Ramos-Ramírez, E.; Ruiz Peralta, M.D.L.; Tepale, N.; González-Coronel, V.J.; Mantilla, A.; Tzompantzi, F. Evaluation of Hydrocalumite-like compounds as catalyst precursors in the photodegradation of 2,4-Dichlorophenoxyacetic acid. Int. J. Photoenergy 2016, 5256941. [Google Scholar] [CrossRef] [Green Version]
  89. Djebbar, K.; Sehili, T. Kinetics of heterogeneous photocatalytic decomposition of 2,4-Dichlorophenoxyacetic acid over titanium dioxide and zinc oxide in aqueous solution. Pestic. Sci. 1998, 54, 269–276. [Google Scholar] [CrossRef]
  90. Anaya-Esparza, L.M.; Montalvo-González, E.; González-Silva, N.; Méndez-Robles, M.D.; Romero-Toledo, R.; Yahia, E.M.; Pérez-Larios, A. Synthesis and characterization of TiO2-ZnO-MgO mixed oxide and their antibacterial activity. Materials 2019, 12, 698. [Google Scholar] [CrossRef] [Green Version]
  91. Liu, Z.; Jin, Z.; Li, W.; Qiu, J. Preparation of ZnO porous thin films by sol–gel method using PEG template. Mater. Lett. 2005, 59, 3620–3625. [Google Scholar] [CrossRef]
Figure 1. Scanning Electron Microscopy images: (a) ZnON; (b) ZnOA.
Inorganics 10 00016 g001
Figure 2. Micrographics of TEM of ZnON (a) and ZnOA (d); SAED of ZnON (b) and ZnOA (e); and particle size distribution of ZnON (c) and ZnOA (f).
Inorganics 10 00016 g002aInorganics 10 00016 g002b
Figure 3. UV–Vis spectra and determination of the bandgap energies: (a) ZnON; (b) ZnOA.
Inorganics 10 00016 g003
Figure 4. X-ray diffraction patterns: (a) ZnON; (b) ZnOA.
Inorganics 10 00016 g004
Figure 5. FT-IR spectra: (a) ZnON; (b) ZnOA.
Inorganics 10 00016 g005
Figure 6. Nitrogen adsorption-desorption isotherms and the corresponding pore size distribution curves (inset): (a) ZnON; (b) ZnOA.
Inorganics 10 00016 g006
Figure 7. XPS spectra of nanomaterials: C1s (a), O1s (b), N1s (c) and Zn2p (d) with ZnON and ZnOA respectively.
Inorganics 10 00016 g007aInorganics 10 00016 g007b
Figure 8. Degradation activities: 2,4-D (a) and 2,4-DCP (b).
Inorganics 10 00016 g008
Figure 9. Experimental data and fitting assuming a pseudo-first order reaction rate: 2,4-D (a) and 2,4-DCP (b).
Inorganics 10 00016 g009
Figure 10. Comparison of the removal of Total Organic Carbon (TOC): 2,4-D (a) and 2,4-DCP (b).
Inorganics 10 00016 g010
Table 1. Bandgap energy (Eg), crystallite size, d-spacing values, and textural properties of ZnON and ZnOA materials.
CatalystEg (eV)dc (nm)d-Spacing (nm)SBET (m2g−1)VP (cm3g−1)dP (nm)
ZnON3.7917.20.24800.850.016.02
ZnOA3.0531.30.24722.240.025.78
Notes: dc: average crystallite size; SBET: BET surface area; Vp: pore volume; dp: average pore size.
Table 2. Atomic surface composition determined by XPS.
NameZnONZnOA
Atomic %Weight %Atomic %Weight %
Zn2p28.1645.0931.5867.42
C1s13.858.3527.3910.74
O1s57.5646.0940.4521.25
N1s0.430.470.580.59
Table 3. Percentage of degradation after 6 h f reaction.
Compound2,4-D2,4-DCP
Photolysis40.1% c73.6% b
ZnON74.7% b78.4% b
ZnOA90.9% a86.7% a
All values are mean ± standard deviation of three determinations. Different letters in each column indicate significant statistical differences between treatments (p < 0.05).
Table 4. Rate constant for the pseudo-first order kinetic equation and half-life time for the 2,4-D and 2,4-DCP degradation in presence of ZnO catalysts.
Compoundk (min−1) (10−3)t½ (min)
PhotolysisZnONZnOAPhotolysisZnONZnOA
2,4-D0.30.42394.5181.618.5
2,4-DCP0.30.40.5241.7162.7113.8
Table 5. Coefficient of correlation of kinetic Equation.
2,4-D2,4-DCP
PhotolysisZnONZnOAPhotolysisZnONZnOA
Kinetic zero order0.86780.98460.92000.93790.80400.9446
Kinetic first order0.86740.98470.91840.93770.80660.9432
Kinetic L-M Model0.91770.97940.94770.94990.83290.9715
Table 6. Mineralization (%) TOC for 2,4-D and 2,4-DCP.
Compound2,4-D2,4-DCP
Photolysis30% b40% c
ZnON53% a57% b
ZnOA56% a64% a
All values are mean ± standard deviation of three determinations. Different letters in each column indicate significant statistical differences between treatments (p < 0.05).
Publisher’s Note: MDPI stays neutral with regard to jurisdictional claims in published maps and institutional affiliations.

