Article

1 W High Performance LED-Array Based Optical Wireless Power Transmission System for IoT Terminals

FIRST, IIR, Tokyo Institute of Technology, R2-39, 4259 Nagatsuta, Midori-ku, Yokohama 226-8503, Japan
*
Author to whom correspondence should be addressed.
Photonics 2022, 9(8), 576; https://doi.org/10.3390/photonics9080576
Submission received: 29 July 2022 / Revised: 15 August 2022 / Accepted: 15 August 2022 / Published: 16 August 2022

Abstract

:
Optical wireless power transmission (OWPT) is a promising technology for remote energy supply, especially for powering Internet of things (IoT) terminals. Light-emitting diode (LED)-based power sources of OWPT are attractive for the development of high-performance systems without the constraints of safety issues. In this paper, the electricity output of a near-infrared LED-OWPT is significantly improved. The saturation output caused by the small lens aperture in the LED array collimation scheme was analyzed. The experiment achieved a maximum electricity output of more than 1 W from a 50 × 50 mm2 GaAs solar cell at 1 m transmission distance. In addition, the thermal features also proved the feasibility of a high-output LED-OWPT system for practical applications.

1. Introduction

Optical wireless power transmission (OWPT), in which energy is transmitted as light waves and converted into electrical power by an optical receiver at a remote position, is a promising candidate for powering Internet of Things (IoT) terminals due to the advanced features of long-distance transmission, high directionality, and no electromagnetic interference (EMI) [1,2]. Currently, IoT terminals are powered by batteries or connected to a power socket by a cable [3]. However, batteries limit the operating time and functions. They also enlarge the weight and dimensions of IoT products. Cable connections have a problem with installation work, and they are hard to supply for moveable or remote applications, such as micro-drones and mobile security cameras.
In recent years, the OWPT for IoT technology has been proposed to solve these issues [4,5]. In 2016, John Fakidis et al. demonstrated an indoor OWPT using red laser diodes to charge small cells at night [6]. In 2017, Diamantoulakis et al. presented the concept of simultaneous lightwave information and power transfer (SLIPT) with a solar panel-based receiver for indoor IoT applications [7]. Vikram Iyer et al. reported a laser-based OWPT system for charging mobile devices such as smartphones, and more than 2 W electricity output was achieved at 4.3 m distance from a 25 cm2 solar cell receiver [8]. In 2022, Qingwen Liu et al. showed an OWPT system using a resonant laser beam, and achieved more than 0.6 W electrical power to supply a smartphone in remote and mobile occasions [9]. Furthermore, OWPT systems have been marketed. Wi-Charge, a venture company, has developed and marketed OWPT systems for small terminals [10], but there is no detailed technical disclosure about the laser-based OWPT method.
Although a laser-based OWPT is advantageous in narrow beam and high power, due to the regulation restriction of laser products [11], all reported laser-based OWPT systems require eye safety features, such as a beam enclosure [6] and a shutdown system [8,9]. Except for special usage environments, in the near future, it will not be easy to use laser-based systems in crowded places.
Therefore, a high-performance light-emitting diode-(LED) based OWPT system was proposed as a power source for IoT terminals. LED-OWPT provides three advantages: loose safety regulations, simple heat dissipation requirements, and commercially available low-cost components. In addition, the light emission efficiency and output power per chip size of LEDs are improved to a similar level as semiconductor lasers. So far, most of the LED-OWPT research has been reported by the authors’ group. In 2019, an OWPT system was initially constructed with one near-infrared (NIR) LED of 810 nm wavelength and integrated into a portable power source [12]. A 0.2 W electricity output was achieved from a 2.9 cm2 GaAs solar cell at 1 m. In 2020, a 3-LEDs OWPT system with 0.4 W electricity output at 1 m was reported [13]. Furthermore, a 0.5 W electricity output was achieved by a novel lens design, and the system dimension was reduced by 56% [14]. However, former LED-OWPT systems still have limitations concerning the low electricity output even from solar cells over 25 cm2 in size.
In this paper, the electricity output is improved by a large number of LEDs and a collimation lens system. In Section 2, the effect factors and reasons for output saturation in LED-OWPT are analyzed. The saturated output is calculated from regression formulas and simulations under specific conditions. In Section 3, for the supply of small IoT terminals, a 3 × 3 array LED-OWPT system based on a collimation scheme is designed and characterized experimentally. The thermal features of the high output LED-OWPT are also measured for practical operation. In Section 4, the detailed and advanced characteristics of the systems with larger lens apertures are discussed.

2. Saturation Output of LED-OWPT in Small Size Receivers

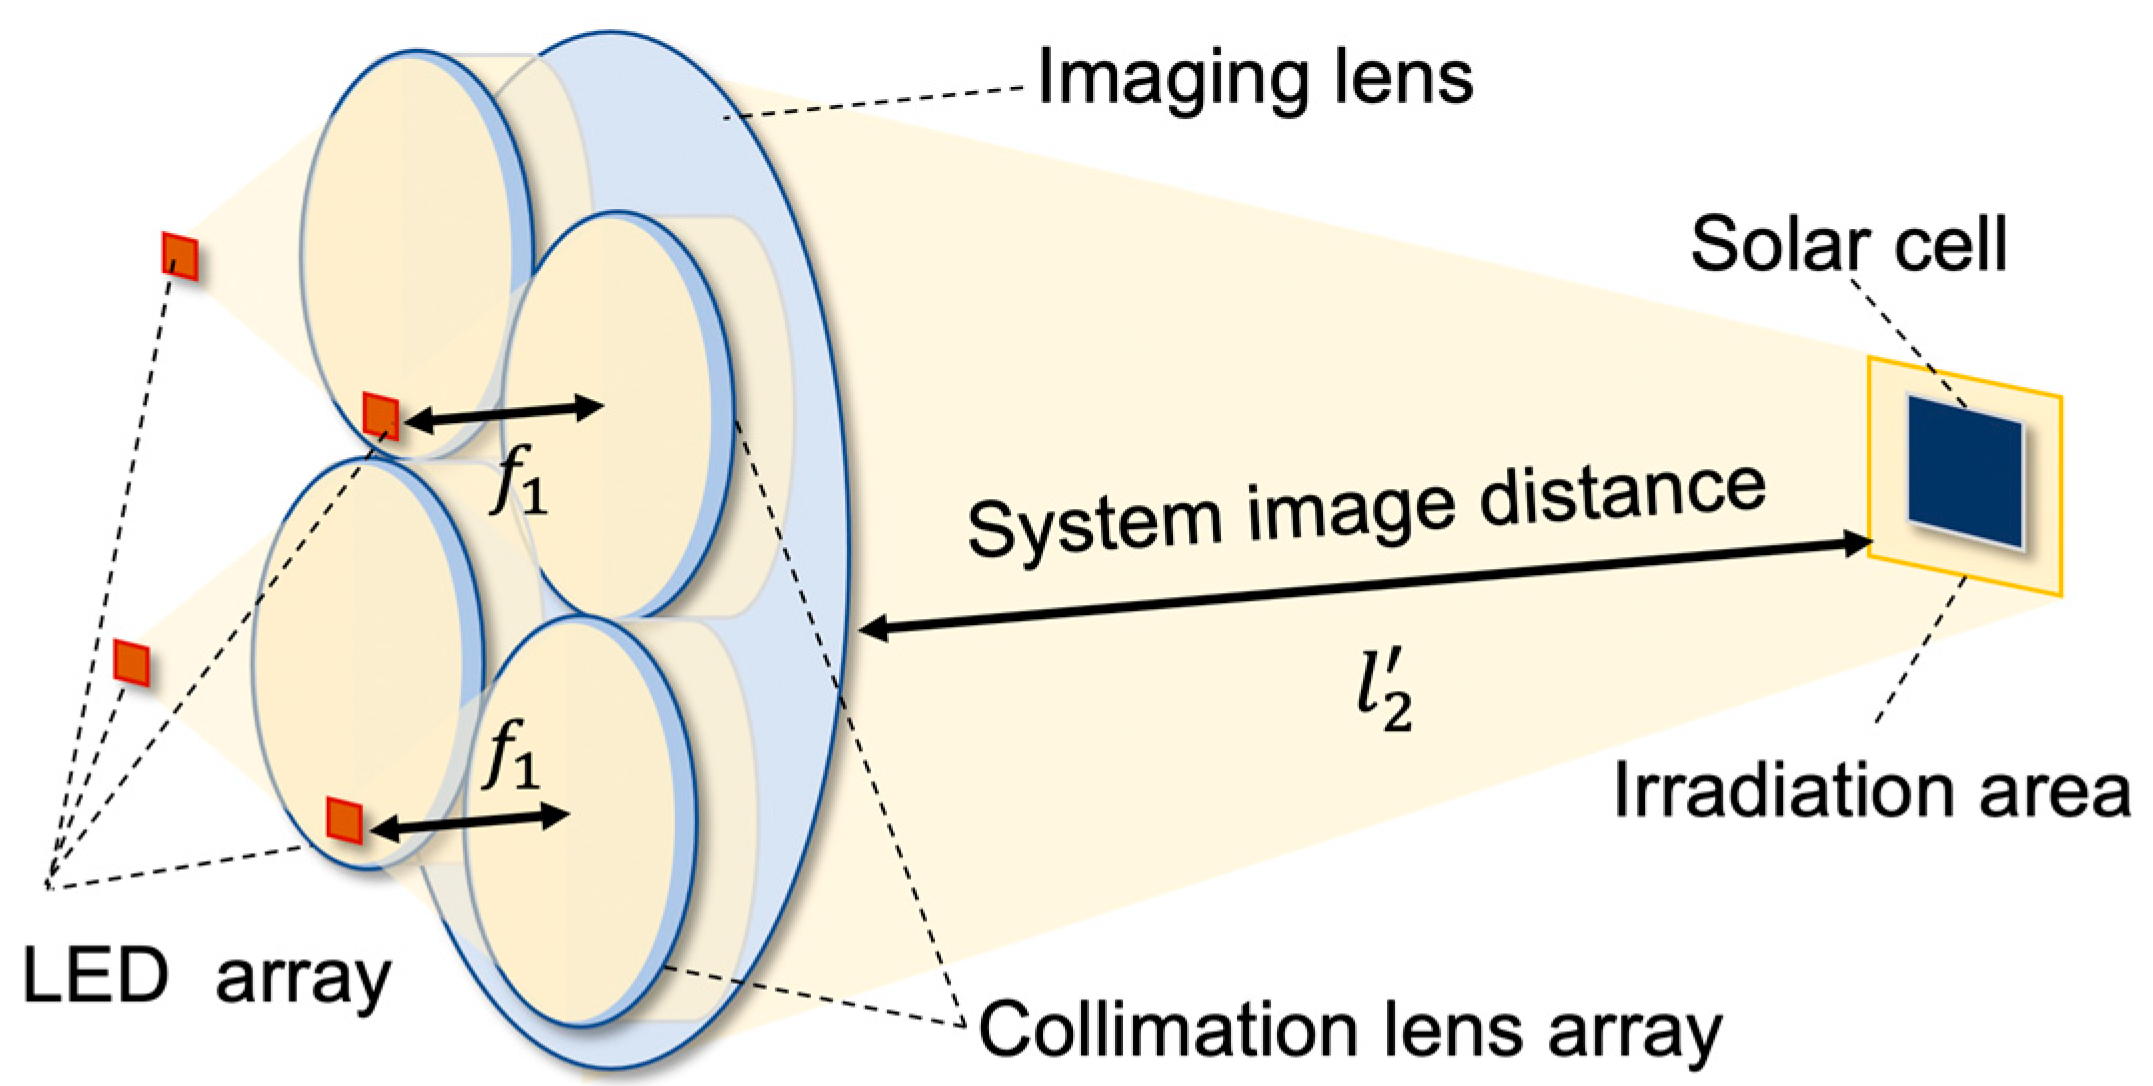
2.1. Effect Factors in LED-OWPT Collimation Schemes

A basic LED-OWPT system generally consists of three components: a light source, a lens system, and a light receiver. Due to the high photoelectric conversion efficiency of 40% in the reported experiments [15,16], a NIR monochromic LED with λ = 850 nm and a III-V semiconductor GaAs solar cell with 1.42 eV bandgap energy were applied as a high-efficiency power source and receiver combination. Currently, GaAs solar cells are expensive; however, cost reduction is expected through various manufacturing technologies and novel applications. In this research, due to the small dimension feature of the IoT terminals, the 50 × 50 mm2 size solar cell is considered as the maximum. In addition, except for the LED wavelength, the LED radiant flux and divergence angle also affect the OWPT output performance [14]. Based on former studies from the authors’ group [17], an LED model of SFH4715AS (ams OSRAM) with chip dimensions of 1 × 1 mm2 and a divergence angle of ±60° is selected as the light source [18]. An LED output performance is closely related to chip size, irradiation area, and light utilization efficiency. Since a larger chip size increases the irradiation beam size, the selection of the chip size also depends on the conditions of the target application.
After determining the LED model and solar cell, the most important process is to design a lens system. Unlike the high-quality laser beam, an LED emits spatially incoherent light with a sufficiently large area, and it cannot apply the diffraction-limited design of the beam and lens system. As shown in Figure 1, an LED-array system based on a collimation scheme is applied to enhance the output performance and maintain a small irradiation area. The first layer is a collimation lens array. Each LED is placed at the front focal point of the corresponding collimation lens. The generated collimated beams are then focused and overlapped onto the solar cell by one imaging lens.
The horizontal magnification β , which is the ratio of image height to object height, can be simplified as [14]:
β = l 2 f 1
where f 1 is the front focal length of the collimation lens, l 2 is the system image distance. In the collimation scheme, the side length of the irradiation spot is inversely proportional to the focal length of the collimation lens. Thus, with a fixed parameter image lens, the longer focal length of the collimation lens causes the smaller irradiation spot, which contributes to supplying small dimensions IoT terminals.
As lens system design guidelines for portable LED-OWPT, three essential requirements are high output, small irradiation area, and compact system dimension. However, these three requirements are in a trade-off relation. Compact system dimensions are expected to have a small lens aperture and a short distance from the LED to the lens. In a collimation scheme, the distance from the LED to the lens only depends on the focal length of the collimation lens, since the distance between the collimation lens and the imaging lens can be ignored. However, the short focal length of the collimation lens enlarges the irradiation area. Furthermore, due to the large divergence angle of the LEDs, the finite lens aperture size causes a serious beam leakage and decreases the system output and system efficiency.
In the LED array collimation scheme with a fixed-parameter imaging lens and a fixed-size solar cell, the electricity output is not infinite even with the unlimited number of LEDs. The output of the OWPT system can be improved by increasing the number of LEDs, and accordingly, the same number of collimation lenses should be applied. This decreases the aperture size of each collimation lens. To reduce beam leakage, these small aperture collimation lenses should be set closer to the LEDs, and the focal length of collimation lens is correspondingly reduced. Based on Equation (1), the irradiation spot area is enlarged. When the irradiation area is larger than the fixed light receiver area, only a limited proportion of the light irradiation power is converted to the electricity output. Most of the light power irradiates outside the solar cell and the leaked light is wasted. Therefore, even if the unlimited number of LEDs is increased, the electricity output from the fixed-area solar cell is no longer increased. This is the reason for the saturated output in a LED-array based OWPT.

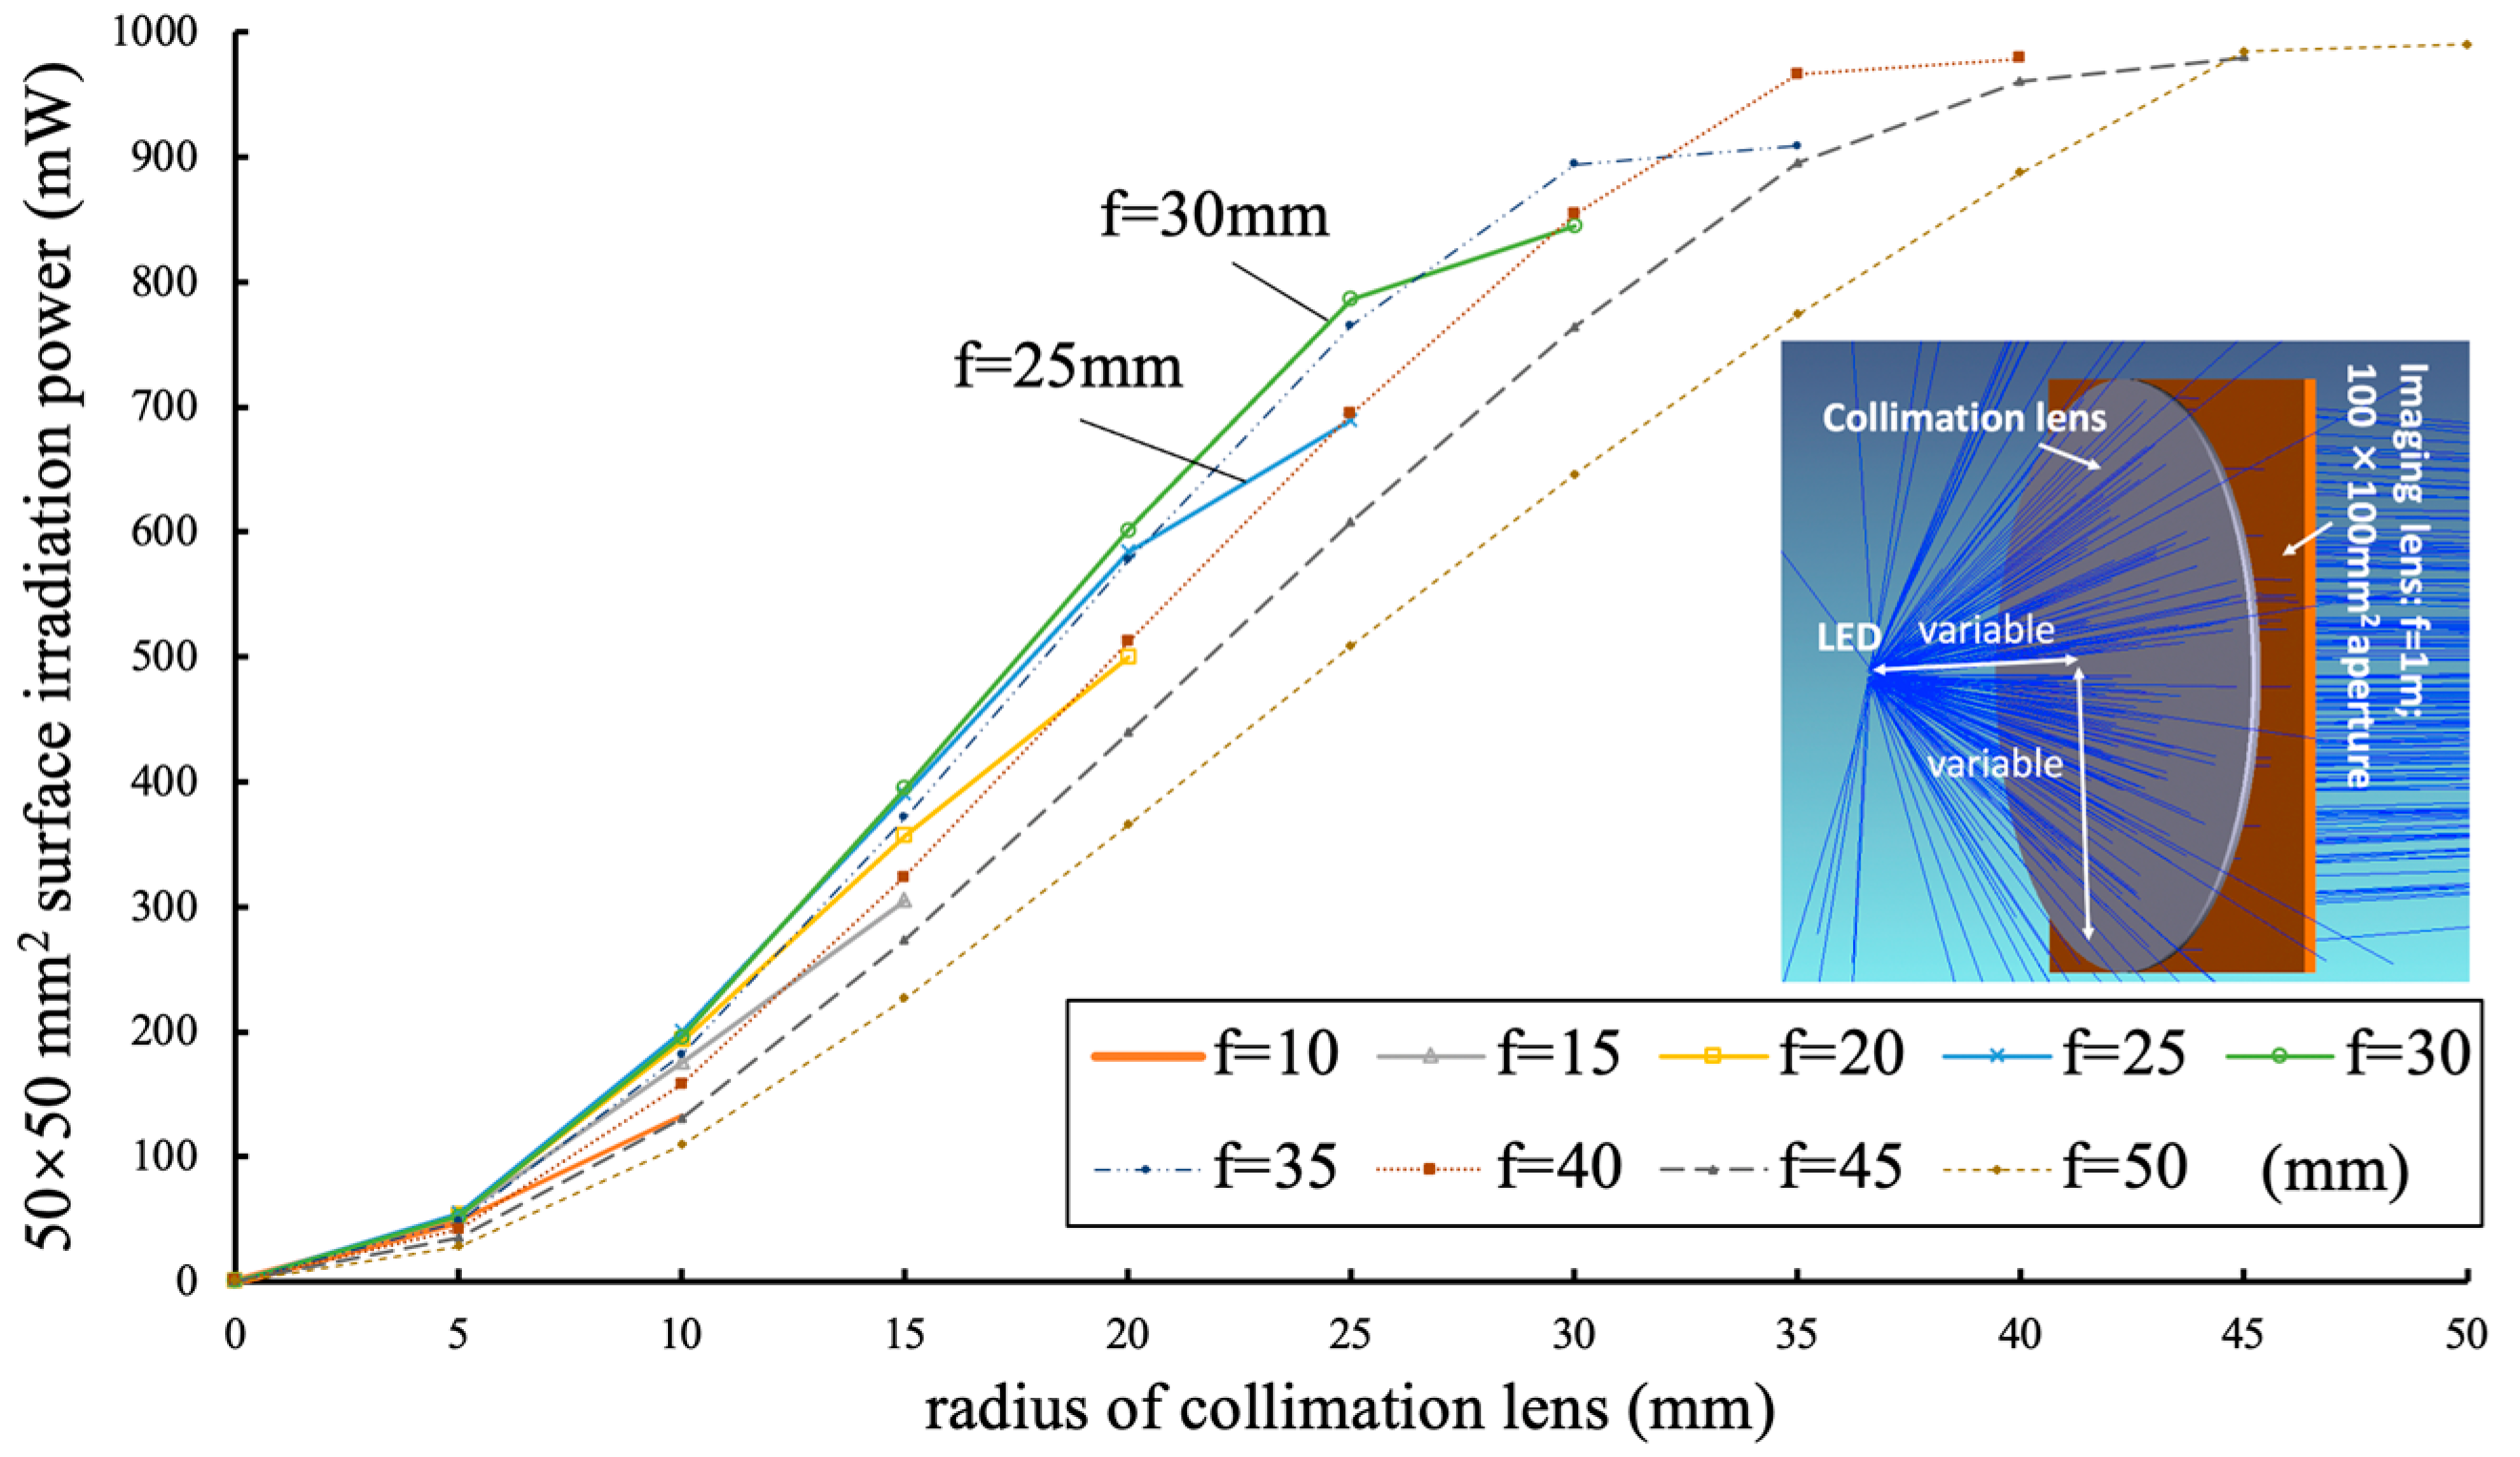
2.2. Numerical Analysis of LED-OWPT Saturated Output

Due to the complexity of the large number of LEDs and the corresponding lens parameters, n × n array LED models are assumed to simplify the analysis rather than an arbitrary LED arrangement. Since irradiation effects are assumed to be independent of each other, the solar cell electricity output P o of an n × n array LEDs-based OWPT is calculated as:
P o = I × n 2 × η c
Here, I is the solar cell surface irradiation of a single-chip LED-based OWPT. n 2 is the number of LEDs. η c is the solar cell conversion efficiency.
Thus, the numerical analysis of saturated output is separated into the following steps:
  • Optical simulation explores the relationship between the single LED irradiation power and the lens parameters.
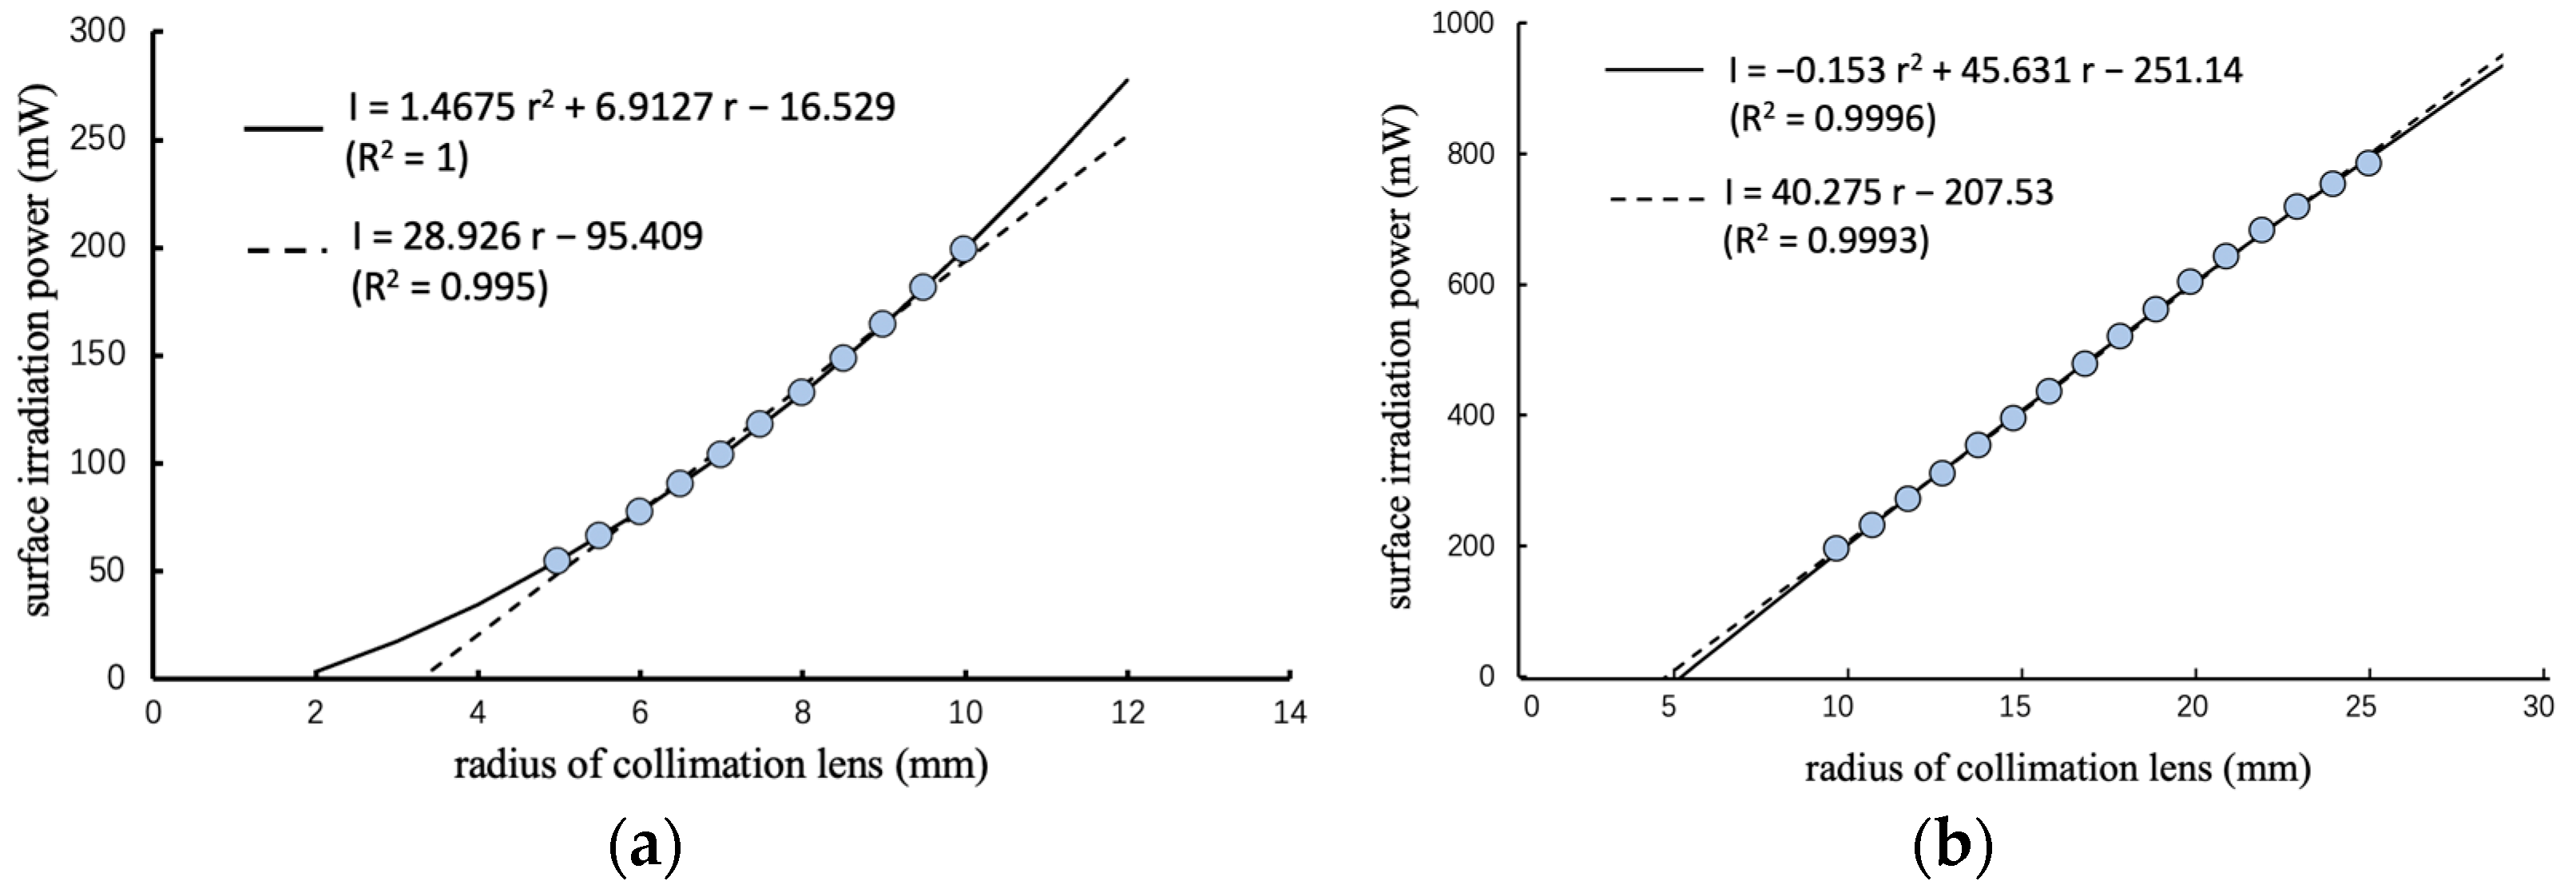
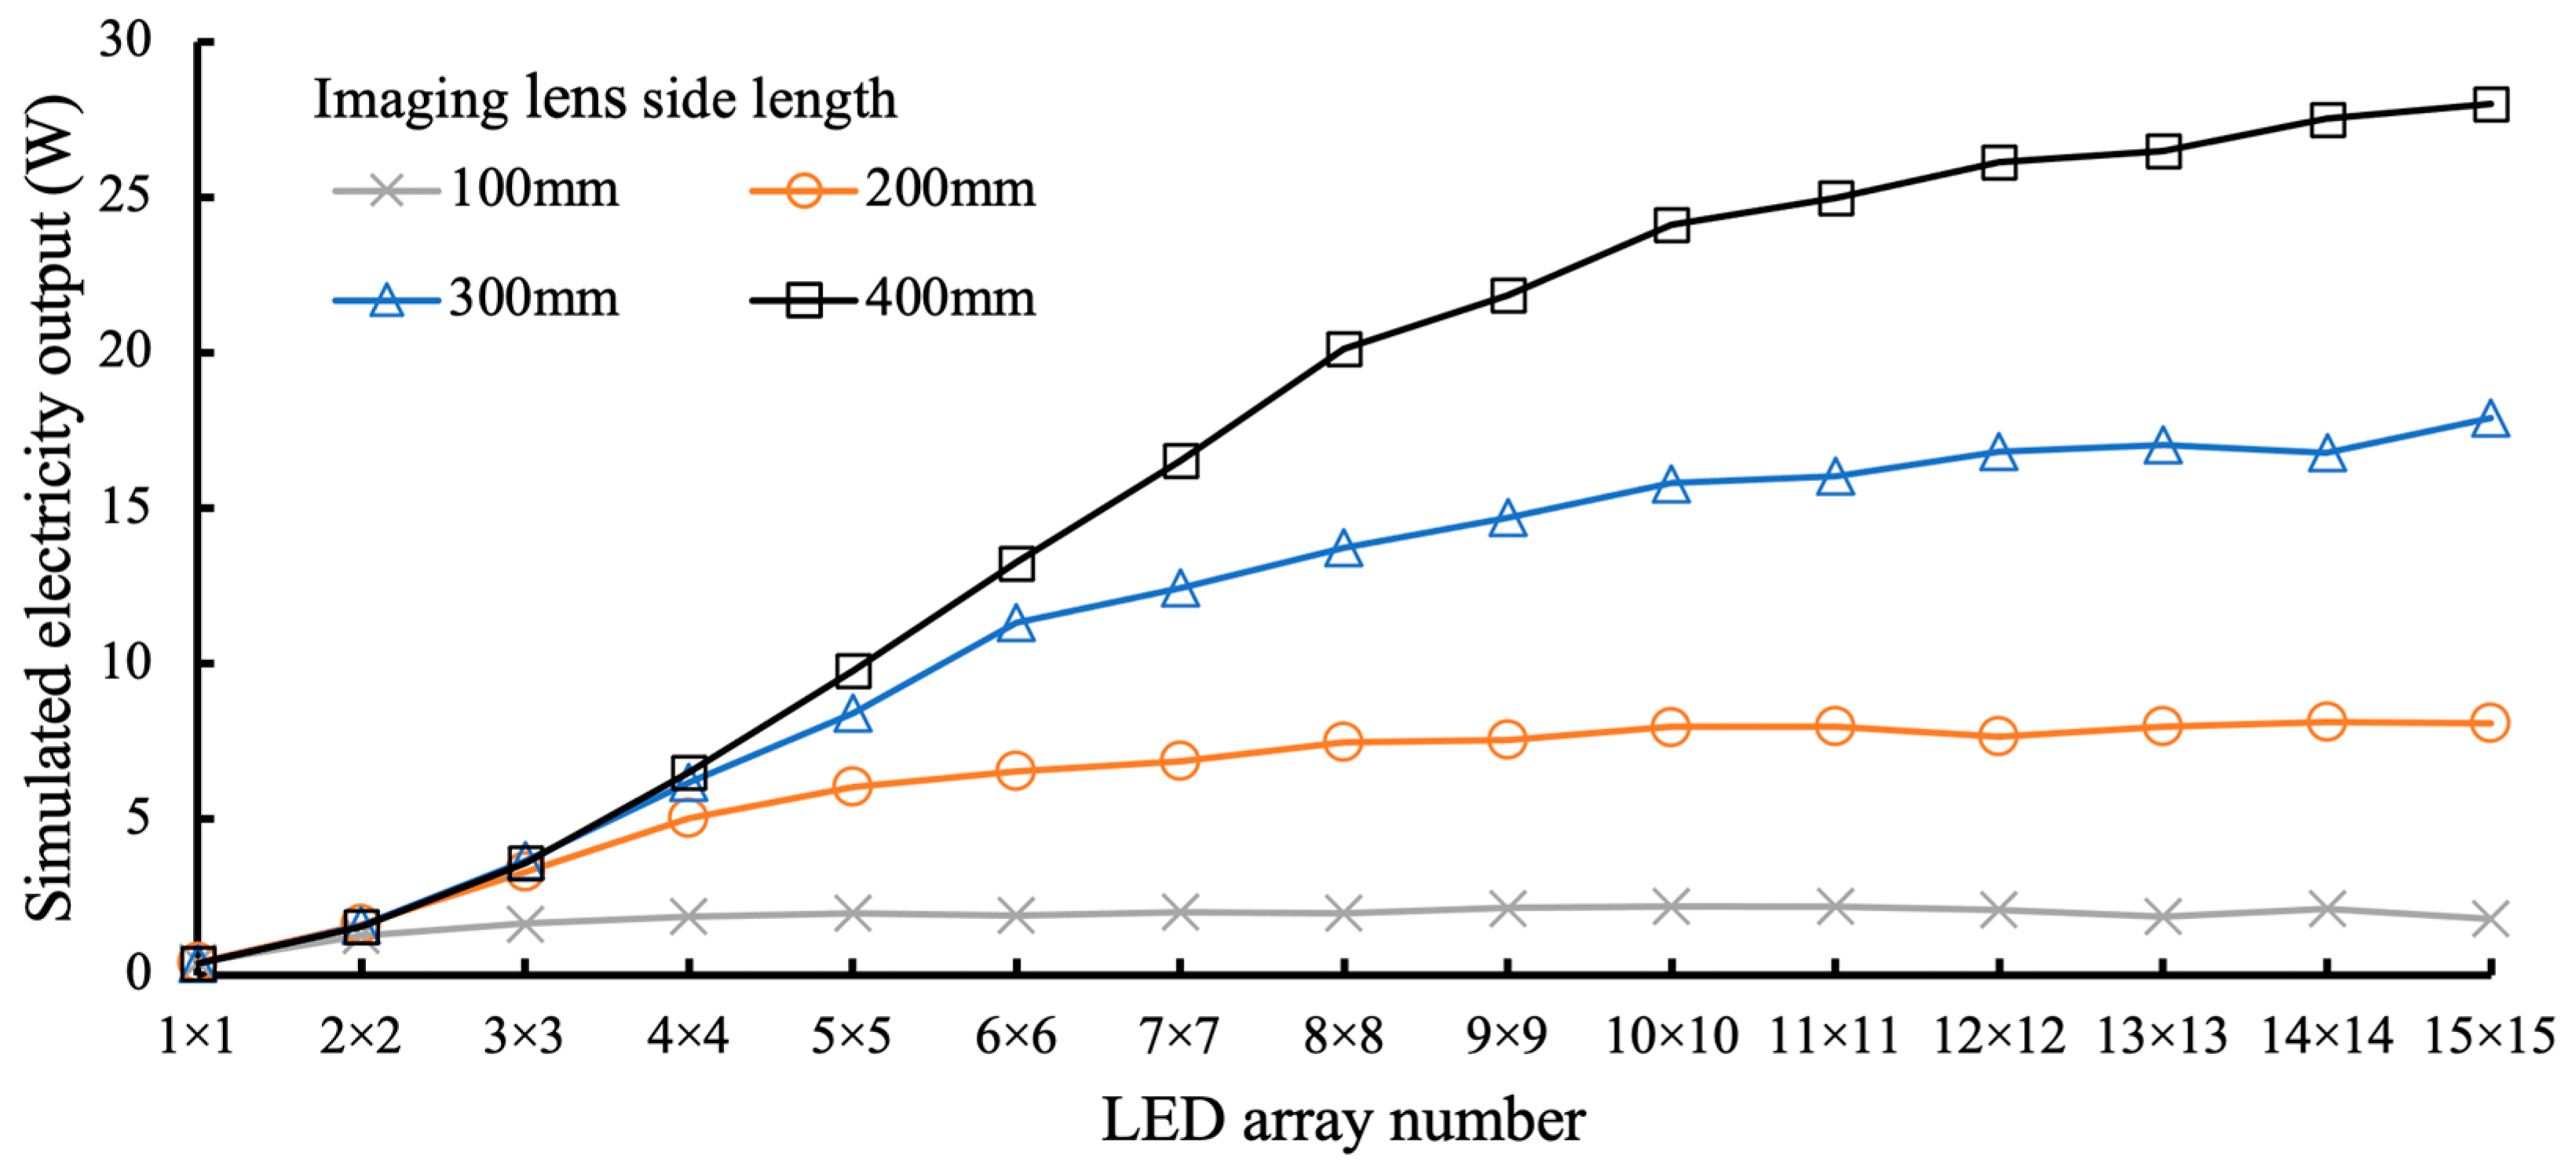
  • The regression equations are fitted to the obtained results, and then the equations are extended to the case of n × n array LEDs for calculating the maximum value.
  • The results are verified with simulations under the specific setup conditions.
As discussed in Section 2.1, a high-performance LED (OSRAM SFH4715AS; 850 nm, 1.53 W, ±60°) constitutes the light source module [18]. In this analysis, specific conditions are set to satisfy the portable device dimensions and the maximum receiver size of IoT terminals, which require a relatively high power. The parameters are as shown:
  • Imaging lens: 100 × 100 mm2 aperture; 1000 mm focal length.
  • GaAs solar cell: 50 × 50 mm2 size, 1000 mm away from the imaging lens.
To explore the optimal parameters of the collimation lens, the single LED collimation scheme is simulated using the optical design software ZEMAX. The parameters of the imaging lens are fixed. The collimation lens radius (r) is varied from 0 to 50 mm for the focal length (f) range of 10–50 mm. The surface irradiation power of a 50 × 50 mm2 area is shown in Figure 2.
Figure 2 shows that the irradiation power increases with the collimation lens radius aperture. The y-axis is the surface irradiation on a 50 × 50 mm2 area solar cell at a distance of 1 m from the imaging lens. It suggests the output performance of an OWPT system. In the large aperture range of 30 < r ≤ 50 mm, the dashed curves show that numerical aperture (NA) = 1 collimation lens, in which the focal length is the same as the radius, performs the optimal irradiation power. The reason is that the NA = 1 collimation lens accepts the maximum amount of the beam emitted from the LED with ±60° divergence. This is consistent with the previous research [14]. Furthermore, in the range of 10 < r ≤ 25 mm, f = 30 mm shows the local optimal irradiation power. In 0 < r ≤ 10 mm range, the difference between the curves is not obvious. The irradiation data is shown in Table 1. f = 25 mm collimation lens performs the local optimal irradiation. The reason is that the irradiation spot area is enlarged in the case of a small focal length collimation lens. Moreover, the small lens aperture also causes the larger beam leakage. Therefore, the optimal focal lengths for lens apertures of 0 < r ≤ 10 mm and 10 < r ≤ 25 mm are f = 25 mm and f = 30 mm, respectively.
In order to perform a more optimal design based on the discriminant data, a regression curve of the characteristics is obtained from the simulation results. The surface irradiation power of the collimation lens of f = 25 mm and f = 30 mm are selected as the scatter plot in Figure 3. They show that the surface irradiation power (I) for the 50 × 50 mm2 size increases with a collimation lens radius (r) of 0 < r ≤ 10 mm and 10 < r ≤ 25 mm, respectively. The surface irradiation powers are fitted by two modes of regression functions, a quadratic polynomial (solid line) and a linear function (dashed curve). The regression functions and the coefficient of determination R2 of the two modes are also shown in Figure 3.
As a result, the regression based on the quadratic polynomial has a higher coefficient of determination than the linear function. Thus, in the single LED-based collimation scheme, the mathematical relationship between the surface irradiation (I) and the collimation lens radius (r) is fitted to the following equations.
I = 0.153   r 2 + 45.631   r 251.14       10 < r 25
I = 1.4675   r 2 + 6.9127   r 16.529       5 < r 10
In the n × n array LEDs model, an imaging lens with a 100 × 100 mm2 aperture is fixed to maintain the compact size system, and the collimation lens cannot exceed this range. Therefore, the relation between the collimation lens radius (r) and the square root of LED numbers ( n ) is shown:
r = 100 / 2 n = 50 / n
Substitute Equation (5) into Equations (3) and (4), respectively, and then multiply the number of LEDs ( n 2 ), so the total irradiation on the solar cell surface ( I ) is shown:
I = 16.53   n 2 + 345.64   n + 3668.75       n > 5
I = 251.14   n 2 + 2281.55   n 382.5       2 < n 5
The maximum coordinates of quadratic Equations (6) and (7) are (n = 4.54, I = 4799.34) and (n = 10.45, I = 5475.57), respectively. It suggests that a collimation scheme based 10 × 10 array LEDs probably performs the maximum output. Even if LED numbers are extended from 10 × 10 to infinite, the surface irradiation power is saturated under specific conditions. In order to obtain the output by numerical simulations, a collimation scheme using up to 12 × 12 array LEDs is also simulated in Zemax. Figure 4 shows the regression tendency (dashed curve with triangle marks) and the simulation results (solid curve with circle marks).
The secondary axis is the expected electricity output, which is the product of the corresponding surface irradiation and the conversion efficiency of the solar cell, as shown in Equation (2). The conversion efficiency is assumed to be 40%, according to the evaluated efficiency of the applied GaAs solar cells [12,14]. In Figure 4, the regression and the simulation curves are almost consistent. From 1 × 1 to 5 × 5 array LEDs, the electricity output increases significantly. When the number of LEDs are over 6 × 6, the simulated results fluctuate slightly. It is caused by the attenuated irradiation by small aperture of the collimation lens. For example, in the simulation, the surface irradiation of a single LED with a collimation lens of r = 10 mm (5 × 5 array situation) is 199 mW. On the other hand, that with r = 8.33 mm (6 × 6 array situation) is 132 mW. Therefore, the total surface irradiation of 6 × 6 array LEDs is decreased in comparison with 5 × 5 array.
The output is saturated at around 10 × 10 array. At a distance of 1 m from the imaging lens, the saturated surface irradiation is 5414.43 mW in the numerical simulation. Thus, for an n × n array LEDs OWPT with the specific conditions of a 100 × 100 mm2 lens aperture and a 50 × 50 mm2 area solar cell, 2.17 W is expected as the saturated electricity output at 1 m by 10 × 10 array LEDs and f = 25 mm collimation lenses.

3. Experimental Demonstration of High Output LED-OWPT

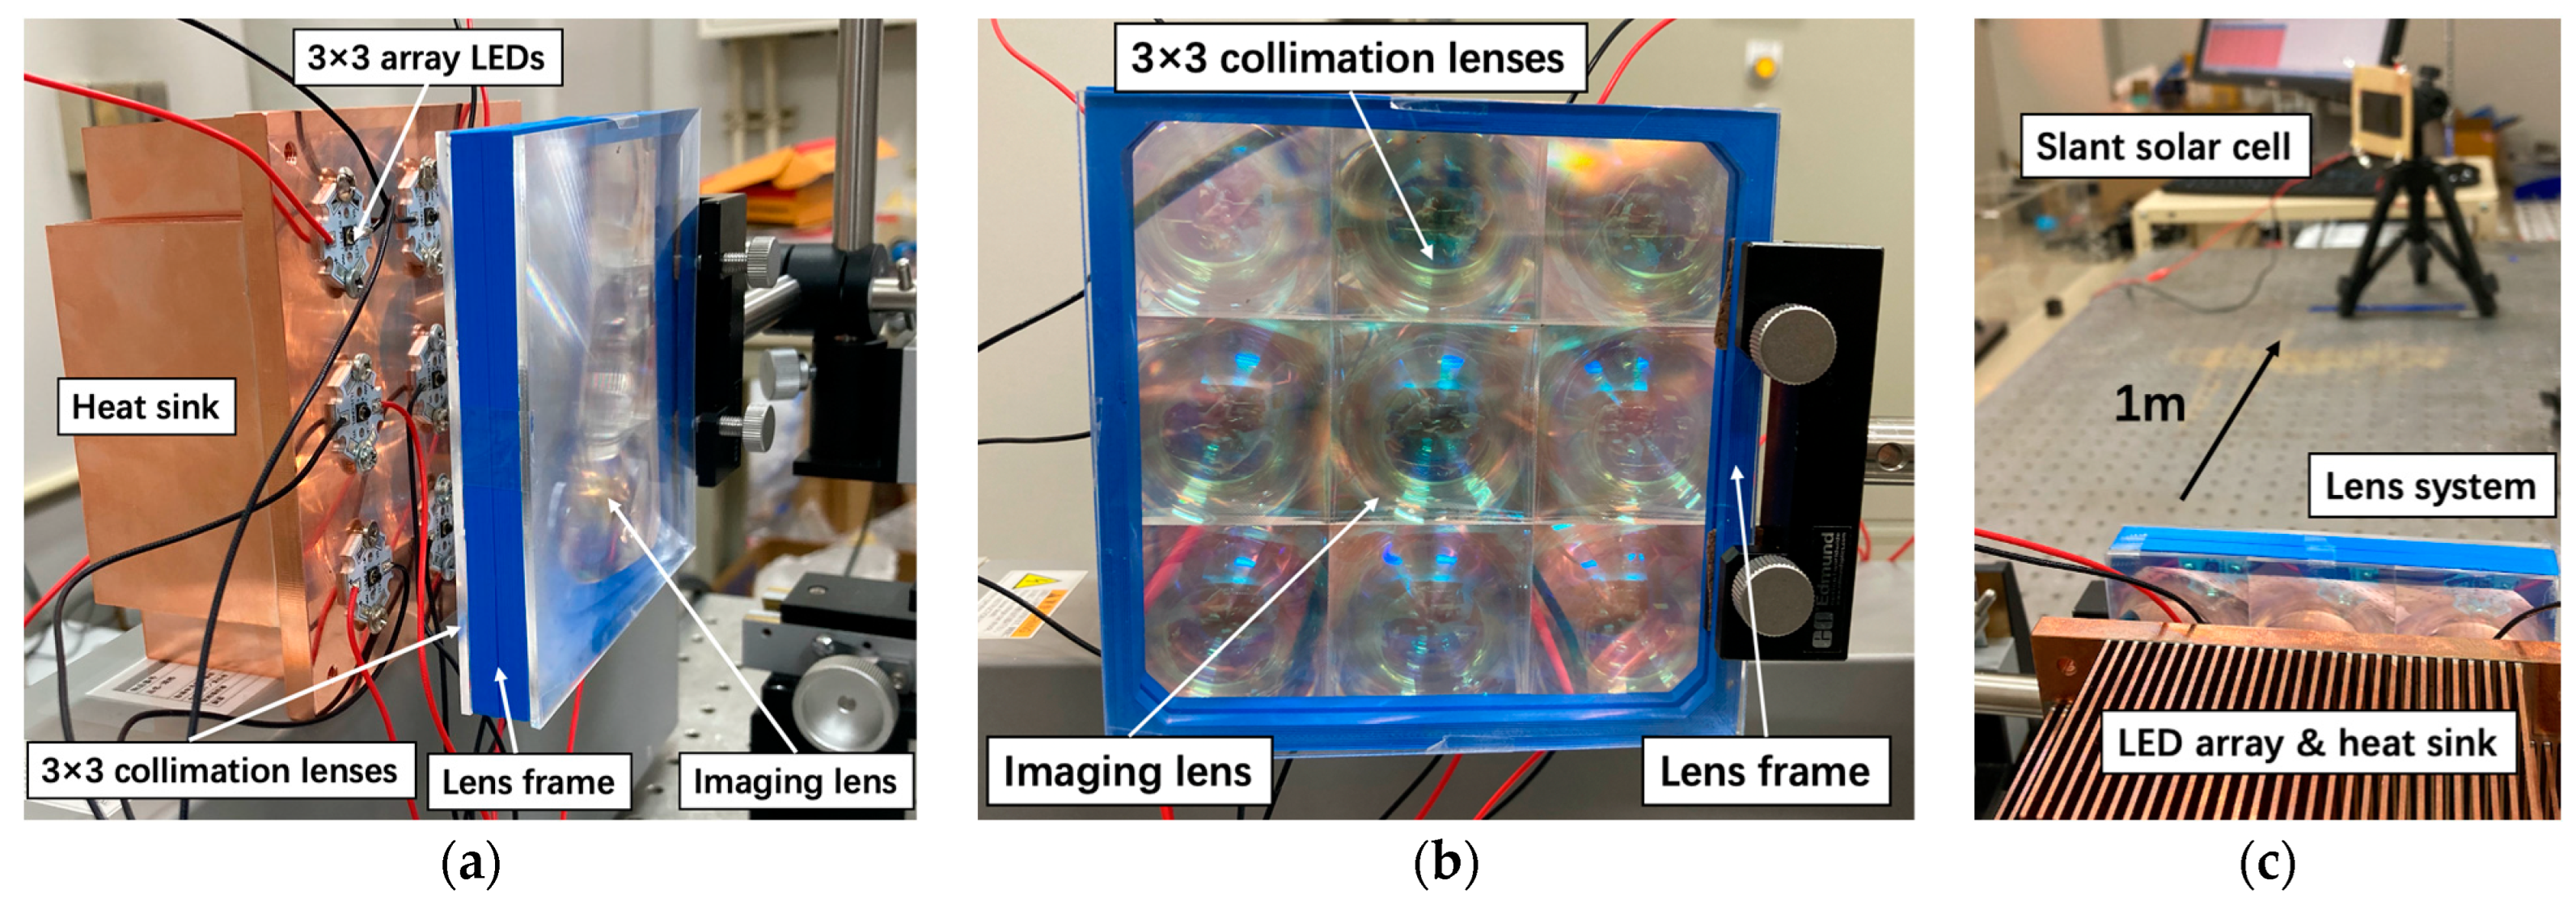
3.1. Design and Experiment Setup of 3 × 3 Array LED-OWPT

Although a 10 × 10 array LEDs configuration performs the maximum output in the numerical simulation, there are two issues for practical configurations. First, the increased number of LEDs and lenses causes misalignment errors, resulting in a deterioration of the performance from the ideal characteristics [19]. The second is the serious heat issue, because the system is integrated into a small area heat sink. Thus, a 3 × 3 array LEDs module is constructed as the experimental setup of this study.
As for the system design, the same nine LEDs (OSRAM SFH4715AS) were arranged in a 3 × 3 array. The distance between two adjacent LEDs was 33 mm. Nine collimation lenses (r = 16.5 mm, f = 30 mm) and one imaging lens (a = 100 × 100 mm2, f = 1 m) formed the lens system. Due to the non-imaging optical system design, minor imaging aberrations were ignored. Therefore, Fresnel lenses were applied as all lenses. Fresnel lenses are extremely lightweight and have a thin thickness. Each LED was placed at the front focal point of the collimation lens, so the distance between the LED and the collimation lens was 30 mm. The simulated configuration is shown in Figure 5. Each LED has the same parameters, and the wavelength is 850 nm.
The experiment setup followed the numerical simulation design. The parameters of the collimation lenses (NTKJ, CF30) and the imaging lens (NTKJ, CF1000) [20] were the same as in the simulation. In particular, collimation lenses were integrated with a 3 × 3 square shape by special order to the lens manufacturer. This process improved the lens position accuracy. Every three LEDs were connected in series, and three groups were connected in parallel. The applied voltage and current were 11.4 V and 4.5 A, respectively. A 5-series connected GaAs solar cell module (Advanced Technology Institute, LLC) with an area of 50 × 85 mm2 was placed at 1000 mm away from the lens system, which was larger than the simulation design. Since the partial irradiation on a series-connected solar cell module significantly reduces the conversion efficiency [21], as one of the potential options in a tentative experiment, the solar cell was rotated to reduce the projection area on the beam propagation path. The projection area was approximately equal to the expected 50 × 50 mm2 with a rotation angle of 54° in the horizontal direction.
The experimental setup of the 3 × 3 LED-array OWPT system is shown in Figure 6. The lens frame shown in blue color was fabricated by a 3D printer based on the fused deposition modeling (FDM) method. A total of nine LEDs were set on a 120 × 120 × 50 mm3 copper heatsink. LED chips were mounted on a ceramic board with a diameter of 2 cm and fixed to the heat sink with screws via the heat conductive paste.

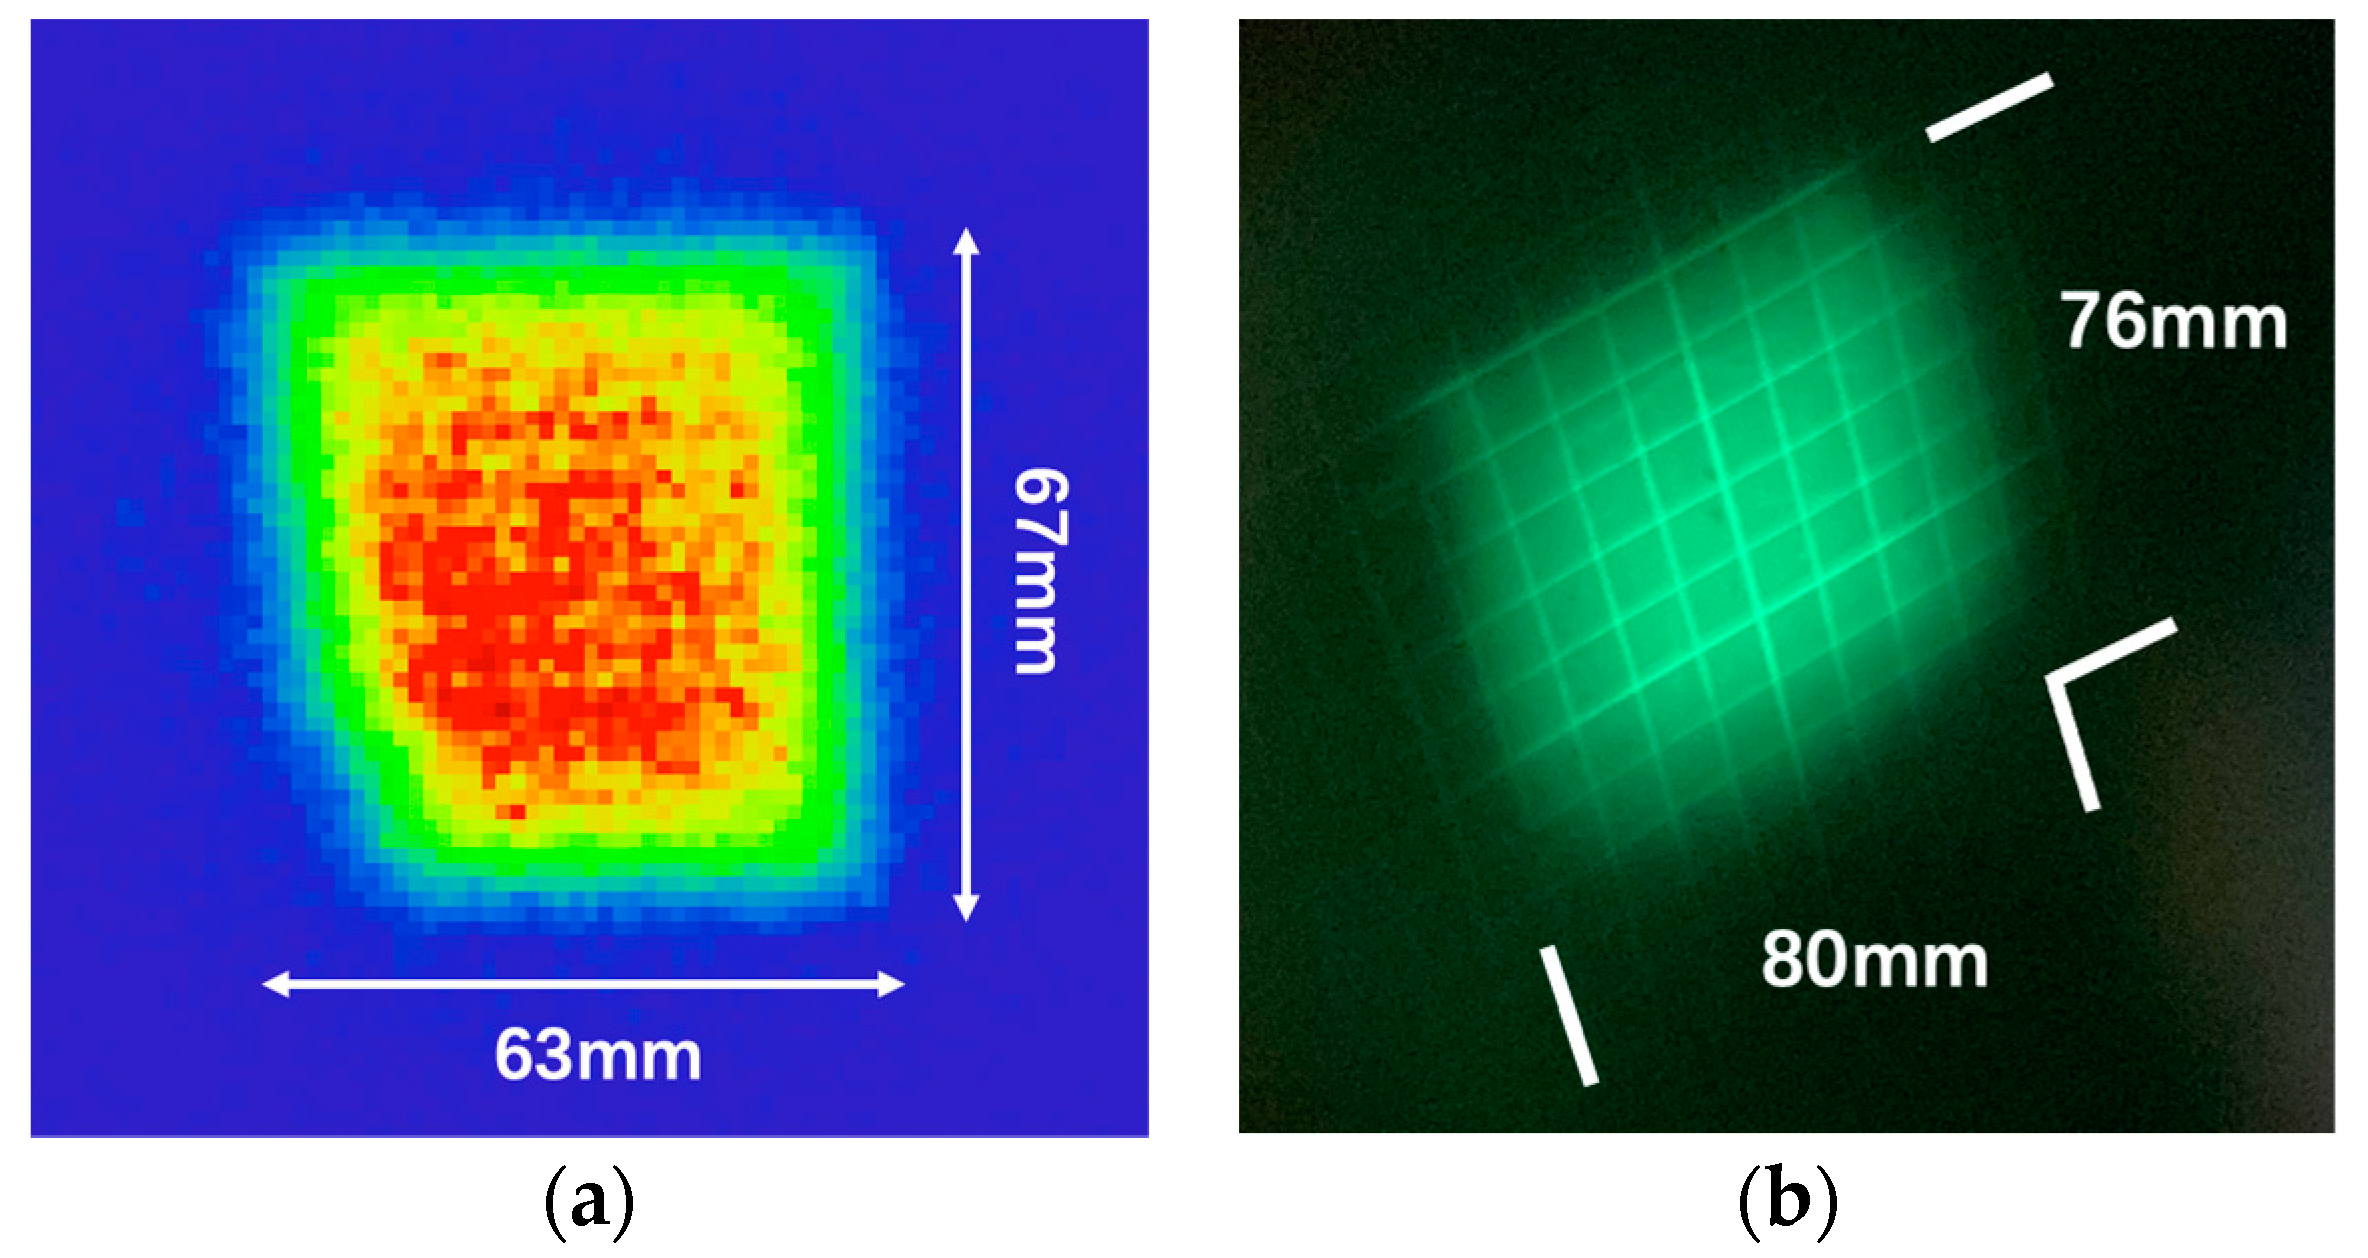
3.2. Results and Analysis

The detailed simulation and experimental results are shown in Table 2. The simulation results show that the total irradiation power after the lens system is 5.37 W. The lens system efficiency, which is the ratio of total irradiation power to total LED radiant, is 39.7%. The low lens system efficiency is caused by the beam leakage. As shown in Figure 5a, due to the collimation lens with NA = 0.55, each LED radiant beam from ±30° to ±60° is not collimated and scattered to other directions. As the beam leakage, about 52.8% of the radiation flux from the LED is lost. Figure 7a shows the numerically simulated irradiation spot at 1 m. The spot area is 63 × 67 mm2. The irradiation power on a 50 × 50 mm2 area at 1 m is 3.98 W.
In the experiment, an output monitor (ADCMT, 6243 DC monitor) was connected with the GaAs solar cell to measure the electricity output. The maximum power of 1.035 W was achieved from a 50 × 50 mm2 area solar cell at 1 m. The open circuit voltage and the short circuit current were 5.12 V and 0.32 A, respectively. The fill factor (FF) was 0.63.
Figure 7b shows the irradiation spot of 76 × 80 mm2 area in the experiment, observed by an infrared viewer (Electrophysics, ElectroViewer 7215, Fairfield, NJ, USA). The scale of the grid board was 10 mm. Due to lens misalignment, the irradiation spot from each LED was not completely overlapped [19]. It caused a slightly enlarged irradiation spot and reduced electricity output. The surface irradiation of 50 × 50 mm2 area at 1 m was 2.65 W. Thus, the conversion efficiency of the solar cell was 39.1%.
With the same system dimensions and a smaller receiver size than in previous research [14], the electrical output of the proposed system increased 1.96 times. The output was twice the power under AM1.5G (1 kW/m2) sunlight with an 18% conversion efficiency Si solar cell [22]. A 1 W of electricity output can provide power for most of the sensor-based IoT terminals. In particular, because the light source is an invisible infrared LED, it will not disturb the surroundings or users.

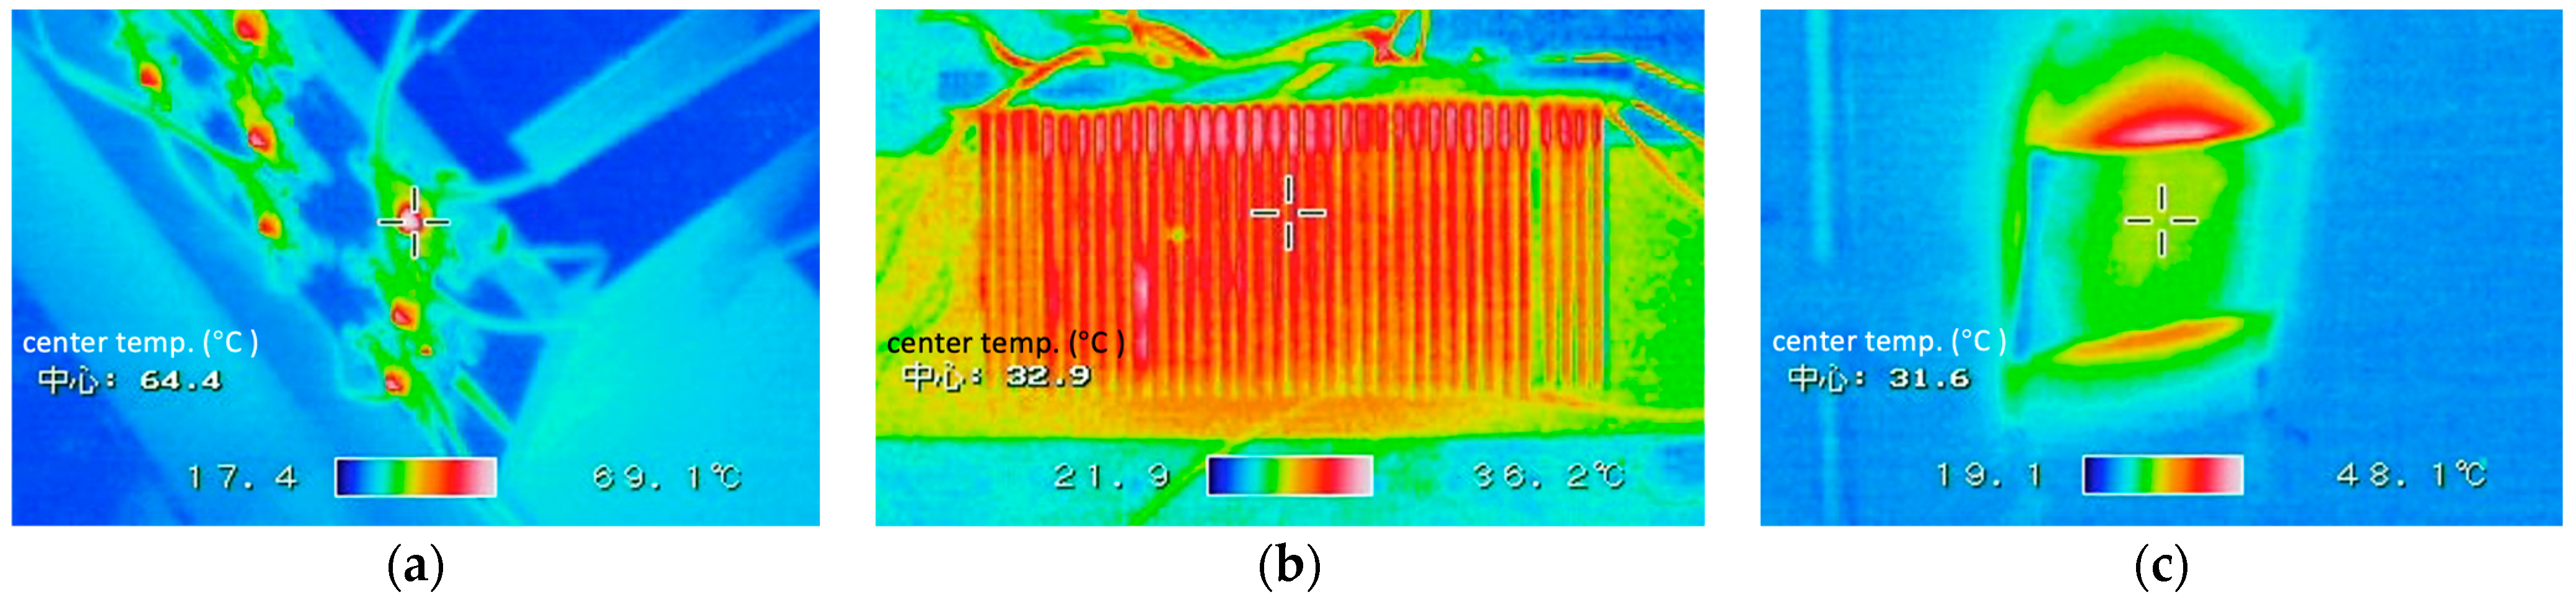
3.3. Thermal Features of High-Power LED-OWPT

Considering the heat issues of the high-power LED-OWPT system, the temperatures of the OWPT components were also measured in the experiment by a thermal shot camera (Avio Infrared Ltd., F30W, Yokohama, Japan). In order to test the maximum temperature of the receiver side, the solar cell was attached to a paperboard without a heatsink. The ambient temperature was 24 °C, and the LED-OWPT system illuminated the GaAs solar cell for 30 min.
Figure 8 shows the thermal images, and the temperature shown on the bottom right is the highest temperature in the image. The maximum temperature of the LED chip was 69.1 °C in Figure 8a, and the heatsink was 36.2 °C in Figure 8b. The maximum temperature of the solar cell and the back paperboard were 31.6 °C and 48.1 °C, respectively. The thermal conductivity of the paperboard is extremely small, of around 0.05 W·m−1K−1 [23]. Considering plastics (0.1~0.3 W·m−1K−1) or metals (>50 W·m−1K−1) [24,25,26,27], heat dissipation will be more effectively applied to the practical IoT terminals. The obtained maximum temperature of the solar cell did not attenuate the conversion efficiency [28]. This suggests that the receiving side temperatures of the LED-OWPT components will be accepted in household scenarios. With thinner and lighter aluminum heatsinks, a 3 × 3 array LEDs-based OWPT system can be integrated as a compact and portable power source module.

4. Discussion of Electricity Output and Lens Aperture

The saturation output described in Section 2 is under the specific conditions of a 100 × 100 mm2 aperture imaging lens. As the final analysis, although the small sizes are the requirement for portable devices, larger system sizes are also analyzed in consideration of various application conditions. If the collimation lens aperture increases with the increasing imaging lens aperture, the beam leakage will be decreased and the radiant power after lens system will be enlarged. In this case, the irradiation beam size is maintained. The relation between lens aperture and corresponding electricity output is simulated as shown in Figure 9, where Y-axis is the expected electricity output from a 50 × 50 mm2 GaAs solar cell at 1 m.
The gray curve with cross marks is the simulated electricity output of the 100 × 100 mm2 imaging lens condition, which is consistent with the solid curve in Figure 4. With the increasing aperture of the imaging lens, the electricity output is significantly improved. When the side length of the imaging lens is enlarged by two times (orange circle marks) from 100 mm to 200 mm, even for the 3 × 3 array LEDs, the simulated electricity output is 3.31 W, which is 1.5 times higher than the saturation output of the 100 × 100 mm2 lens aperture system. If the side length of the lens increases four times (black square marks), a 10 × 10 LEDs system will output 24.1 W, which is 11 times higher than the saturated output of a 100 mm side length imaging lens. In addition, the saturated value and the corresponding number of LEDs also increase with lens apertures. For example, a 14 × 14 array LEDs show a saturated electricity output of 8.12 W with the side length = 200 mm imaging lens (orange circle marks). Without the module size limitation, it is noted that increasing lens aperture can significantly improve the output while maintaining the same power consumption, thereby increasing the lens system efficiency.

5. Conclusions

In this paper, the design of a portable LED-OWPT system was analyzed to improve output performance by LED arrays. In collimation schemes, the electricity output, the irradiation area, and the system dimensions are three essential factors, but they are in tradeoff relation. In the LED array system with a small aperture imaging lens, the irradiation power saturates even if the number of LEDs is increased to infinite. With a 100 × 100 mm2 size imaging lens and a 50 × 50 mm2 solar cell at 1 m transmission distance, 2.2 W is expected as the saturated electricity output by 10 × 10 array LEDs. In the experiment, 1 W electricity output was achieved by a 3 × 3 array LED configuration and a 50 × 50 mm2 GaAs solar cell at 1 m transmission distance. In addition, the temperatures of the components in the high-power LED-OWPT were measured. The thermal features proved that the 1 W class output LED-OWPT system can be applied for practical applications, especially for small-dimension IoT terminals. A larger module size can achieve higher performance. The obtained design guideline and experimentally achieved performance will be used in practical OWPT systems in the near future.

Author Contributions

Conceptualization and methodology, M.Z. and T.M.; Software, experiment, validation, and data curation, M.Z.; Formal analysis, T.M.; Writing—original draft preparation, M.Z.; Writing—review and editing, T.M.; Supervision, administration and funding acquisition, T.M. All authors have read and agreed to the published version of the manuscript.

Funding

This research was partly funded by Tsurugi-Photonics Foundation (No. 20220502) and Takahashi Industrial and Economic Research Foundation (No. I2-003-13).

Institutional Review Board Statement

Not applicable.

Informed Consent Statement

Not applicable.

Data Availability Statement

Not applicable.

Conflicts of Interest

The authors declare no conflict of interest.

References

  1. Miyamoto, T. Optical wireless power transmission using VCSELs. In Semiconductor Lasers and Laser Dynamics VIII; SPIE Photonics Europe: Strasbourg, France, 2018; Volume 10682. [Google Scholar]
  2. Zhao, M.; Miyamoto, T. High output and high efficiency handy-sized LED-array based optical wireless power transmission system using Fresnel lenses. In Proceedings of the 26th Microoptics Conference (MOC2021), Hamamatsu, Japan, 27–29 September 2021. [Google Scholar]
  3. Lee, I.; Lee, K. The Internet of Things (IoT): Applications, Investments, and Challenges for Enterprises. Bus. Horiz. 2015, 58, 431–440. [Google Scholar] [CrossRef]
  4. Putra, A.W.S.; Kato, H.; Adinanta, H.; Maruyama, T. Optical wireless power transmission to moving object using galvano mirror. In Proceedings of the Free-Space Laser Communications XXXII, San Francisco, CA, USA, 3–4 February 2020; Volume 11272, pp. 314–322. [Google Scholar]
  5. Nguyen, D.H. Optical wireless power transfer for moving objects as A life-support technology. In Proceedings of the 2020 IEEE 2nd Global Conference on Life Sciences and Technologies, Kyoto, Japan, 10–12 March 2020. [Google Scholar]
  6. Fakidis, J.; Videv, S.; Kucera, S.; Claussen, H.; Haas, H. Indoor Optical Wireless Power Transfer to Small Cells at Nighttime. J. Lightwave Technol. 2016, 34, 3236–3258. [Google Scholar] [CrossRef]
  7. Diamantoulakis, P.D.; Karagiannidis, G.K. Simultaneous lightwave information and power transfer (SLIPT) for indoor IoT applications. In Proceedings of the IEEE Global Communications Conference, Singapore, 4–8 December 2017. [Google Scholar]
  8. Iyer, V.; Bayati, E.; Nandakumar, R.; Majumdar, A.; Gollakota, S. Charging a Smartphone Across a Room Using Lasers. Proc. ACM Interact. Mob. Wearable Ubiquitous Technol. 2018, 1, 1–21. [Google Scholar] [CrossRef]
  9. Liu, Q.; Xiong, M.; Liu, M.; Jiang, Q.; Fang, W.; Bai, Y. Charging A Smartphone Over the Air: The Resonant Beam Charging Method. arXiv 2022, arXiv:2105.13174. [Google Scholar] [CrossRef]
  10. Wi-Charge, the Wireless Power Company. Available online: https://www.wi-charge.com (accessed on 23 June 2022).
  11. IEC 60825:2022 SER. Available online: https://webstore.iec.ch/publication/62424 (accessed on 13 June 2022).
  12. Zhou, Y.; Miyamoto, T. 200 mW-Class LED-Based Optical Wireless Power Transmission for Compact IoT. Jpn. J. Appl. Phys. 2019, 58, SJJC04. [Google Scholar] [CrossRef]
  13. Zhou, Y.; Miyamoto, T. 400 mW Class High Output Power from LED-Array Optical Wireless Power Transmission System for Compact IoT. IEICE Electron. Express 2021, 18, 20200405. [Google Scholar] [CrossRef]
  14. Zhao, M.; Miyamoto, T. Optimization for Compact and High Output LED-Based Optical Wireless Power Transmission System. Photonics 2022, 9, 14. [Google Scholar] [CrossRef]
  15. Würfel, P.; Würfel, U. Physics of Solar Cells: From Basic Principles to Advanced Concepts, 3rd ed.; John Wiley & Sons: Hoboken, NJ, USA, 2016; pp. 160–172. [Google Scholar]
  16. Carr, W.N. Characteristics of a GaAs Spontaneous Infrared Source with 40 Percent Efficiency. IEEE Trans. Electron Devices 1965, 12, 531–535. [Google Scholar] [CrossRef]
  17. Zhao, M.; Miyamoto, T. Numerical analysis of maximum output in LED-based optical wireless power transmission system. In Proceedings of the 69th JSAP Spring Meeting, Online, 22–26 March 2022. [Google Scholar]
  18. SFH4715AS OSRAM Semiconductors. Available online: https://www.osram.com/ecat/OSLON%C2%AE%20Black%20SFH%204715AS/com/en/class_pim_web_catalog_103489/prd_pim_device_2219819/ (accessed on 13 June 2022).
  19. Zhou, Y.; Miyamoto, T. Tolerant Distance and Alignment Deviation Analysis of LED-Based Portable Optical Wireless Power Transmission System for Compact IoT. IEEJ Trans. Electron. Inf. Syst. 2021, 141, 1274–1280. [Google Scholar] [CrossRef]
  20. NTKJ Co., Ltd. Fresnel Lens Manufacturer. Available online: https://www.ntkj-japan.com (accessed on 14 June 2022).
  21. Tang, J.; Matsunaga, K.; Miyamoto, T. Numerical Analysis of Power Generation Characteristics in Beam Irradiation Control of Indoor OWPT System. Opt. Rev. 2020, 27, 170–176. [Google Scholar] [CrossRef]
  22. Bremner, S.P.; Levy, M.Y.; Honsberg, C.B. Analysis of Tandem Solar Cell Efficiencies under AM1.5G Spectrum Using a Rapid Flux Calculation Method. Prog. Photovolt. Res. Appl. 2008, 16, 225–233. [Google Scholar] [CrossRef]
  23. Cekon, M.; Struhala, K.; Slávik, R. Cardboard-Based Packaging Materials as Renewable Thermal Insulation of Buildings: Thermal and Life-Cycle Performance. J. Renew. Mater. 2017, 5 (Suppl. S1), S84–S93. [Google Scholar] [CrossRef]
  24. Plastics—Thermal Conductivity Coefficients. Available online: https://www.engineeringtoolbox.com/thermal-conductivity-plastics-d_1786.html (accessed on 13 June 2022).
  25. Cleary, T.G.; Quintiere, J. Flammability Characterization of Foam Plastics (NISTIR 4664); NIST Interagency/Internal Report (NISTIR); National Institute of Standards and Technology: Gaithersburg, MD, USA, 1991.
  26. Metals, Metallic Elements and Alloys—Thermal Conductivities. Available online: https://www.engineeringtoolbox.com/thermal-conductivity-metals-d_858.html (accessed on 13 June 2022).
  27. Mohammadnia, A.; Ziapour, B.M.; Ghaebi, H.; Khooban, M.H. Feasibility Assessment of Next-Generation Drones Powering by Laser-Based Wireless Power Transfer. Opt. Laser Technol. 2021, 143, 107283. [Google Scholar] [CrossRef]
  28. Thermal Properties: Material Thermal Properties Database. Available online: https://ncfs.ucf.edu/burn_db/Thermal_Properties/material_thermal.html (accessed on 13 June 2022).
Figure 1. Collimation scheme of LED-array OWPT.
Photonics 09 00576 g001
Figure 2. Irradiation power of variable collimation lens in single LED-OWPT.
Photonics 09 00576 g002
Figure 3. Optimal irradiation power regression: (a) 0 < r ≤ 10 mm; (b) 10 < r ≤ 25 mm.
Photonics 09 00576 g003
Figure 4. Irradiation power and corresponding electricity output with different LED numbers.
Photonics 09 00576 g004
Figure 5. Lens system design of 3 × 3 LEDs array OWPT: (a) view from side; (b) view from LED chip.
Photonics 09 00576 g005
Figure 6. (a) View from the side of 3 × 3 LEDs array OWPT; (b) lens system; (c) experiment set up.
Photonics 09 00576 g006
Figure 7. Irradiation spot at 1 m, (a) simulation; (b) experiment.
Photonics 09 00576 g007
Figure 8. Thermal image and center temperature (temp.): (a) LED; (b) heat sink; (c) solar cell.
Photonics 09 00576 g008
Figure 9. Relation between imaging lens aperture and the corresponding electricity output.
Photonics 09 00576 g009
Table 1. Simulated irradiation power on 50 × 50 mm2 area solar cell (mW).
r10 mm15 mm20 mm25 mm30 mm35 mm40 mm45 mm50 mm
f
5 mm495354555348423528
10 mm133176193200196182158131109
15 mmn/a305357390395371324273227
Table 2. Simulation (sim.) and experiment (exp.) results of 3 × 3 LEDs OWPT.
Lens System
Efficiency
Irradiation Spot (mm2)Surface Irradiation (W) Electricity Output (W)
sim.39.7%63 × 673.98n/a
exp.34.8%76 × 802.651.04
Publisher’s Note: MDPI stays neutral with regard to jurisdictional claims in published maps and institutional affiliations.

