1. Introduction
The world has seen the incredible growth of the Internet as a global communication infrastructure in recent decades. Wired and wireless Internet have revolutionized the telecommunications paradigm to enable communication with anyone, “anytime”. The emerging Internet of Things (IoT) is creating another paradigm, in which “anything” can be accessed and/or controlled remotely, allowing for a more direct coordination between the physical world and machine-based systems [
1,
2]. IoT refers to billions of Internet-connected physical devices worldwide, collecting and sharing data. There will be a rapid increase in the number of different pieces of IoT equipment, as sensors and actuators are widely used in many applications, such as cyber security, automation, metering, healthcare, utilities and consumer electronics. Gartner predicts that, by 2022, the typical household could contain more than 500 smart devices [
3]. As time passes, the telecommunication industry evolves. From conventional copper networks with a single voice service to recent technology with multiple services in a single medium, these devices offer vast application for daily use, as well as the commercial, military, government and entertainment sectors, among others [
4]. At the present time, the fiber-to-the-home (FTTH) network is one of the favored access technologies to be deployed to deliver a high-speed broadband service. Based on passive optical network technology, it can be implemented from a further distance and carry a higher bandwidth as compared to the conventional copper network [
5].
Among the passive optical network (PON)-based networks, the Ethernet passive optical network (EPON) is a prominent solution for providing diverse services [
6]. PON can overcome the bandwidth limitations of the last mile bottleneck problem in access networks [
7]. EPON has been standardized in the IEEE 802.3ah (1G-EPON) and IEEE 802.3av (10GEPON) standards [
8]. Two standards have been defined for this technology, namely, the Ethernet passive optical network (EPON) by IEEE 802.3ah and the gigabit passive optical network (GPON) by ITU-T G.984. Regardless of the name, the major components of both technologies in general consist of an optical line terminal (OLT) that is located in the central office (CO), an optical network consisting of the fiber optic cable and optical power splitter, and finally, the optical network unit (ONU) as the customer premises equipment (CPE) [
9]. This solution is capable of providing triple-play services (data, voice and video) to the subscribers within its reach and in a single medium. In conjunction with this, the maximum bandwidth that can be carried by the system is within 1–2.5 Gbps, depending on the configuration made by the service providers. Recent developments have also shown trends for a 10 Gbps of transmission bit rate. For example, in a 10 G system, both downstream and upstream transmission bit rate can be configured to the same value, known as the symmetrical mode or asymmetrical mode, but usually the downstream transmission bit rate is configured to the 10 G transmission bit rate and the upstream has a 1 Gbps transmission bit rate [
10]. However, current commercial FTTH deployment in Malaysia is operating in asymmetrical transmission bit rate of up to 2.5 Gbps in the downstream and 1.25 Gbps in the upstream direction.
Transmission bit rates reported by research laboratories are already as high as 40 Gbps, and standards have been started. However, the IEEE 802.3av standard for last mile customer network deployment transmission bit rate is 10 Gbps GEPON and the ITU-T G.987 standard is 10 Gbps GPON. The 10 G passive optical network (XG-PON) provides an emerging potential technology to carry multiple services for the first: the mile access network. However, it has a 0.3 ms propagation delay between the optical network unit (ONU) and optical line terminal (OLT) resulting in inevitable increased queuing delay for the bandwidth grants to the ONUs. Several methods have been practiced in order to reduce delay and increase the bandwidth efficiency, as proposed in [
11,
12,
13].
This huge capacity also comes with enhanced services as well. Apparently, FTTH is capable of delivering a triple-play service to its subscribers. Triple play refers to the data, voice and video services of an application delivered in a single medium to the customers. Currently these services are being delivered in different transmission bit rates to the subscribers. For example, a high-definition television (HDTV) is between 8 and 15 Mbps, a standard-definition television (SDTV) is 4 Mbps, a voice communication channel is 64 kbps, a video phone will take around 1 to 2 Mbps, and last but not least, data services range from a few kilo bytes per second to less than 5 Mbps, depending on the application used [
14,
15].
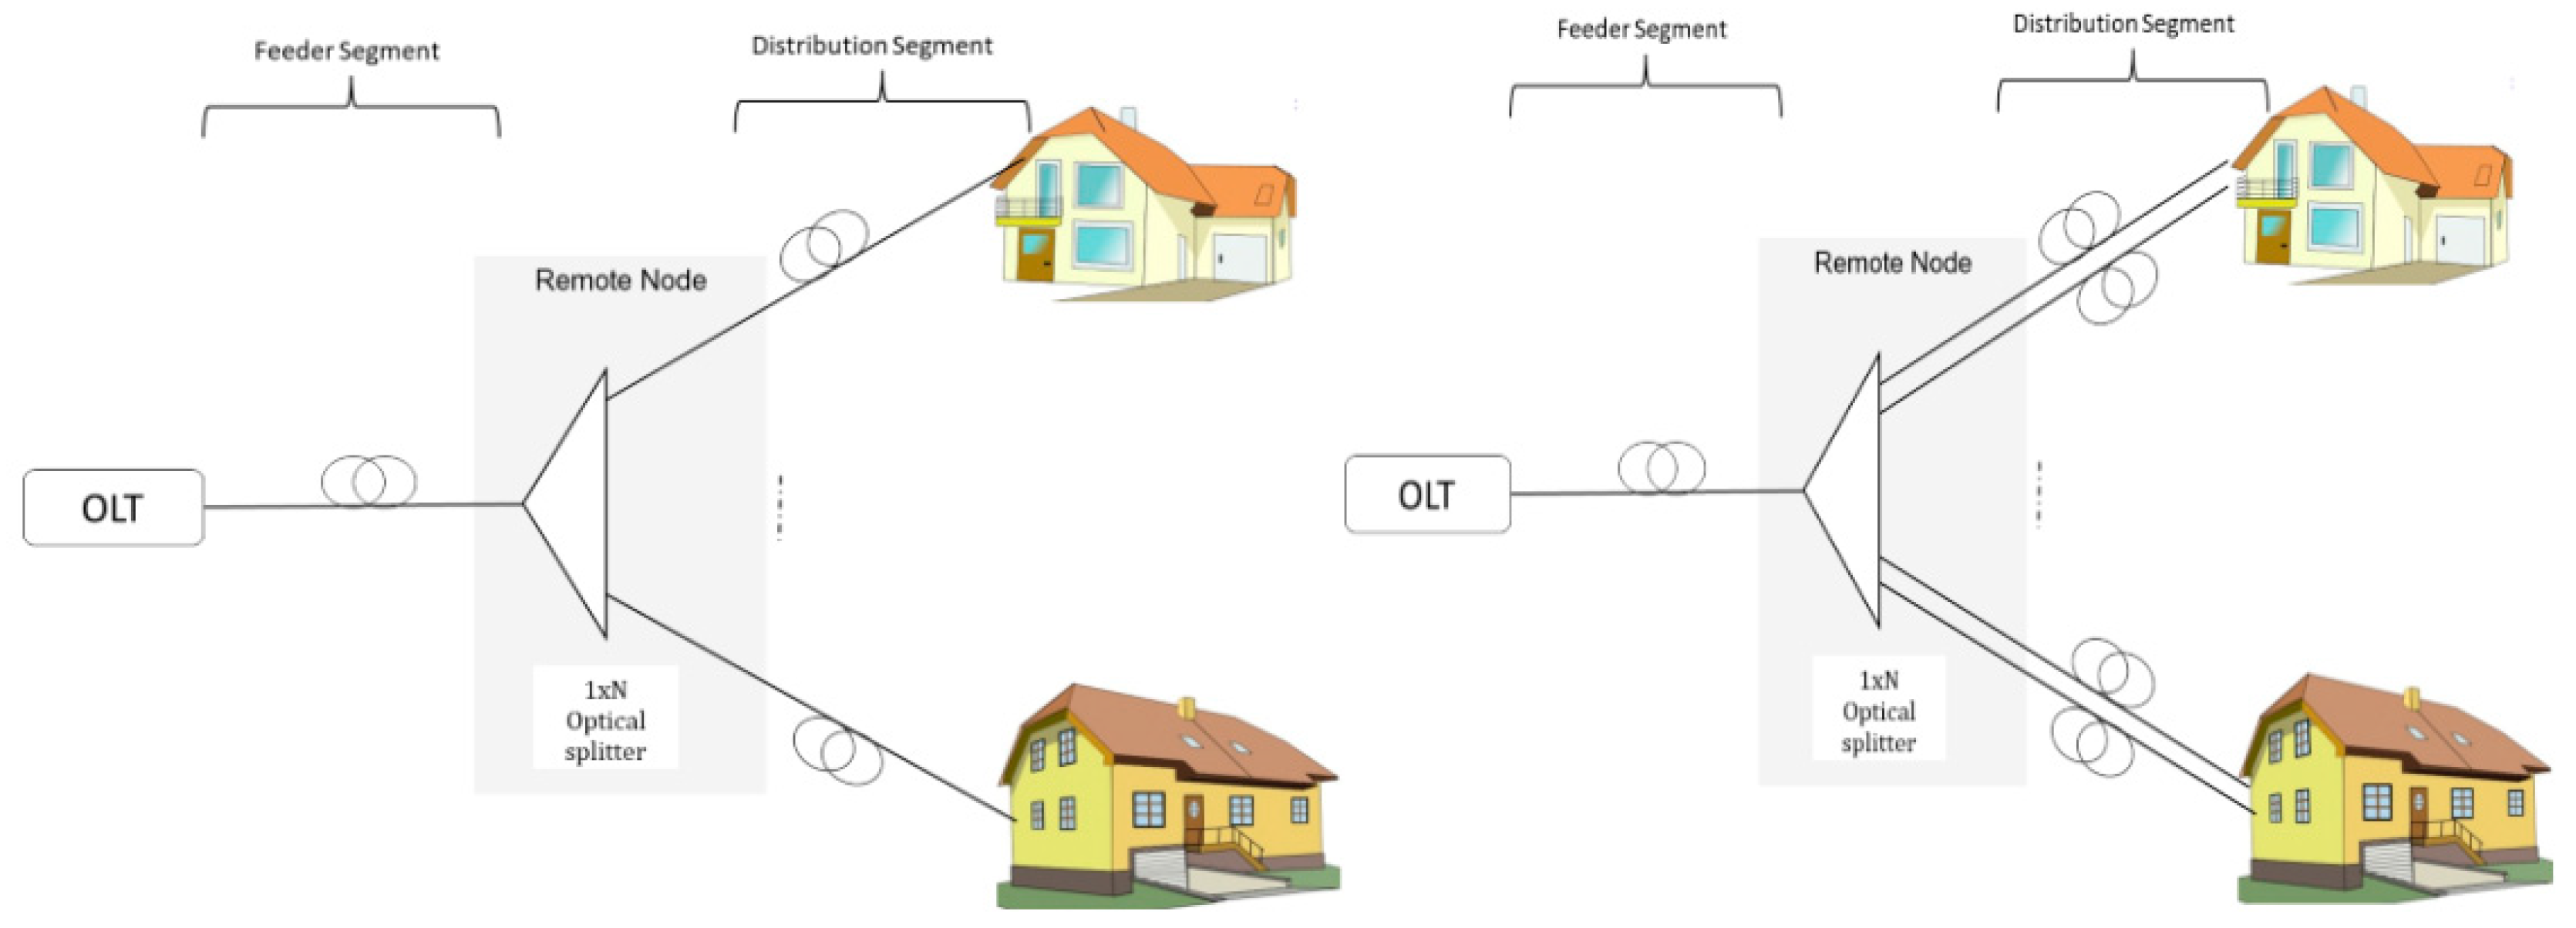
In terms of the PON, it utilizes passive optical components and cabling. Thus, this will add flexibility and economic benefits for deployment. Typically, the PON consists of two network segments: the feeder and the distribution segment. The feeder segment extends from the CO to the remote node (RN) where a passive optical splitter is placed, while the distribution segment is from the RN to the subscribers’ premises. A conceptual representation of FTTH is shown in
Figure 1.
As the FTTH system is being actively implemented world-wide, there is also a need to ensure its reliability and resilience during operation. In addition, this could also help the service provider to meet the defined service level agreement (SLA).
According to cases reported to the Federal Communication Commission (FCC), more than one-third of service disruptions are due to fiber optic cable problems. These problems usually take a longer time to be restored as compared to transmission equipment failures. Therefore, fault tolerance is also an important issue in PONs. There are two categories of network failures in an EPON system. The first one is link failure, and the other is node failure. Link failure refers to the fiber disconnection occurring between the OLT and the splitter. The fiber connection between the splitter and the ONU is referred to as a branch. Node failure refers to device malfunction occurring in the FTTH network system, such as the OLT, splitter, or ONU. In the link failure case, the failure of the feeder fiber will halt the whole PON system. Meanwhile, a failure of a branch will only affect a single ONU. In the node failure case, the failures of an OLT or a splitter will cause a fault throughout the PON. Therefore, it can be concluded at this point that the OLT, the feeder fiber and the splitter are the most critical components in the PON system.
This article will elaborate on the protection and restoration method in the FTTH distribution segment by using a downstream optical signal detection method for the ONU side. First, we define the architecture of the FTTH system and the proposed detection and restoration module on the ONU side. Then, we conduct a simulation exercise to simulate and analyze the result of the design in the FTTH network. After that, we perform a laboratory assembly and integration of the FTTH system with the new detection and restoration module to handle distribution network failure. The characteristics and final result of the proposed design are discussed prior the conclusion section of this article.
Despite the listed advantages, FTTx tends to suffer from network issues, mostly in the last mile of the FTTx network from the fiber distribution point (FDP) to the ONU, which is considered more vulnerable. It is usually located in harsh environments (e.g., customer premises, heavy traffic area, trees, and animal farms) with some points of fiber-optic connections that make the optical links more exposed to risks [
16]. Therefore, it is essential to install a centralized and automated monitoring system equipped with complete monitoring capabilities which can enable the detection and localization of faults in the distribution fiber (DF) link from the CO. The FTTx access network requires an effective monitoring tool for the optical link to guarantee efficient service delivery. The monitoring system is integral in the optical link during fiber installation, testing, and for regular network operation [
17].
2. Motivation
Nowadays, data communication plays an important role in our daily lives. With the availability of high-speed broadband deployment to various types of premises, we have created an environment of ubiquitous Internet networking. There are various types of applications that benefit from this network, for example, social network applications, education, banking or financial transactions, as well as business and administrative support systems. Hence, the need for an effective high-speed broadband solution or system is inevitable. Ultimately, the best medium to carry such a capacity of bandwidth is none other than the fiber optics cable. This is where the FTTH solution is introduced in order to provide a broadband path into customer premises.
In conjunction with the intensive deployment of FTTH solutions to subscribers, there is also a need for the service provider to prepare a simple yet effective plan or solution for a resilient access network based on FTTH architecture.
As the provider has an obligation to meet with the defined SLA value, the failure in the network and systems should be mitigated and restored accordingly. The major failure conditions in the FTTH network could be caused by [
18]:
- (a)
A cut at the feeder or distribution/drop cable that would affect all or some of the subscribers along the line;
- (b)
Failure in the OLT/ONU transceiver which would affect all of the subscribers connected to the OLT or a single subscriber with a faulty transceiver module;
- (c)
Failure in some of the passive components, connectors, joints and related passive devices that make up the FTTH network connection;
- (d)
Any active component failure due to power outage, faulty electronics or software- or firmware-related issues.
Additionally, from the analysis of the probability of failure within the FTTH architecture, it has been shown that a protection plan for the feeder or distribution segment could reduce the failure occurrence to half, or approximately 20 min/year, as compared to the unprotected FTTH network. This could be translated to the percentage value of 99.996% availability [
19]. Ultimately, with the full protection mechanism, the downtime could be minimized in the range of milliseconds.
Table 1 describes this scenario.
This calculation is based on the assumption that this downtime is caused by fiber cuts, splitter failures, and transceiver failures only. These issues have encouraged us to perform a study on the development of the protection and restoration module, focusing on the distribution link section.
In conjunction with this issue, there are various protection and restoration schemes in the feeder or trunk section of the FTTH network. One of the methods proposed is using direct communication between the ONU and the switching mechanism of the OLT during link failure. This method requires the ONU to have two optical interfaces to enable the protection link between the ONUs in the distribution segment [
20]. Another alternative is by using dual OLT links and interfaces to handle OLT and/or ONU link failure [
21]. This method will also support OLT card failure since the redundancy introduced at the OLT side will make this possible. In addition to this, a protection and restoration scheme based on the monitoring of the downstream test signal is proposed in [
22]. In this technique, the system will handle a failure in the distribution section; a module called the access control system (ACS) that is integrated with the last stage of the optical splitter has been developed for this reason. In addition to this, a study and review have also been conducted in Japan on FTTH deployment and a cost effective PON protection system has been proposed. The protection system uses a protection switch and controller at both the OLT and ONU sides. The detection method utilizes a predefined message as specified in the OAM standard [
23]. Alternately, using an OTDR for monitoring and assessing detection link errors has also been studied and proposed in [
24,
25]. Furthermore, there are also other initiatives being made in WDM-PON systems in order to ensure resilient future optical access networks, as described in [
26,
27,
28,
29]. In comparison, the WDM-PON system requires a more complicated scheme as compared to the existing TDM-PON system (E/GPON). This is due to the multiple wavelengths used and the arrangement of the PON and its components to handle multiple wavelengths.
Thus, it can be presumed that the protection and restoration method for the FTTH network or the PON will involve a link and equipment redundancy scheme, a detection method and a controller design to control the tasks accordingly. Hence, in this paper, a new method is proposed considering a more practical approach for implementation in the FTTH network, focusing on the distribution network segment.
3. The Architecture
The idea of this task is to design and develop an FTTH protection and restoration module within the distribution segment of the network. Since a new module will be introduced in the existing network, these rules need to be followed:
- (a)
The designed module should be transparent to the operating laser signals and protocol from the OLT and ONU;
- (b)
The accumulated loss value within the network should not exceed the sensitivity value of the transceivers (−25 dBm);
- (c)
The design should be universal so that it can be used with different types of protection schemes and functions with minimum modification.
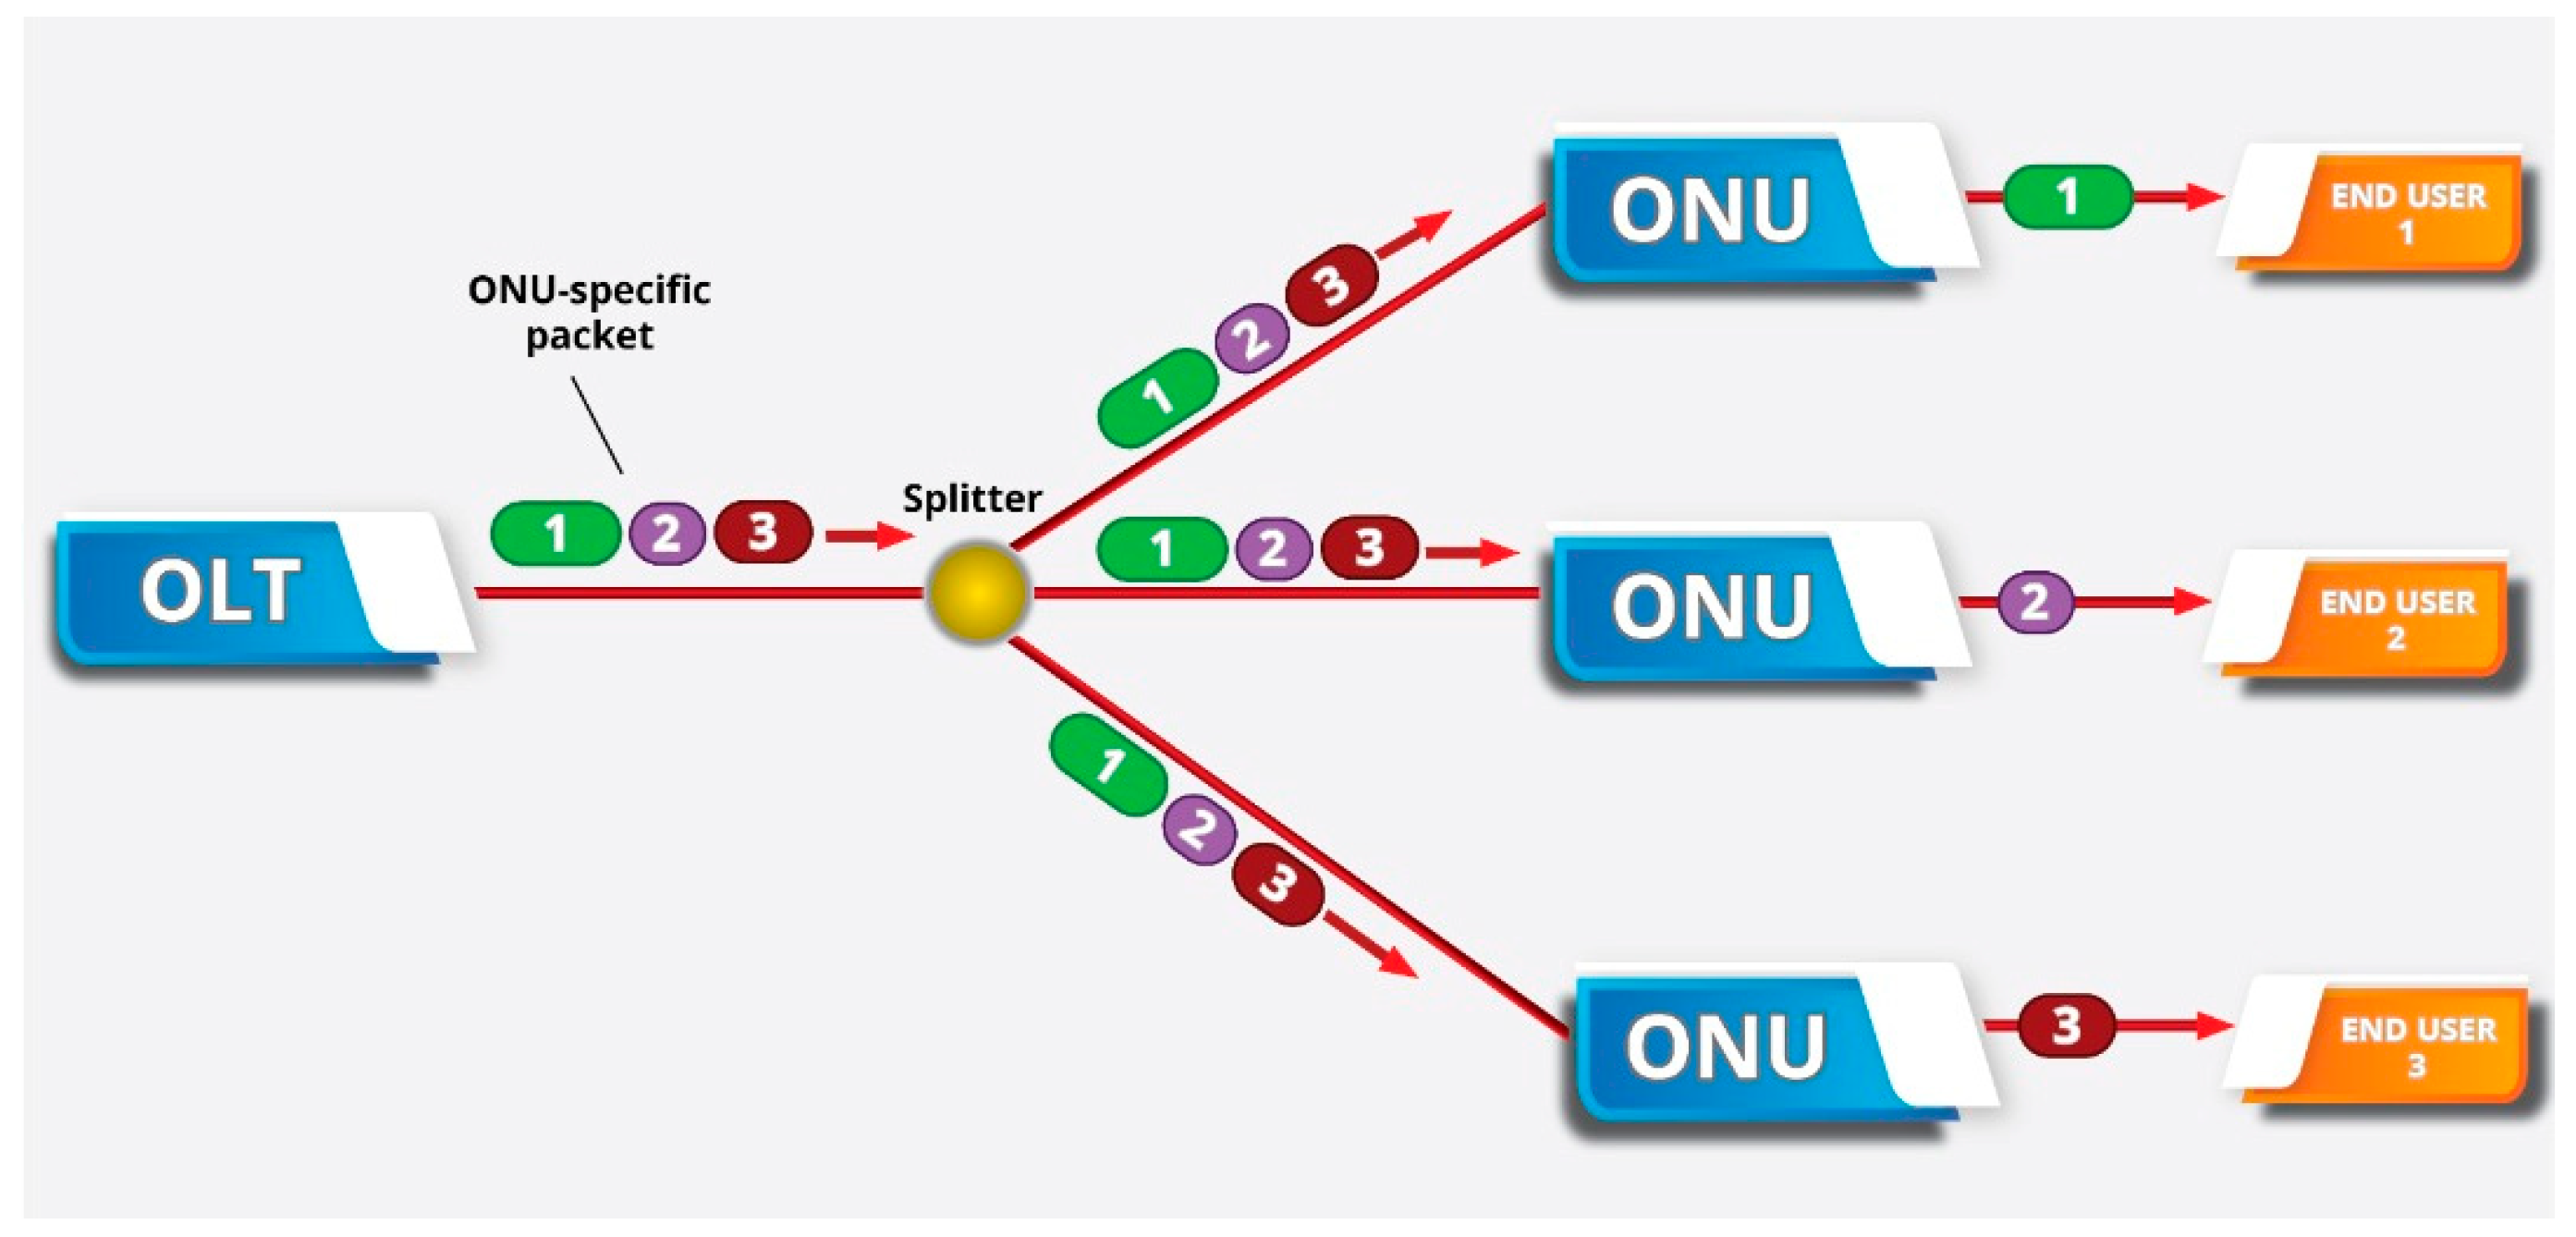
Practically, FTTH utilizes the time-division multiplexing (TDM) concept and the communication process is controlled by the OLT. The OLT will provide a dedicated transmission-timing window for each of the ONUs to transmit, as depicted in
Figure 2. Hence, from the laser signal perspective, the downstream signal will be a continuous wave (CW) and the upstream signal will use the burst mode method. The specific method for EPON will differ from GPON communication, but will adhere to the same fundamental rules of downstream and upstream communication [
30].
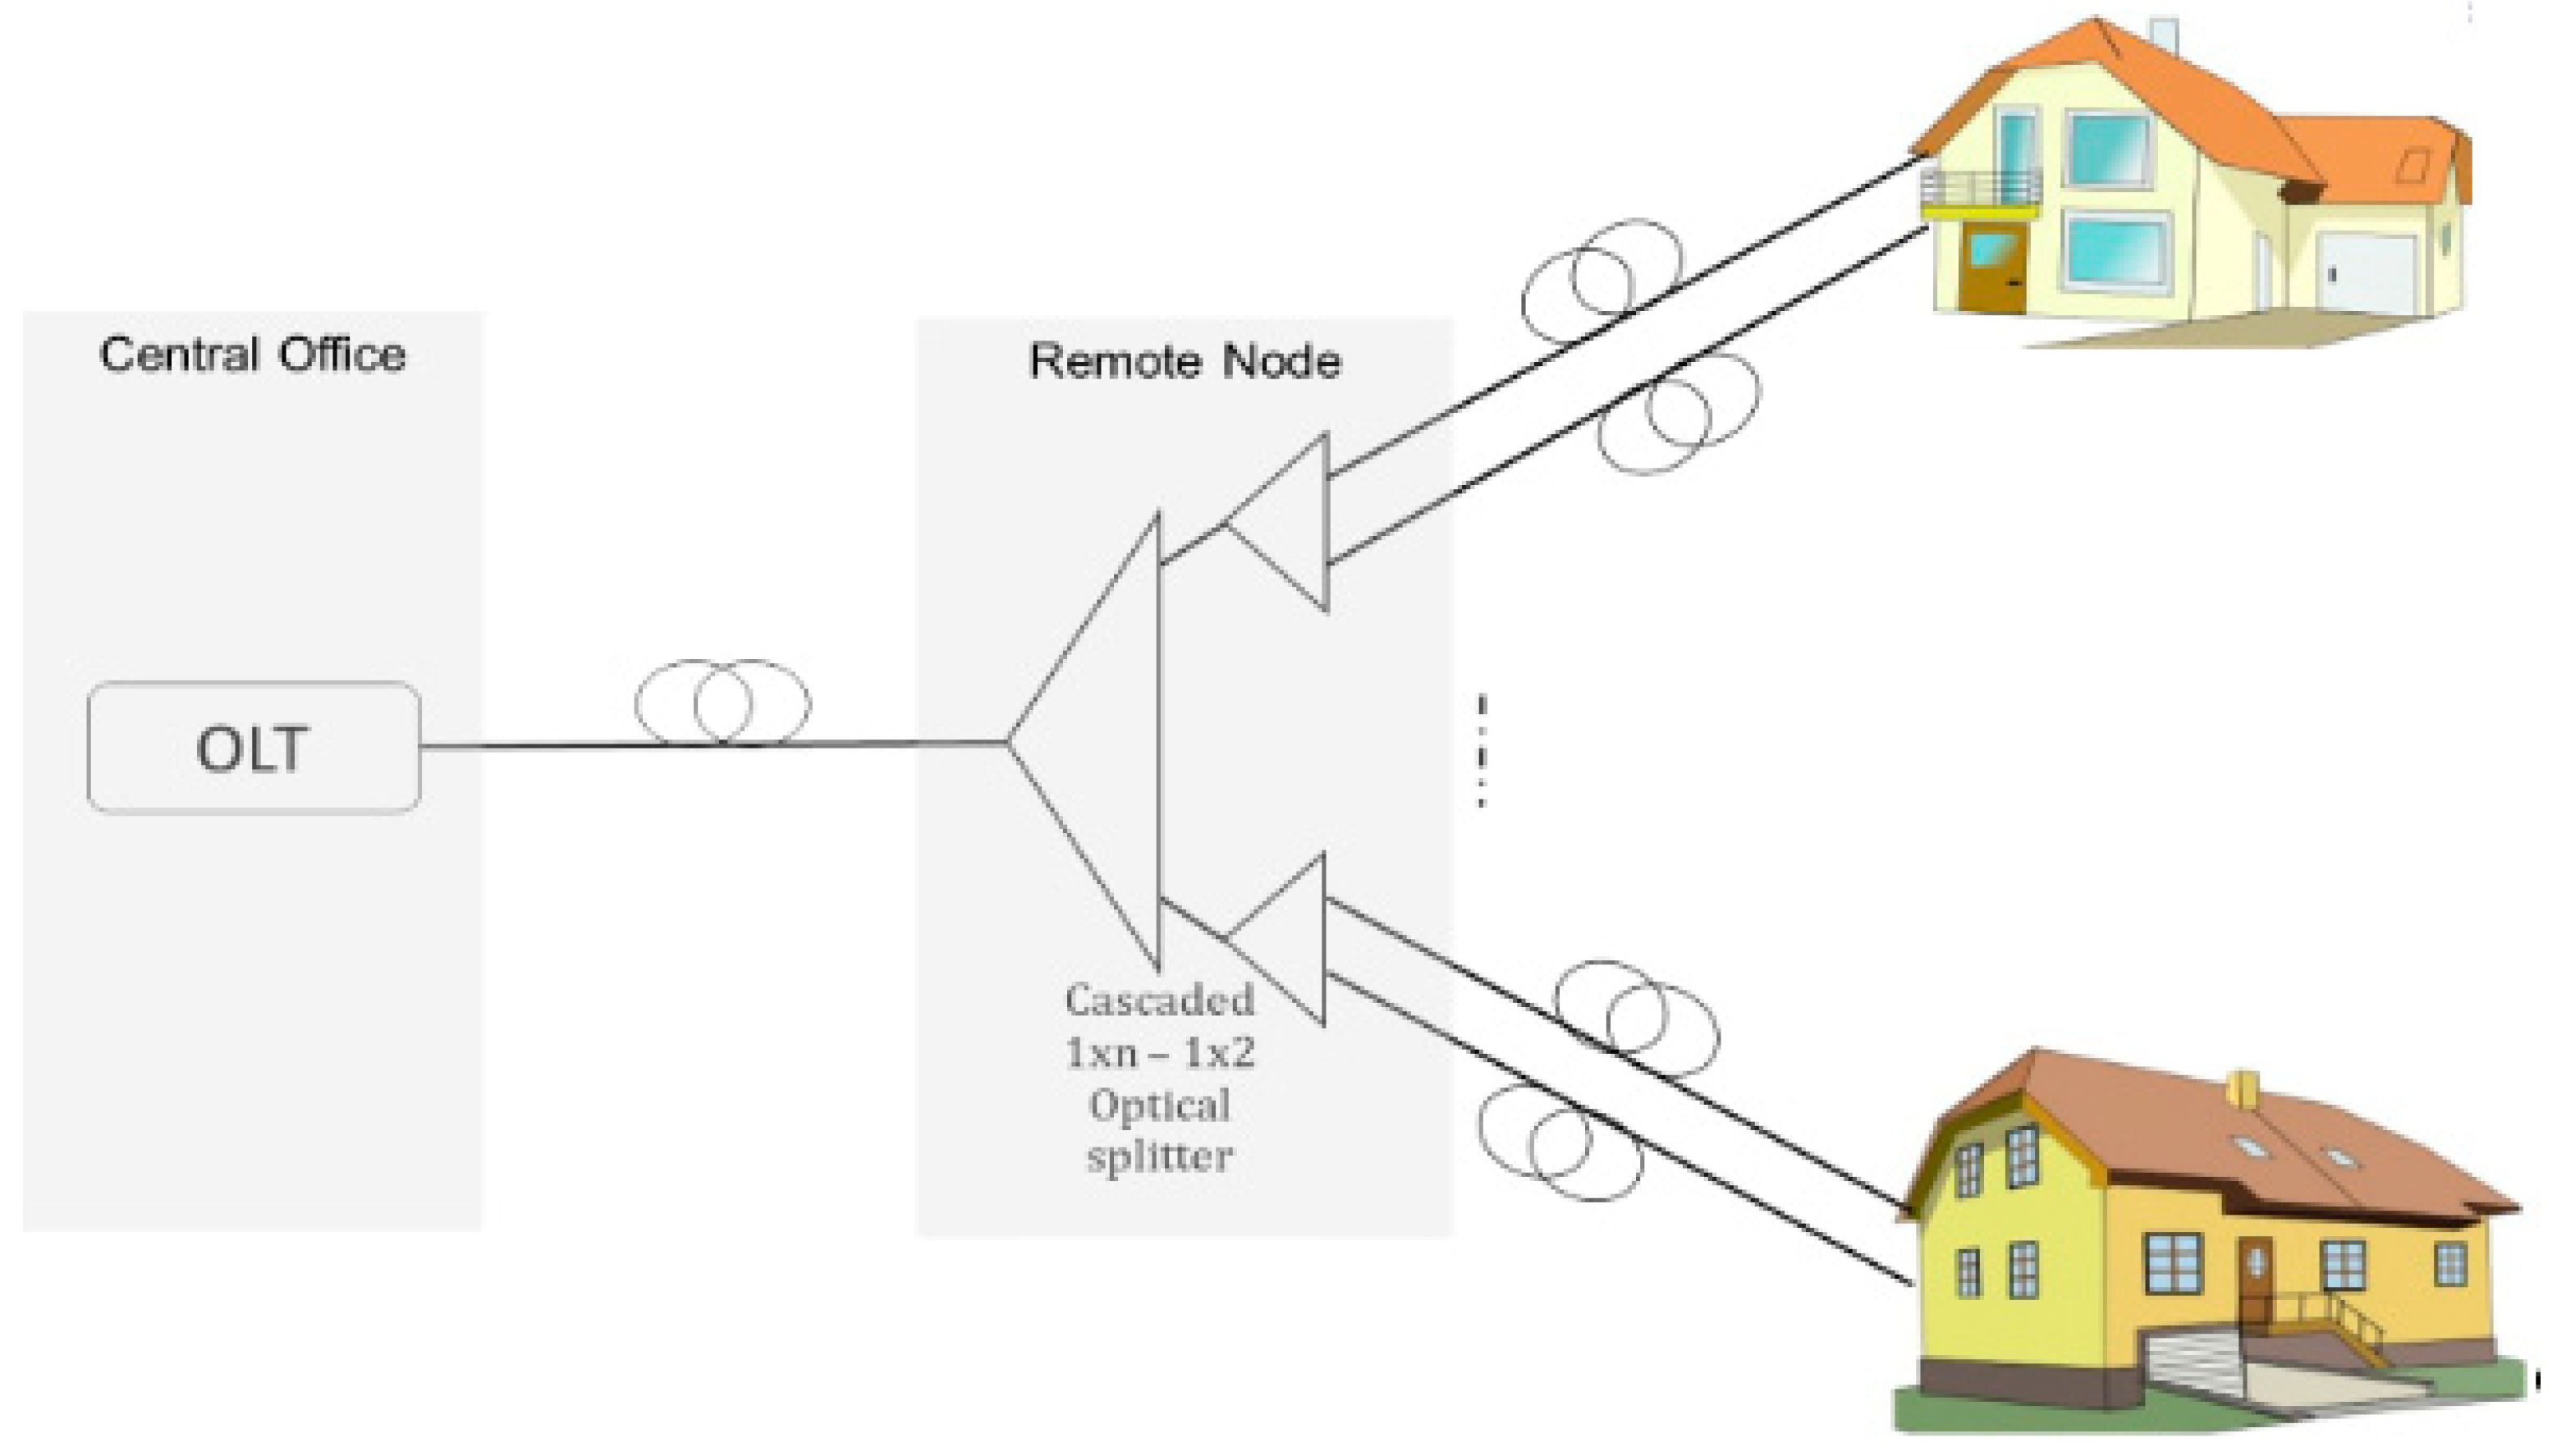
Looking at the generic network implementation of FTTH architecture (as shown in
Figure 3), the distribution segment is usually at the last stage of the optical splitter. This device plays an important role in FTTH architecture and network planning or implementation. The optical splitter is a passive component and does not have any intelligence or controlling function. The main function of this device is to split OLT’s downstream optical signals to each of its output ports and to the subscribers. Similarly, the upstream signal from the ONUs will pass through it with the TDM method. On the other hand, the optical splitter also introduces optical signal power loss. The theoretical loss value is described in
Table 2. Typically, the minimum splitting ratio is 2 and could reach up to 64. On the other hand, as the number of splits is increased, the power of the received signal to each subscribes will decrease. For each multiple of two splits, the output optical power will be decreased by 3 dB. It will be seen that higher split value will introduce more loss into the network. From this optical splitter, the fiber optic cable will be laid to each subscriber’s premises. However, the length will be shorter than the feeder segment, ranging from approximately a few meters to 1 km.
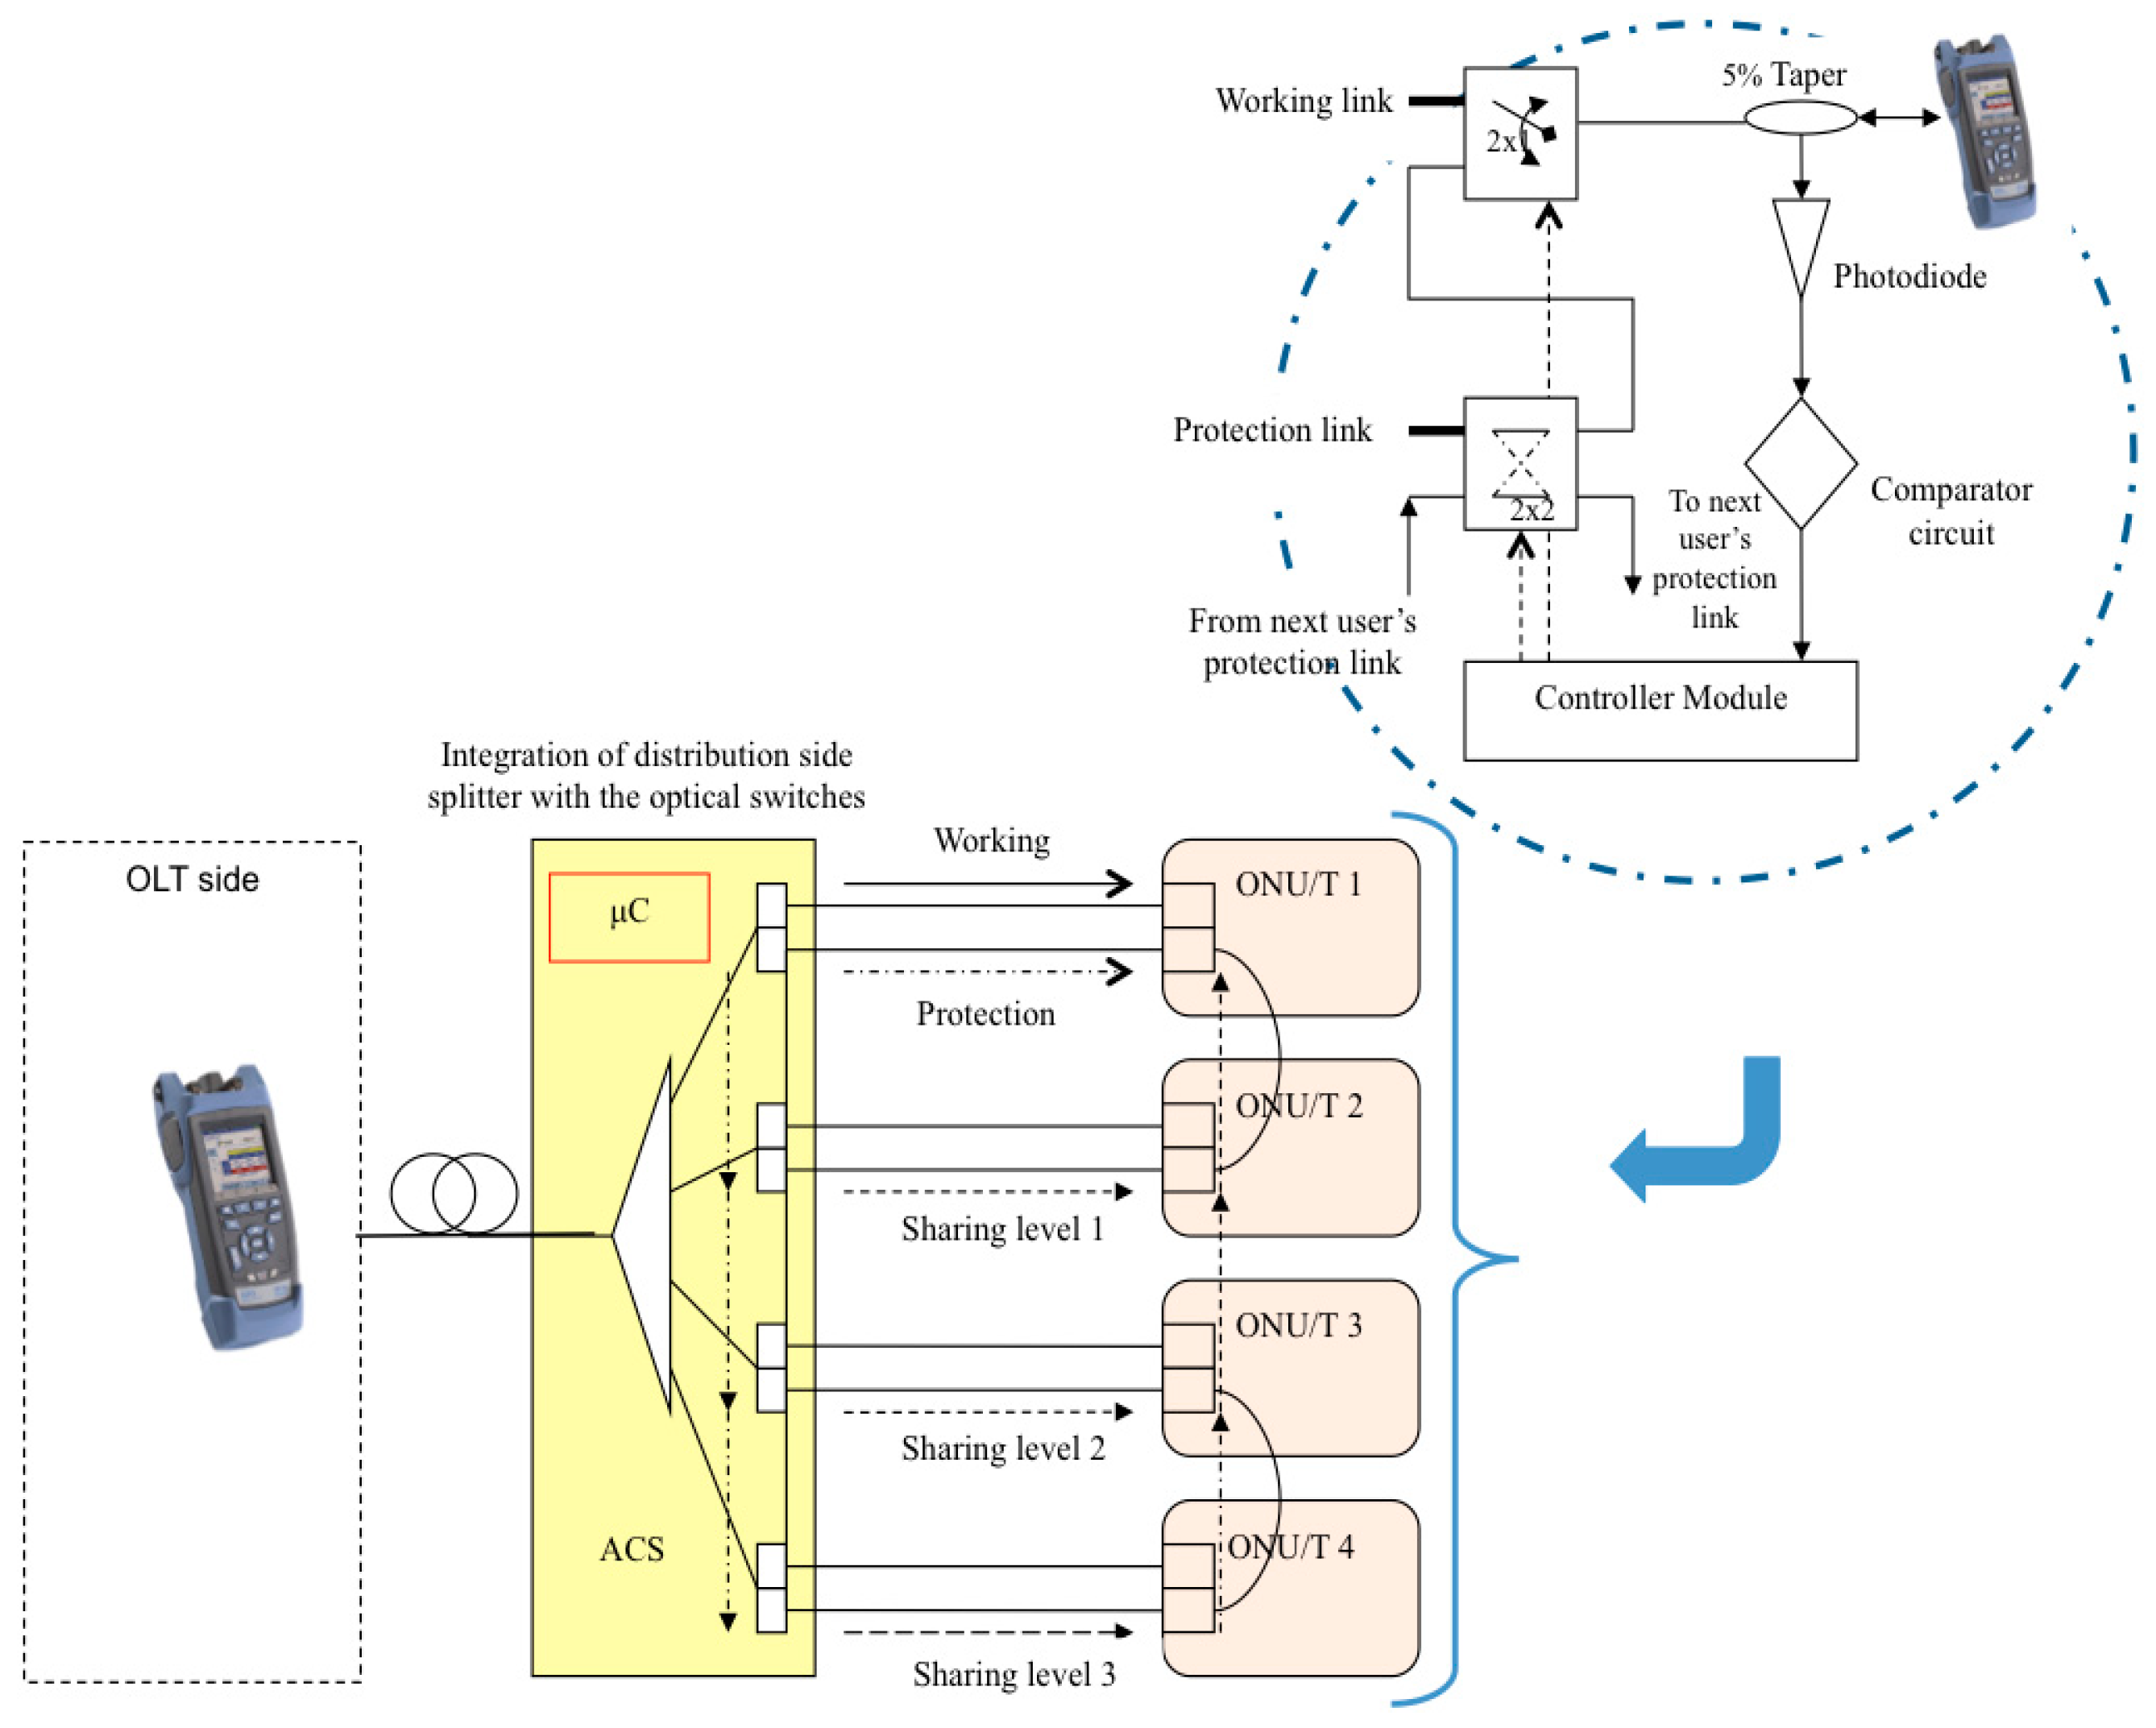
With these properties, and to ensure a reliable PON system, a new module that has the capability to switch between the working and protection link is introduced. In order to implement the protection and restoration function in the distribution segment, the proposed device should be placed at the subscriber’s side and each subscriber should be connected with two links or fiber optic cable to each of the splitter output ports. This is due to the fact that the downstream CW signal will always be present at the subscriber premises, regardless of the ONU status. Hence, we could use this signal as the indicator for the activation of the protection and restoration function.
In relation to this, this activation function is based on the downstream signal detection method. The detection module will provide the input for the next action plan that needs to be executed. Based on this generic concept, a protection and restoration scheme has been defined with a special module for the detection and restoration mechanism, as well as the PON distribution network plan.
As depicted in
Figure 4, each user will be connected with a pair of fiber optic cables: one as the working link and the other as the protection link. As described before, each splitter will only have a single output for each subscriber. In order to provide a second link, there are two methods available. The first option is to use the next splitter’s output port for each subscriber. However, this will reduce the total number of the main splitter ports into half. The second option is to use a 1 × 2 splitter connected to each of the main splitter’s output ports. In this method, an additional 3 dB loss is introduced; however, this will not affect the total number of existing splitter ports. With a separate splitter, the maintenance process will be easier because the operator could just unplug the second splitter for troubleshooting purposes.
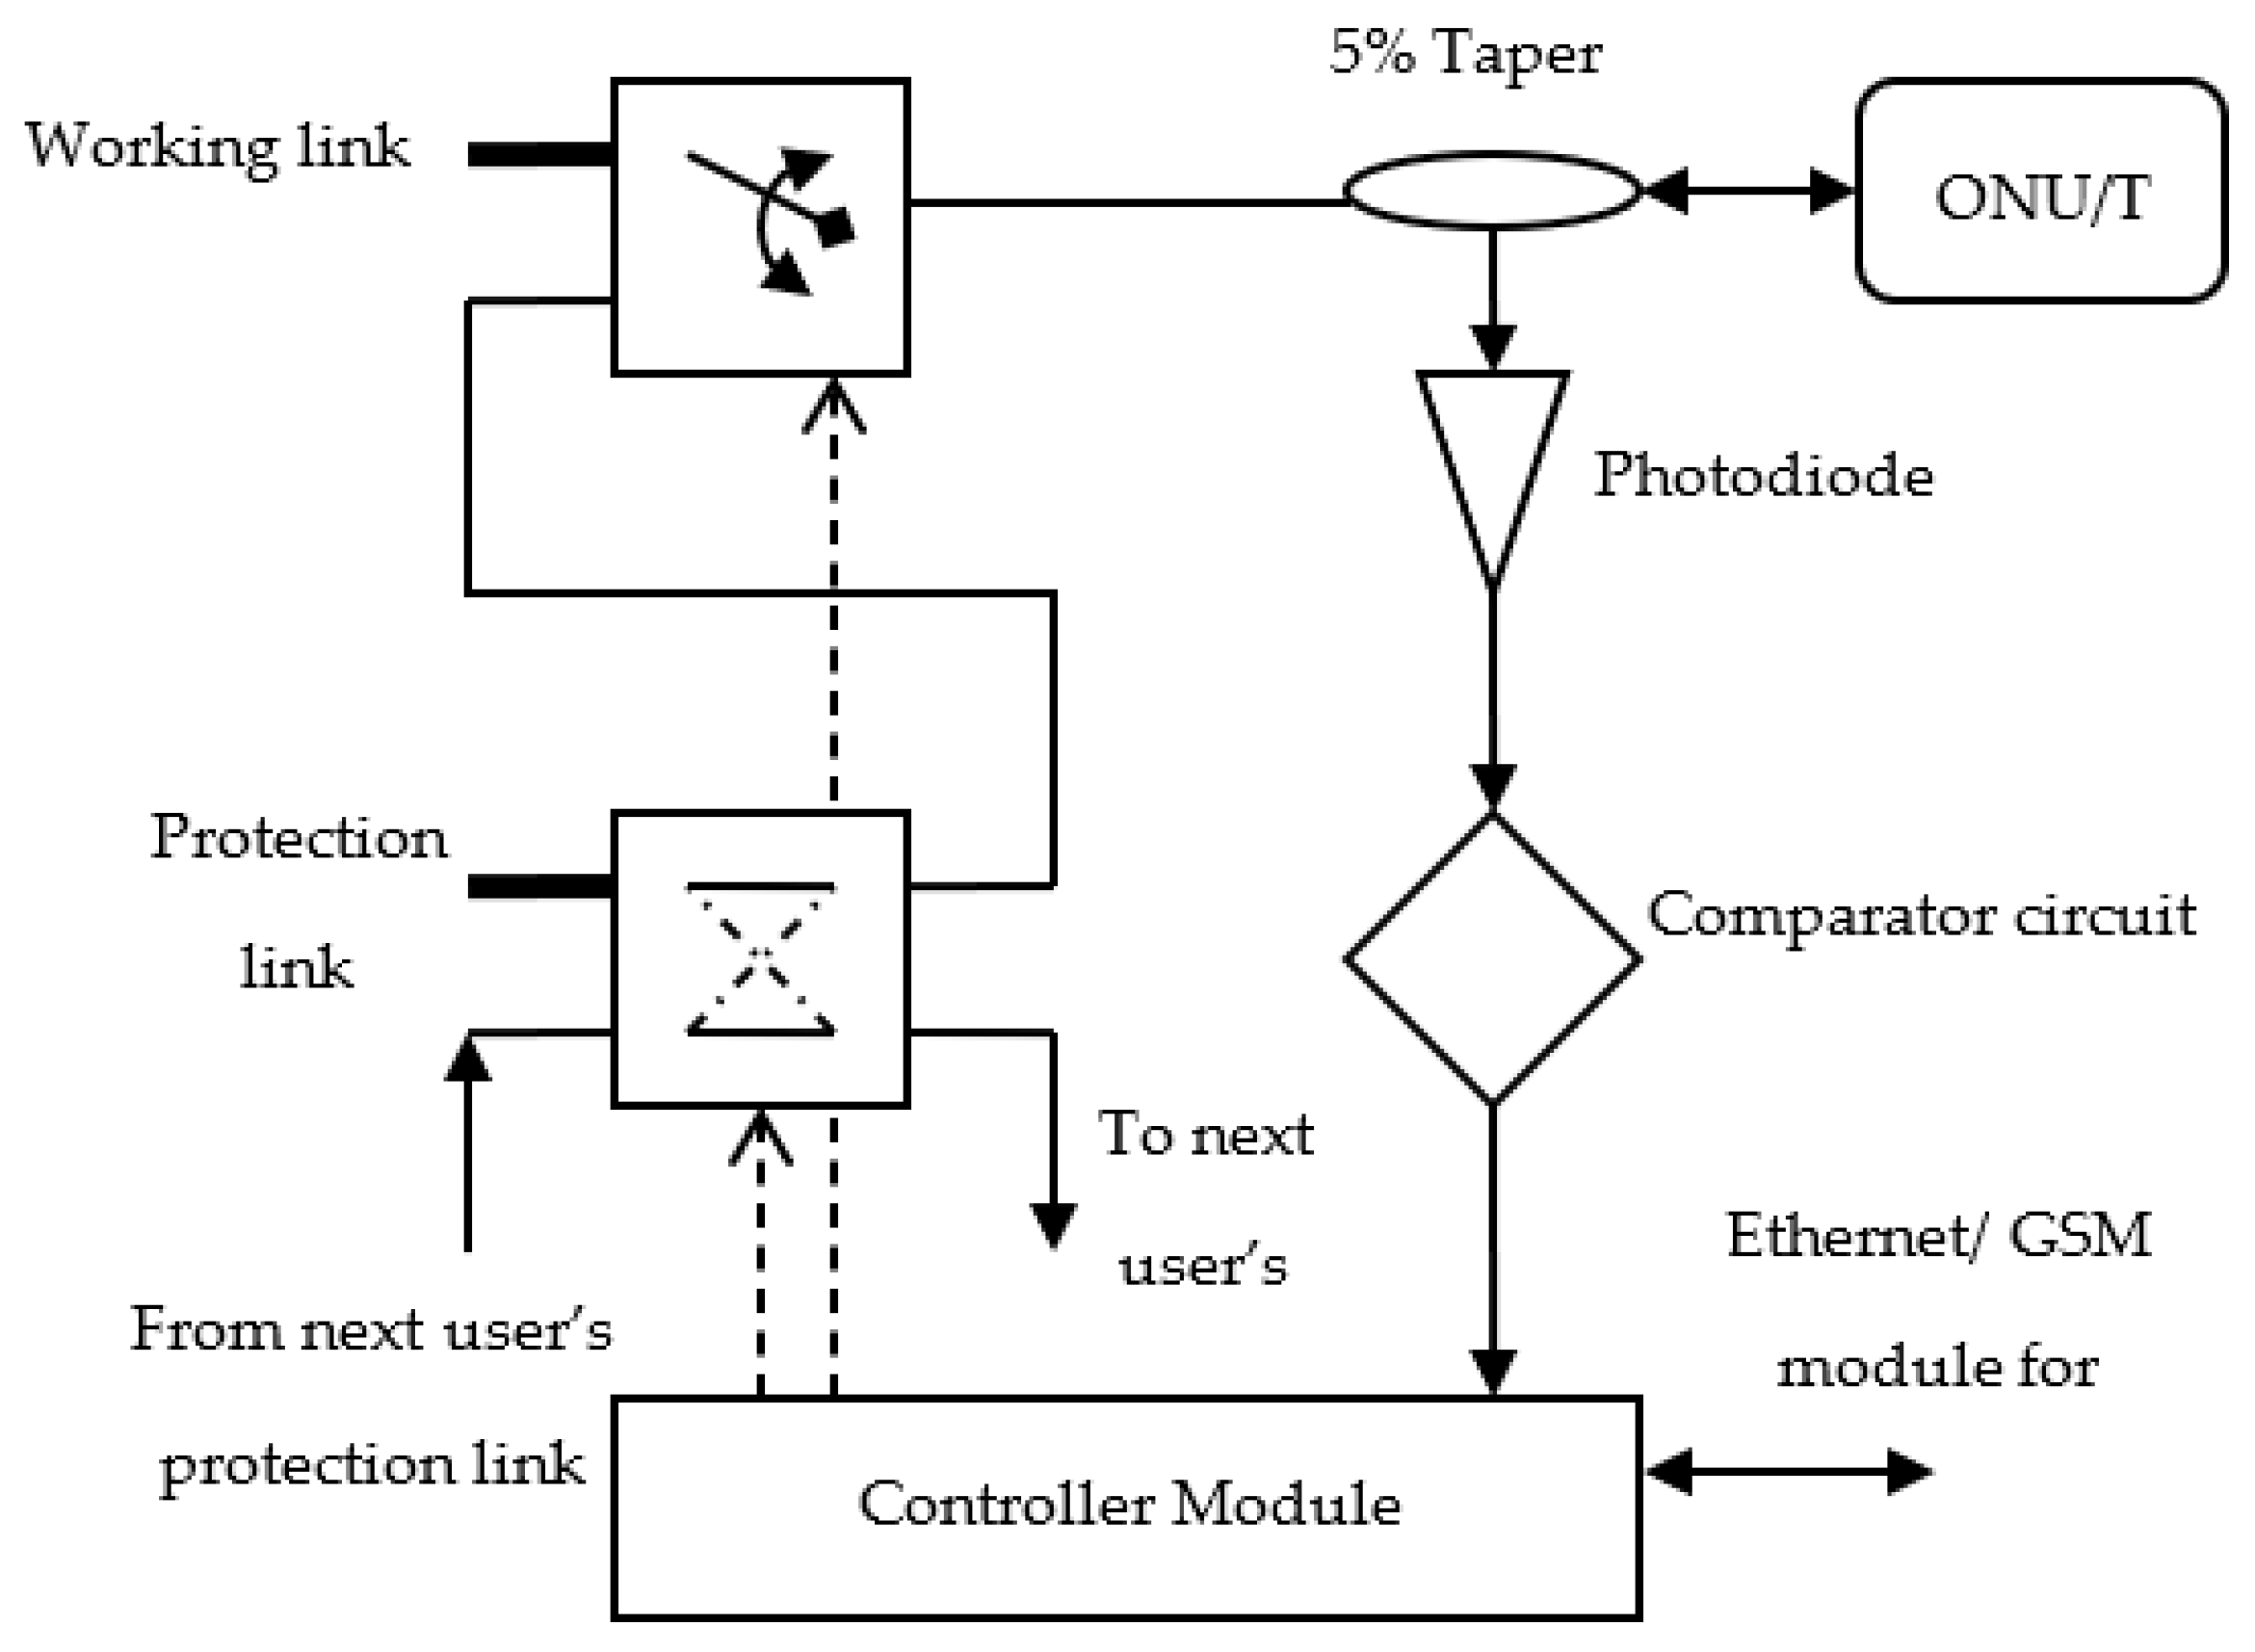
Next, the protection and restoration modules are designed and developed to meet the objective. Generally, this has two main interfaces: one is for the connection to the PON or drop cable and the other side is the interface for the ONU. The major components of this module are:
- (a)
Detection circuit—consists of a serial optical taper and photo detector for the detection of the downstream signal;
- (b)
Comparator circuit—consists of a comparator and microcontroller chip for checking and activating the protection and restoration function;
- (c)
Switching circuit—consists of an optical switch controlled by the comparator circuit for switching between the working and protection link.
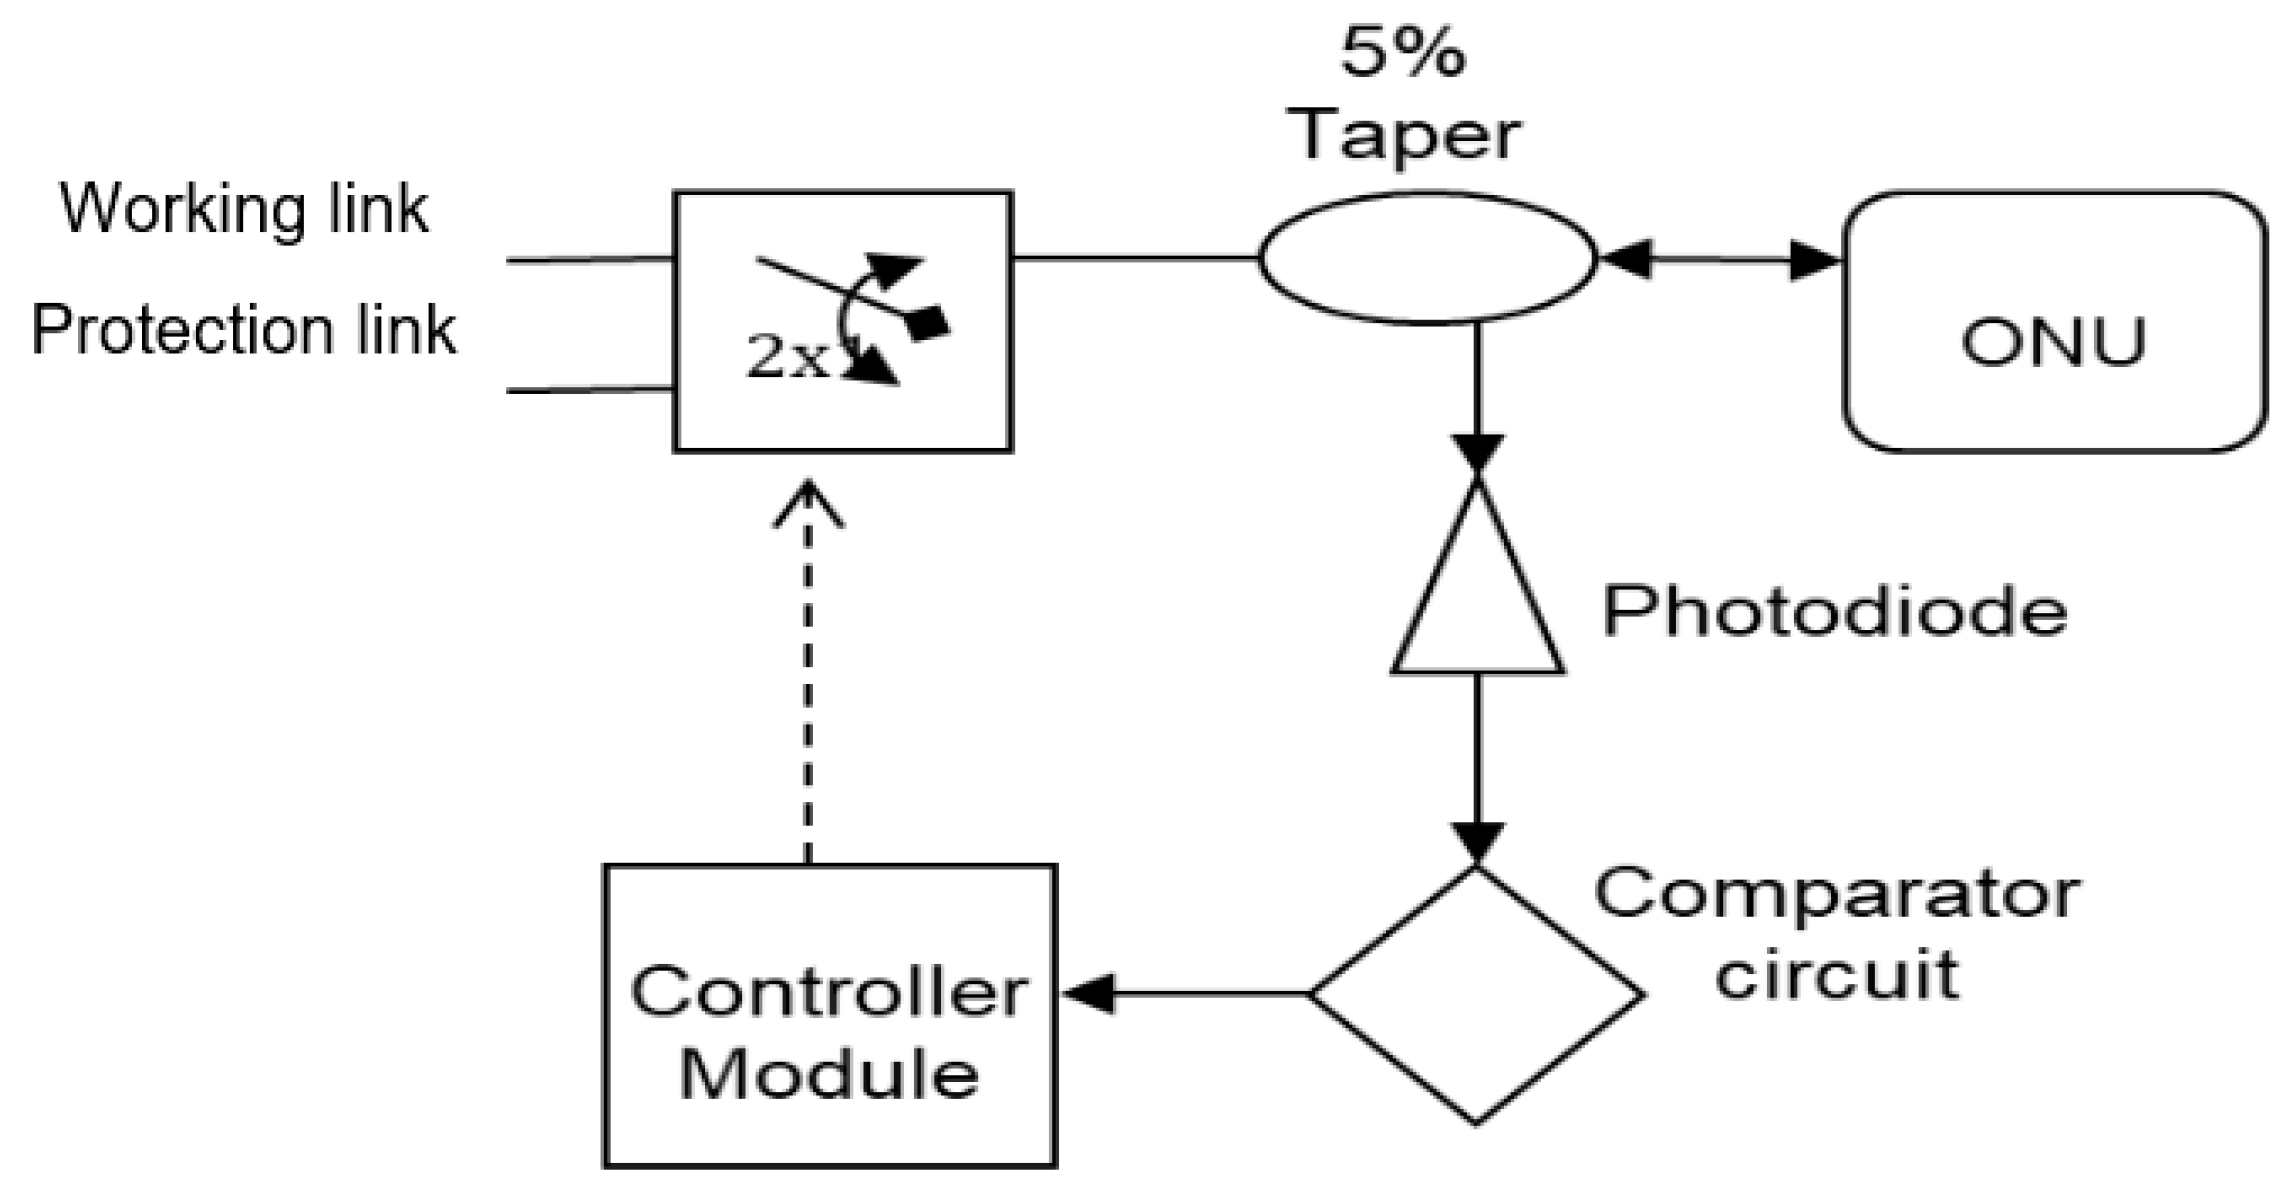
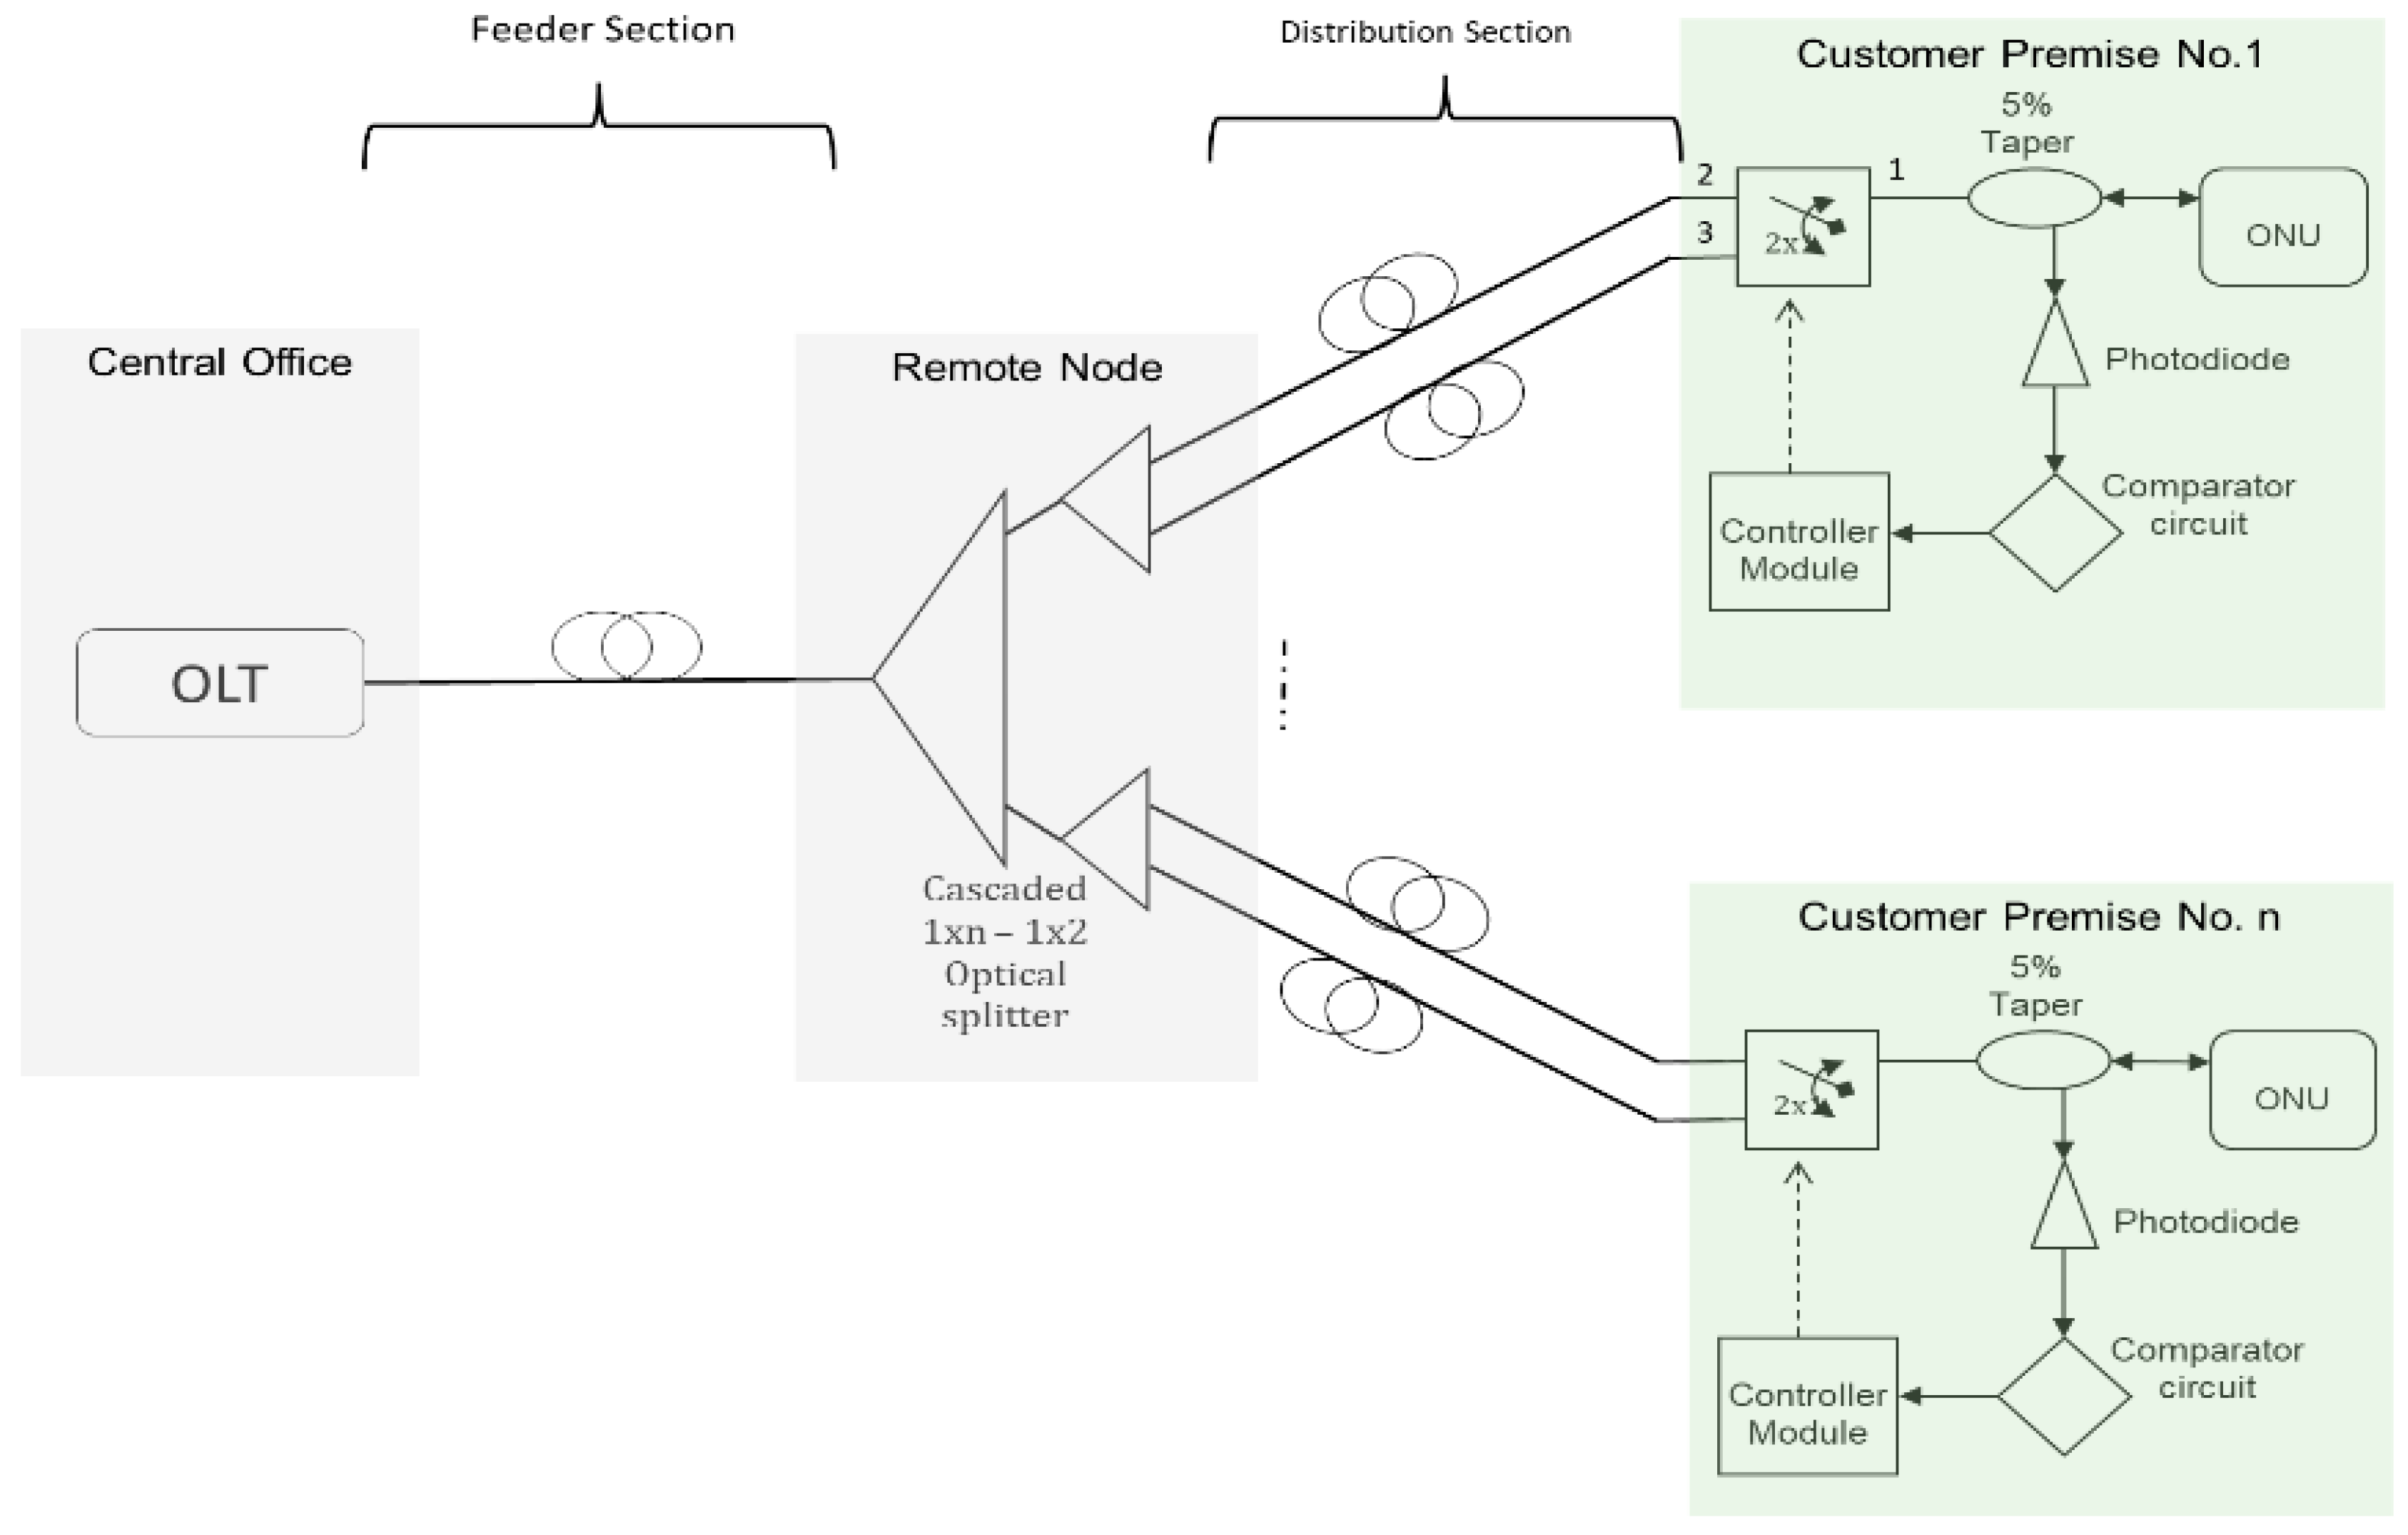
When this module is put together, it will be referred to as the protection and restoration module of the ONU side or, in short, PROMO, as depicted in
Figure 5. As the traffic is routed on both paths, PROMO is said to utilize a 1 + 1 protection method [
31]. This method would provide a fast restoration function and simple implementation compared to the 1:1 method.
The downstream 1490 nm laser signal from the OLT will travel through the new optical splitter set to the working link and reach the PROMO module with the ONU. In normal conditions, the switch is configured to the working link status. Meanwhile, the detection circuit of the PROMO module will continuously monitor the 1490 nm downstream laser signal.
This module works on the principle of a detection and switching process to archive restoration to the failed optical link to the ONU. It will not do anything if the signal is available within the defined threshold value. In the event of distribution working link failure, for example, due to a fiber cut, the 1490 nm signal will not be available at the PROMO or eventually at the ONU. This will cause the photo detector’s output to change state from ‘1’ to ‘0’. Furthermore, the voltage level obtained during the characterization of the photodiode represents this signal level. The state change level will be sent to the comparator and controller circuit for the activation of the protection link. It will instruct the optical switch to be in ‘bar mode’ where the protection link is connected. Hence, the downstream laser signal will resume transmission to the PROMO and ONU.
As mentioned in
Figure 5, the solution being developed utilizes a photodiode as the main detector component for detecting the presence of a laser signal. A photodiode generally will convert the small amount of light energy received from the OLT into electrical signal levels.
In principle, the operation of this component is based on the reverse bias voltage, as compared to the light-emitting diode (LED) operation. It is built with an intrinsic region ‘sandwiched’ between the p- and n- regions. When a light hits the intrinsic layer, an electron–hole pair is created, leaving a hole behind. This happens when the electron is raised from the valence band to the conduction band. The applied bias voltage causes the electron in the valence band (current) to flow away from the junction region and produce a current value proportional to the incident light [
32]. This property will be used to characterize the resulting current or voltage with respect to the downstream laser signal from the OLT.
Table 3 describes this scenario.
Then, from here, the resulting voltage from the photodiode is fed to the comparator circuit to compare with the reference voltage, which is proportional to the laser power intensity. As shown in
Figure 6, the comparator circuit consists of a single chip. There are two sets of comparators in the chip, with inverting and non-inverting input and a single output from each. Consequently, the output will be low if the inverting input voltage level is higher than the non-inverting one, and vice versa. Hence, the circuit is configured as shown in
Figure 6, indicating that one of the inputs (inverting) is coming from the photo diode and the other one is from the reference voltage configured using the variable resistor. From here, only the output port of the comparator chip is connected to the microcontroller for the activation process.
In this design, the controller is also interfacing with the other modules that include the optical switch circuit and the comparator circuit, as mentioned before. The result from the comparator circuit is crucial in determining which link should be used.
The comparator circuit will compare the configured reference voltage and the resulting photodiode voltage. The result from this comparison will yield a high or low voltage level that indicates the status of the distribution link to the respected ONU.
Next, the optical switch will perform the function of changing from the working and protection link with a 2 × 1 optical switch. As far as its operation is concerned, the controller module will control it though a transistor circuit that acts as an ON–OFF switch based on the input voltage to the transistor’s base terminal. The switching will take place when there is a 5 VDC voltage potential applied to its pin. By default, the switch is in ‘bar’ mode, that is, port 1 is connected to port 2. If it receives voltage potential to its pins, it will switch to ‘crossed’ mode, where port 3 and port 1 are connected.
By placing the detection module at the ONU side, the PON or distribution network will remain in passive mode and thus simplify the connection and maintenance process. This idea provides flexibility to the protection architecture since it can be installed in any type of ONU, and also the protocols are transparent. The idea of detection using the existing wavelength will reduce the equipment or components to be used at the OLT side. In short, all of these will make the proposed system more cost efficient as well as simpler in terms of installation and maintenance.
As a result, the protection and restoration function in the FTTH distribution network is achieved though detection and switching the link from one to another.
Figure 7 shows the functional block diagram of the whole proposed system based on the proposed design.
4. Simulation Process
The simulation design is proposed based on the generic FTTH network architecture and implemented using OptiSystem simulation software. This is to ensure that the environment is similar with the actual deployed FTTH specification. The objective of this simulation exercise is to test and verify the functionality and feasibility of the proposed design within the FTTH network environment. However, the scope of this simulation is on the optical and physical layer only and, as depicted in
Figure 8, the design consists of an OLT, the optical network (PON), an optical splitter and the ONU.
The simulation focuses on downstream signal transmission in order to emulate the actual scenario in which detection happens in the downstream signal. Hence, on the OLT side, the major parameters have been defined as the actual OLT’s parameters. For example, the downstream optical power transmission is configured with 1490 nm at 2 dBm optical transmission power with the 1.25 Gbps NRZ modulation technique.
Then, the optical network segment is designed with single mode fiber (SMF) with 0.2 dB/km optical signal loss value, an approximation with the actual optical fiber cable loss characteristic in the field. The same cable type is used for both the feeder and distribution segments. Then, an optical splitter is placed just before the distribution segment to simulate the appropriate splitting ratio value and multiple users’ connections. The default or initial value for this optical splitter is 4, or the 1 × 4 splitter type.
After that, the ONU is defined at the end of the distribution network. The main component is configured with a receiver block and the required analyzer, such as a BER analyzer, an optical power meter or the optical spectrum analyzer (OSA) library.
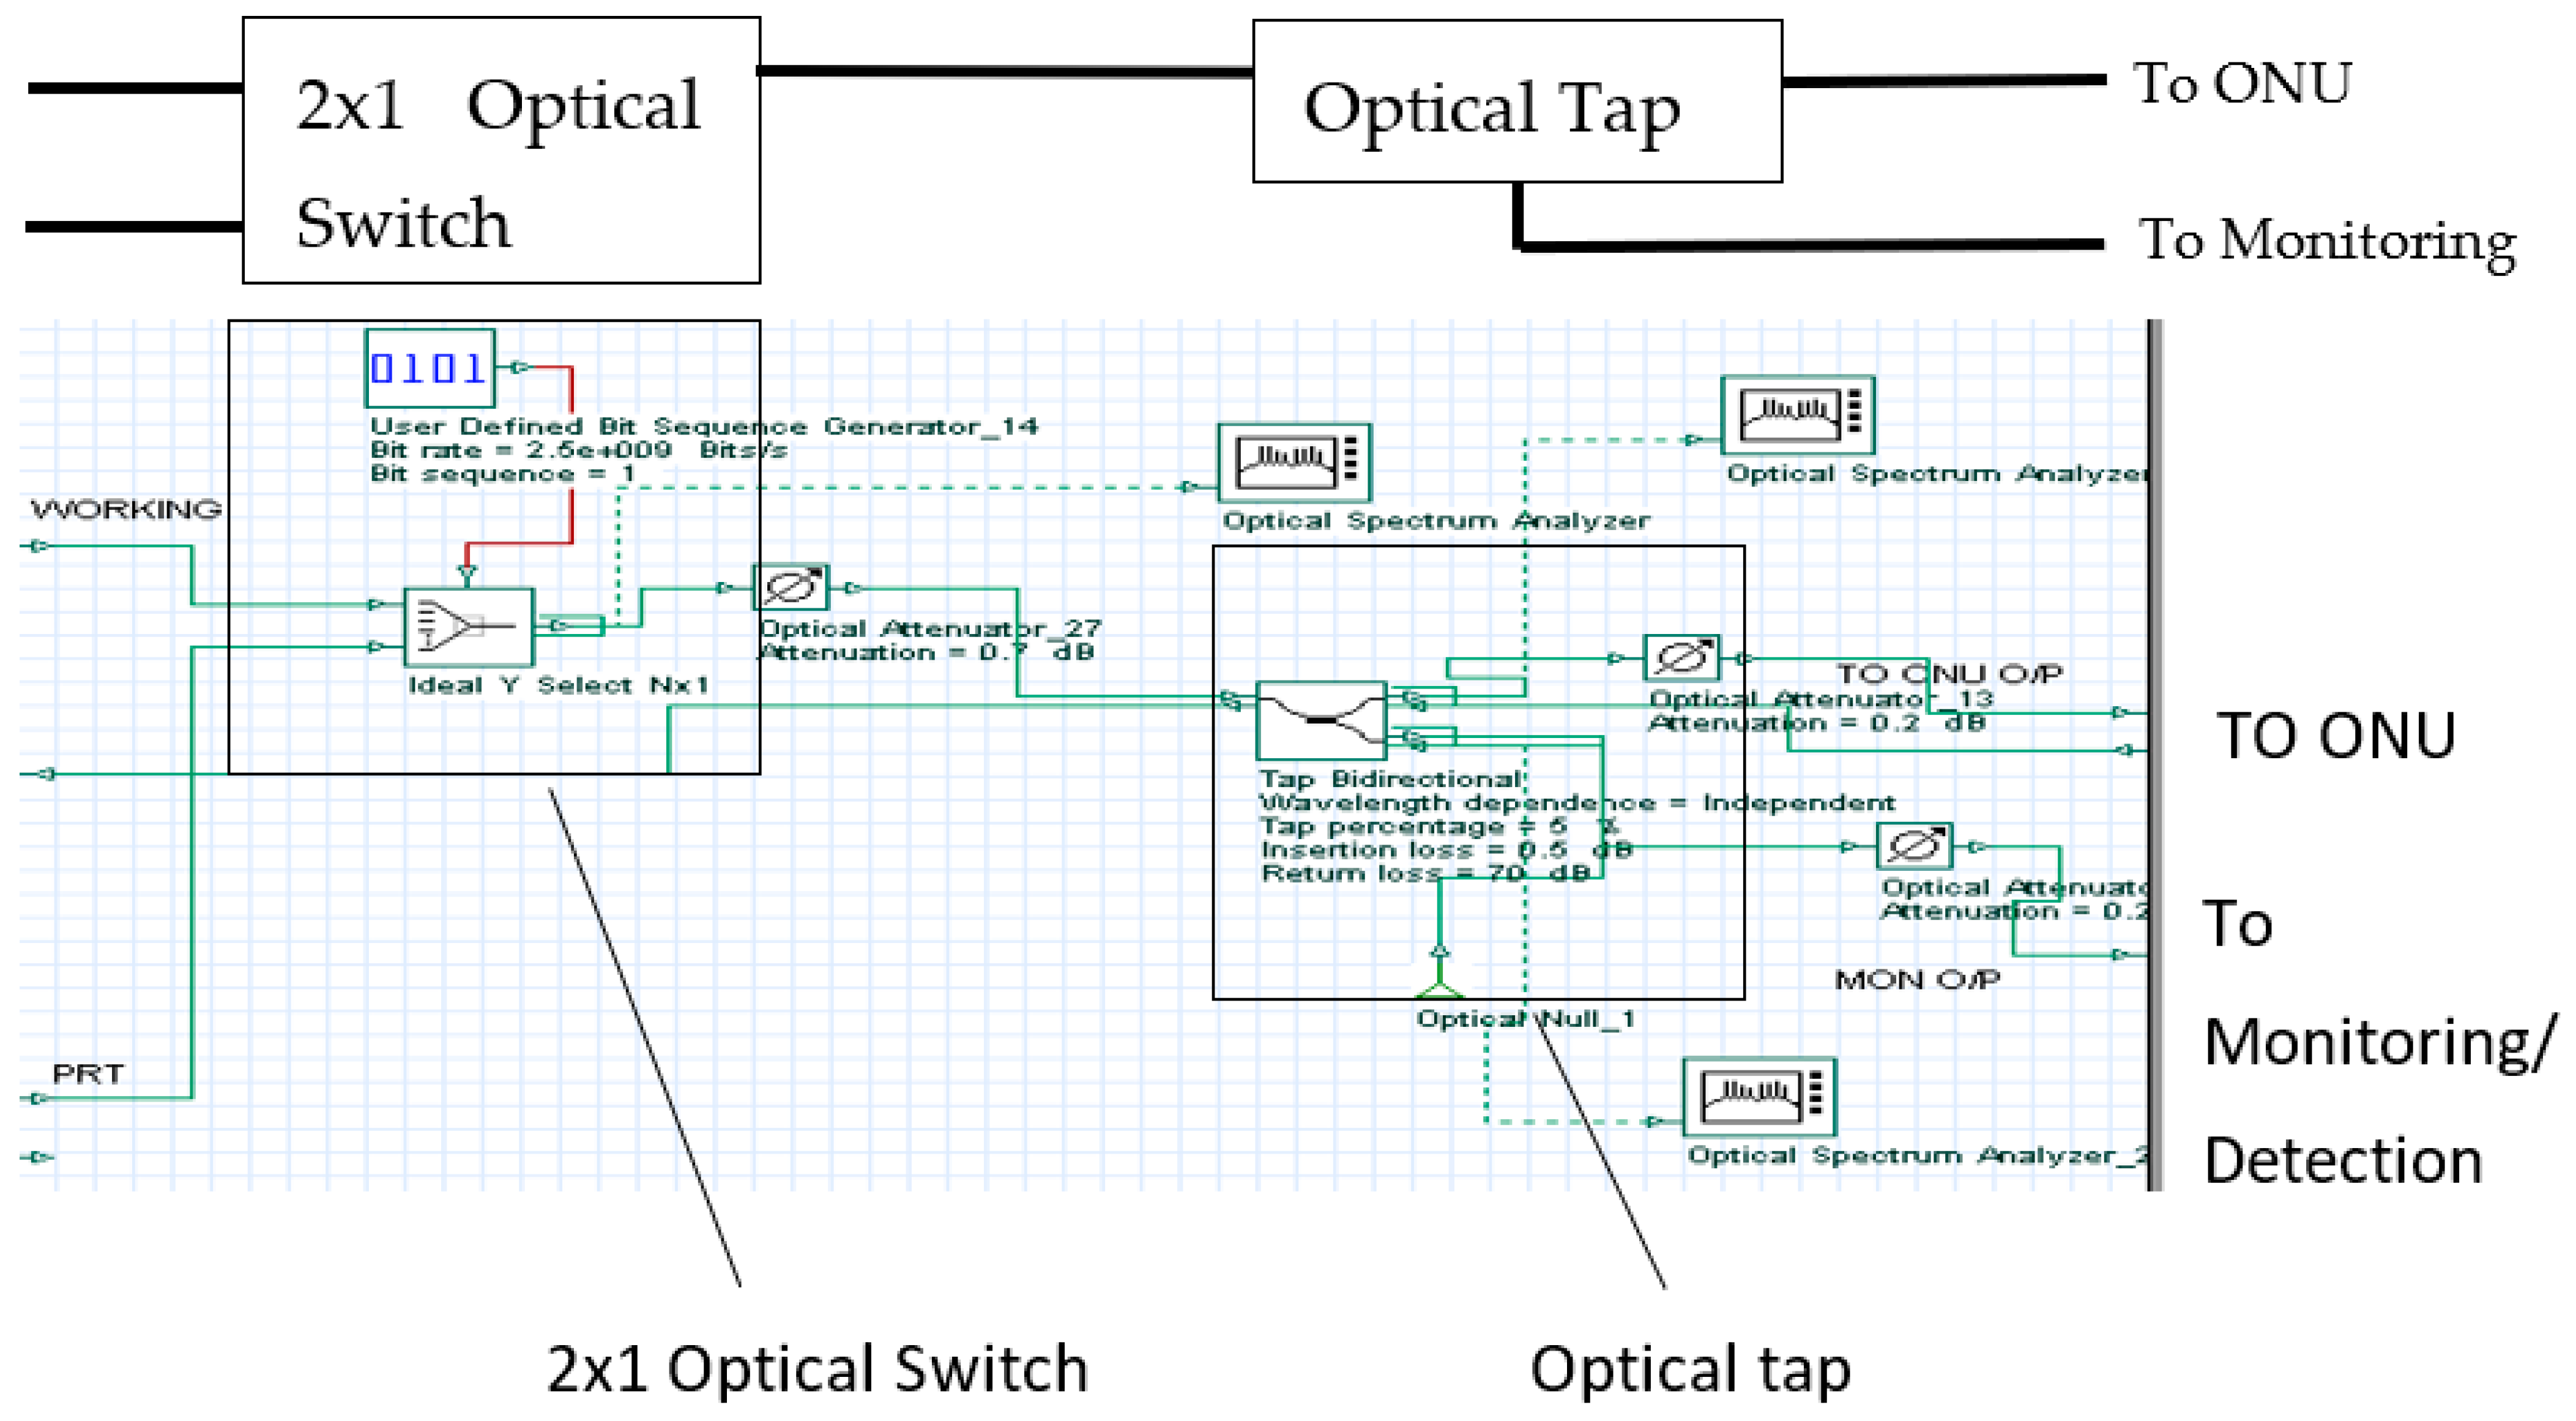
The next step is to define the PROMO module together with the ONU. Similarly, as defined in the previous section, the module will consist of an optical taper for taping a portion of the downstream optical signal for monitoring purposes. Only 5% of the downstream optical signal is tapped for this matter.
Figure 9 shows the simulation layout for PROMO.
The simulation is executed with different types of scenarios for both working and protection links:
- (a)
Variation in distance between OLT and ONU: to analyze the effect of the received signal at PROMO and ONU when the distance is increased;
- (b)
Variation of the splitting ratio: to analyze the effect of varying the optical splitter port number to implicate the increasing number of users;
- (c)
Vary the tapping ratio: to analyze the effect of using different tapping ratios;
- (d)
Integrate with the existing ‘zig-zag’ protection scheme for compatibility and feasibility analysis.
5. ACS and PROMO in the ‘Zig-Zag’ Scheme (Special Case)
In the latter simulation task, the concept is based on the ‘zig-zag’ scheme in the distribution network, as developed earlier [
22,
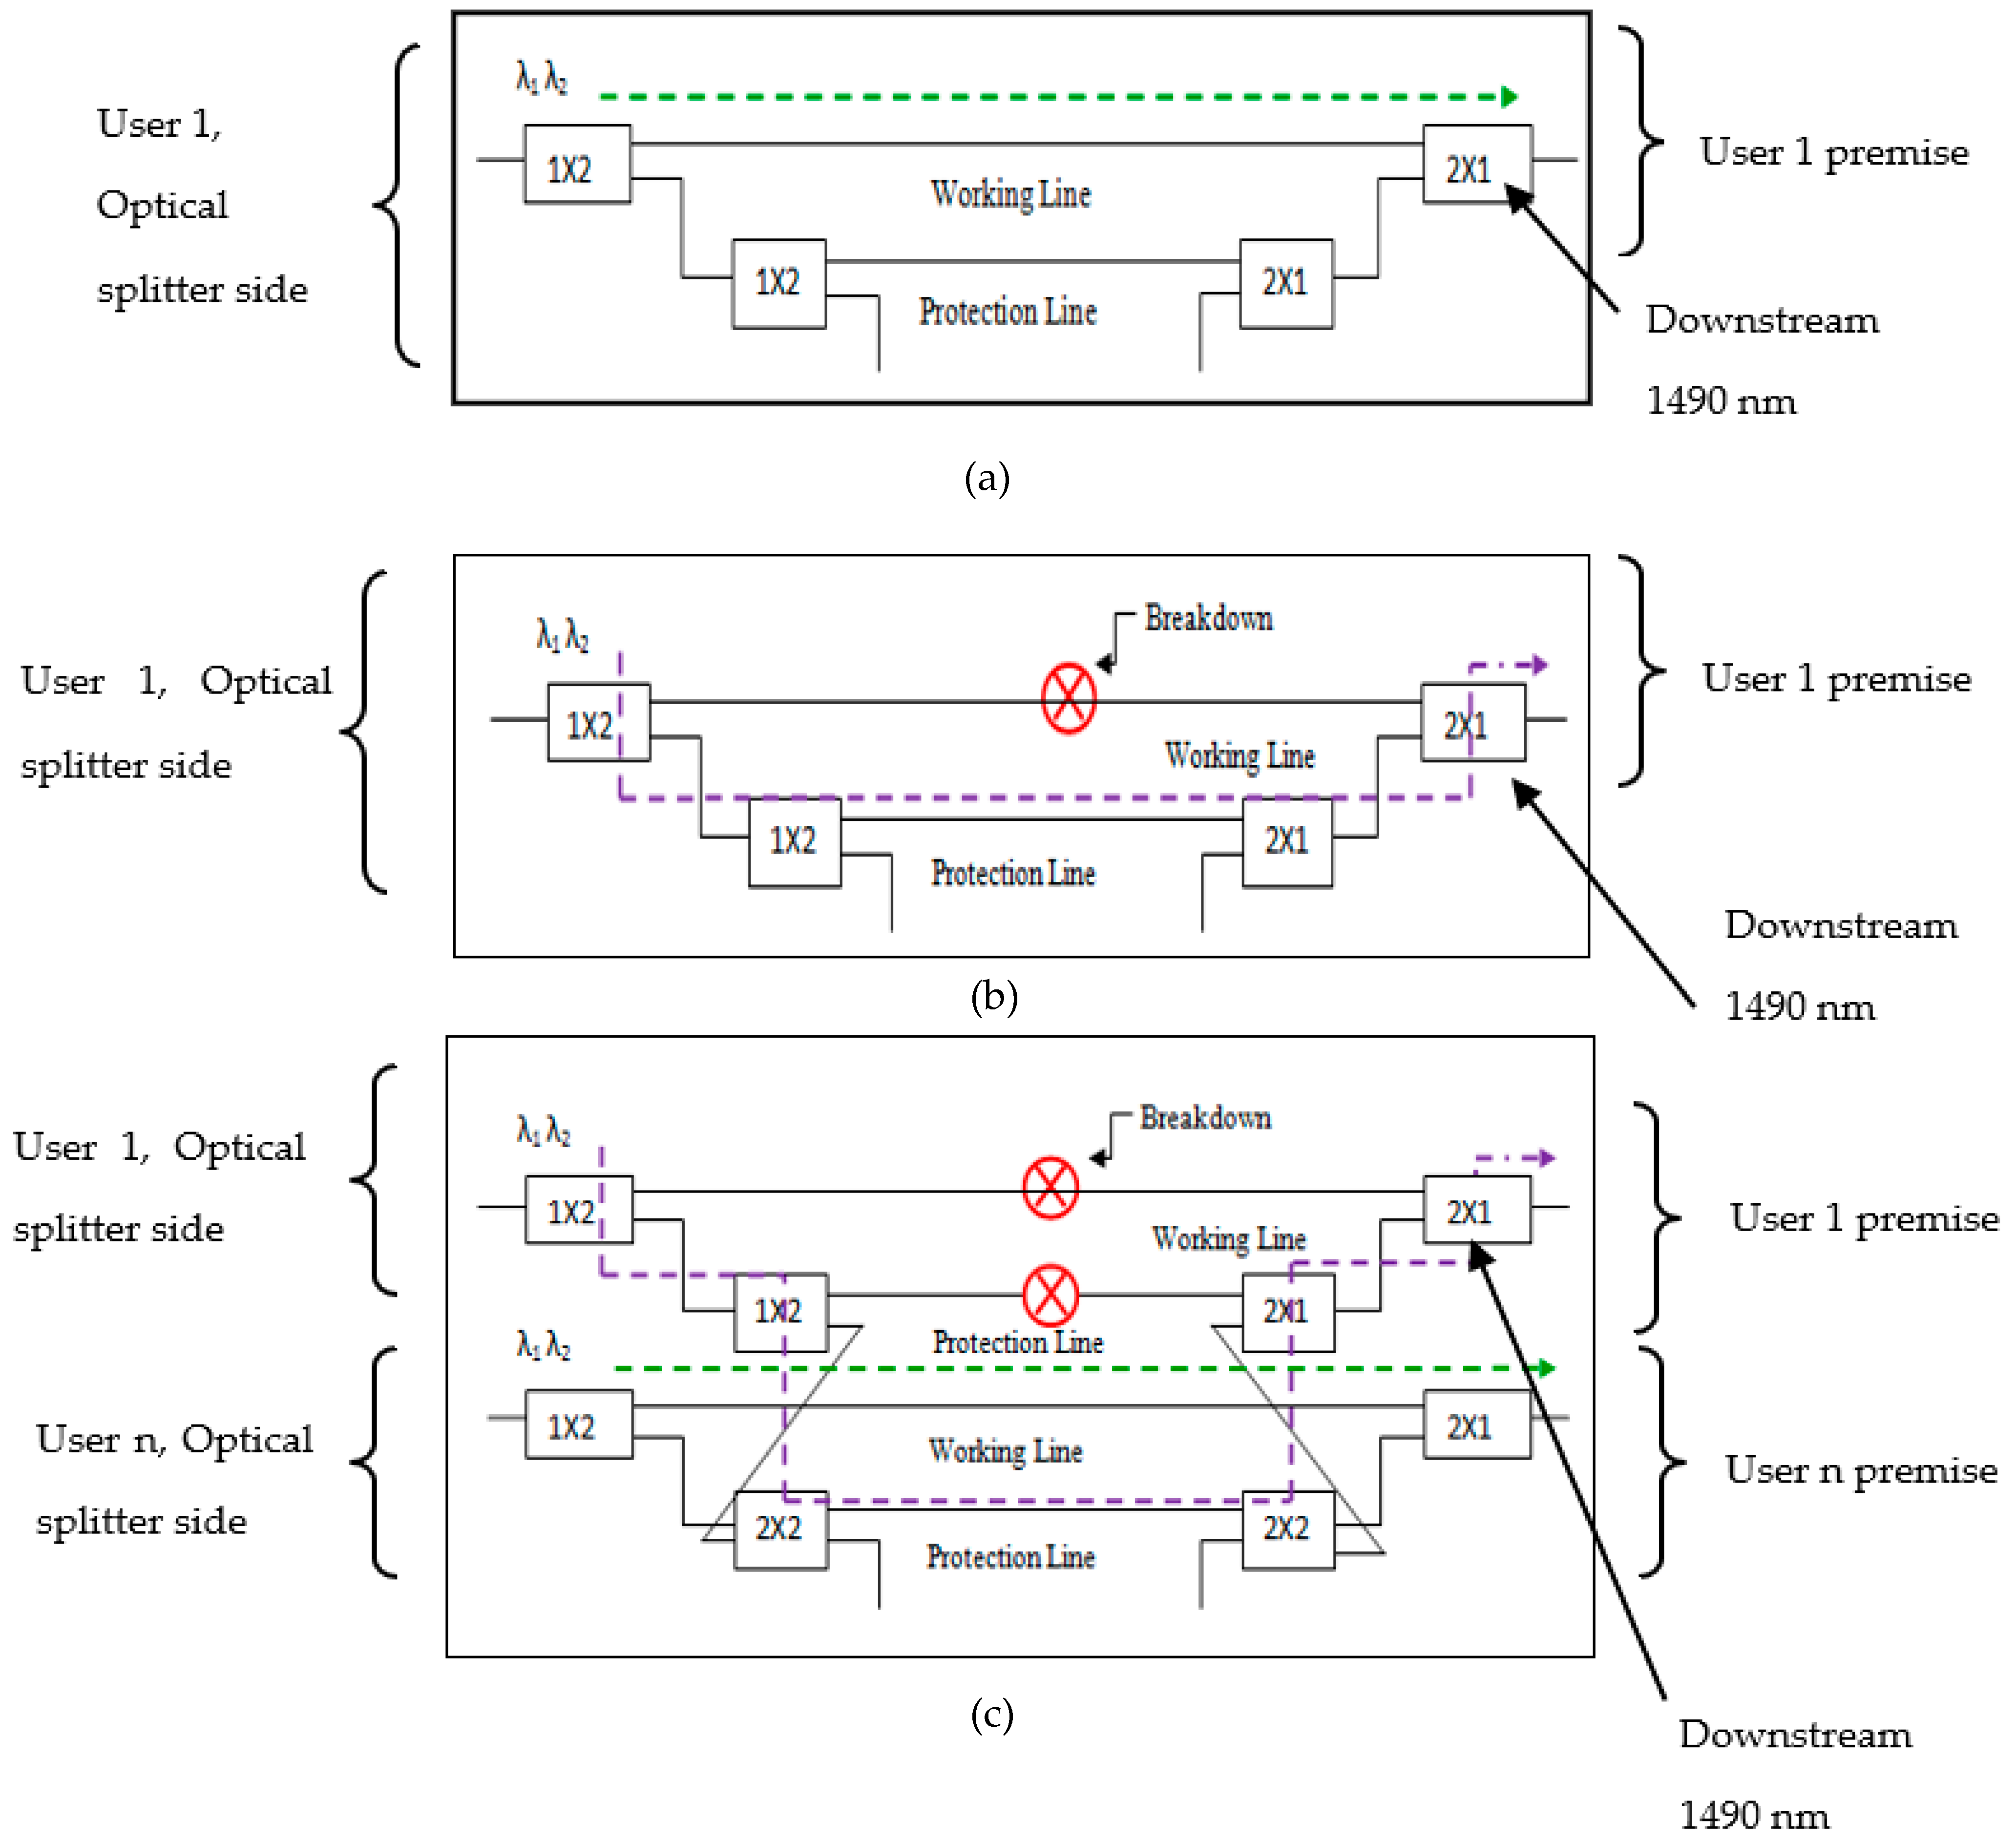
33]. There are two options that could be utilized in this scheme: ‘working and protection’ or the ‘working, protection and sharing’ of the neighbor’s protection link, should the main protection link fail. As depicted in
Figure 4, typically each user will be connected with a pair of fiber cables. In order to utilize the neighboring protection links and interconnect with each neighboring ONU, three to four fiber cables are needed for each user. From the operation perspective, during normal communication, only the working link is used, as in
Figure 10a. The switch pairs on both sides are configured by the controller to change to the protection link if the working link is faulty, as seen in
Figure 10b. Finally, if both working and protection links are failed, the optical signal will be routed to the next neighbor’s protection link (
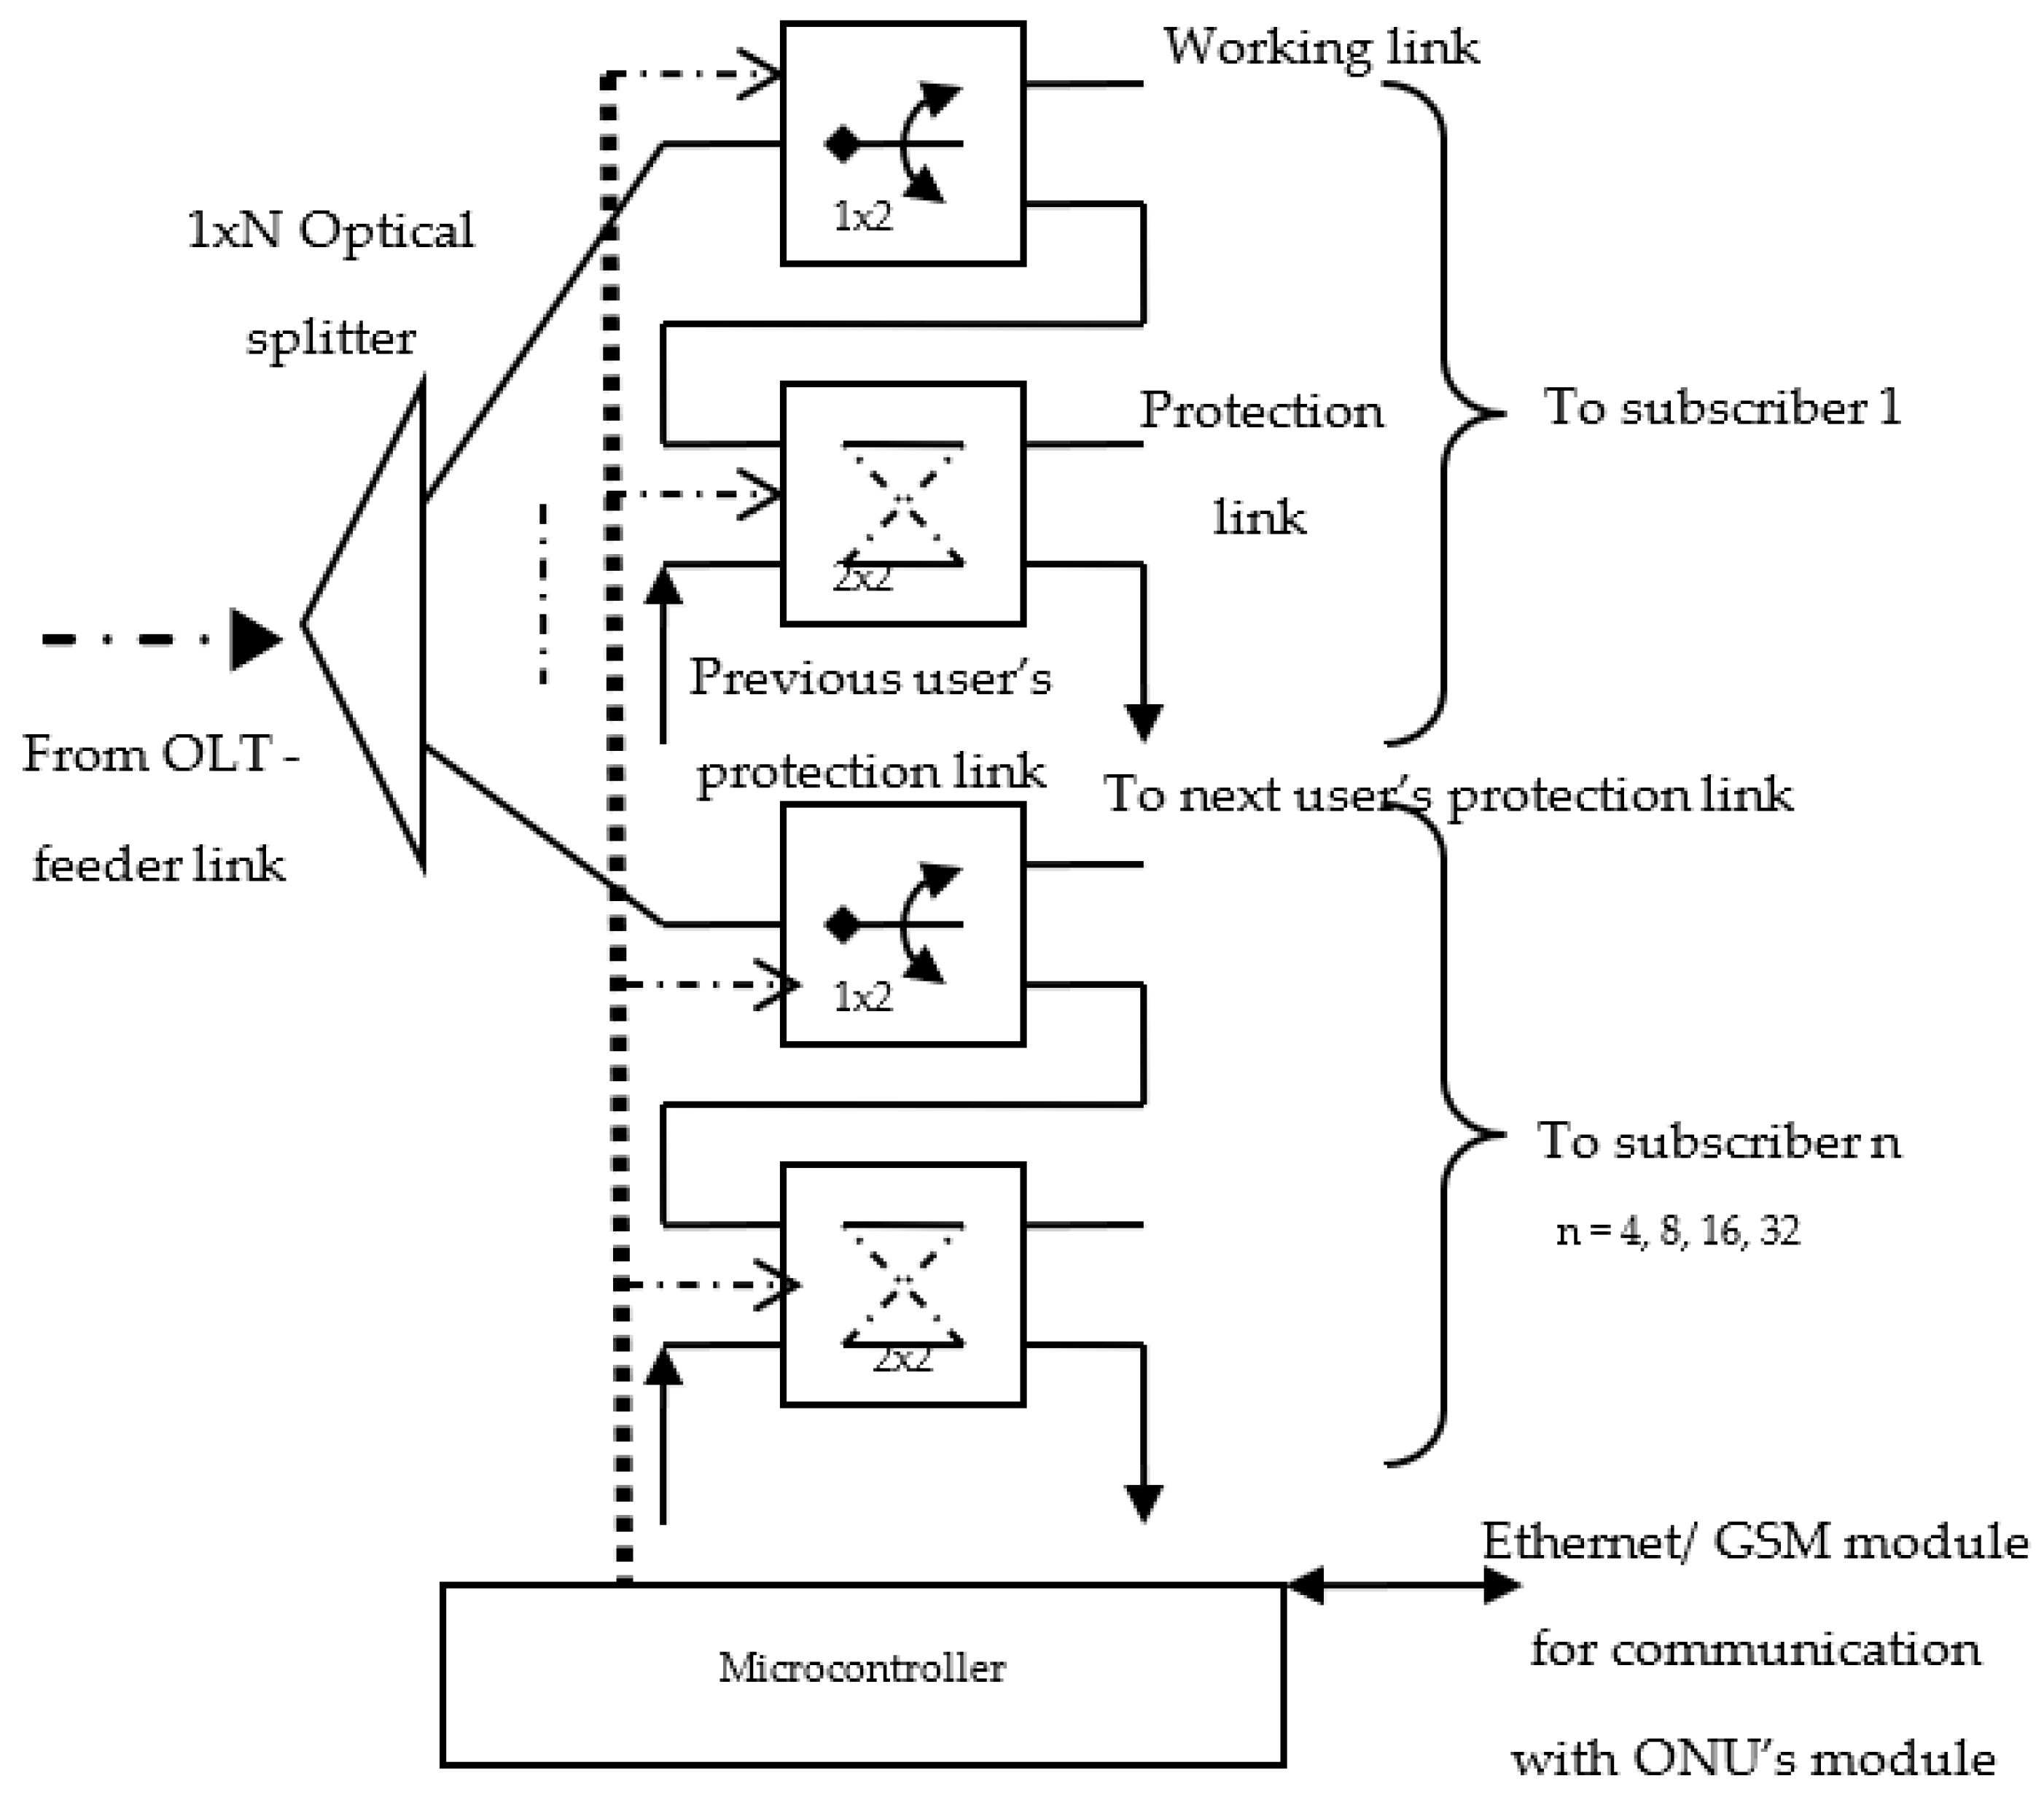
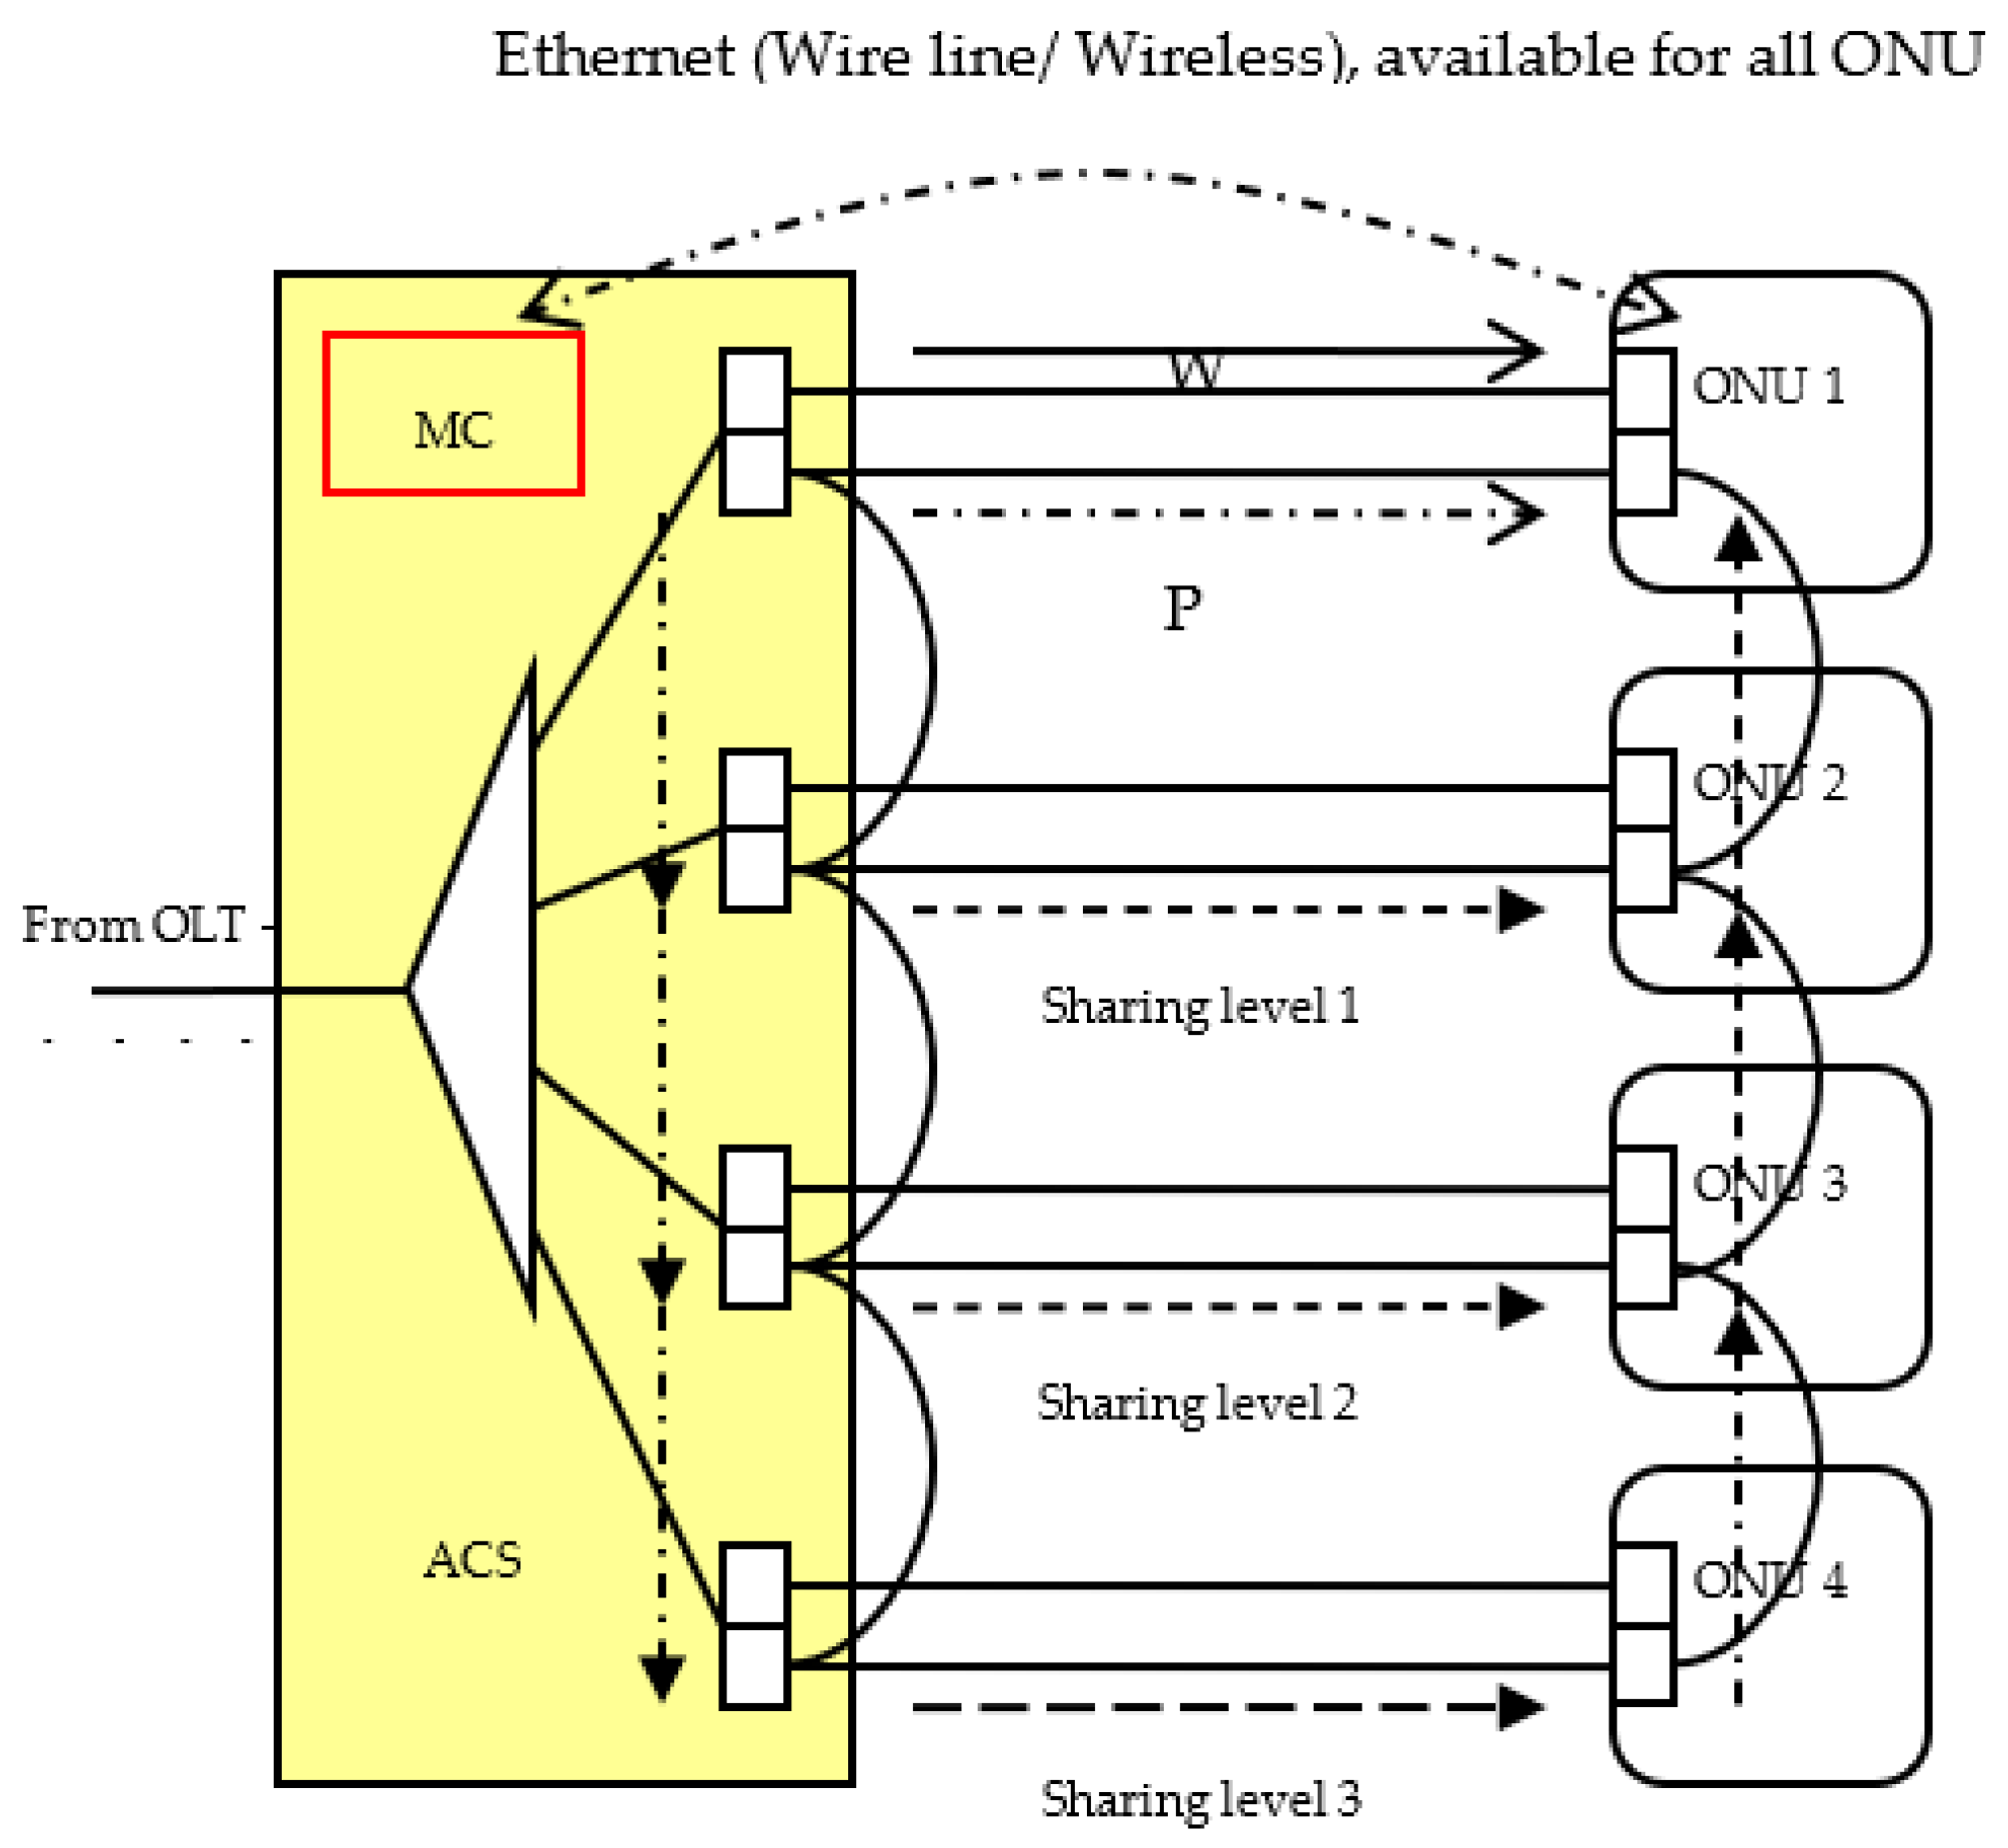
Figure 10c). When using this scheme there are minor modifications that need to be performed to the PROMO design mentioned earlier. The switching decision will be based primarily on the status of the downstream optical signal, to be specific, the 1490 nm downstream wavelength. PROMO will be the main monitoring module that continuously checks the availability of this signal (by tapping a portion of it) through the photodiode/photo detector. On top of this, a controller called the access control system (ACS) is also integrated in the remote network (RN), as shown in
Figure 11.
ACS is the main controller module that is installed with the optical splitter at the last stage of the distribution segment. The conceptual block diagram for ACS is shown in
Figure 11. It consists of an optical splitter and a switch array for switching to the protection link and the shared neighbor’s protection link.
The splitter input is connected to the feeder cable from the OLT and the output ports are connected to a pair of optical switches that represent a single user. The output from each optical splitter will be used as a working and protection link, respectively. In addition, it is equipped with a microcontroller and wireless or GSM module for communication with the PROMO module at the user’s side. The switch state level is crucial in order to establish a correct optical link from the ACS to the PROMO module.
Having the arrangement of 1 × 2 and 2 × 2 optical switches per user would enable a protection link to be introduced in the distribution segment. As a matter of fact, the existing splitter could still be used, and from its perspective each output port would still belong to a single user. The microcontroller will complete the controlling function of the optical switch for protection and restoration, as well as undertake link sharing selection; the switch interconnection will be based on the network scheme that has been described earlier.
On the user side, the PROMO module will be installed and linked to the ACS through the working and protection cable. It consists of a pair of optical switches (1 × 2 and 2 × 2), in-line taper with photodiode, a microcontroller, a comparator circuit and the optical network unit (ONU), as depicted in
Figure 12.
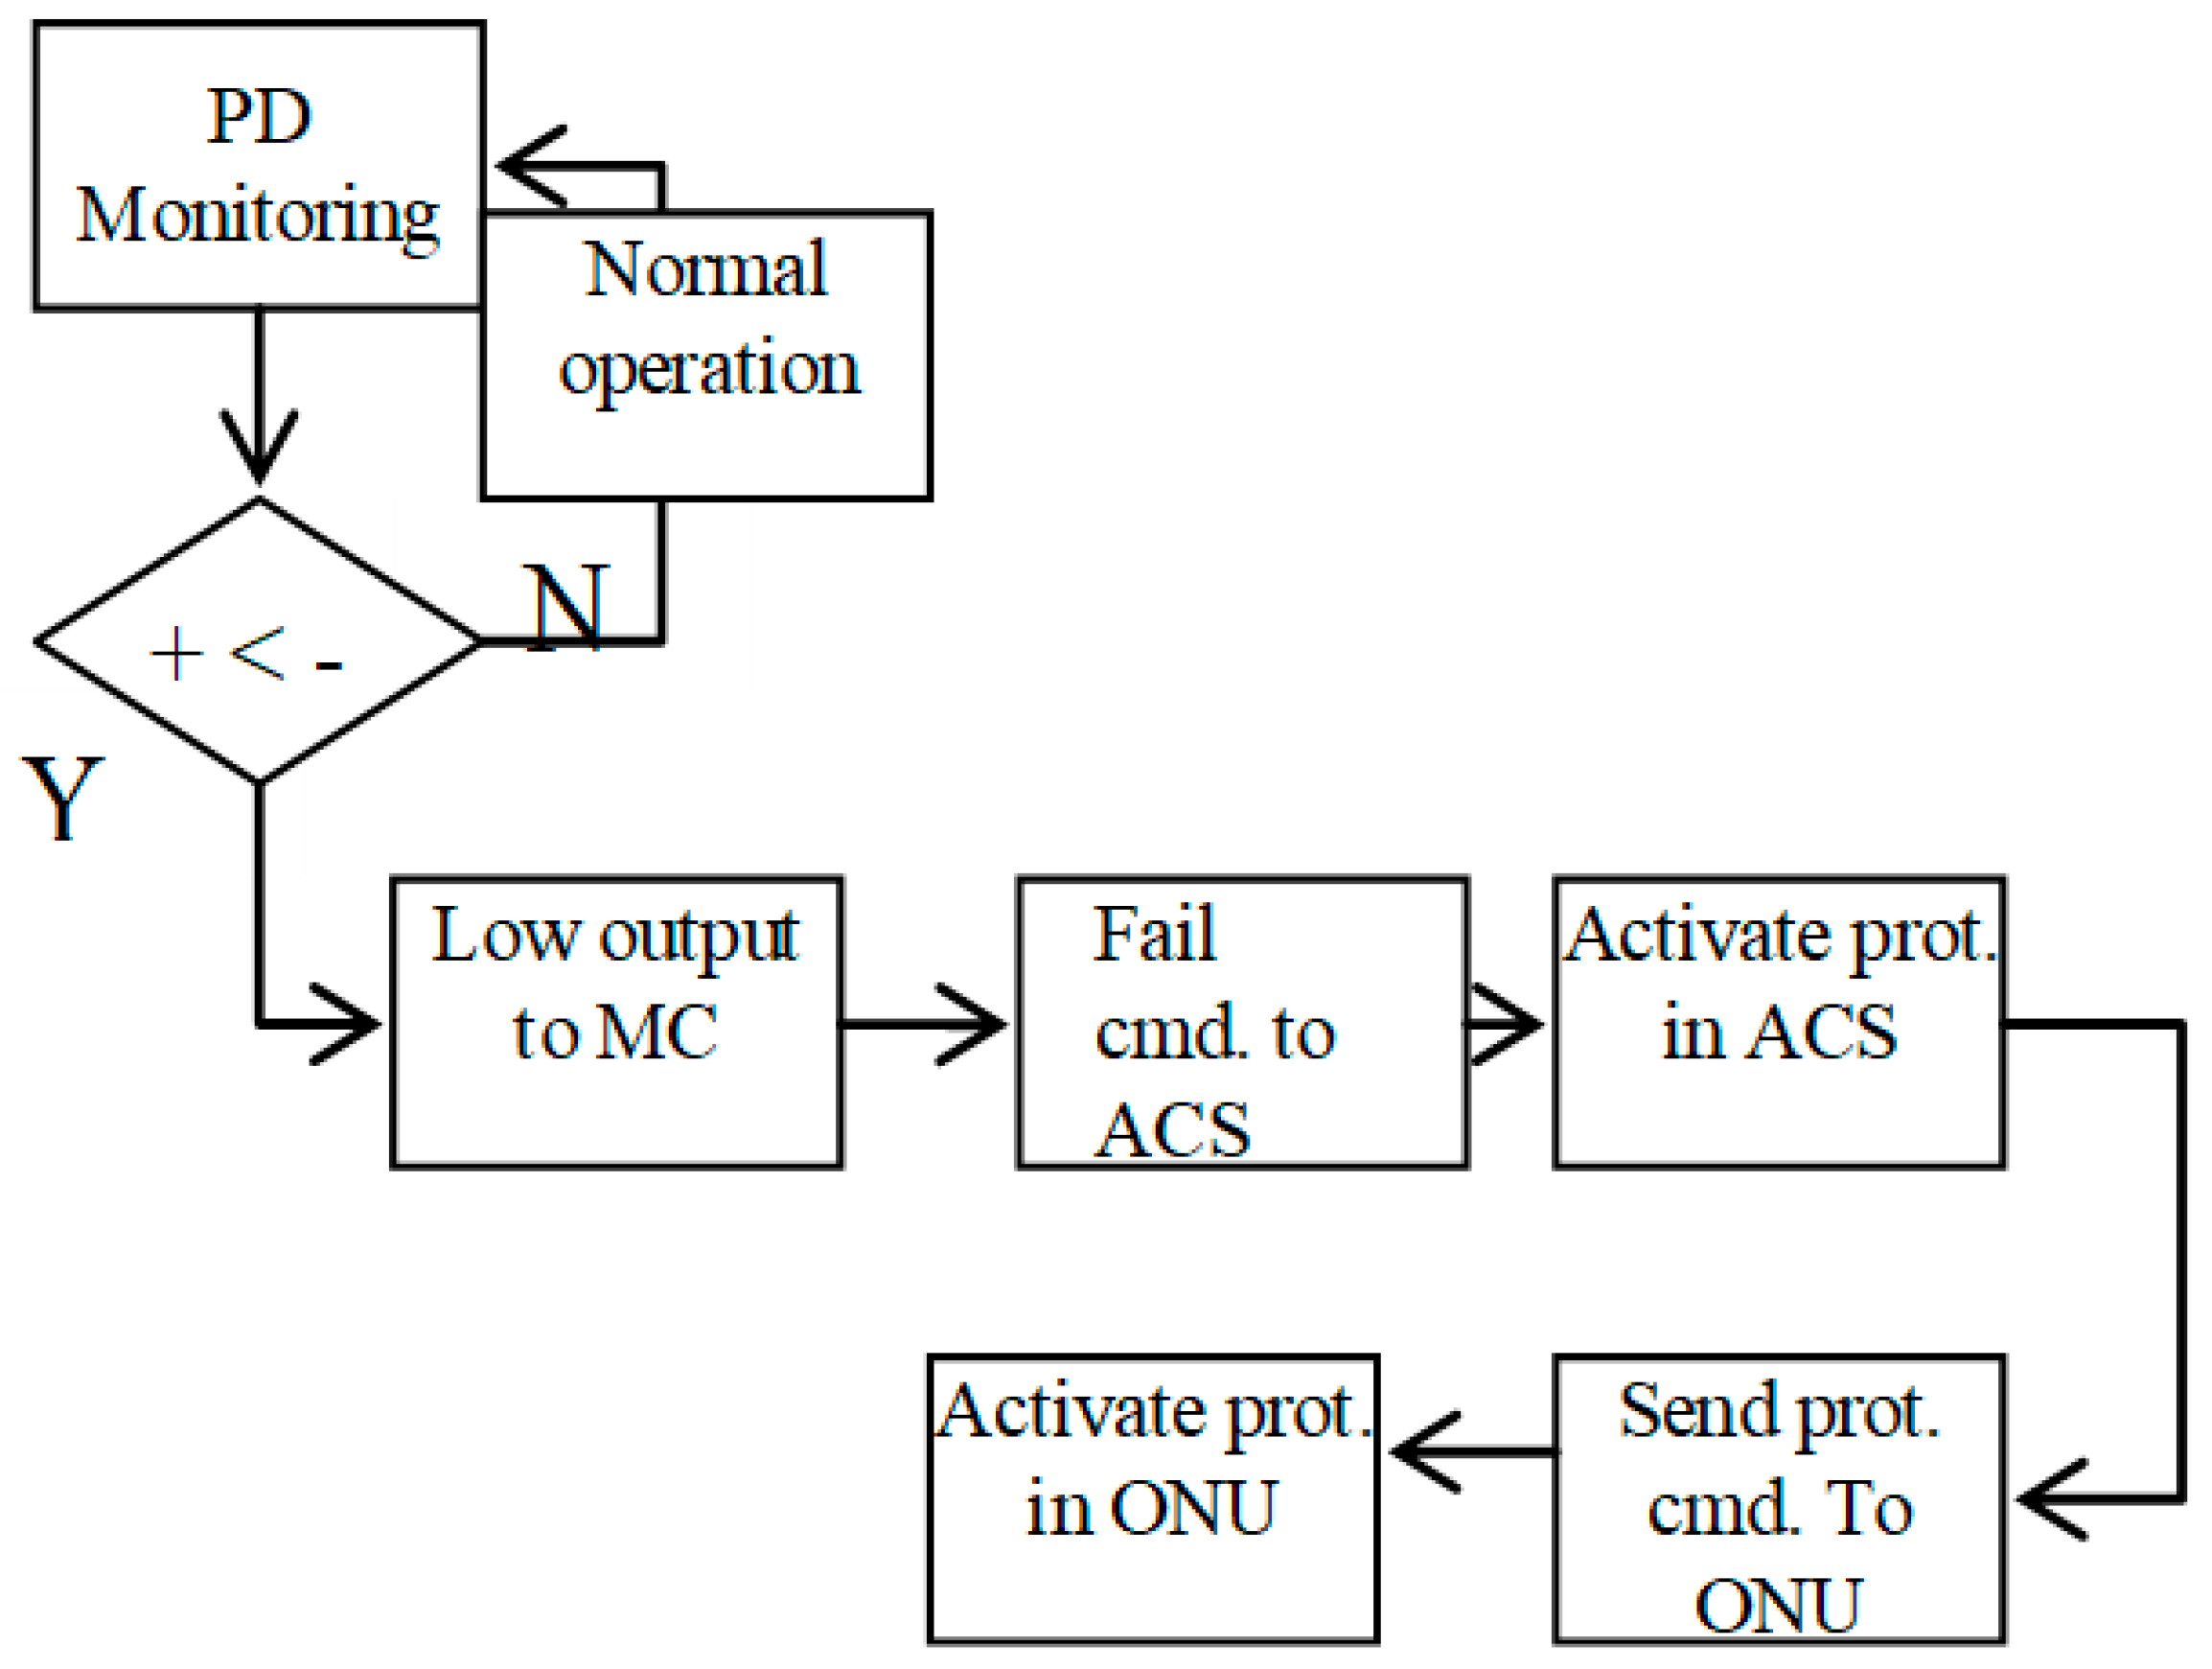
As in the ACS, the switching function in this module will also be controlled by the microcontroller. In addition, the decision to perform the switching is based on the input signal from the comparator circuit. A small amount of the 1490 nm wavelength downstream of the optical signal is tapped for monitoring purposes by the photodiode prior reaching the ONU port. The photodiode will convert this optical signal to the electrical signal and feed it to the comparator circuit. The result of this circuit will be used by the microcontroller for changing from the working to the protection link and vice versa. PROMO will also communicate with ACS in order to inform link failure, since the optical switches at both sides need to be synchronized or in the same state so that the link is established for user traffic. The mechanism is summarized in the flowchart in
Figure 13.
Combining ACS and PROMO together will produce a complete distribution side protection and restoration solution in the FTTH distribution segment. As shown in
Figure 14, and with the scheme defined earlier, a protection and sharing of the neighbor’s protection link will be made possible.
Practically, the interconnection between switch pairs for each user in the ACS is performed internally, while on the PROMO side, external wiring has to be implemented since they are located at different locations.
The simulation will be based on this configuration and the results also show the compatibility of the PROMO design with this type of scheme.
6. Experiment Method
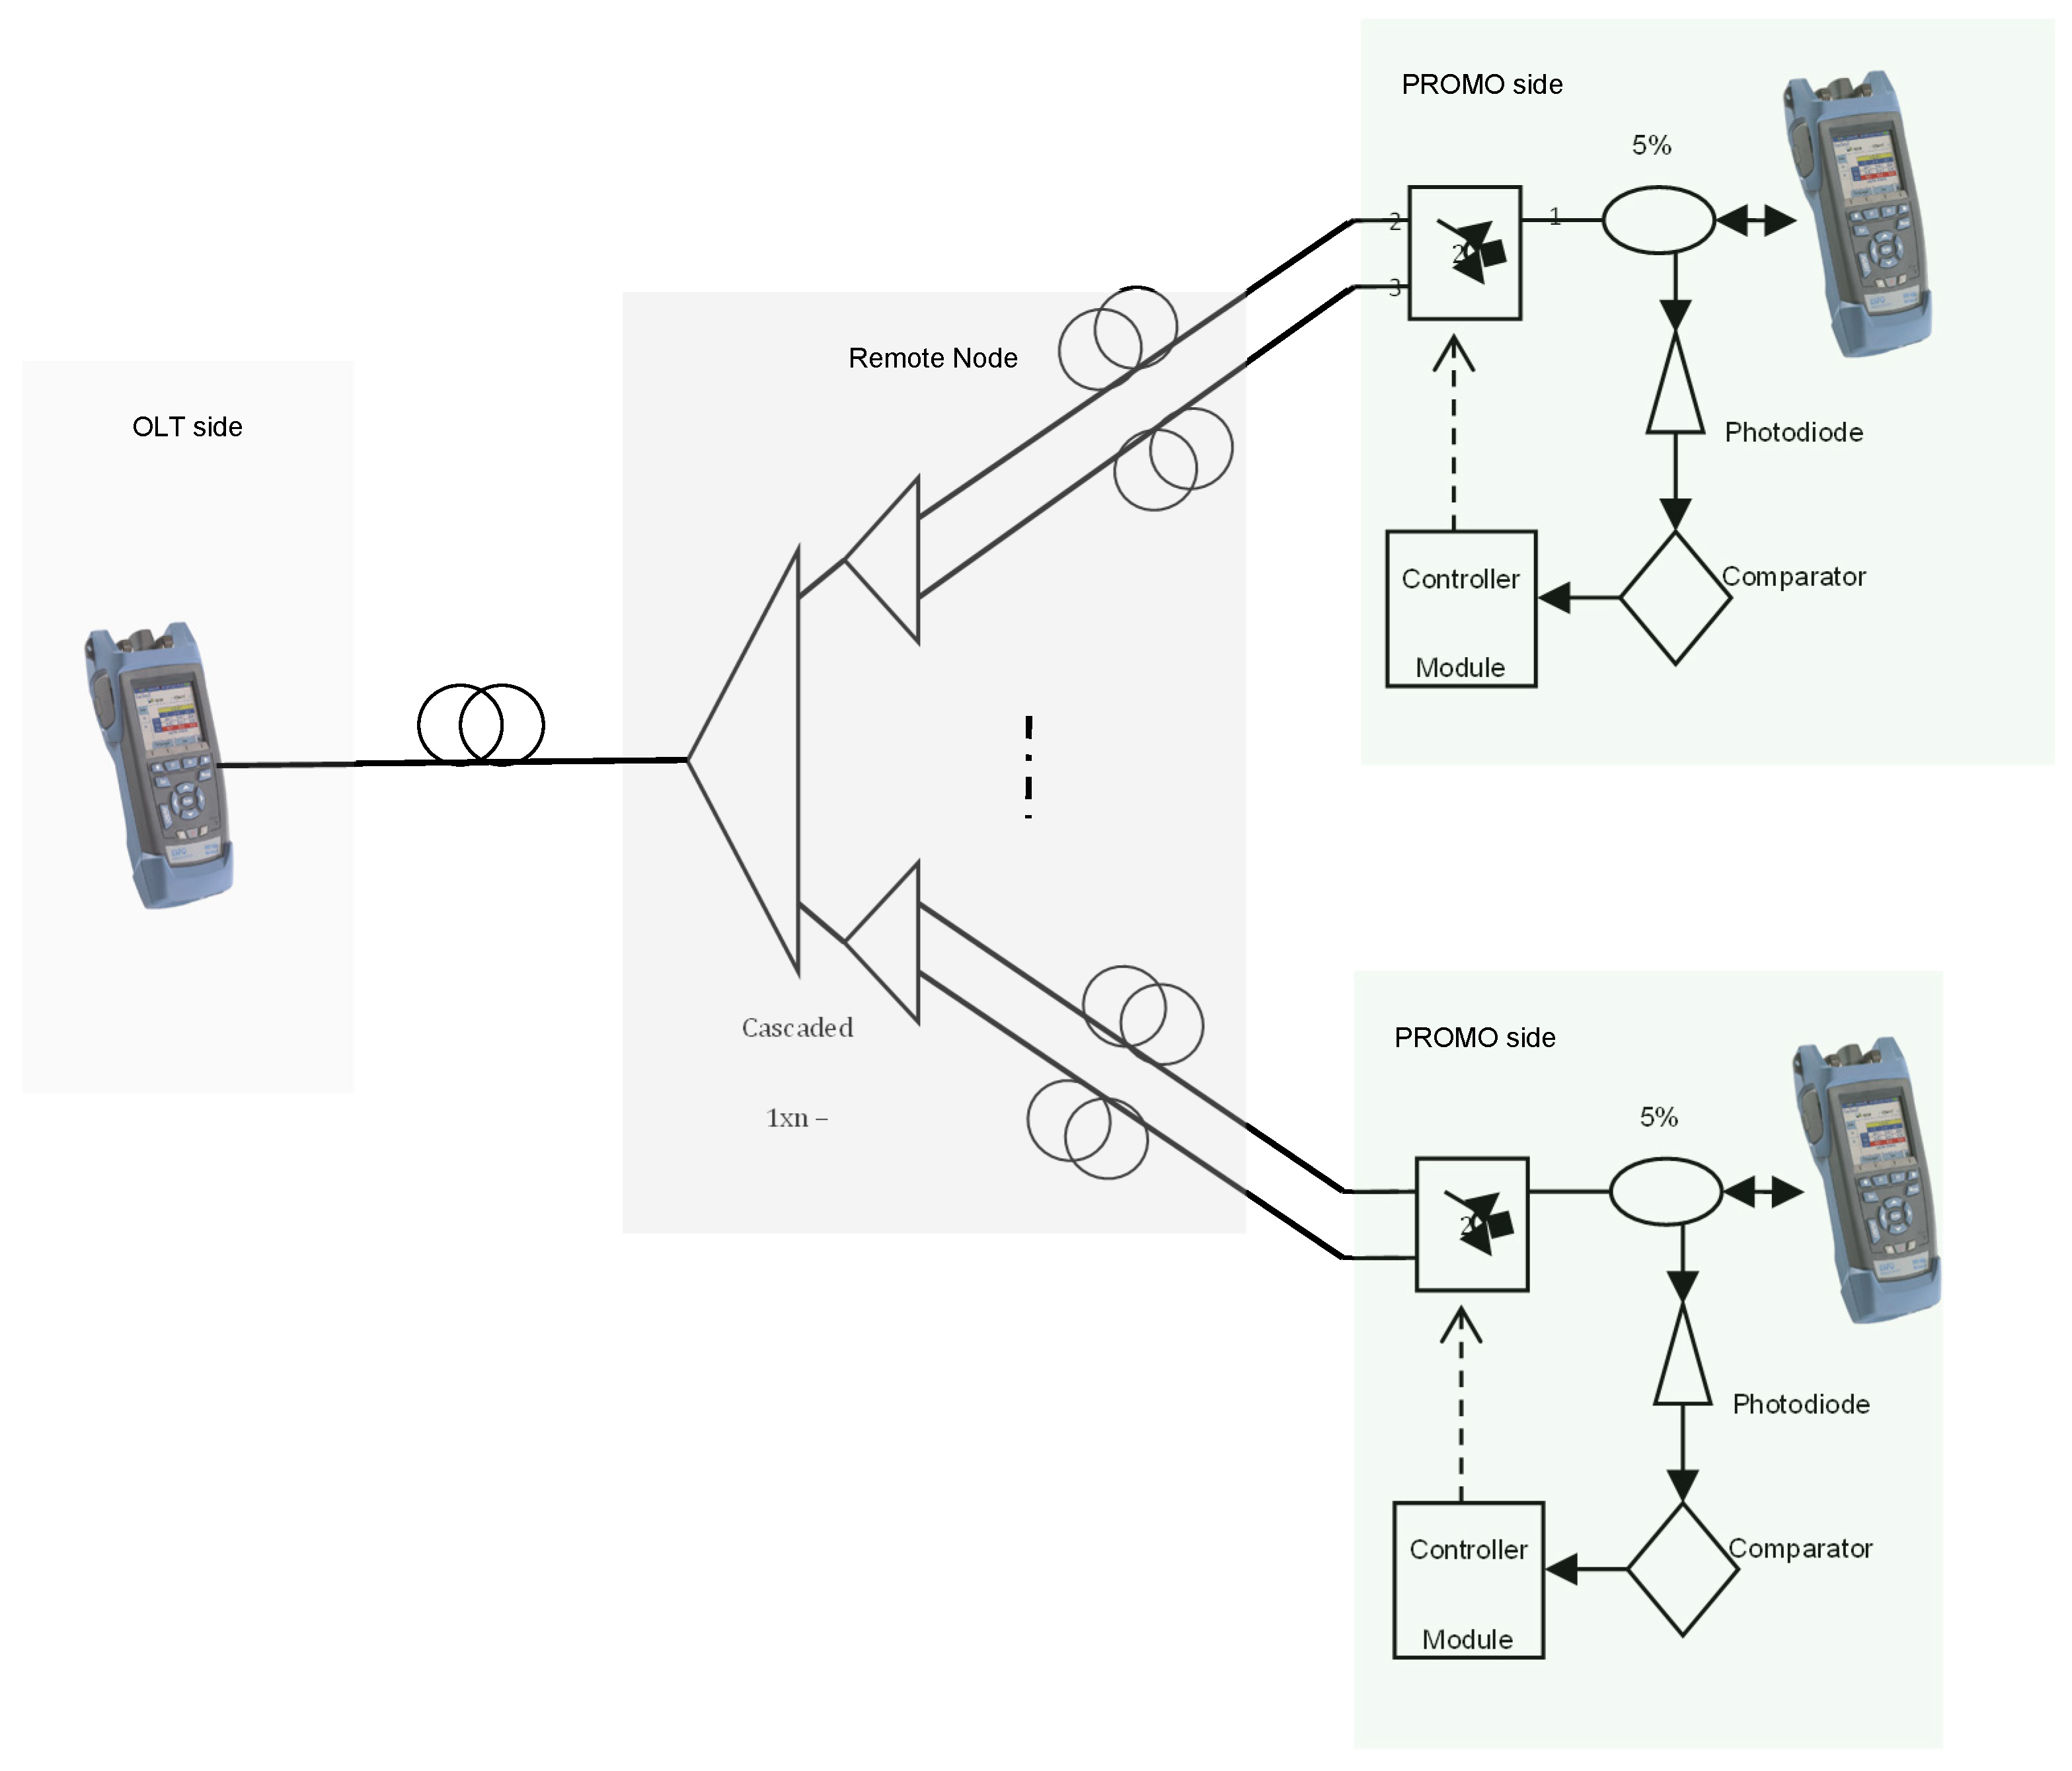
Based on the defined architecture in the previous section, PROMO should be treated as one of the components in the FTTH network system. The experiment will be carried out to ensure that it will not interfere with the function of the existing FTTH communication system and simultaneously act as an effective link protection and restoration function. As depicted in
Figure 15, PROMO will be placed at the subscribers’ side and will be connected to the ONU through its optical interface port. In this configuration, the electronics part of the ONU and PROMO is in a different PCB. However, only optical signaling is the focus of our experiment and discussion in this paper.
The experiments will cover these scopes and steps:
- (a)
Received optical power and loss characteristics and its effects:
As we know, in the FTTH system, the defined wavelength is 1490 nm for downstream, 1310 nm for upstream and 1550 nm is reserved for the RF video overlay transmission. Hence, with the PROMO module in place, these wavelengths are injected from the OLT side to the ONU through the PROMO, and vice versa (for 1310 nm). The reading will be performed prior entering the ONU optical interface from the module. This is similar to what the ONU will ‘see’ from the optical perspective. Within this arrangement, tests that are related to the distance and splitting ration will also be conducted. For the distance test, fiber spool is used to emulate variations in distance in the feeder as well as the distribution section. For splitting ratio, the optical splitter is changed to another available splitting number, i.e., 1 × 2, 1 × 4, 1 × 8, 1 × 16, 1 × 32 or 1 × 64.
The received optical power and loss effect is recorded for both links and will be analyzed on its feasibility and compatibility in the FTTH network. All of the measurements are performed using the optical loss test set that has a built-in laser source.
- (b)
Protection and restoration function:
The main idea of this design is to provide an automatic link protection and restoration function in the FTTH network. Hence, this experiment is conducted by simulating fiber optic cable break within the distribution network segment. The PROMO module should be able to handle this situation by switching to the protection link based on the detection of the photodiode.
In this experiment, a pair of cables is connected from the RN optical splitter to the PROMO optical interfaces port. The working link is disconnected from the splitter port to simulate a fiber optics cable break. A laser source is used at the OLT side for generating a downstream optical signal and an optical loss set with a power meter placed at the optical output of the PROMO module to measure the received power either on the working well or the protection link.
PROMO has also been tested experimentally on the ‘zig-zag’ scheme to prove the feasibility in any FTTH network. This is depicted in
Figure 16. The PROMO facilitates the incoming signal from the different output of the switch before it enters the ONU.
7. Results and Discussions
By introducing the PROMO module in the FTTH system, it is expected that there will be some effect on the communication link between the OLT and the ONU. However, this effect could be tolerated as long as the received signal power and other PON-related transmission parameters are within the acceptable operating value. This section will also discuss the result of the usage of the ‘zig-zag’ scheme as described in
Section 5. This will prove the flexibility and compatibility of the PROMO design with different types of protection and restoration schemes. Furthermore, we will also discuss the results from the tasks executed in
Section 6. This will cover the received power, signal quality, split ratio, BER and Q factor.
7.1. Simulation and Experimental Result of PROMO
The initial performance measure of PROMO design with a working and protection link scheme is conducted by varying the distance between the OLT and ONU using the cable spools with different lengths. Then, the result is verified by the received optical power at the ONU interface and represented in the graph. Three exercises that have been conducted for this scheme are: simulation, experimenting with a 1490 nm laser source (to simulate a downstream signal from the OLT), and the actual OLT source.
Figure 17 shows different levels of received optical power when the distance is varied. This is due to the different levels of the transmitted optical power from the different types of sources. It also shows that the OLT transmitted the highest optical power as compared to the simulation and 1490 nm laser source. As shown in the graph, the received optical power decreased gradually as the length increased because of the loss introduced in the fiber optic cables and connectors along the link. However, each of the results followed the same pattern as the distance increased.
Additionally, there was a small variance between each of the working and protection link pairs for all three exercises caused by the link connector and termination. As far as the sensitivity level of the ONU is concerned, this result is within the actual implementation level where the defined value is within −25 dBm and −30 dBm [
34]. This is promising, especially if referred to the actual OLT-ONU pair experiment result, where the minimum optical power value for 20 km is approximately −15 dBm only.
The simulation exercise also provided the maximum Q factor value for both the working and protection link when the OLT and ONU distance was varied. With the module installed in the FTTH network, the maximum Q recorded was considered high and within the reasonable value for the digital or optical communication requirement [
21]. The maximum value obtained was in the 1 km distance where the working link recorded 155.10 and protection link was 152.25. Meanwhile for 20 km distance, the working link was 73.81 and protection link was 71.81, as shown in
Figure 18.
Compared with the received optical power reading, a similar pattern was recorded in this simulation exercise where the value gradually decreased as the length increased. This is true as the Q factor also depends on the received optical power at the ONU optical interface.
Next, varying the value of the splitting ratio was undertaken to analyze the capability of the solution to serve as many customers as possible. The test was performed by fixing the maximum distance from the OLT and ONU, i.e., 20 km, as defined in the maximum standard distance of the FTTH system.
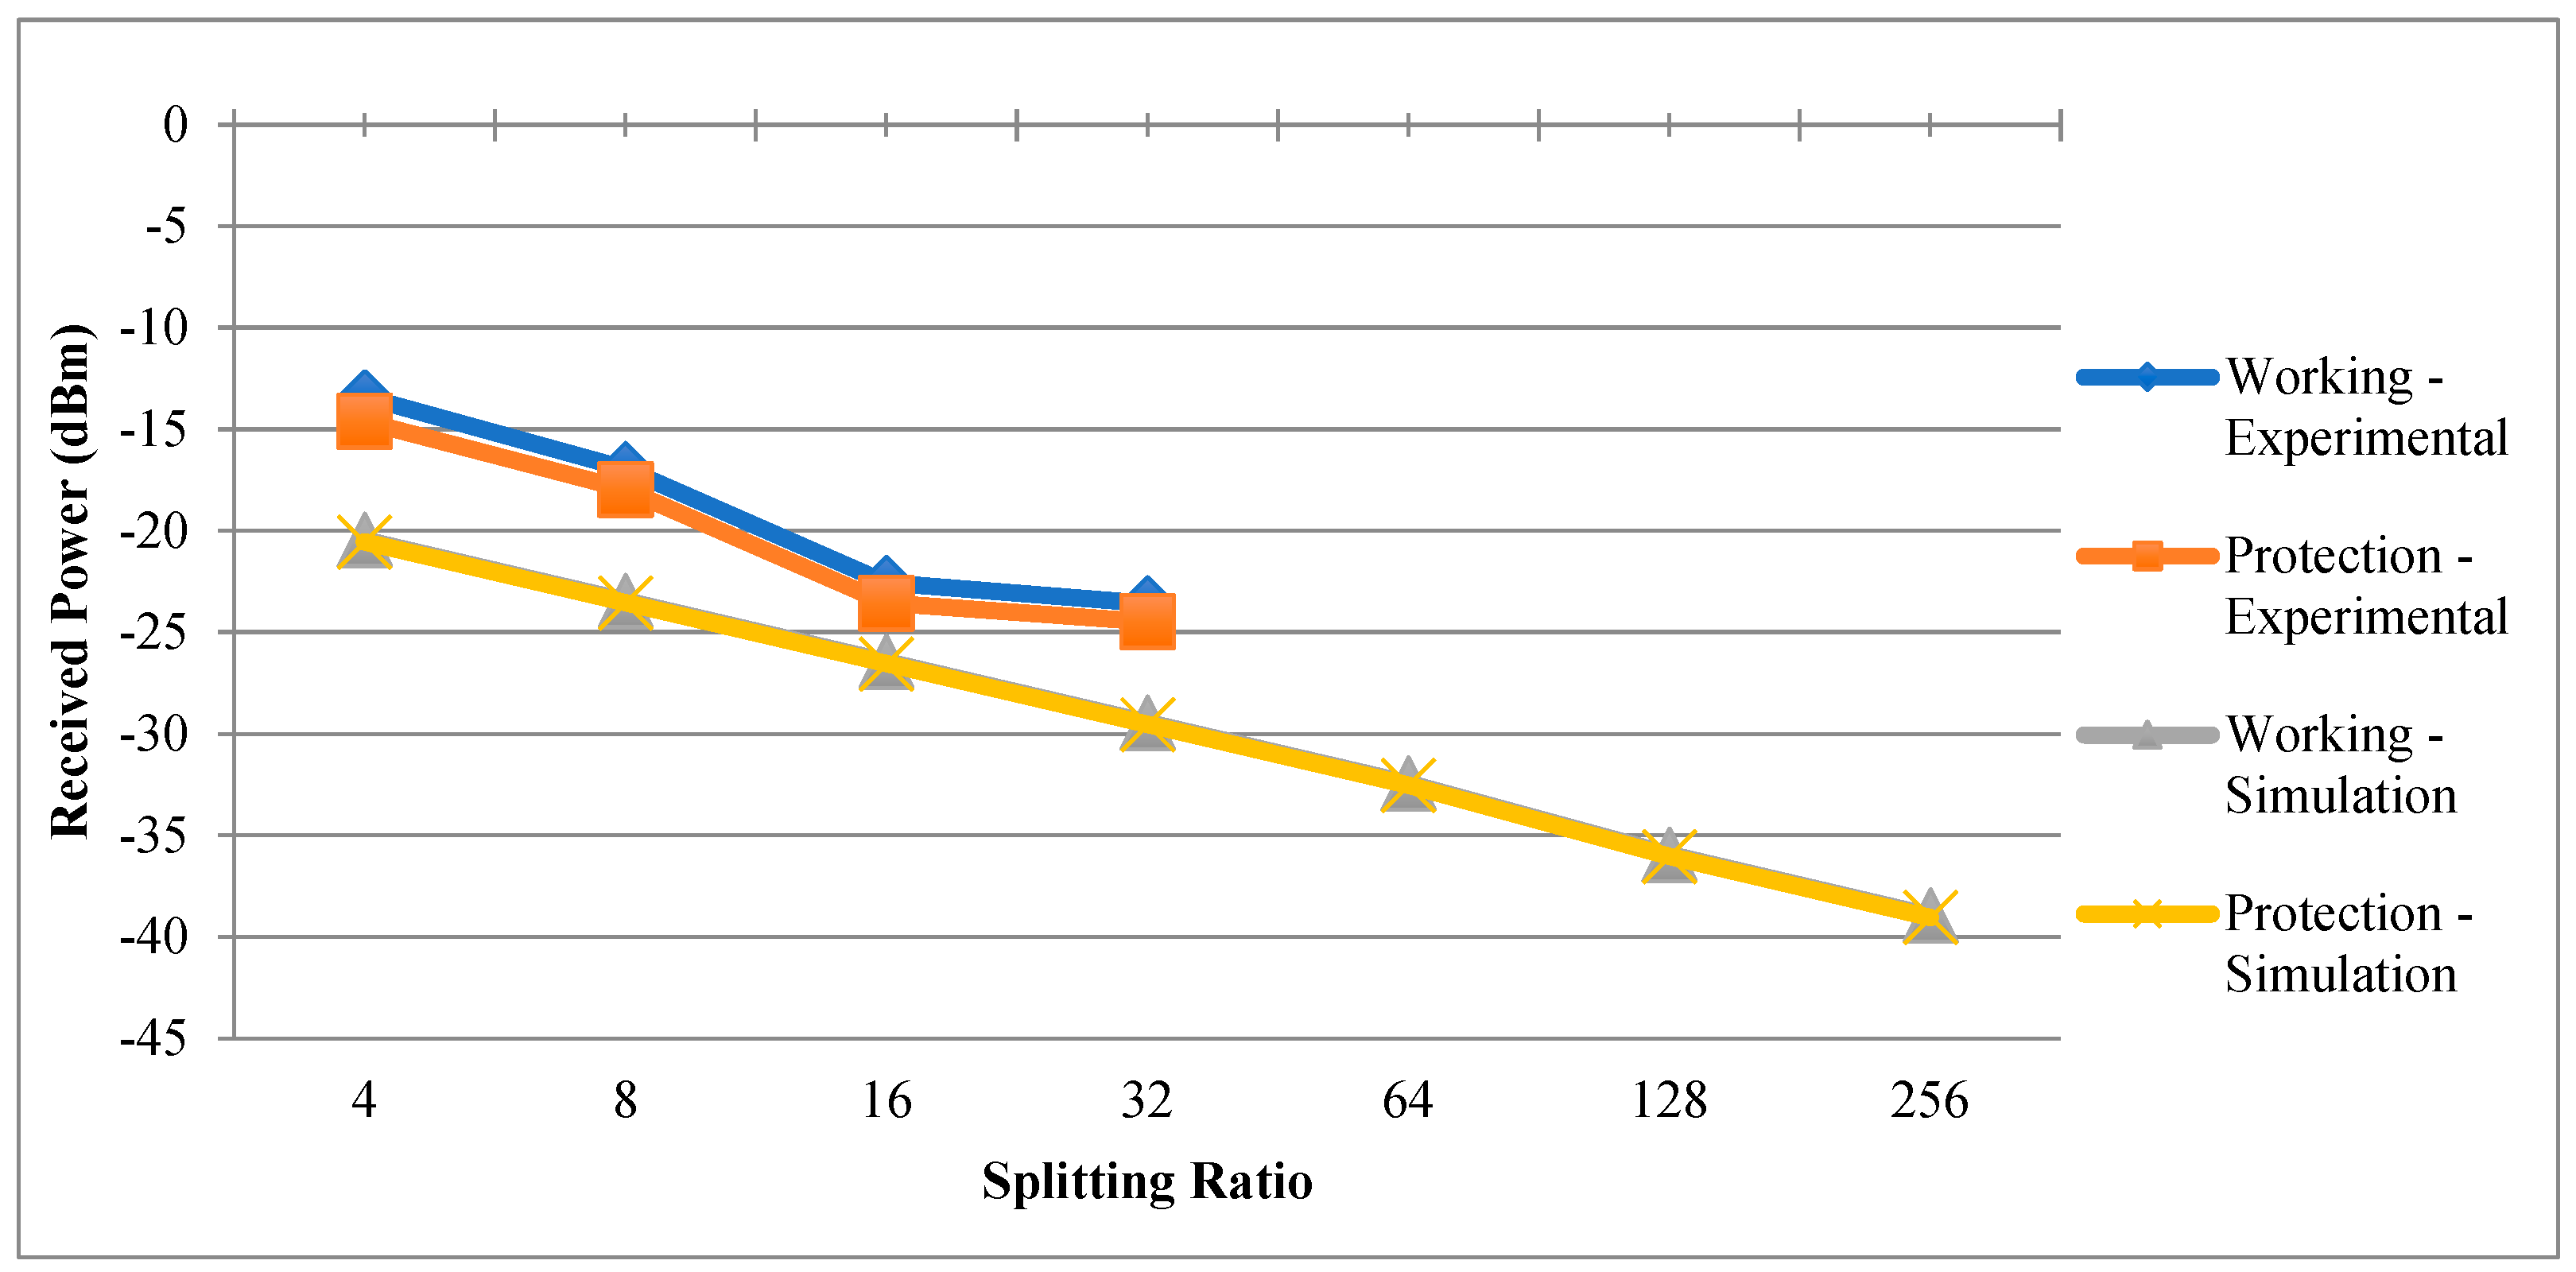
Figure 19 shows the experimental and simulation result by varying the splitting ratio. Due to component limitation, the values of optical splitters for experimental exercise were 1 × 2, 1 × 4, 1 × 8, 1 × 16 and 1 × 32 only.
Compared with the variation in the distance between the OLT and the ONU above, the rate of the received power dropped more in this exercise. This was due to the higher loss value introduced by each splitter type. Typically, there will be 3 dB reductions in the received power for every multiplier of two splits, as depicted in the simulation results in
Figure 19.
Referring to this result, the received power was slightly lower than the experimental value because of the configured transmit power and a higher loss value defined in the passive components of the simulation architecture design. However, both exercises yielded the same line pattern as the split or number of users increased.
Obviously, the system encountered a problem for more than 32 splits, since the received optical power was less than the standard PON value. Based on the actual experiment procedure for the working and protection links, it is still acceptable to operate at 32 splits with PROMO in the FTTH system. The degradation of received optical power signal was due to the loss introduced by the fusion splices, adaptors and other related passive components within the network, including the optical the optical splitter used. The simulation results for both the working and protection links showed that the number of splits could be extended up to 64, depending on the receiver and its sensitivity [
31].
As can be seen in
Figure 17 and
Figure 19, the difference value in the received optical power between the working and protection links was very small, at less than 1 dB. The similar link and component configurations for the both experimental and simulation setups contributed to this.
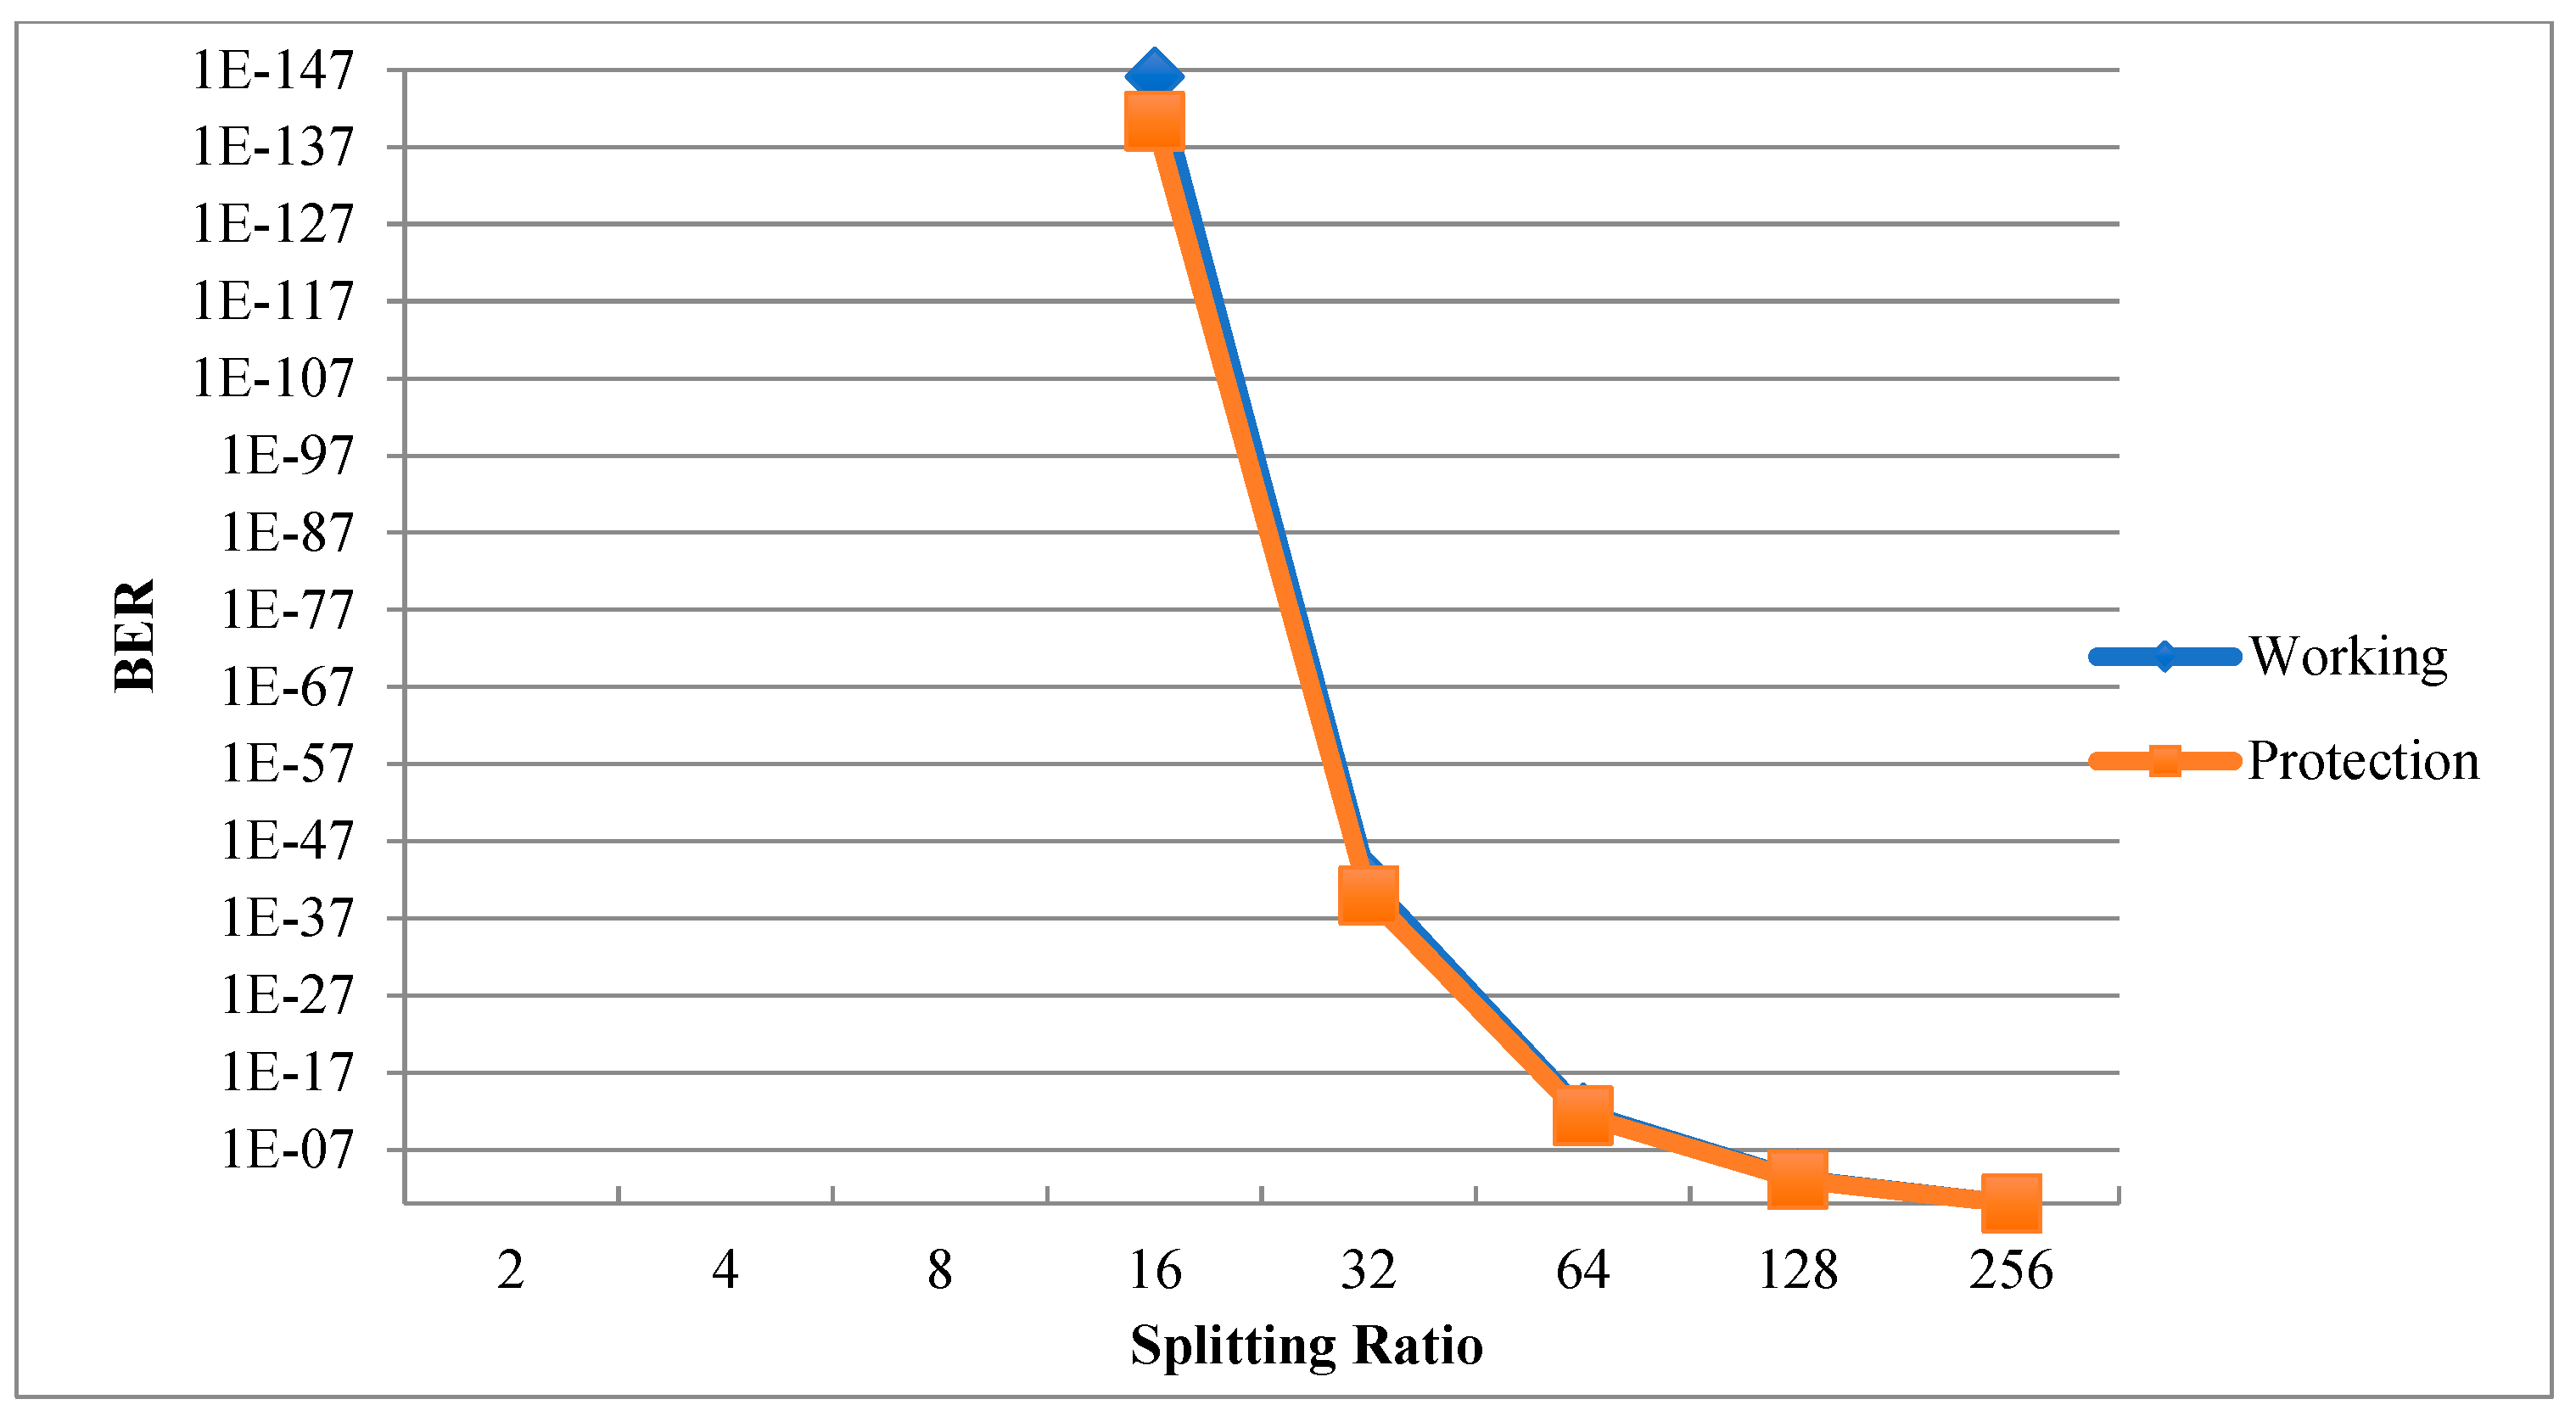
The performance of this configuration was also supported by the maximum Q and BER value in
Figure 20 and
Figure 21. The Q value decreased drastically for each of the splitter types. With 16 splits, the maximum Q was only within 25, and for 32 splits the value was 13. This became worse as the number of splits increased. Comparing this pattern with the variation in the distance in
Figure 18, the variation in the number of splits caused a greater reduction in the Q value. This also shows that increasing the optical splitter had more effect than the distance between the OLT and ONU.
Meanwhile, the BER value also decreased beyond 16 splits and reached the highest value with 256 splits, i.e., BER = 1. The recommended criterion for the digital optical receiver should be less than 10
−9 or Q approximately equal to 6 [
21]; hence, by referring to
Figure 20 and
Figure 21, the maximum number of splits from this simulation that fell within this range was 64.
As far as scalability is concerned, the number of splits could be extended to more than 64 by modifying connectivity, using low loss components, or using a higher sensitivity transceiver, for example, a Class C transceiver with a 30 dB power budget. Referring to the simulation result above, for 128 splits, the received optical power was approximately −36 dBm. Hence, by using a low-loss optical switch and fusion splicing method for the optical connection between the components, the loss could be reduced to an acceptable working value. Consequently, this improved the received optical power as well as the Q value.
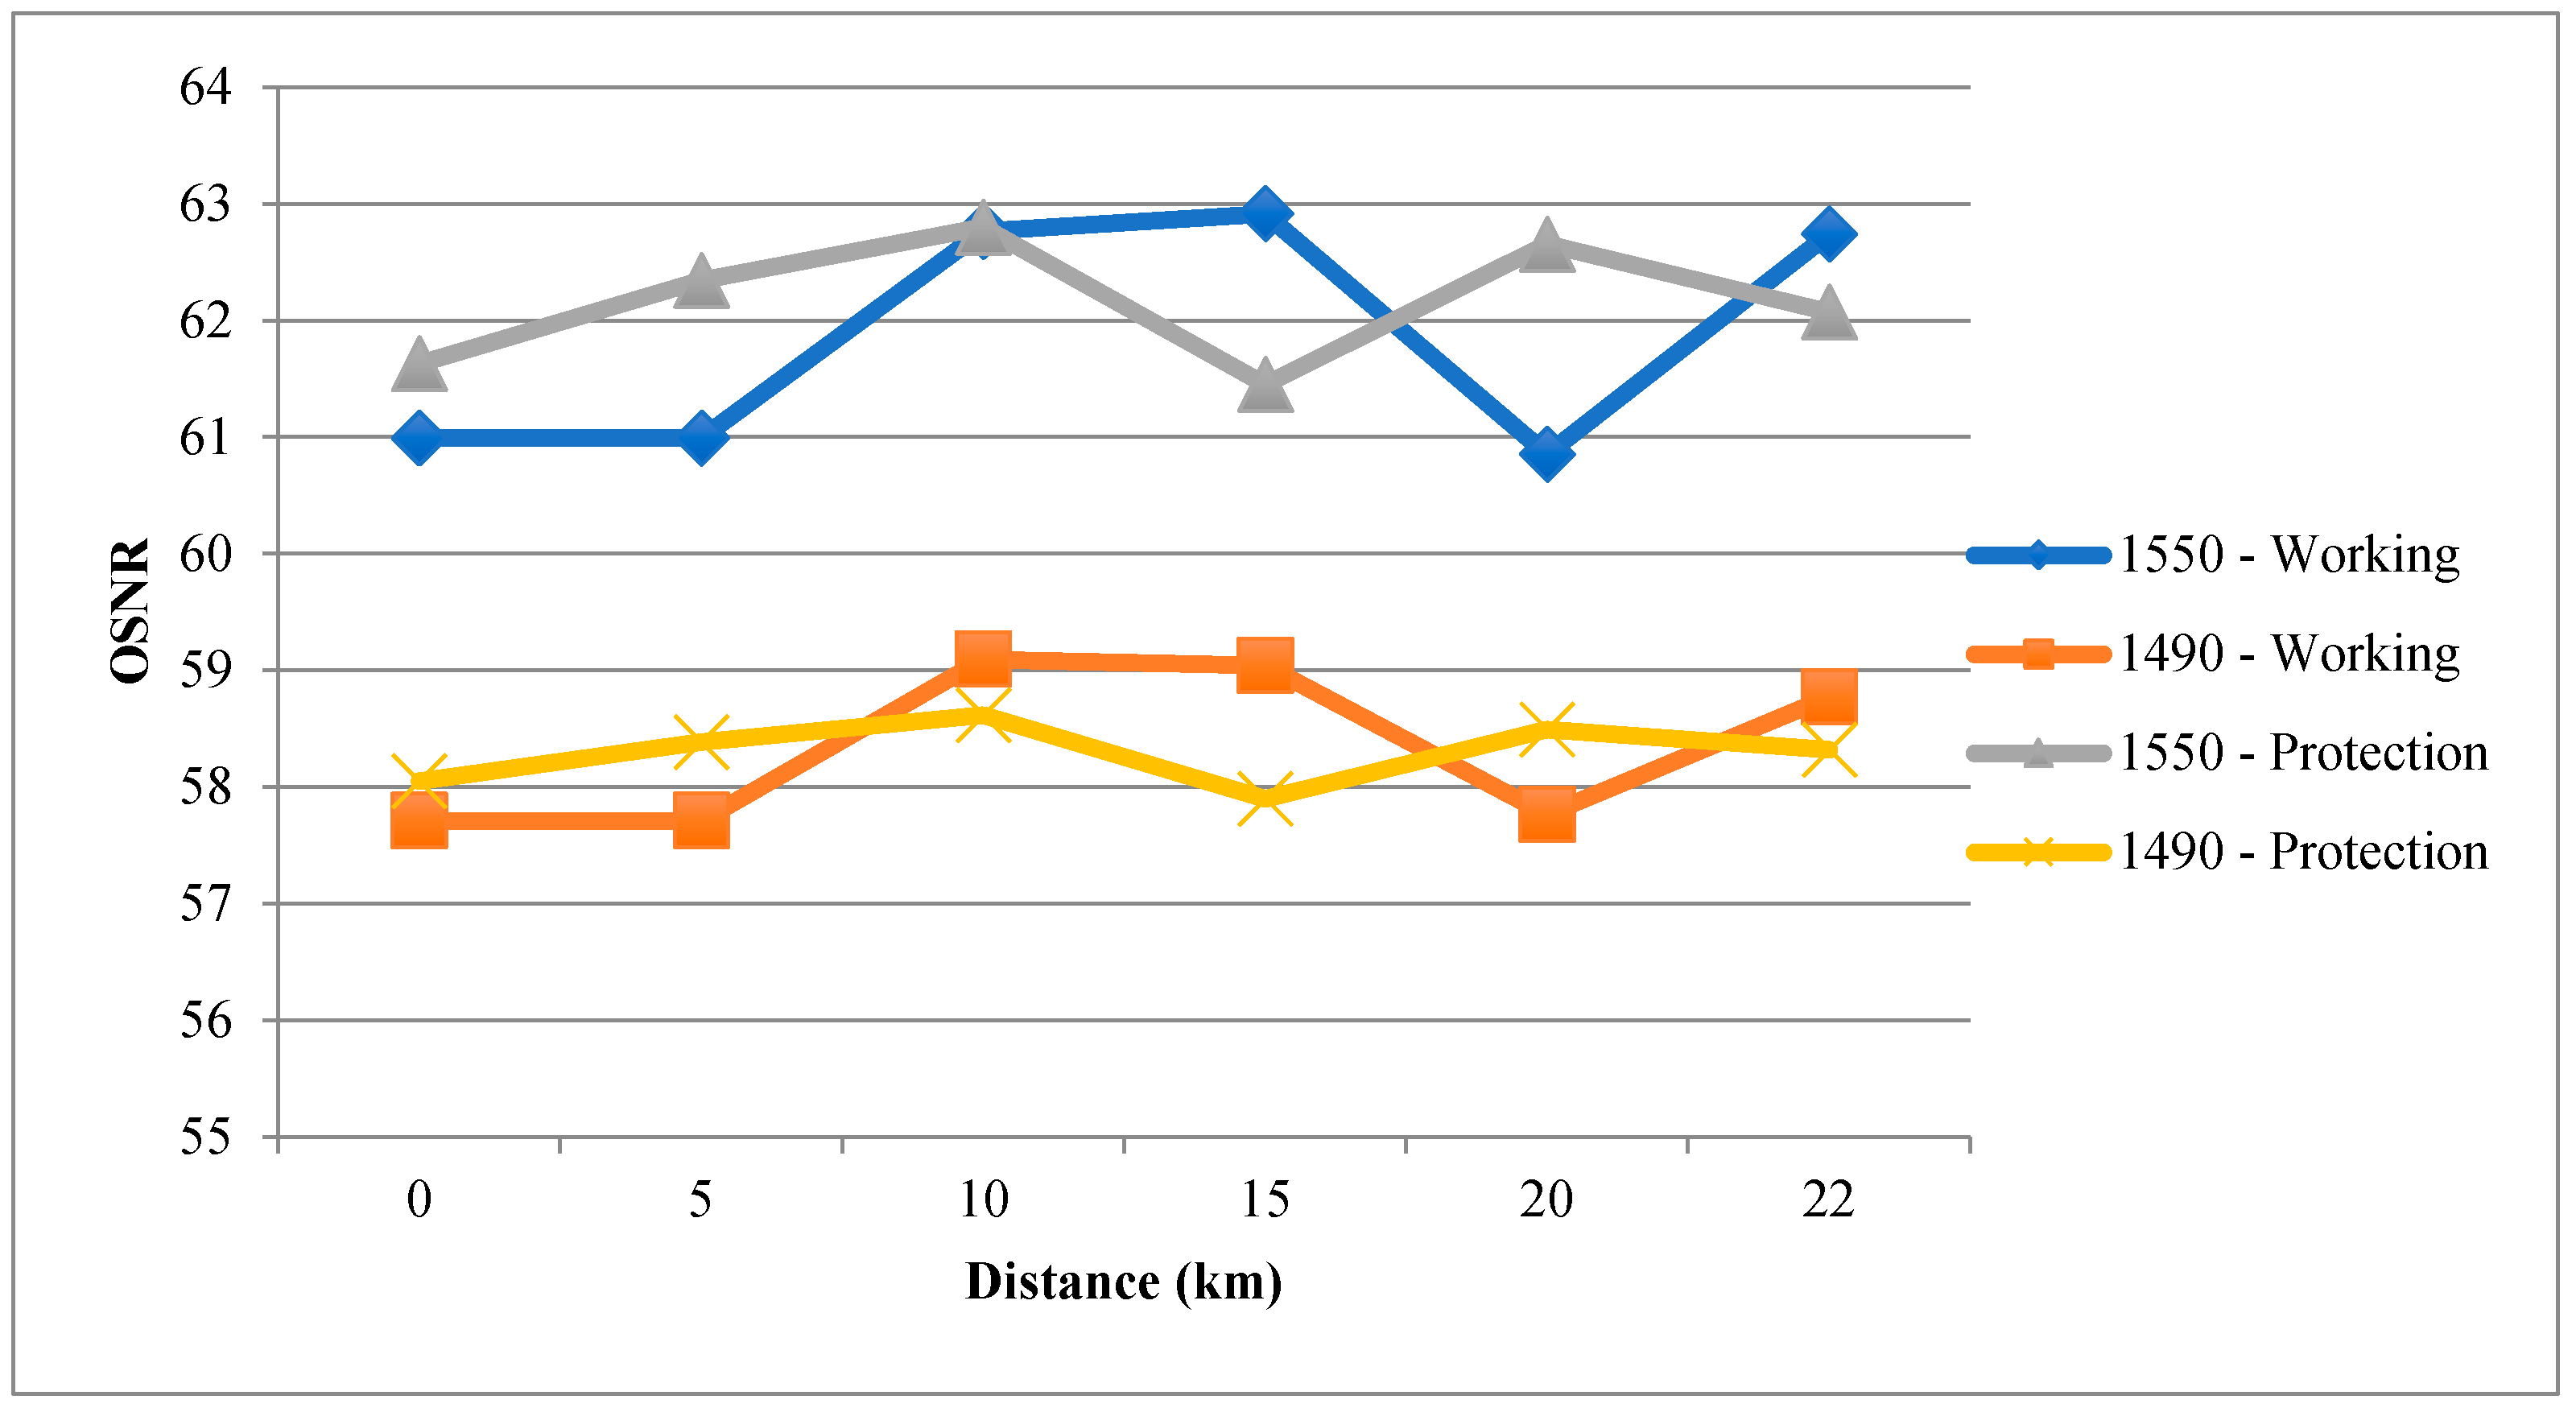
After that, with the same configuration, the OSNR readings of the working and protection links were also recorded. Two downstream laser signals were transmitted from the OLT side and the measurement was performed at the output port of the PROMO module.
Figure 22 shows that the variation in length between the OLT and ONU did not have any significant effect on the downstream signal. The different levels of both the 1550 nm and 1490 nm signals were caused by a different transmission power from the source. On average, 1550 nm had an OSNR of 62, while 1490 nm was recorded at approximately 58.5 across the varied lengths. Focusing on the result of each pair, this shows that there were variations in the OSNR result values as the length increased. This was caused by the usage of different types of fiber optic cable spools and their connectors or cable adaptors.
At this point, it can be stated that the proposed scheme is able to operate in the FTTH network within the standard range and with 64 as the maximum number of splits. Hence, this indicates that it is possible to implement the PROMO module without severely affecting the downstream signal quality in the FTTH system.
7.2. Simulation and Experimental Results—‘Zig-Zag’ Scheme (Special Case)
Next, the developed module was tested in the previously developed protection and restoration scheme. As described in the previous section, this scheme could provide sharing the neighbor’s protection link as an alternative communication link for the OLT and respective ONU. The objective of this activity was to observe and analyze the capability of the developed module in another environment. A simulation and experimental exercise were performed with the PROMO module in the FTTH system utilizing this scheme. The first task analyzed the effect of varying the distance of the OLT and the ONU. The result also showed each protection level performance based on the received optical power at the ONU. The result started from 0 km or back-to-back (B2B) connection and extended until 20 km, and was repeated for each type of protection level. In this simulation exercise, the effect of varying the splitting ratio was also studied. The result from this task will provide an indication of the maximum number of subscribers that the solution could handle. With fixed fiber optic cable length, the number of splits from the optical splitter increased accordingly. The next task was to capture the experimental result for the ‘zig-zag’ scheme and to compare this with the obtained simulation result.
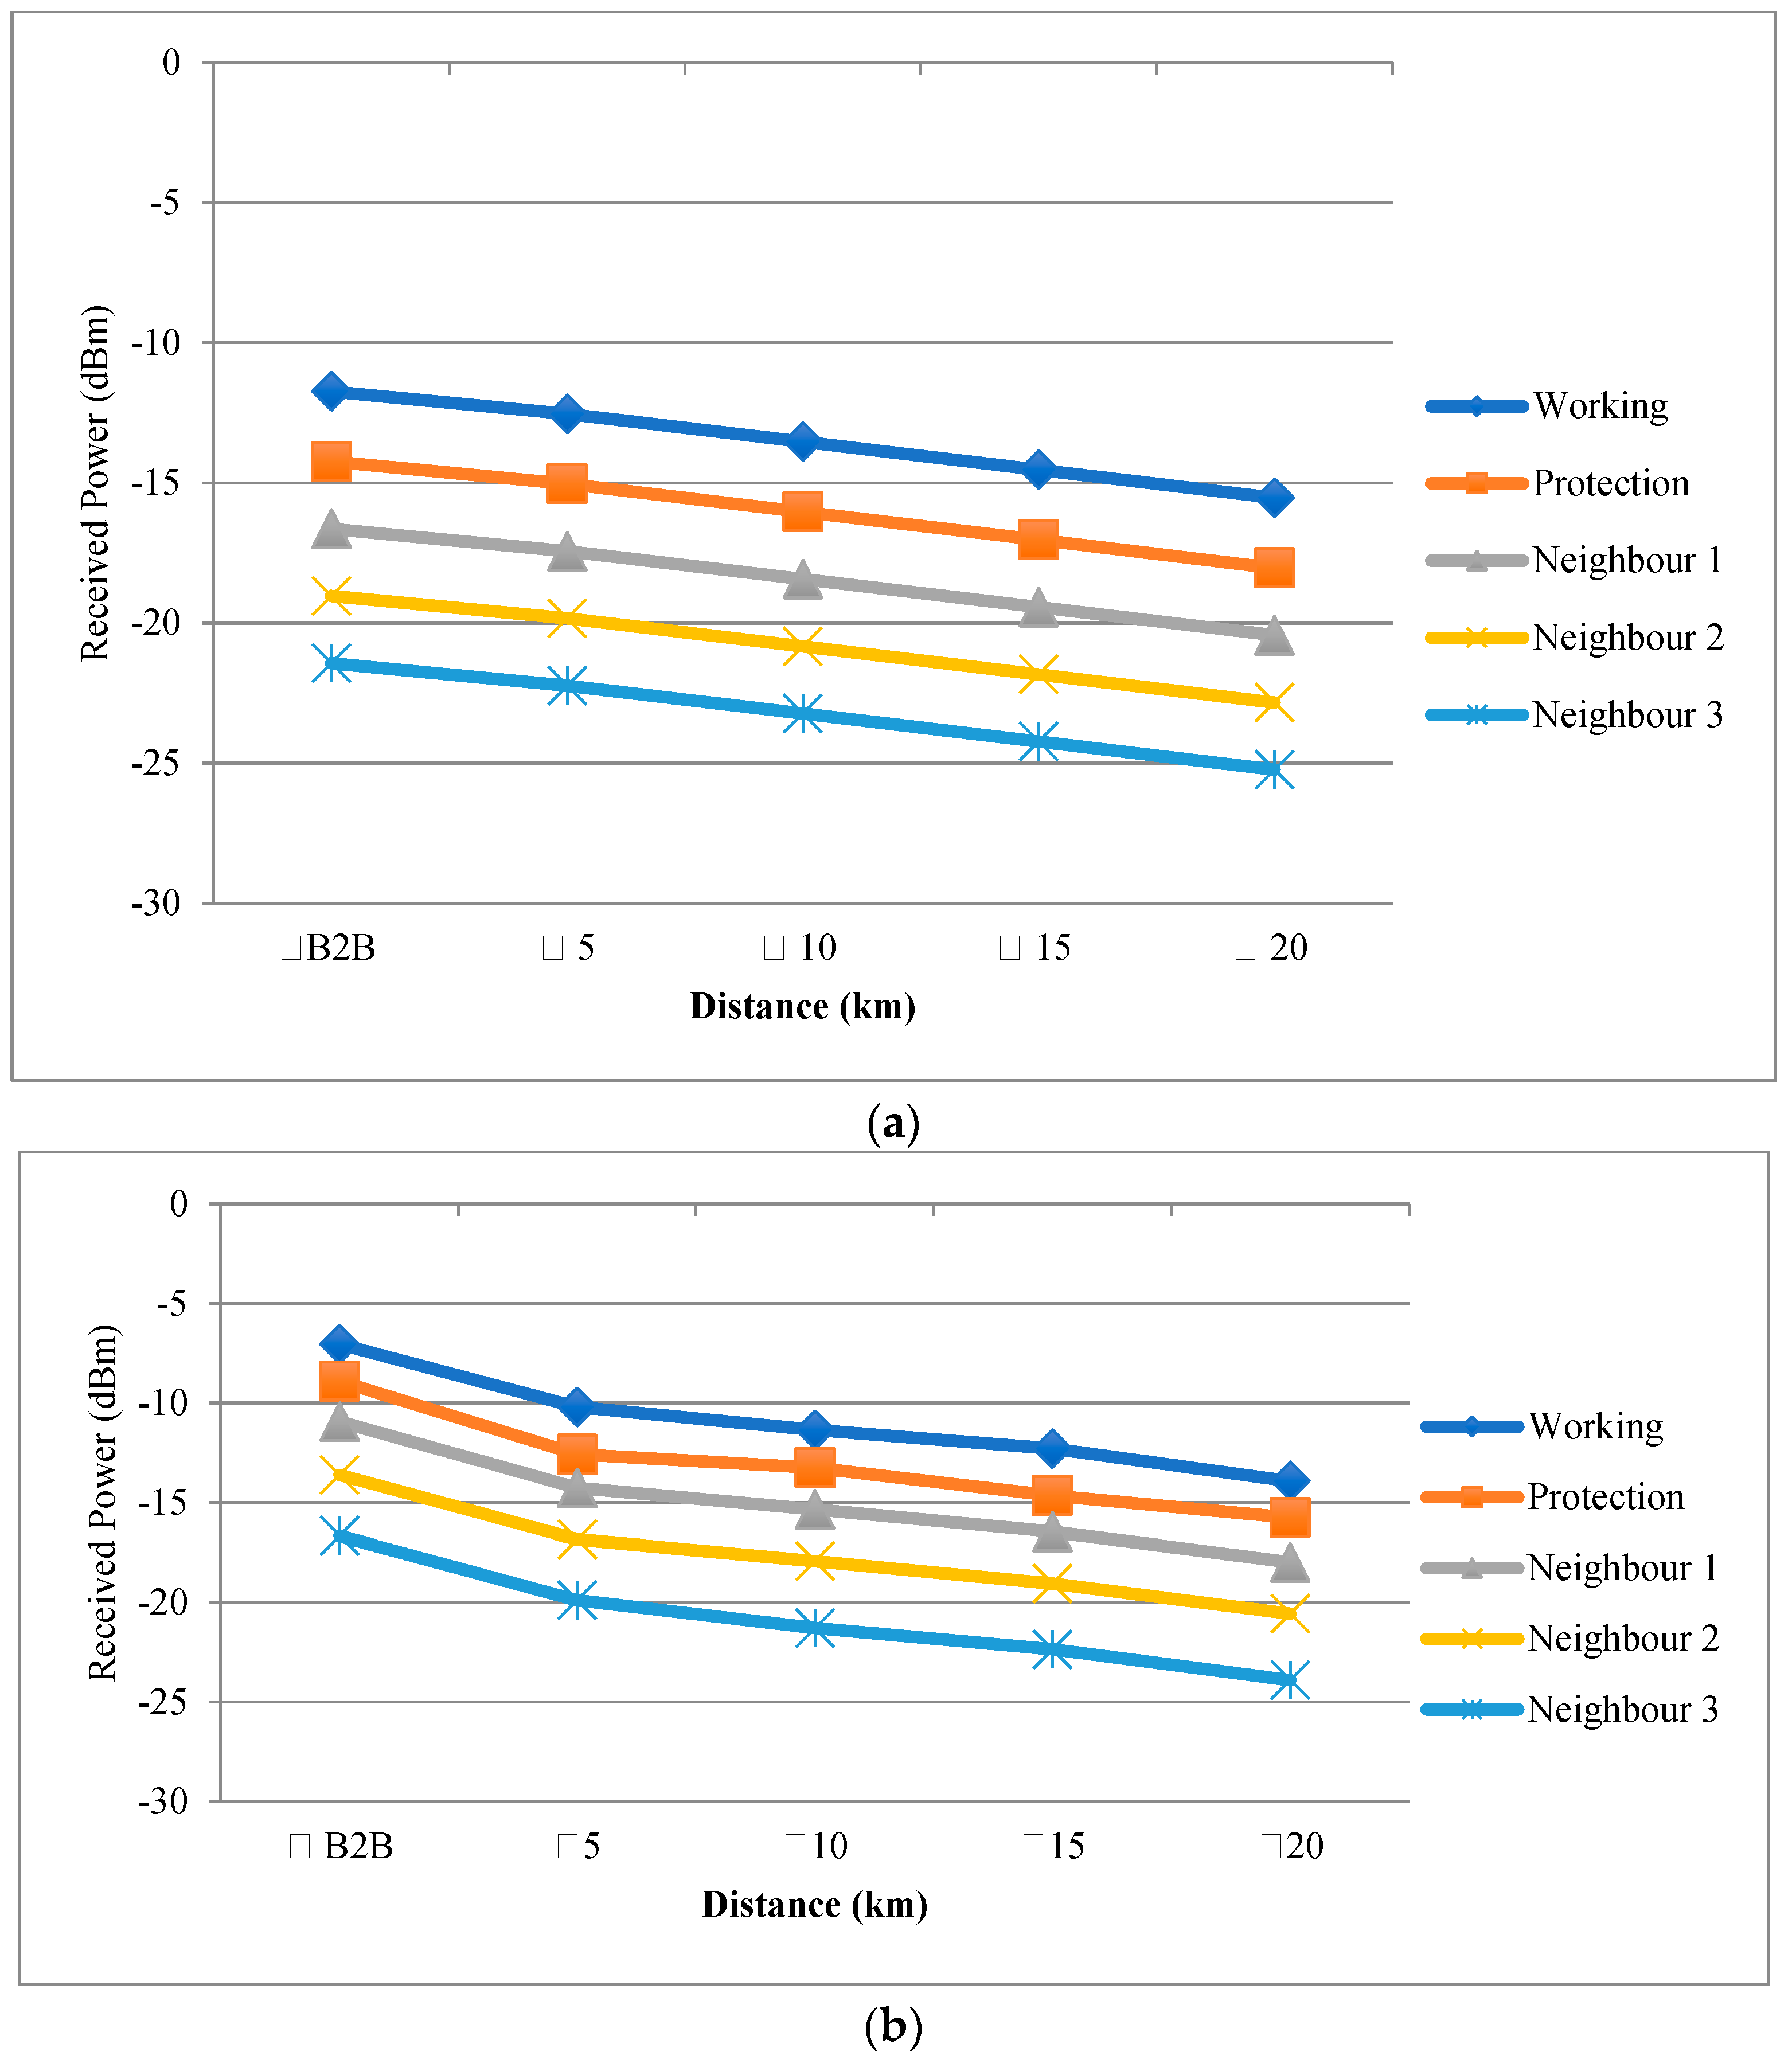
Figure 23a,b show the results of the received power by varying the distance between the OLT and the ONU.
Figure 23a is the result of the simulation exercise, while
Figure 23b depicts the experimental activity. Each line represents the level of the link being used with the specified lengths.
As with the previous scheme, the received power decreased gradually as the length increased. The same result pattern was obtained for the experimental work as we moved down from the working to the last shared neighbor’s protection link. The result in the experiment was not totally linear because of the passive components used, for example, the adaptors, connectors, and the fiber optic cable spool itself. Nevertheless, both results showed the same behavior and the margin between each line contributed to the number of optical switches that the signal had to travel through as we moved from the working to the last neighbor’s protection link. Comparing the simulation and experimental results, the received optical power in the simulation was lower by 4 dBm than the experimental result. Apparently, this was due to the transmission signal power level being configured in the simulation software. However, this did not have any major effect on the analysis because it showed the same characteristic and pattern as in the experimental result.
In addition to the received power level above, the simulation process also provided the maximum Q level to indicate the performance of each links by varying the length. From the values, generally, the introduction of the PROMO module in the FTTH system with the ‘zig-zag’ scheme did not cause any major effect to the signal or to the link performance.
As shown in
Figure 24, the highest value recorded was with the working link at a 1 km distance with the maximum Q equaling 380.625, while the lowest was with the last neighbor sharing protection link at a 20 km distance, with 32.85 as the maximum Q reading.
Comparing this pattern with the previous scheme shows that increasing the protection link level through the optical switch caused a drastic Q value reduction.
The results showed that the Q value decreased as the length and protection level increased. However, as stated, the recorded value was still within the acceptable working range for optical communication.
After that, the number of splitting ratios was also tested with a similar step to the previous scheme. The received optical power result is represented in
Figure 25a for the simulation exercise and
Figure 25b for the actual experimental activity.
As expected, the received optical power decreased as the number of splits increased. The simulation results showed that as the splitting doubled, the received optical power dropped approximately 3 dB. This was consistent as we moved from the working to the last level of the shared neighbor’s protection link. Comparing between the two graphs, the received power level was slightly different due to the different launch power from the OLT in the experimental exercise. Nevertheless, this was only a relative affect since both scenarios provided similar behaviors and patterns.
Additionally, this result shows that the number of splits will affect the sharing of neighboring protection link level depending on the sensitivity of the receiver used. For example, referring to the simulation result of 16 splits, if a receiver with −25 dBm sensitivity level is used, only the working and protection link level can be utilized. This was relatively similar for the experimental result, but could be extended to the second neighbor sharing level. Then,
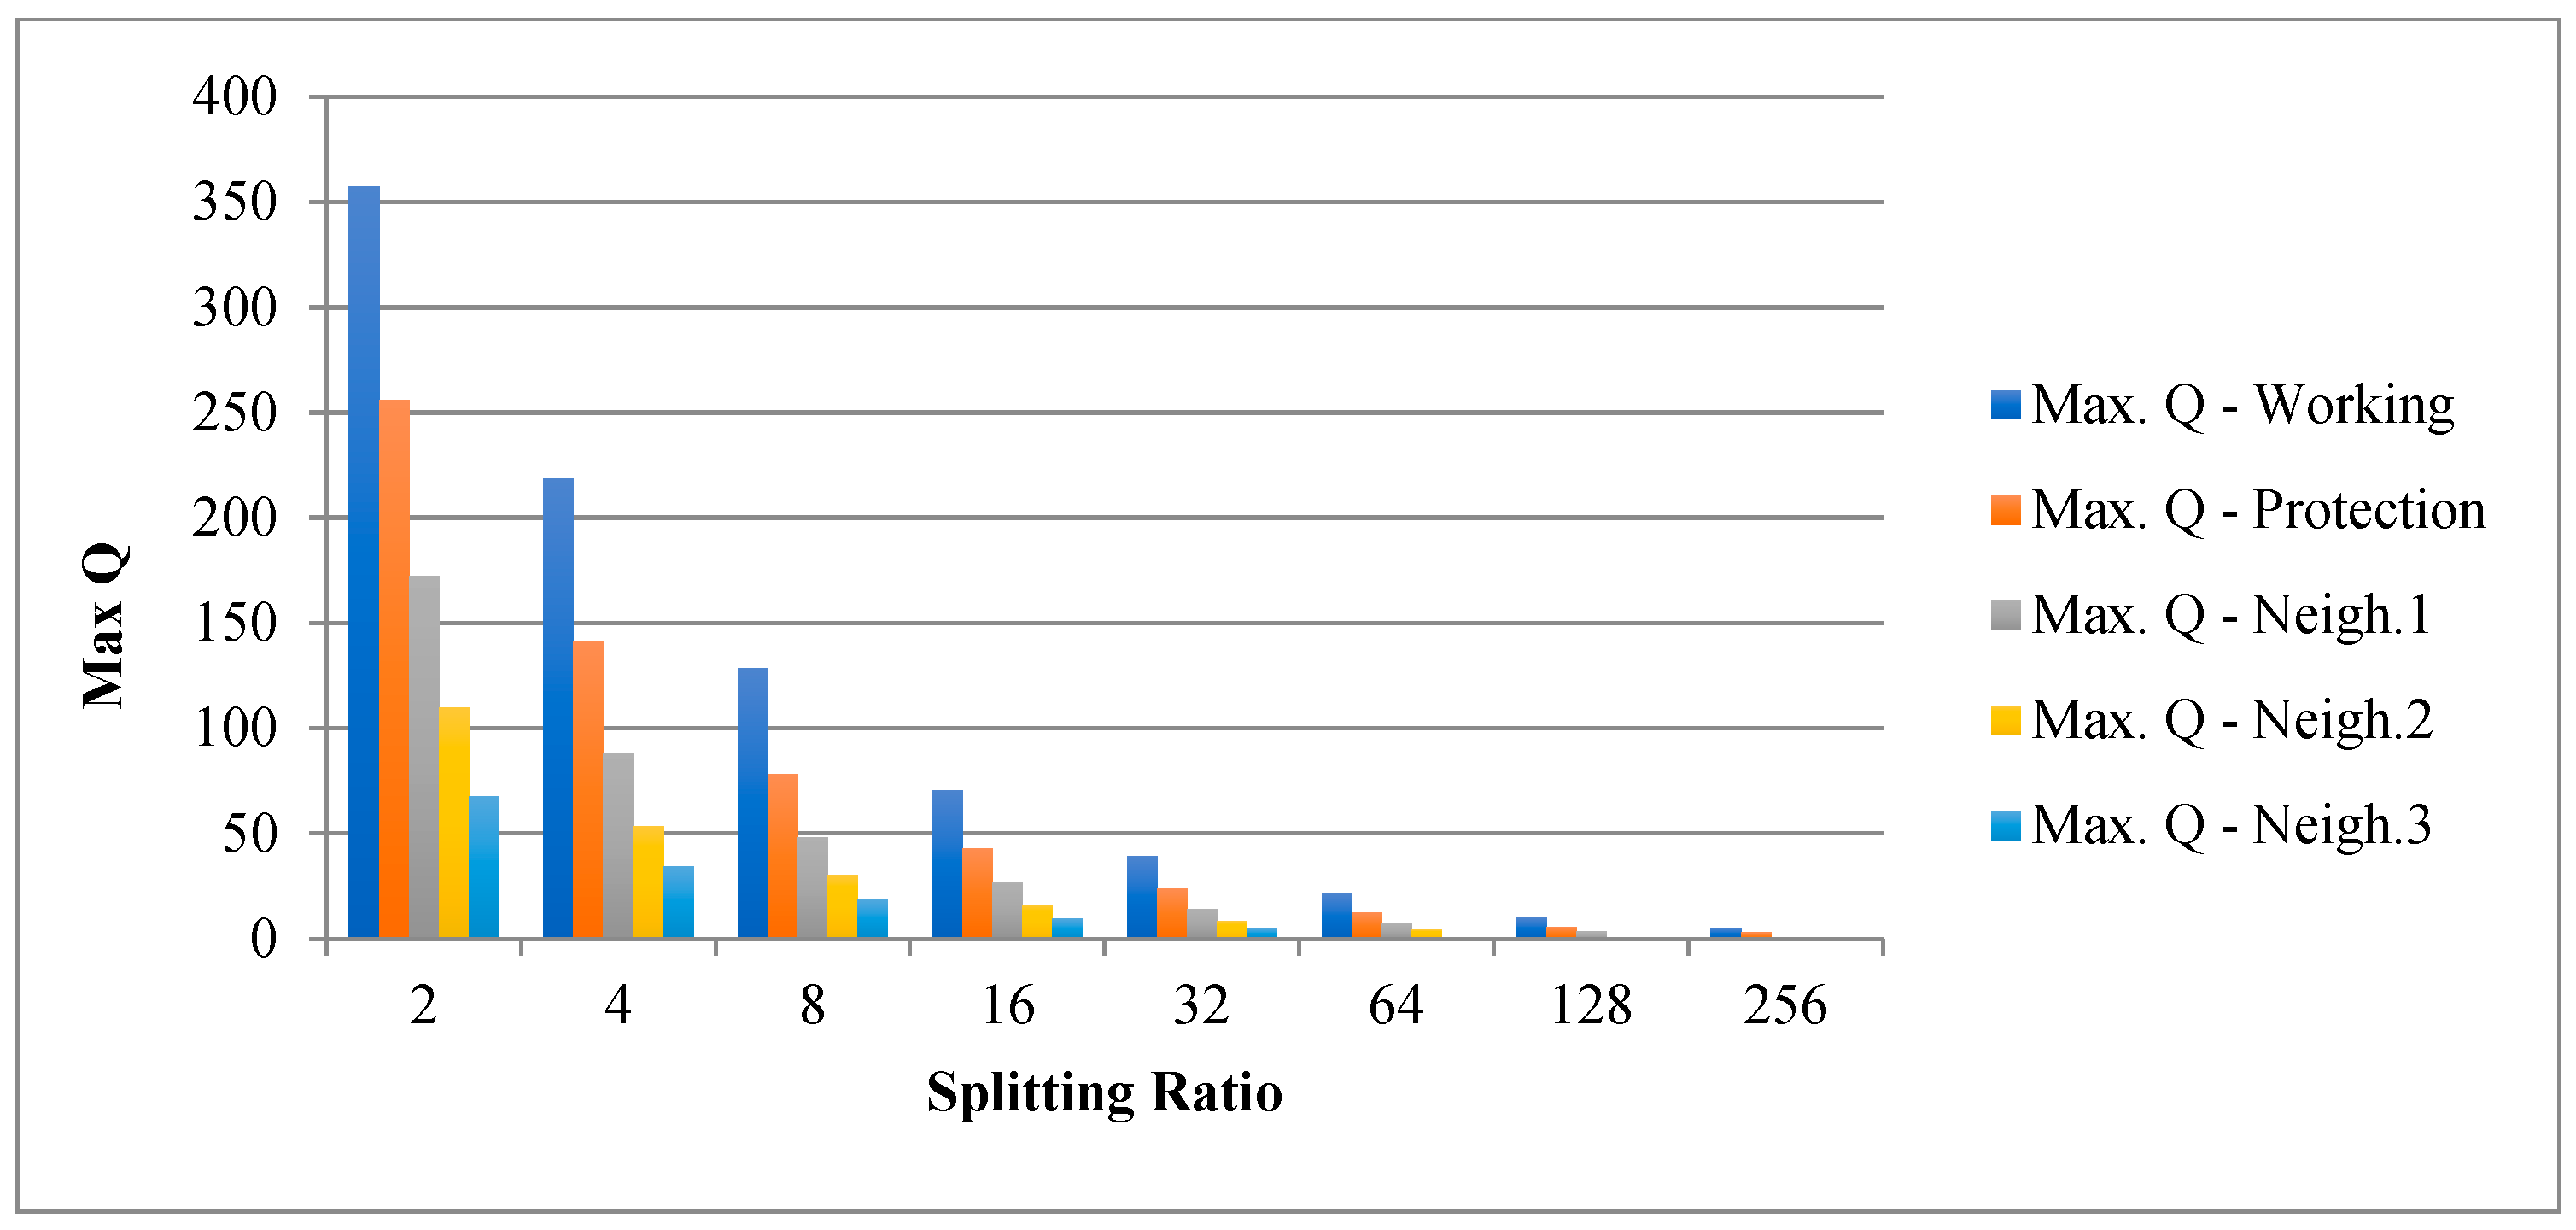
Figure 26 shows the simulation result for the maximum Q factor recorded by varying the splitting ratio. This result clearly shows that, in this scheme, increasing the number of users will rapidly decrease the Q value.
For all four levels of protection to be utilized successfully, the maximum split that can be implemented is 16. The minimum value for 16 splits is 9.56 with the sharing of the third neighbor’s protection link, while for 32 splits this is 4.89. This is calculated by referring to the practical Q value of 6 for an acceptable digital communication. There should not be any problem for a split ratio less than 16.
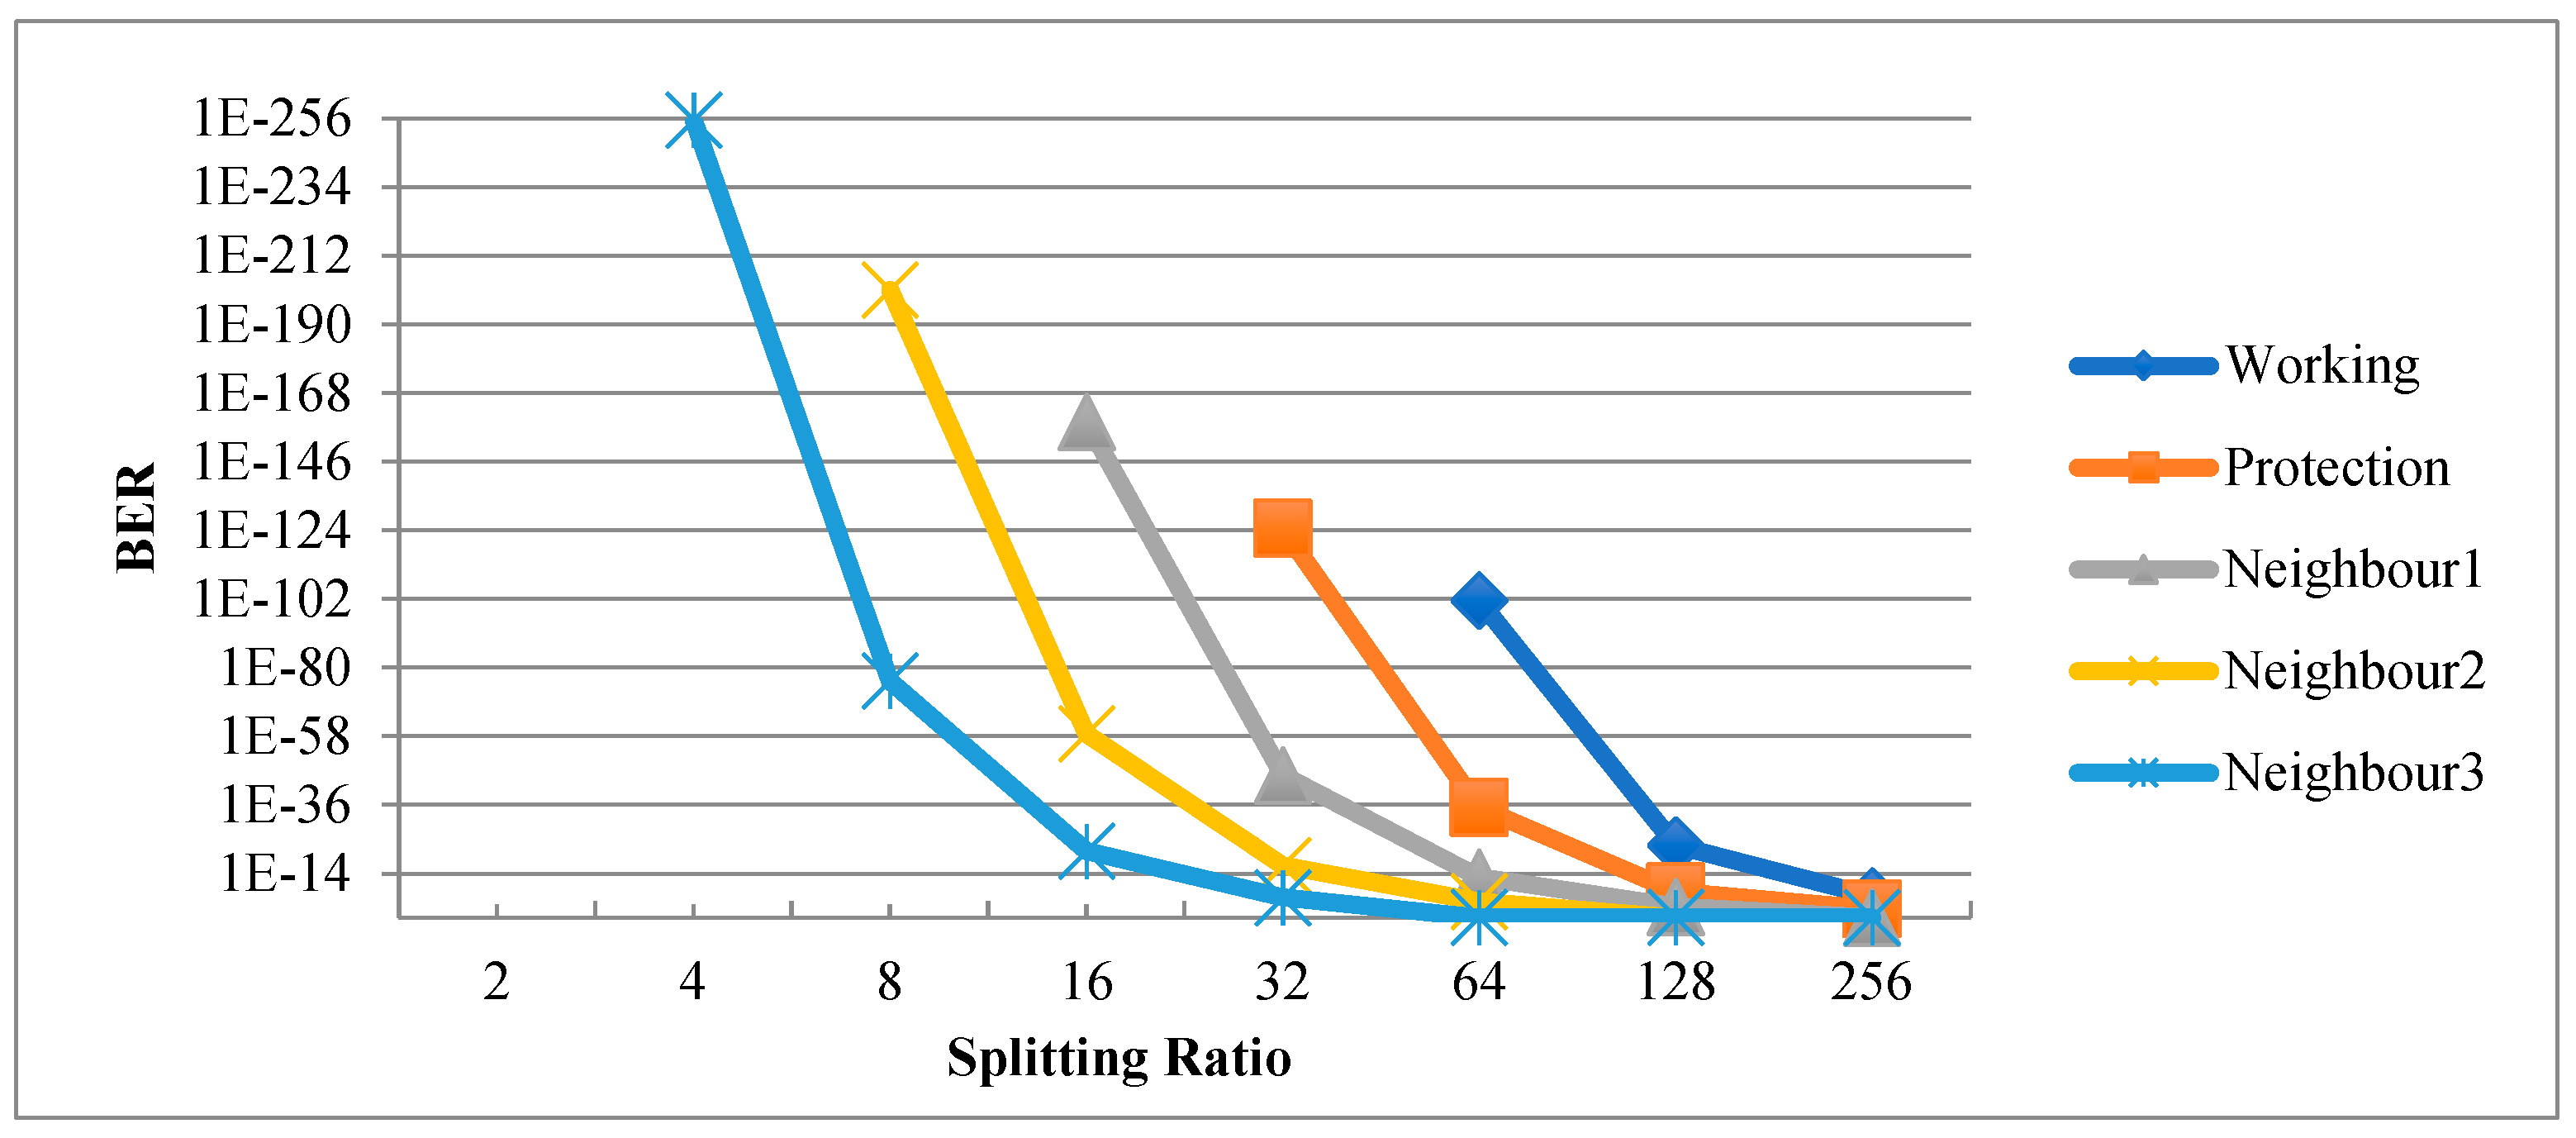
Finally, for this ‘zig-zag’ scheme test, the BER reading value of different splitting ratios from the simulation activity is drawn as in
Figure 27. This result indicates that as the sharing level is increased, the BER will decrease accordingly as represented by the left most curve in the graph. Here, the working link provides the best BER reading, and theoretically could be extended up to 128 users. A protection link with a minimum BER value of 10
−9 can be obtained with 128 splits. This is followed by the first sharing of neighboring protection link with 64 splits (10
−13), the second neighboring protection link with 32 splits (10
−17), and last but not least the third neighboring protection link with 16 splits (10
−22).
Considering all of the results for this scheme, it can be derived that the split ratio is an important variable value in planning the number of sharing levels in a distribution segment. Hence, to operate at a maximum distance, the maximum number of splits should be 8 in order to utilize the proposed four levels of sharing protection links.
8. Economical Aspect and Impact
The modern world is becoming progressively more reliant on advanced telecommunications technologies that provide increased bandwidth capabilities FTTH is a future-proof solution that is definitely able to reduce the capacity bottleneck in the access network. However, FTTH network suffers from its installation cost, mainly dominated by digging or trenching costs. Reducing of digging cost can significantly improve FTTH rollout. Combining digging works with planned road works, using existing duct with micro-pipes are good alternative to limit the digging cost [
35]. Despite the recent explosion of interest in FTTH infrastructures in both the academic and professional realms and the anecdotal rhetoric regarding the positive impact of such advanced telecommunications technologies on economic development, there are a lack of empirical studies on this emerging phenomenon and its potential effects. Monitoring is vital to ensure that operation is executed effectively and with QoS assurance. Monitoring also minimizes the risk of failure and prevents revenue loss due to damage especially when the size of the network become bigger (huge FTTH). The proposed monitoring system offered in this report is an economical solution for network health monitoring with high accuracy without using OTDR. This is the best solution offered to monitor multiple lines in an optical communication network particularly the huge customer access network. In choosing the best solution, several parameters should be considered which are economical, technical performance and complexity. PROMO is one of the alternatives the service provider can choose for.
9. Conclusions
The FTTH system is an effective solution for the access network segment that has the capability to deliver high-speed broadband services to customers. As an initiative to meet the SLA and ensure network robustness, protection and restoration techniques and schemes have been proposed and demonstrated. This paper describes a method for a protection and restoration function utilizing the downstream photo detection method and the optical switching mechanism, otherwise known as the PROMO module. Based on the results, this module is compatible with the FTTH network and its system operation. There will be an acceptable value of insertion loss introduced by installing the module in the distribution segment. However, as far as operation is concerned, it is transparent for communication with E/GPON systems because it only deals with optical signal diversion without affecting modulated data. In addition, the proposed design is also flexible to be used with other protection and restoration schemes when appropriate modifications are performed. This has been shown in the experimental exercise for the ‘zig-zag’ scheme. Since the implementation is in the distribution segment, the splitting ratio is an important value to look after during planning and prior to the installation of the given module. Neither scheme has an operation problem within the standard distance of the FTTH system. Finally, this initiative could contribute to the operational excellence aspect of FTTH networks and systems with the simple yet practical deployment method of the protection and restoration module.

